Powered Two Wheelers in a changing world - Challenges and Opportunities
N. Haworth
Corresponding author: Professor Narelle Haworth Centre for Accident Research and Road Safety-Queensland Queensland University of Technology K Block, 130 Victoria Park Road Kelvin Grove Qld 4059 Australia Phone: 61 7 3138 8417 Fax: 61 7 3138 0111 Email: [email protected] Research highlights
Most PTWs are in Asia but most of the research comes from Europe and North America
The safety challenges and mobility opportunities vary greatly across the world Better PTW usage information is needed to assess safety and mobility effects PTW use will continue to grow and evolve
2
ABSTRACT
Powered two wheelers (PTWs) come in diverse forms and are used for a range of
purposes in very different parts of the world. In many parts of the world, the forms
and uses of PTWs are changing, influenced by social, economic and demographic
changes. Most of the challenges associated with PTWs relate to safety, while the
majority of the opportunities relate to mobility. The challenges for improving safety
relate to the PTW user, other road users, the road environment, the vehicle, data and
research, and socio-political dimensions. The relative importance of particular
challenges varies between developed and developing countries, and among
developing countries according to whether PTWs are largely used for recreation or for
transport. PTWs present a range of psychological, transport, economic and
environmental opportunities to individuals and societies. The fun and excitement of
riding PTWs is a major motivator for their purchase and use for recreational purposes,
both off-road and on-road. The transport and economic advantages to the individual
also need to be considered. At a societal level, research has examined the potential
for increasing PTW volumes to reduce fossil fuel use and traffic congestion in busy
cities. The future of PTWs may differ greatly between countries and environmental
and technological changes are leading to an evolution in the form of PTWs to
Powered two-wheelers (PTWs) play an important role in both transport and recreation
around the world, but at considerable social cost. It is estimated that more than
180,000 PTW users die as a result of road crashes annually, with most deaths
occurring in middle income countries (Naci, Chisholm & Baker, 2009). PTW users
are certainly vulnerable road users, with death rates as a function of distance travelled
generally found to be about 30 times greater than for car occupants (Johnston, Brooks
& Savage, 2008; National Center for Statistics and Analysis Research and
Development, 2008). The number of PTWs is increasing in many developed and
developing countries (Jamson & Chorlton, 2009; Paulozzi, Ryan, Espitia-Hardeman
& Yongli, 2007; Shankar & Varghese, 2006) and their usage is changing. This paper
sets out to describe the pattern of use of PTWs, the challenges and opportunities they
present, and to identify likely trends into the future.
1.1 Definitions and scope
The term PTW is used to refer to mopeds, scooters, and motorcycles; and commonly
includes similar three-wheeled vehicles. Mopeds and scooters are PTWs of ‘step-
through’ design, usually with automatic transmission, while motorcycles must
generally be straddled by the rider and have manual transmissions. The use of
mopeds is generally restricted to low speed zones in urban areas, by a combination of
legislation and rider discretion, while larger scooters are typically capable of highway
speeds and in some cases long distance touring. Many jurisdictions define mopeds in
4
terms of engine capacity (usually lower than 50 cc) and top speed (often lower than
50 km/h). There is currently no official definition of a scooter in Australia or
elsewhere (Haworth & Nielson, 2008), but a scooter is usually treated as a motorcycle
in crash and registration data.
The focus of this paper is the on-road use of PTWs, but it is acknowledged that a large
proportion of sales in many developed countries are for off-road use. For example,
motorcycles for off-road use represent more than 50% of all PTW sales in Australia
(FCAI, 2010) and 22% in the United States (Morris, 2009). Additionally, the number
of off-road injuries can be almost as great as those sustained on-road (Henley &
Harrison, 2009).
2. PTWs across the world
Most of the world’s PTWs are in Asia. Figure 1 (from www.worldmapper.org) shows
the world in terms of the numbers of PTWs in each country. The land mass of each
country has been adjusted to represent the percentage of the world’s PTWs in that
country as taken from World Bank Development Indicators 2005 (based on 2002
data). It shows clearly the importance of Asia with 65% of the world’s PTWs. The
motorcycle industry estimates that there are 313 million motorcycles in the world of
which 77% are in Asia, 5% in Latin America, and 2% in North America (Rogers,
2008). Europe and North America comprise only 16% of the world motorcycle fleet.
Within Asia, China has the most motorcycles (about 100 million), followed by India
(about 40 million), Indonesia (about 30 million) and Thailand, Vietnam and Japan
(about 15 million) (Rogers, 2008). Asian countries are also the largest producers of
5
motorcycles. In 2006, the top five PTW producing countries were China, India,
Indonesia, Japan and Taiwan. Thailand, Vietnam and Malaysia were also among the
top 10 PTW producing countries (Rogers, 2008).
INSERT FIGURE 1 ABOUT HERE
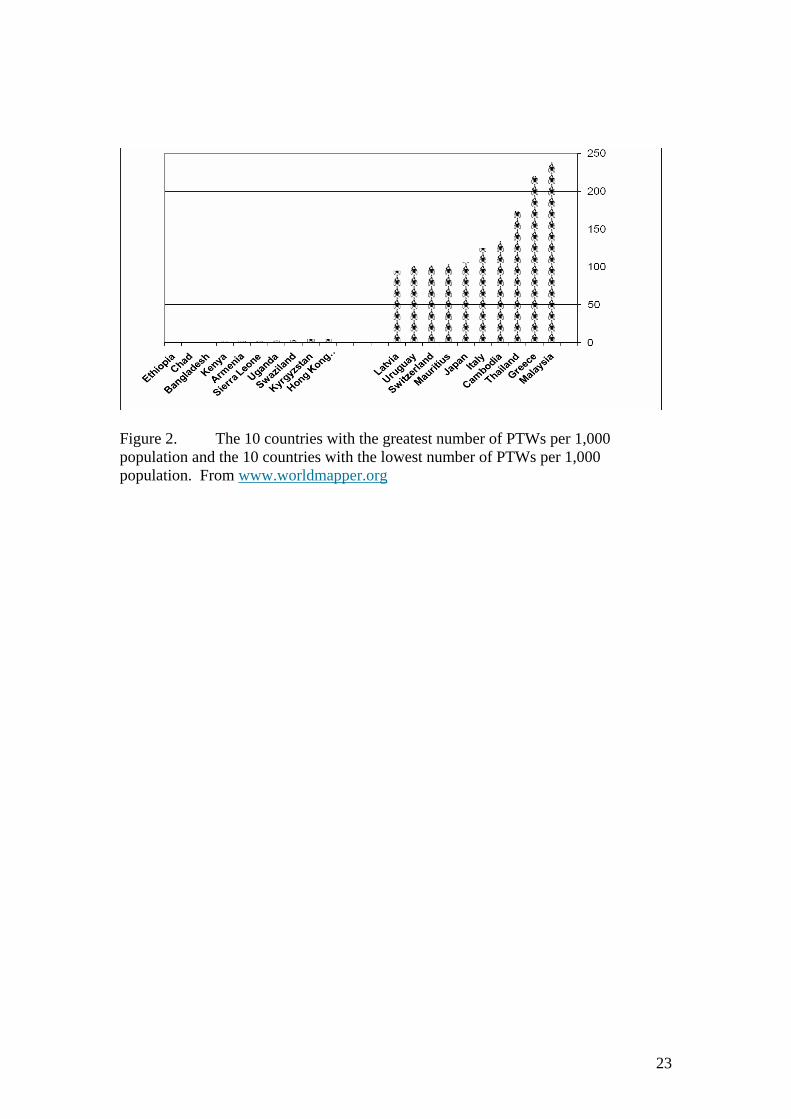
It is perhaps not surprising that most of the world’s PTWs are in Asia, given that a
very large proportion of the world’s population live there. Figure 2 shows the 10
countries with the highest numbers of PTWs per 1,000 of population and the 10
countries with the lowest numbers (from www.worldmapper.org, based on 2002
estimates of PTW numbers from World Bank Development Indicators 2005 and 2002
population estimates from UN Development Program Human Development Report
2004). Four Asian countries (Malaysia, Thailand, Cambodia and Japan) feature
among the top ten, with four European countries (Greece, Italy, Switzerland and
Latvia). Interestingly, there is a mix of high, medium and low income countries in the
top ten. In contrast, many of the countries with the fewest PTWs per thousand
population are low income countries in Africa. The relative lack of popularity of
PTWs in Africa is also evident in Figure 1.
INSERT FIGURE 2 ABOUT HERE
3. Diversity of PTW styles, uses and operating environments
Powered two wheelers (PTWs) come in diverse forms and are used for a range of
purposes in very different parts of the world. Strifelt (2008) stresses the importance of
6
recognising differences among riders, in terms of why they ride, whether or not they
belong to organised rider groups and their level of safety awareness. The types of
PTWs and their main purposes of use also differ markedly among and between
developed countries and emerging and developing countries. In large cities of some
developed countries (particularly European countries), PTWs are commonly used for
commuting, while in other developed countries (such as the US and Canada), touring
is more common than commuting. In the latter countries, many PTWs are leisure
vehicles with large engine capacities. In emerging and developing countries
motorcycles are largely used as a means of mobility and most PTWs are low and
medium engine capacity motorcycles and scooters (Rogers, 2008). Perversely, larger
motorcycles in developed countries tend to be used by single riders, while the smaller
motorcycles and scooters in developing countries frequently carry passengers and are
used with a variety of attachments for carriage, delivery, vending and passenger
transport.
Rogers (2008) noted that enjoyment was an important factor in many high-income
countries (such as United States, Canada, Australia and New Zealand) but that
employment/entrepreneurship was important in many low- and middle-income
countries (such as Indonesia, Mexico, the Philippines and Thailand). Ease of use is an
important factor in locations where significant traffic congestion exists. Economy of
purchase and use is also an important factor in many low and middle-income
countries.
4. Economic and social changes affecting PTW use
7
A range of economic and social changes is considered to have contributed to the
growth in the use of PTWs. Increases in fuel prices, traffic congestion and parking
difficulties in many cities have been identified as encouraging PTW use for urban
commuting (Blackman & Haworth, 2010; Coxon, 2002; Transport for London, 2004).
The increase in incomes and degree of motorisation in many developing countries has
led to more PTWs in these countries, often as a replacement for human-powered two-
wheelers or to supplement inadequate public transport (Sperling & Salon, 1992;
University of California, 1992).
Internationally, the number of PTWs has grown, with the largest increases in Asia.
According to industry estimates (Rogers, 2008, based on the Honda World
Motorcycle Facts & Figures 2007 and SIAM estimates), the PTW fleet increased from
20 million to about 100 million in China from 1995 to 2006. During the same period,
the PTW fleet approximately doubled in India and tripled in Indonesia. In contrast,
production has decreased in Japan and Taiwan since 1996.
There has been a large growth in motorcycling in many developed countries in the last
decade. In Australia, the number of motorcycles and scooters registered increased by
57.5% from 396,309 in 2004 to 624,090 in 2009 (ABS, 2009) - the strongest growth
of any vehicle type. Motorcycle registrations in the United States increased by 75%
from 3,826,373 in 1997 to 6,678,958 in 2006 (Morris, 2009). The growth in
motorcycling has been accompanied by a lesser increase in rider fatalities and injuries
from 224 to 239 (DITRD&LG, 2010). In the US, the number of motorcyclists killed
increased by 144% from 2,116 in 1997 to 5,154 in 2007 (Morris, 2009).
8
In addition, the profiles of types of PTWs across economies are changing. Japan has
seen motorcycles of over 250cc engine capacity increase from 13% of sales in 1978 to
20% in 1994 to 59% in 2006 (Rogers, 2008), reflecting a shift from primarily use of
motorcycles as transport to leisure use and more older riders. Congestion does not
appear to have boosted sales in Japan, where sales have been falling since 1982.
Scooter and moped sales have increased in Australia (Haworth & Nielson, 2008), with
a suggestion that this may be part of an increase in use of motorised two-wheelers for
transport (rather than recreation). With increasing fuel prices, commuting to work on
a scooter or moped may be increasingly attractive. Furthermore, with the increasing
expense and space limitations of parking in metropolitan areas, commuters may be
looking toward two wheeled transport as a means of reducing parking costs (Wigan,
2000).
There is also some evidence that motorcycle and scooter use by women is increasing.
Rogers (2008) reports that the percentage of riders in the US who were females
increased from 2% in 1990 to 10% in 2005. There have been claims of increased
numbers of female riders in Australia (MSCC, 2009) but little objective data is
available. There was a 6.9% increase in female motorcyclists hospitalised from 1999-
2000 to 2003-04, compared with a 4.2% increase in male motorcyclists hospitalised
(Johnston et al., 2008).
In developed countries, women make up a larger proportion of scooter riders than
riders of traditional motorcycles. In Queensland, Australia, females comprised 38%
of moped riders in crashes, compared with 7% of motorcycle riders in crashes
(Haworth & Nielson, 2008). The growth in the popularity of scooters and mopeds in
9
developed countries suggests that the number of female riders will continue to
increase.
5. Different perspectives
Most of the challenges associated with PTWs relate to safety, while the majority of
the opportunities relate to mobility. Much of the controversy surrounding PTWs
relates to the different perspectives that individuals and organisations bring. Safety
professionals see the challenges, while transport professionals and PTW enthusiasts
embrace the opportunities.
To a large extent, people’s views on PTWs are determined by the questions that they
ask. For those professionals who ask questions about the transport outcomes
associated with PTW use, the answers show that the average speed of PTWs in
congested traffic is greater than that of cars with resultant travel time savings, and
several PTWs can occupy the space used in the transport system by one car (Wigan,
2000). For those who ask about safety outcomes, the answers are mixed. Safety
professionals examine data and see increases in the numbers and percentages of
fatally and seriously injured PTW occupants (Morris, 2009; DITRD&LG, 2010;
Johnson et al., 2008). The fatality and injury rates of PTWs are worse than for car
occupants, whether the denominator is registered vehicles, licensed riders, or distance
ridden. Yet transport professionals and motorcycle enthusiasts examine the same data
and find evidence that motorcycling is becoming safer. This can be demonstrated
using data from Australia as an example. Figure 3 shows the increase in the number
of motorcycle registrations (including scooters but not mopeds) in Australia from
10
297,000 in 1995 to 624,000 in 2009 (ABS, 2009), while the population increased
from approximately 18 million to 20 million in the same period (ABS, 2008). Figure
4 shows that the number of motorcyclists (riders and passengers) killed over the same
period changed little (DITRD&LG, 2010). Figure 5 shows the percentage of all road
fatalities who were motorcyclists. This increased from about 10% in 1995 to about
15% in recent years and has led to much concern about motorcycle safety. However,
these numbers simply reflect the greater achievements in safety for car occupants than
for PTW riders. This is demonstrated in Figure 6 that compares the fatality rate per
10,000 registered motorcycles (the solid line) with the percentage of road fatalities
who were motorcyclists (the dashed line). The fatality rate indicates that motorcycle
safety is improving, but – as reflected by the dashed line - motorcycle fatalities are
becoming a more important issue (relative to fatalities of other road users).
INSERT FIGURES 3 TO 7 ABOUT HERE
However, this Australian paradox is not consistent across all developed countries.
Figure 7 shows the relevant data for the United States. In the U.S. both measures of
motorcycle safety have been deteriorating since the 1990s when mandatory helmet
laws started to be repealed or weakened in many US States (Morris, 2009).
6. Safety challenges
The challenges for improving the safety of PTW use relate to the PTW user, other
road users, the road environment, the vehicle, data and research, and socio-political
dimensions. The relative importance of particular challenges varies between
11
developed and developing countries, and among developing countries according to
whether PTWs are largely used for recreation or transport.
6.1 Challenges associated with the PTW user
In some countries, there is a challenge to gain rider acceptance for proven safety
measures (e.g. helmets) even when they are affordable and practical. In other
countries, the issue is not so much one of rider acceptance, but of affordability or even
of comfort in very hot environments (WHO, 2006). There is a challenge to persuade
riders to wear protective clothing and to persuade apparel manufacturers to produce
safer products (de Rome, Stanford & Wood, 2003).
In many developed countries, one of the major challenges is how to improve the
safety of mature people who are returning to riding, or taking up riding for the first
time. Most licensing and training systems were designed to suit an earlier population
of young applicants who did not have a car licence and were expected to continue
riding regularly once licensed. Thus, motorcycle and scooter licences remained valid
as long as the car licence was renewed and so allowed many inactive riders to return
without any training or testing being required.
There remains a challenge in motivating riders to ride in a way that minimises risk,
rather than riding for the excitement of the moment. People are attracted to
motorcycling for a variety of reasons including image, the thrill of riding, the feeling
of freedom, and to impress others (Watson, Tay, Schonfeld, Wishart, Tunnicliff, Lang
& Edmonston, 2003) and people with an increased propensity for risk taking may be
attracted to motorcycling (Horswill & Helman, 2003; Tunnicliff, 2005). Riders’
12
motives and subjective views of risk often do not readily reconcile with expert
perceptions of risk (Bellaby & Lawrenson, 2001). Unfortunately, the performance
characteristics of high-powered motorcycles (top speed, acceleration, ability to fit in
lateral gaps too small for cars) that can attract risk-taking also make enforcement to
curtail extreme speeds and other high-risk behaviours difficult. There is a challenge
to develop more effective forms of enforcement to reduce illegal risk taking by riders.
Inexperience has been shown to be a major factor in motorcycle crashes worldwide
and the current graduated licensing systems appear to have had limited success in
ensuring the safety of learner riders (Haworth & Rowden, 2010). Whilst rider
training is often perceived by the public and promoted as an effective crash
countermeasure (Baer, Cook & Baldi, 2005), past evaluations have generally not
found any reduction in crashes for formally trained riders compared to those who
have not undertaken a formal training course (for reviews see Haworth & Mulvihill,
2005; Simpson & Mayhew, 1990). Indeed some studies have found higher crash rates
for trained riders (Savolainen & Mannering, 2007). While some of these
discrepancies may reflect differences in evaluation methodologies (Watson et al.,
2003; Simpson & Mayhew, 1990) or differences between programs, a key issue for
novice rider training is that training may be undertaken (or provided), in some cases,
with the motive of passing a test or meeting licence competencies, rather than to
become a safe rider. Where training is voluntary, motivating riders (particularly those
with little interest in safety) to participate poses an additional challenge.
6.2 Challenges associated with other road users
13
Most analyses of PTW crashes conclude that operators of the other vehicle are at fault
in the majority of PTW-Other Vehicle crashes (ACEM, 2004; see summary in
APROSYS report). Often the operator of the other vehicle fails to see and give way
to the PTW user, whether for reasons associated with the visual characteristics of the
PTW or because of a lack of expectancy (as currently being investigated by the
European 2BESAFE project). While there are often calls from PTW groups for
education of other road users to address this issue and programs have been developed
to increase caution when motorcycles are present (Harrison, 2005), such education
may not have long-lasting effects where PTWs remain a small minority of vehicles.
6.3 Challenges associated with the road environment
PTW users are relatively more affected by characteristics of the road environment in
terms of crash causation and severity of injury outcome than other road users (Li et
al., 2009). There is a challenge for this to be recognised by road designers and
maintenance authorities and for procedures to be put in place to ensure that loose
material is swept up after road repairs are made. On a larger scale, hazardous
locations for PTWs can be identified and treated to improve rider safety. A
Motorcycle Blackspot Program comprising better signage on curves, enhanced
delineation, improvements to road surfaces, and protective materials on roadside
barriers in the Australian State of Victoria resulted in a 24% reduction in PTW
casualty (fatal and injury) crashes at those locations (Government of Victoria, 2009).
Another challenge for countries with high aspirations for road safety is how to
provide – in an affordable and feasible manner - a road infrastructure that is forgiving
for PTW riders and still functions well for other road users. There has been much
14
concern expressed by PTW users about the dangers they see in the use of wire rope
barriers, despite published data showing strong benefits of these barriers for vehicle
occupants (Candappa, Larsson, & Corben, 2009).
6.4 Challenges associated with vehicles
There are challenges associated with improving the active and passive safety of both
PTWs and other vehicles that collide with them. While many of the technical
challenges associated with improving the active safety of PTWs such as ABS and
linked braking systems and newer systems are being addressed, there appears limited
market penetration of such improvements. While cost may play a role, it seems that
there is little demand among many riders who value the physical challenges of riding
a PTW and do not want these challenges removed. Improvements to the active safety
of other vehicles may benefit PTW users. These include ambitious systems to detect
PTWs that are being developed by some car manufacturers. While there are no data
specific to their effect on PTWs yet, current features on cars such as traction control
and enhanced stability control may prevent cars from losing control and having head-
on collisions with PTWs.
Particularly in developing countries, there are challenges in ensuring that PTWs are
adequately maintained to allow safe operation and in reducing overloading of PTWs.
7. Other challenges
15
In addition to the safety challenges outlined above, challenges exist in terms of
constraints in knowledge about PTW use and its impacts, and in relationships between
PTW users and governments.
7.1 Knowledge constraints
As outlined earlier in this paper, most of the PTW use occurs in the developing world.
However, most of the research into the safety and mobility of PTWs comes from the
developed world (e.g. ACEM, 2004; Hurt et al.,), with the exception of some studies
of helmet use from Asia (see WHO, 2006) and a large crash study from Thailand
(Kasantikul, 2002). Thus, much of the research focuses on aspects of PTWs as a
minority vehicle, with much riding being for recreation. While the fundamental
biomechanics of injury are likely to be similar, the large differences in the roles
played by PTWs, their extent of representation in the traffic mix, and the
characteristics of riders and other road users suggest that caution should be exercised
in generalizing research across countries.
From the viewpoint of research informing policy, there appears to be a shortage of
evaluations on which to base recommendations of effectiveness (with the exception of
helmets) and of implementation strategies. This is particularly the case in terms of
licensing and training systems (Haworth & Mulvihill, 2005).
The paucity of data relating to patterns of use of PTWs and the characteristics of their
riders has led to difficulties in estimating and interpreting crash and injury rates for
PTW users (Haworth, 2003). Basic data relating to how far PTWs travel and on what
types of roads often needs to be collected by surveying owners, because many
16
automated vehicle detection systems cannot adequately count PTWs. Once data relies
on surveys, then issues of representativeness begin to be debated. Even crash data has
important limitations, in that mopeds and scooters cannot be distinguished from
motorcycles in the crash data in many jurisdictions.
In many countries (such as the US and Australia), the most recent comprehensive in-
depth studies were conducted decades ago (Haworth, Smith, Brumen & Pronk, 1997;
Hurt, Ouellet & Thom, 1981) and rider and PTW characteristics have since changed.
Yet it remains difficult to secure funding to undertake the necessary research, and
gaining the necessary approvals appears to be even more problematic.
7.2 Societal issues
Challenges exist in building relationships of trust between governments and rider
organisations. In some developed countries, PTW users are suspicious of the motives
of governments, interpreting changes in licensing or other regulations as threatening
the continuing viability of PTWs. Government organisations are aware of this and
tend to develop policy with minimal consultation to avoid political embarrassment or
delay. Rider suspicion of government is often fuelled by political decisions that have
been made without reference to the published evidence or to the government’s own
advisers.
8. Mobility opportunities
The pattern of use of PTWs across the world is evidence of the mobility opportunities
that they provide. In many countries, PTWs have a current or future potential for
reducing traffic congestion in busy cities. They also offer opportunities to individuals
17
to be able to park (or park more cheaply) and opportunities to cities to use less area
for parking.
PTWs provide a form of personal transport that uses less fossil fuel than automobiles.
However, information about modal shift patterns needs to be collected before
assuming that this will provide a large benefit, because some evidence suggests that
the increasing use of scooters for commuting may reflect a change from public
transport, rather than from the private car (Blackman & Haworth, 2010).
PTWs can provide an affordable means of transport to poorer people in both
developed and developing worlds, particularly where public transport is not well
suited to reaching employment.
These are some of the potential mobility benefits of PTWs but relatively little
quantification has occurred in order to compare them with the safety costs.
8. Issues for the future of PTWs
In the developed world there is pressure, particularly in Europe, for PTWs to become
cleaner, greener, and quieter. Manufacturers are responding by developing electric
PTWs and other new forms of technology. Many applications of Intelligent Transport
Systems to PTWs have been proposed and some developed, but rider acceptance may
limit their market penetration unless adoption is forced by regulation.
In addition to technological improvements to PTWs, there are also many new vehicles
being developed that do not easily fit into current vehicle classifications, some of
18
which are uneasily falling into the motorcycle or moped category. There are
relatively few external or performance difference between some electric (or petrol)
bicycles and mopeds, which causes difficulties for regulation and enforcement. This
“morphing” of vehicle categories is likely to continue into the future and may lead us
to abandon our current prescriptive vehicle classifications in favour of a performance-
based system with consequences for operator licensing and training, and vehicle
registration.
Issues for the future in developing countries may differ greatly among countries,
particularly in the shorter term. There are developing countries where PTW use is
likely to continue to increase for at least the next decade, and others that appear to be
moving away from PTWs to cars (such as China). The challenge in developing
countries will be to adopt suitable strategies to manage these changes, in terms of the
safety of PTW users and other vulnerable road users. Improving public transport may
be needed if PTWs cannot provide safe multi-user transport, and safer, suitable
helmets remain an important area of development and promotion.
9. Conclusions
The total number of PTWs has and will continue to grow as they play an important
role in both transport and recreation across the world. Their patterns of use differ
markedly between and among developed and developing countries and this affects the
safety challenges and mobility opportunities that they represent. There is a challenge
to implement what is known and to improve our understanding of what we do not
know about PTWs.
19
10. References ABS. (2008). 3105.0.65.001 Australian Historical Population Statistics, 2008.
Canberra: Australian Bureau of Statistics. ABS (2009). Motor Vehicle Census 31 March 2009. Canberra: Australian Bureau of
Statistics. Association of European Motorcycle Manufacturers. (2004). Motorcycling accident
in-depth study (MAIDS). Retrieved from http://maids.acembike.org/ Baer, J. D., Cook, A. L., & Baldi, S. (2005). Motorcycle rider education and
licensing: A review of programs and practices. DOT HS 809 852. Washington, DC: National Highway Traffic Safety Administration.
Bellaby, P., & Lawrenson, D. (2001). Approaches to the risk of riding motorcycles: Reflections on the problem of reconciling statistical risk assessment and motorcyclists’ own reasons for riding. Sociological Review, 49(3), 368-389.
Blackman, R., & Haworth, N. (2010). Qualitative Exploration of the Attitudes & Experiences of Moped & Scooter Riders. Paper presented at the 89th TRB Annual Meeting, Washington.
Candappa, N.L., Larsson, M., and Corben, B.F., (2004, revised 2009). Flexible Barrier Systems Along High-Speed Roads – a Lifesaving Opportunity. Sydney: Austroads. www.austroads.com.au/pdf/TestMethod2/No.6_July2009.pdf
Coxon, I. (2002). Journey to work, buzz or bore? A phenomenological, ethnographic study of motor scooter riders in Sydney. Paper presented at the 25th Australasian Transport Research Forum., Canberra, ACT.
de Rome, L., Stanford, G. & Wood, B. (2003). Motorcycle Protective Clothing, Road Safety Research, Policing and Education Conference, Sydney
DITRD&LG. (2010). Road Deaths Australia, January 2010. Canberra: Department of Infrastructure, Transport, Regional Development and Local Government.
FCAI (2010). FCAI motorcycle group: National sales report. Canberra, Australia: Federal Chambers of Automotive Industries.
Government of Victoria. (2009). Victoria’s Road Safety and Transport Strategic Action Plan for Powered Two Wheelers 2009–2013 www.roads.vic.gov.au.
Harrison, W.A. (2005) A demonstration of avoidance learning in turning decisions at intersections. Transportation Research F: Traffic Psychology and Behaviour, 8, 341-354.
Haworth, N. (2003). How valid are motorcycle safety data? Paper presented at 2003 Australasian Road Safety Research, Policing and Education Conference. http://www.rsconference.com/pdf/RS030076.pdf
Haworth, N. & Mulvihill, C. (2005). Review of motorcycle licensing and training (Report No. 240). Melbourne: Monash University Accident Research Centre.
Haworth, N. and Nielson, A. (2008). Motor scooters and mopeds - are increasing sales translating into increasing crashes? Transportation Research Record, 2074, 69-76.
Haworth, N. & Rowden, P. (2010). Challenges in improving the safety of learner motorcyclists. Paper presented at the 20th Canadian Multidisciplinary Road Safety Conference, Niagara Falls, 6-9 June 2010.
Haworth, N., Smith, R., Brumen, L., & Pronk, N. (1997). Case-control study of motorcycle crashes (CR174). Canberra: Federal Office of Road Safety.
20
Henley, G. & Harrison, J.E. (2009). Serious injury due to land transport accidents, Australia, 2006-07 (AIHW 53). Canberra: Australian Institute of Health and Welfare.
Horswill, M. S. & Helman, S. (2003). A behavioural comparison between motorcyclists and a matched group of non-motorcyclists car drivers: Factors influencing accident risk. Accident Analysis and Prevention, 35, 589-597.
Hurt, H. H., Jr., Ouellet, J. V. & Thom, D. R. (1981). Motorcycle Accident Cause Factors and Identification of Countermeasures, Final Report, DOT-HS-F-01160.
Jamson, S. & Chorlton, K. (2009). The changing nature of motorcycling: Patterns of use and rider characteristics. Transportation Research Part F, 12, 335-346.
Johnston, P., C. Brooks, and H. Savage. (2008). Fatal and Serious Injury Crashes Involving Motorcyclists. Monograph 20. Canberra: Department of Infrastructure, Transport, Regional Development and Local Government.
Kasantikul, V. (2002) Motorcycle Accident Cause Factors and Identification of Counter-measures in Thailand: Volume I: Bangkok, KP Printing.
Li, M. D., Doong, J. L., Huang, W. S., Lai, C. H. & Jeng, M. C. (2009). Survival hazards of road environment factors between motor-vehicles and motorcycles. Accident Analysis and Prevention, 41, 938-947. http://www.sciencedirect.com/science?_ob=ArticleURL&_udi=B6V5S-4WGKJ3S-2&_user=10&_coverDate=09%2F30%2F2009&_rdoc=1&_fmt=high&_orig=search&_sort=d&_docanchor=&view=c&_acct=C000050221&_version=1&_urlVersion=0&_userid=10&md5=068a644215f4e281bb0fdbc9a3a14fd6 - aff4
Morris, C. C. (2009). Motorcycle trends in the United States. Washington D.C.: U.S. Department of Transportation Research and Innovative Technology Administration. http://www.bts.gov/publications/bts_special_report/2009_05_14/html/entire.html
MSCC. (2009). Motorcycle and Scooter Safety Summit: The Road Ahead 10–11 April 2008. Canberra: Department of Infrastructure, Transport, Regional Development and Local Government. http://www.infrastructure.gov.au/roads/safety/publications/2009/pdf/msss_report.pdf
Naci, H., Chisholm, D. & Baker, T. D. (2009) Distribution of road traffic deaths by road user group: A global comparison. Injury Prevention 15, 55-59.
National Center for Statistics and Analysis Research and Development. (2008). Traffic Safety Facts 2006 Data – Motorcycles, Updated March 2008. http://wwwnrd. nhtsa.dot.gov/Pubs/810620.PDF (DOT HS 810 806).
Paulozzi, L. J., Ryan, G. W., Espitia-Hardeman, V. E., & Yongli, X. (2007). Economic development’s effect on road-transport related mortality among different types of road users: A cross-sectional international study. Accident Analysis and Prevention, 39. 606-617.
Rogers, N. (2008). Trends in Motorcycles Fleet Worldwide. Presentation to Joint OECD/ITF Transport Research Committee Workshop on Motorcycling Safety .http://www.internationaltransportforum.org/jtrc/safety/Lillehammer2008/Lillehammer08Rogers.pdf
Savolainen, P., & Mannering, F. (2007). Effectiveness of motorcycle training and motorcyclists’ risk taking behaviour. Transportation Research Record, 2031, 52-58.
21
Shankar, U., & Varghese, C. (2006). Recent trends in fatal motorcycle crashes: An update. DOT. Washington DC: National Highway Traffic Safety Administration.
Simpson, H.M. & Mayhew, D.R. (1990). The promotion of motorcycle safety: training, education and awareness. Health Education Research: Theory and Practice, 5, 257-264.
Sperling, D. & Salon, D. (1992). Transportation in developing countries: An overview of greenhouse gas reduction strategies. CA: Pew Centre on Global Climate Change. http://www.pewclimate.org/docUploads/transportation_overview.pdf
Strifeldt, H.P. (2008). The riders around the world. Presentation to Joint OECD/ITF Transport Research Committee Workshop on Motorcycling Safety http://www.internationaltransportforum.org/jtrc/safety/Lillehammer2008/Lillehammer08Stifeldt.pdf
Transport for London (2004). Differences between London motorcyclists and those from the rest of the UK. Research Summary number 4. London Road Safety Unit. http://www.tfl.gov.uk/assets/downloads/summary-No4-london-p2w-differences.pdf
Tunnicliff, D. Psychosocial factors contributing to motorcyclists’ intended riding style: An application of an extended version of the theory of planned behaviour. Unpublished Masters thesis. Brisbane: Queensland University of Technology, 2005.
University of California (1992). Enhancing mobility: Transportation technologies, operations, design. Panel discussions. In Proceedings from the Conference on Transportation in Developing Countries. CA: University of California. http://www.uctc.net/papers/387.pdf
Watson, B., Tay, R., Schonfeld, C., Wishart, D., Tunnicliff, D., Lang, C. & Edmonston, C. (2003). Short-term process and outcome evaluation of Q-RIDE. Report to Queensland Transport. Brisbane: Centre for Accident Research and Road Safety -Queensland.
WHO. (2006). Helmets: a road safety manual for decision-makers and practitioners. Geneva, World Health Organization.
Wigan, M. (2000), Motorcycle Transport: Powered Two Wheelers in Victoria. Report 2000-1-1, A report for VicRoads on behalf of the Victorian Motorcycle Advisory Council by Oxford Systematics. Melbourne.
22
FIGURES
Figure 1. The world according to PTW ownership. From www.worldmapper.org
23
Figure 2. The 10 countries with the greatest number of PTWs per 1,000 population and the 10 countries with the lowest number of PTWs per 1,000 population. From www.worldmapper.org
Figure 5. Percentages of all road users killed in road crashes in Australia from 1995 to 2009 who were motorcyclists (riders or passengers). From DITRD&LG, 2010.
Figure 6. Number of motorcyclists killed per 10,000 registered motorcycles (solid line) and percentage of all road users killed in road crashes in Australia from 1995 to 2009 who were motorcyclists (riders or passengers) (dashed line). From ABS, 2009 and DITRD&LG, 2010.
Figure 7. Number of motorcyclists killed per 10,000 registered motorcycles (solid line) and percentage of all road users killed in road crashes in the United States from 1995 to 2009 who were motorcyclists (riders or passengers) (dashed line). From Morris, 2009.