11/28/2011 1 L17: Designing and Sustaining a Patient Safety Program Sustaining a Culture of Safety Frank Federico This presenter has nothing to disclose. Objectives • Define a process for goal-setting and feedback that will lead to individual and organizational learning • Outline the barriers to physician involvement in safety programs and learn how to use that understanding to facilitate engagement
Transcript
11/28/2011
1
L17: Designing and Sustaining a Patient Safety Program
Sustaining a Culture of Safety
Frank Federico
This presenter has nothing to disclose.
Objectives
• Define a process for goal-setting and
feedback that will lead to individual and
organizational learning
• Outline the barriers to physician
involvement in safety programs and learn
how to use that understanding to facilitate
engagement
11/28/2011
2
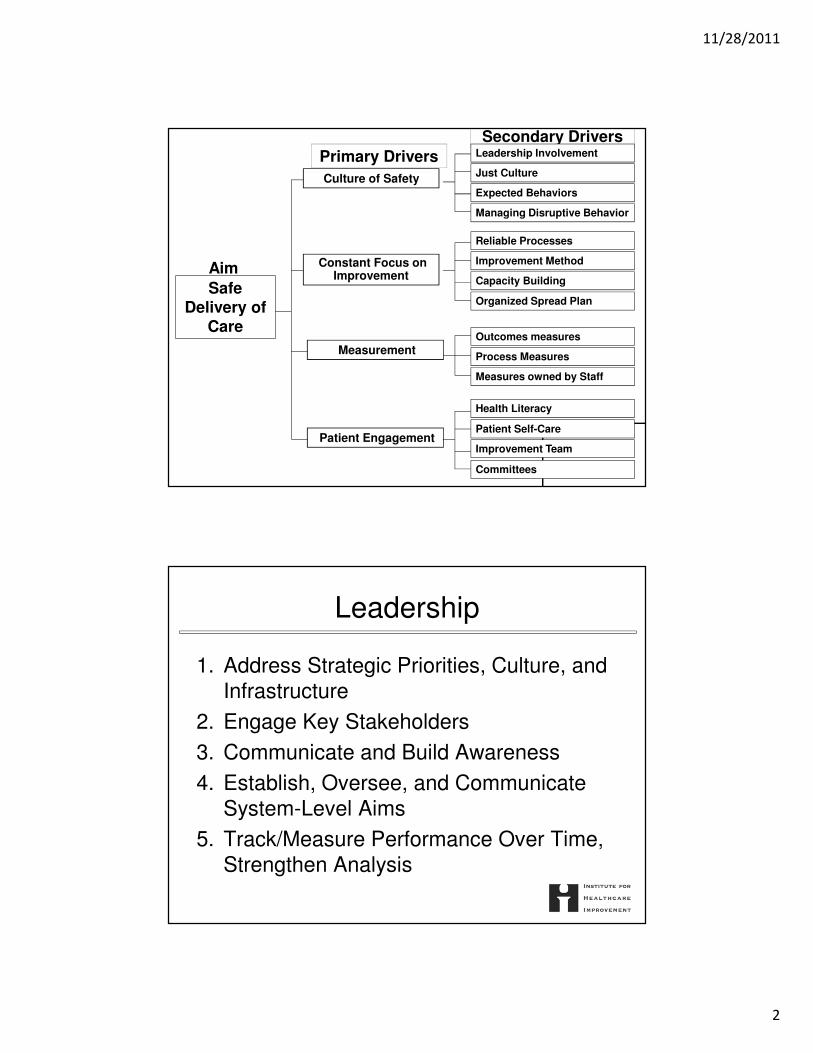
Aim
Primary Drivers
Secondary Drivers
Safe Delivery of
Care
Improvement Method
Capacity Building
Health Literacy
Patient Self-Care
Improvement Team
Organized Spread Plan
Outcomes measures
Process Measures
Measures owned by Staff
Patient Engagement
Constant Focus on Improvement
Measurement
Culture of Safety
Managing Disruptive Behavior
Just Culture
Expected Behaviors
Leadership Involvement
Reliable Processes
Committees
Leadership
1. Address Strategic Priorities, Culture, and
Infrastructure
2. Engage Key Stakeholders
3. Communicate and Build Awareness
4. Establish, Oversee, and Communicate
System-Level Aims
5. Track/Measure Performance Over Time,
Strengthen Analysis
11/28/2011
3
Leadership
6. Support Staff and Patients/Families
Impacted by Medical Errors and Harm
7. Align System-Wide Activities and
Incentives
8. Redesign Systems and Improve
Reliability
Expected Behaviors
• Managing disruptive behaviors
• Stating the expected behavior
• Safety is a priority for everybody in the
organization
• Modeling the behavior expected
─Leaders to managers to frontline
• Psychological Safety/Teamwork
11/28/2011
4
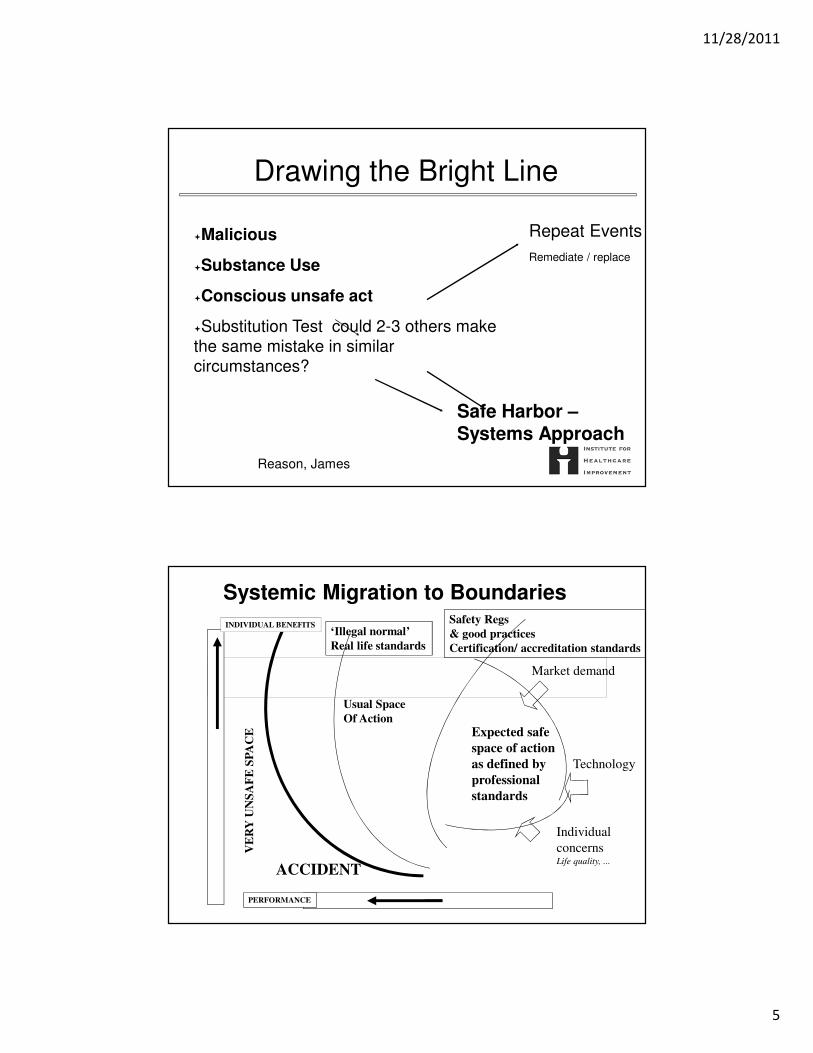
“Just Culture”
• James Reason Unsafe Acts Algorithm
• David Marx Just Culture
Unsafe Acts Algorithm -The Incident Decision Tree
4 Questions─Did the employee intend to cause harm?
─Did the employee come to work drunk or eqUally impaired?
─Did the employee knowingly and unreasonably increas risk?
─Would another similarly trained and skilled employee in the same situation act in a similar manner? Michael Leonard MD, KP Model
If the first three answers are NO and the last YES the origin of the unsafe act lies in he organization,not the individual
Capability• The power or ability to generate an outcome• The ability to execute a specified course of action• The sum of expertise and capacity• Knowledge, skill, ability, or characteristic associated with desirable performance on a job, such as problem solving, analytical thinking, or leadership • Some definitions of capability include motives, beliefs, and values
Capacity • The ability to receive, hold or absorb
• The maximum or optimum amount of production • The ability to learn or retain information.” • The power, ability, or possibility of doing something or performing• A measure of volume; the maximum amount that can be held
Experts OperationalLeaders (Executives)
Change
Agents
(Middle
Managers,
Stewards,
project leads)
Everyone
(Staff, Supervisors,UBT lead triad)
Unit Based Teams
Continuum of PI Knowledge and Skills
Deep
Knowledge
Many People Few People
Our approach will be to make sure that each group receives the knowledge and skill sets they need when they need them and in the appropriate amounts.
A key operating assumption of building capacity is that different groups of people will have different levels of need for PI knowledge and skill.
Content: What Skills Do We Need?
Source: Kaiser Permanente, 2008
Shared
Knowledge
11/28/2011
8
The Seven Spreadly Sins
Step #1 Start with large pilots
Step #2 Find one person willing to do it all
Step #3 Use vigilance and hard work
Step #4 If a pilot works then spread the pilot unchanged
Step #5 Require the person and team who drove the pilot
to be responsible for system-wide spread
Step #6 Look at process and outcome measures on a quarterly basis
Step #7 Early on expect marked improvement in outcomes
without attention to process reliability
Measurement
• How do you know what is not working?
• How do you know if a change is an
improvement?
11/28/2011
9
17
How Many MeasuresDo You Need on Your Dashboard?
11/28/2011
10
There are many things in life that are interesting to know.
It important to work on those things that are essential to quality.
The challenge, therefore, is to be disciplined enough to focus on the essential, vital few.
Focus on the Vital Few!
Building a Cascading System of Measures
Micro Metrics - Processes
Board & CEO
Service Line
Physician & Patient
Microsystems: Units, Depts
Macro Metrics - OutcomesL 1
L 2
L 3
L 4/ 5
Adapted from Lloyd & Caldwell
Meso Metrics – Outcomes + Processes
Individual Metrics - Processes
Str
uc
tura
l M
ea
su
res
11/28/2011
11
Whole System Measures
Measure Name(Provide a specific name such
as medication error rate)
Operational Definition(Define the measure in very specific terms.
Provide the numerator and the denominator
if a percentage or rate. Indicate what is to be
included and excluded. Be as clear and
unambiguous as possible)
Data Source(s)(Indicate the sources of
the data. These could
include medical records,
logs, surveys, etc.)
Data
Collection:•Schedule (daily, weekly,
monthly or quarterly)
•Method (automated
systems, manual, telephone,
etc.)
Baseline•Period
•Value
Goals•Short term
•Long term
Dashboard Worksheet
Name of team:_______________________________ Date: _____________
Source: R. Lloyd. Quality Health Care: A Guide to Developing and Using Indicators.
Jones and Bartlett, 2004.
11/28/2011
12
NON-SPECIFIC CHEST PAIN PATHWAY MEASUREMENT PLAN
Measure Name(Provide a specific name such
as medication error rate)
Operational Definition(Define the measure in very specific
terms.
Provide the numerator and the
denominator if a percentage or rate.
Indicate what is to be included and
excluded. Be as clear and
unambiguous as possible)
Data Source(s)(Indicate the sources of the
data. These could include
medical records, logs,
surveys, etc.)
Data
Collection:•Schedule (daily, weekly,
monthly or quarterly)
•Method (automated systems,
manual, telephone, etc.)
Baseline•Period
•Value
Goals•Short term
•Long term
Percent of patients who have
MI or Unstable Angina as
diagnosis
Numerator =
Patients entered into the NSCP
path who have Acute MI or
Unstable Angina as the discharge
diagnosis
Denominator =
All patients entered into the
NSCP path
1.Medical Records
2.Midas
3.Variance Tracking
Form
1.Discharge diagnosis will be
identified for all patients
entered into the NSCP
pathway
2.QA-URwill retrospectively
review charts of all patients
entered into the NSCP
pathway. Data will be
entered into MIDAS system
1.Currently
collecting
baseline
data.
2.Baseline
will be
completed
by end of
1st Q 2010
Since this is
essentially a
descriptive indicator
of process volume,
goals are not
appropriate.
Number of patients who are
admitted to the hospital or
seen in an ED due to chest
pain within one week of
when we discharged them
Operational Definition:
A patient that we saw in our ED
reports during the call-back
interview that they have been
admitted or seen in an ED (ours
or some other ED) for chest pain
during the past week
All patients who have
been managed within the
NSCP protocol
throughout their hospital
stay
1.Patients will be contacted
by phone one week after
discharge
2.Call-back interview will be
the method
1.Currently
collecting
baseline
data.
2.Baseline
will be
completed
by end of
1st Q 2010
Ultimately the goal
is to have no
patients admitted or
seen in the ED
within a week after
discharge. The
baseline will be used
to help establish
initial goals.
Total hospital costs per one
cardiac diagnosis
Numerator =
Total costs per quarter for
hospital care of NSCP pathway
patients
Denominator =
Number of patients per quarter
entered into the NSCP pathway
with a discharge diagnosis of MI
or Unstable Angina
1.Finance
2.Chart Review
Can be calculated every three
months from financial and
clinical data already being
collected
1.Calendar
year 2010
2.Will be
computed
in June
2010
The initial goal will
be to reduce the
baseline by
5%within the first
six months of
initiating the project.
Source: R. Lloyd. Quality Health Care: A Guide to Developing and Using Indicators. Jones and Bartlett, 2004.
Patients and Families
• Patient Engagement
─Their own care
─Quality Improvement
─Committees
• Having a patient in the room changes
discussion
• Health Literacy
11/28/2011
13
Resources
• Botwinick L, Bisognano M, Haraden C. Leadership Guide to Patient
Safety. IHI Innovation Series white paper. Cambridge, MA: Institute for