SPOTLIGHT OVERVIEW KEY ELEMENTS METHODOLOGY LAWSUIT CLIMATE Ranking the States 2010 STATE LIABILITY SYSTEMS SURVEY Conducted for the U.S. Chamber Institute for Legal Reform by Harris Interactive Inc.
Transcript
SP
OT
LIG
HT
OV
ER
VIE
W
KE
YE
LE
ME
NT
SM
ET
HO
DO
LO
GY
LAWSUIT CLIMATERanking the States
2010
S T A T E L I A B I L I T Y S Y S T E M S S U R V E Y
Conducted for the U.S.Chamber Institute for LegalReform by Harris Interactive Inc.
2 0 1 0 S T A T E L I A B I L I T Y S Y S T E M S S U R V E Y
The 2010 State Liability Systems Ranking Study was conducted for
the U.S. Chamber Institute for Legal Reform to explore how reasonable
and balanced the states’ tort liability systems are perceived to be by U.S.
business. Participants in the survey were comprised of a sample of 1,482
in-house general counsel, senior litigators or attorneys, and other senior
executives who indicated they are knowledgeable about litigation matters
at companies with at least $100 million in annual revenues. The 2010
ranking builds on seven previous surveys1 in which all 50 states were
ranked by those familiar with the litigation environment in that state.
Prior to these rankings, information regarding the attitudes of the
business world toward the legal systems in each of the states had been
largely anecdotal. The State Liability Systems Ranking Study aims to
quantify how corporate attorneys view the state systems.
More than two in five (44%) senior
attorneys view the fairness and
reasonableness of state court liability
systems in America as excellent or
pretty good, up slightly from the last
survey in 2008 (41%). A majority
(56%) view the systems as only fair or
poor. Two-thirds (67%) report that
the litigation environment in a state is
likely to impact important business
decisions at their companies, for
instance, where to locate or do
business, an increase from 63% in 2008
and 57% in 2007.
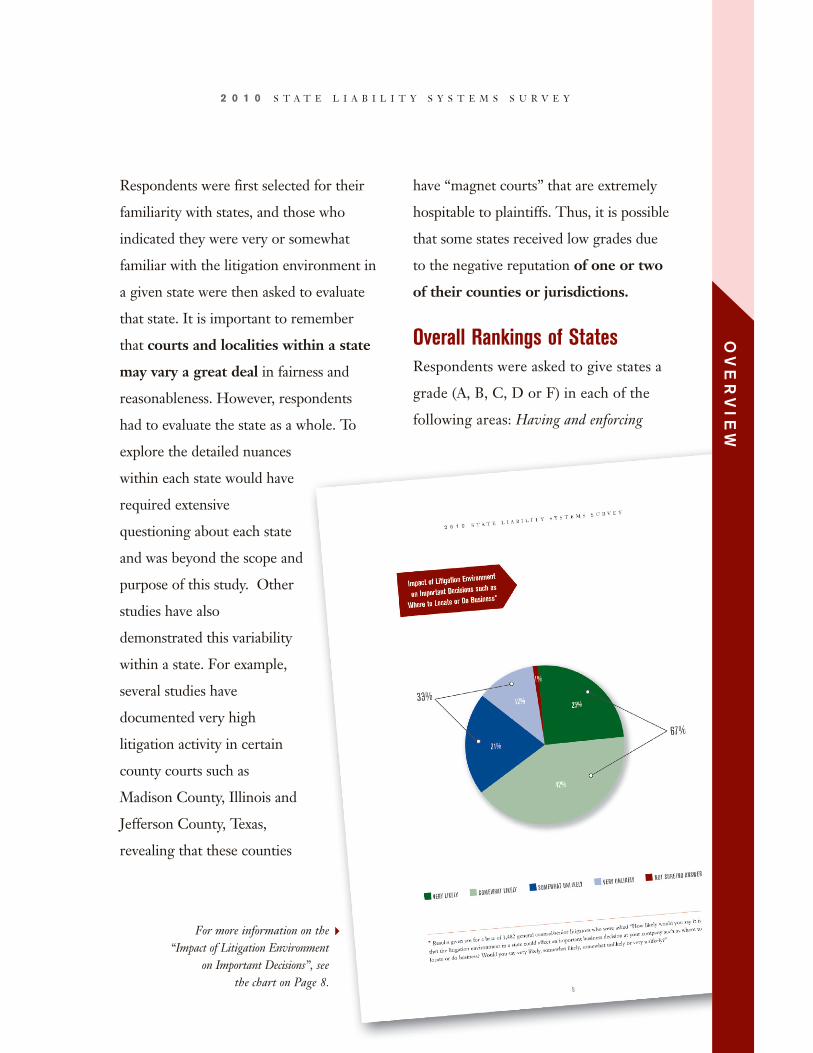
Respondents were first selected for their
familiarity with states, and those who
indicated they were very or somewhat
familiar with the litigation environment in
a given state were then asked to evaluate
that state. It is important to remember
that courts and localities within a state
may vary a great deal in fairness and
reasonableness. However, respondents
had to evaluate the state as a whole. To
explore the detailed nuances
within each state would have
required extensive
questioning about each state
and was beyond the scope and
purpose of this study. Other
studies have also
demonstrated this variability
within a state. For example,
several studies have
documented very high
litigation activity in certain
county courts such as
Madison County, Illinois and
Jefferson County, Texas,
revealing that these counties
have “magnet courts” that are extremely
hospitable to plaintiffs. Thus, it is possible
that some states received low grades due
to the negative reputation of one or two
of their counties or jurisdictions.
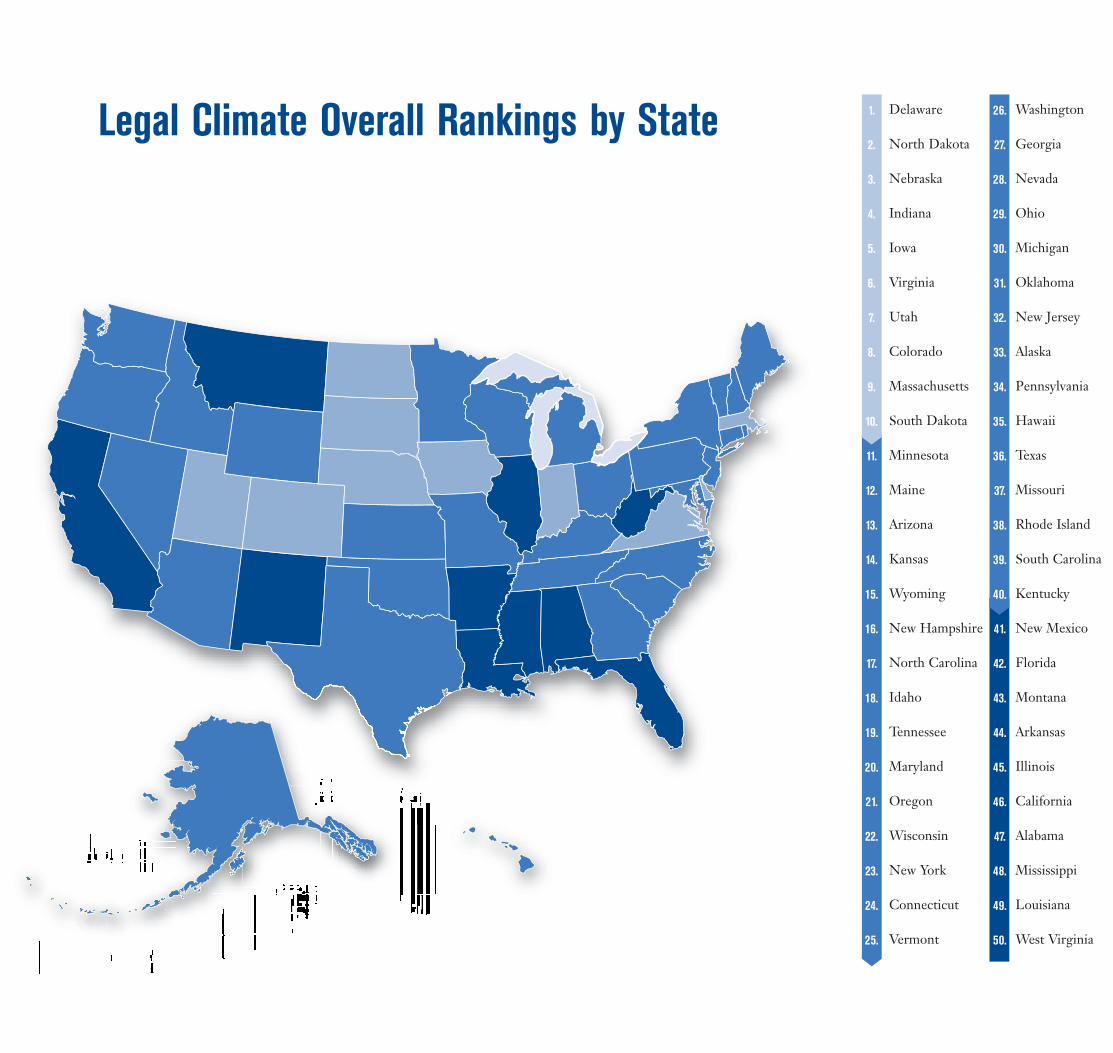
Overall Rankings of StatesRespondents were asked to give states a
grade (A, B, C, D or F) in each of the
following areas: Having and enforcing
OV
ER
VIE
W2 0 1 0 S T A T E L I A B I L I T Y S Y S T E M S S U R V E Y
For more information on the“Impact of Litigation Environment
on Important Decisions”, seethe chart on Page 8.
4
4
2 0 1 0 S T A T E L I A B I L I T Y S Y S T E M S S U R V E Y
meaningful venue requirements; Overall
treatment of tort and contract litigation;
Treatment of class action suits and mass
consolidation suits; Damages; Timeliness of
summary judgment or dismissal; Discovery;
Scientific and technical evidence; Judges’
impartiality; Judges’ competence; and
Juries’ fairness. They were also asked to
give the state an Overall grade for creating
a fair and reasonable litigation
environment. These elements were then
combined to create an Overall ranking
of state liability systems.
Taken as a whole, general counsel and
senior litigators perceive state courts to
be doing better than average on the
various elements. States received
significantly more A’s and B’s (43%)
than D’s and F’s (17%) when all of the
elements were averaged together.
Since the inception of the survey, there
has been a general increase in the overall
average score of state liability systems.
This year’s data, however, may suggest a
leveling off of attitudes and perceptions.
While still high compared to past years’
Average Overall Score AmongAll 50 States, ‘02-’10
Year Average Score
2010 57.9
2008 59.4
2007 58.1
2006 55.3
2005 52.8
2004 53.2
2003 50.7
2002 52.7
OV
ER
VIE
W
5
2 0 1 0 S T A T E L I A B I L I T Y S Y S T E M S S U R V E Y
scores, the scores since 2007 have been
relatively level, showing little change.
Most Important Issues toFocus on to Improve theLitigation EnvironmentThe study also asked respondents to
name the most important issue that
policymakers who care about economic
development should focus on to improve
the litigation environment in their states.
Tort reform issues in general were
mentioned by 9% of respondents as were
caps/limits on damages, up significantly
from 3% in 2008. Other top issues
named were timeliness of decisions (8%),
elimination of unnecessary lawsuits (7%),
limits on discovery (7%), and speeding
up of the trial process (5%).
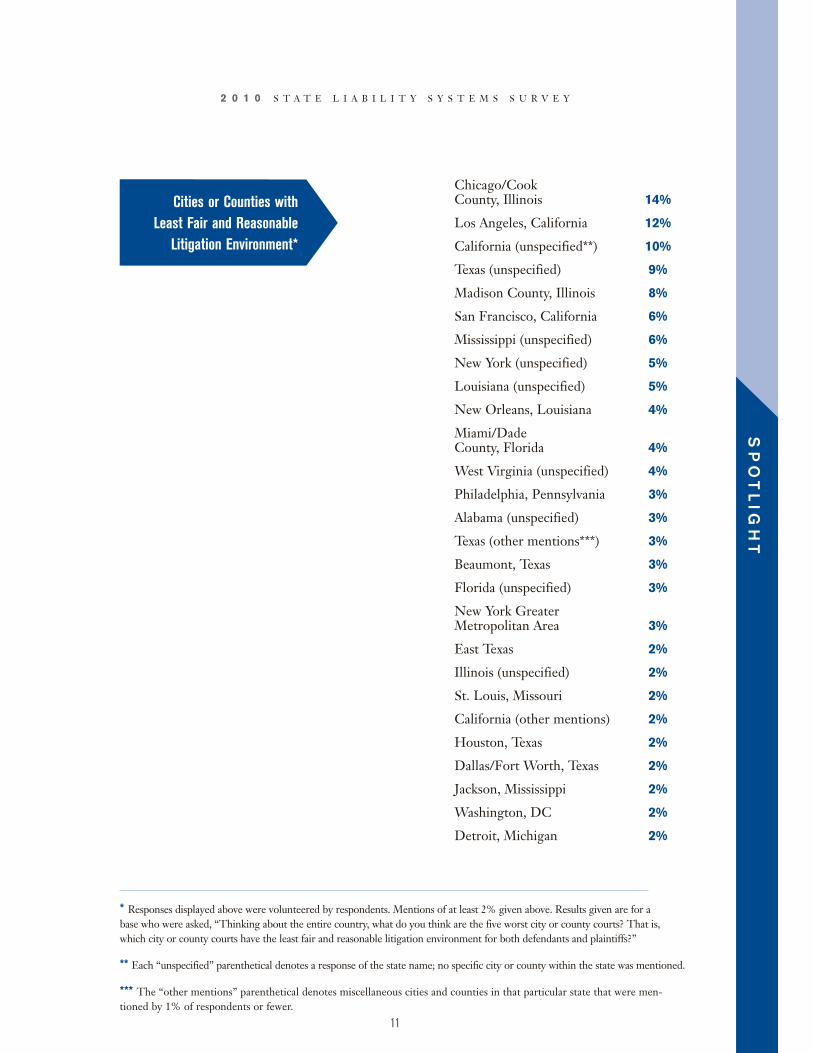
Worst Local JurisdictionsIn order to understand if there are any
cities or counties that might impact a
state’s ranking, respondents were asked
which five cities or counties have the
least fair and reasonable litigation
environments. The worst jurisdiction
was Chicago/Cook County, Illinois
(14%), followed by Los Angeles,
California (12%), the state of
California in general (10%), the state of
Texas in general (9%), and Madison
County, Illinois (8%).
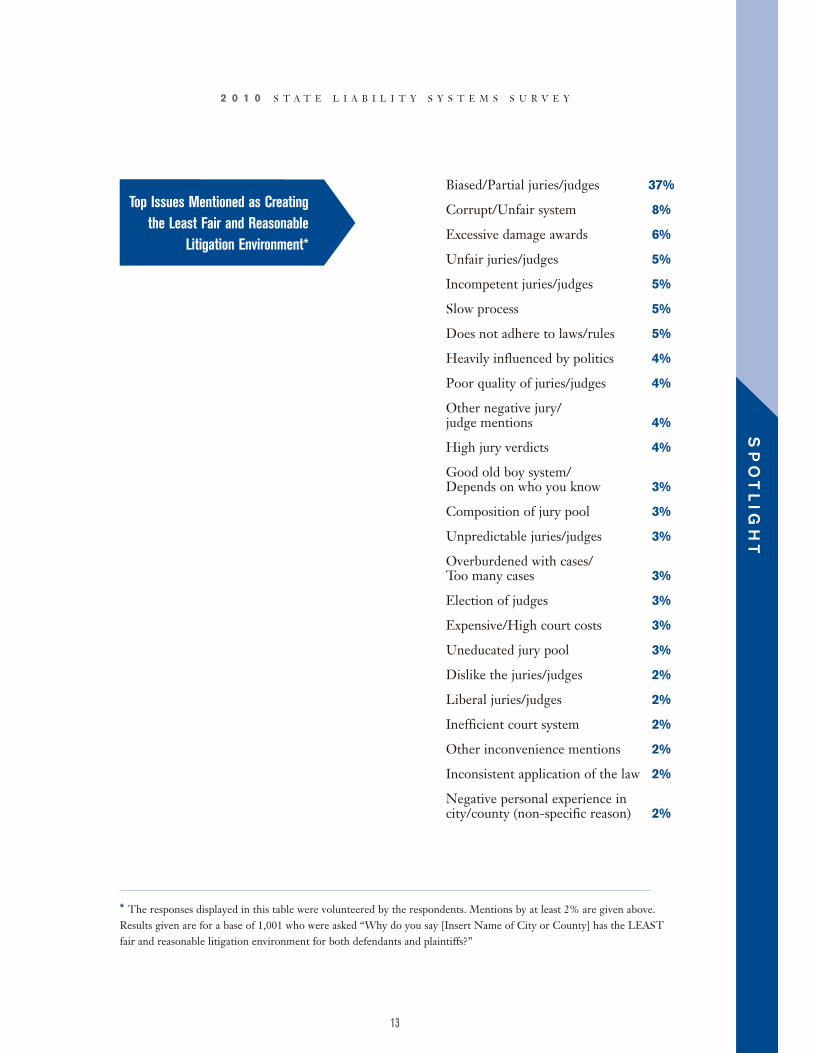
To understand why respondents feel
negatively about particular jurisdictions,
a follow-up question was asked to those
who cited a jurisdiction. More than a
third (37%) of respondents mentioned
that the reason why a city or county has
the least fair and reasonable litigation
environment is because of biased or
partial juries/judges. This is the number
one reason by a large margin. The next
tier includes corrupt/unfair system (8%),
excessive damage awards (6%), unfair
juries/judges, incompetent juries/judges,
a slow process, nonadherence to the
laws/rules, and personal experience
(each mentioned by 5% of respondents).
6
2 0 1 0 S T A T E L I A B I L I T Y S Y S T E M S S U R V E Y
ConclusionSeveral organizations2 have conducted
surveys among various constituencies of
state courts to determine and understand
how the state courts are perceived by
these audiences. Until the annual State
Liability Systems Ranking Study was
initiated in 2002, there were no data on
one important constituency: senior
lawyers in large companies. This, the
eighth State Liability Systems Ranking
Study, finds that senior lawyers in large
corporations have mixed perceptions
about the fairness and reasonableness of
state liability systems overall, with a
significant plurality saying that they are
excellent or pretty good, but the majority
saying that they are only fair or poor. On
average, general counsel and senior
litigators give state courts more A’s and
B’s than D’s and F’s on the various
elements. Although recent scores reveal a
material improvement in perceptions
over the early years of the survey, the
trend toward improvement has flattened.
An examination of individual state
evaluations, however, reveals wide
disparity among those states that are
doing the best job and those states that
are doing the worst job, with the
highest performing state scoring 77 out
of a possible 100 and the poorest
performing state scoring only 35 out of
100. Clearly, corporate counsel see
specific areas needing improvement in
the individual states, and the perceptions
of senior lawyers and executives in large
companies matter. This survey reveals
that the litigation environment in a
state is likely to impact important
business decisions, which could have
economic consequences for the states.
The challenge for the states is to focus
on areas where they received the lowest
score and then make improvements
where they are needed. If improvements
are not needed, then the states must
educate corporate counsel in ways that
will change these perceptions.
2. This includes the Public Perceptions of the State Courts: A Primer, National Center for State Courts (2000);Perceptions of the U.S. Justice System, American Bar Association (1998); Public Trust and Confidence in the Courts:What Public Opinion Surveys Mean to Judges, National Center for State Courts and University of Nebraska (1999);and Level of Public Trust and Confidence: Utah State Courts, State Justice Institute (2000).
EXCELLENT PRETTY GOOD ONLY FAIR POOR NOT SURE/NO ANSWER
2002 20042003 2005 2006 2007 2008 2010
0%
10%
20%
30%
40%
50%
2010200420032002 2005 2006 2007 2008
0%
10%
20%
30%
40%
50%
0%
10%
20%
30%
40%
50%
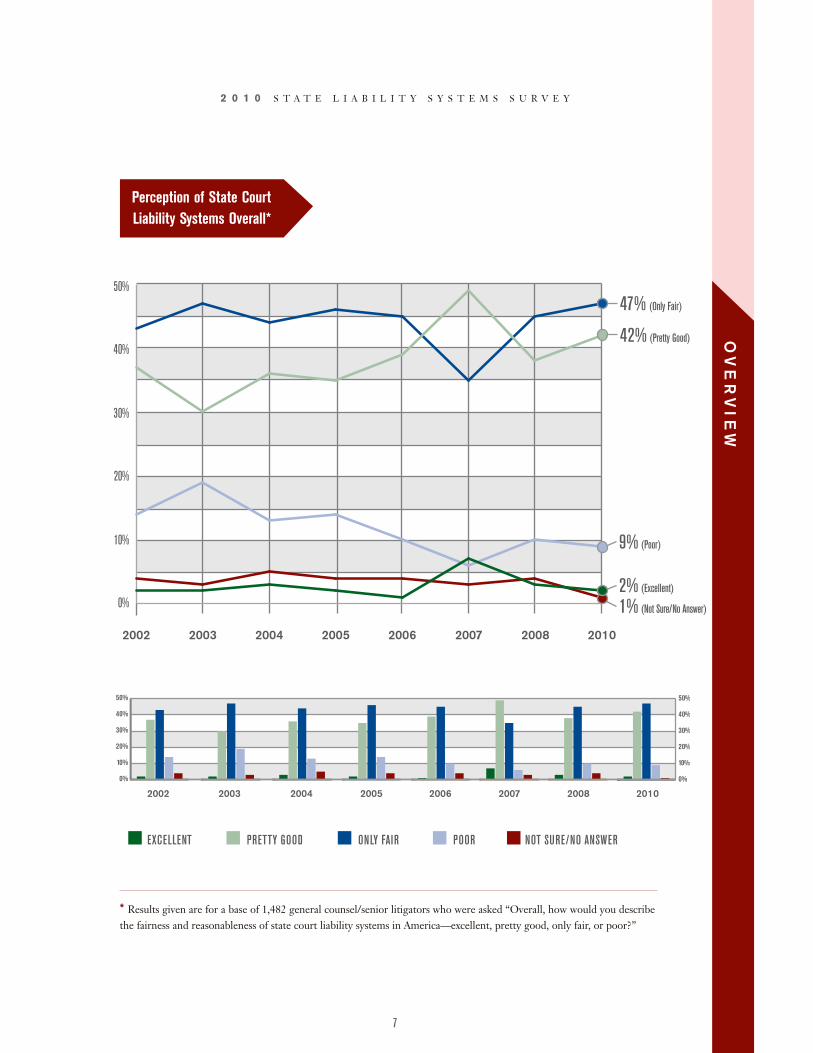
42% (Pretty Good)
47% (Only Fair)
1% (Not Sure/No Answer)
2% (Excellent)
9% (Poor)
OV
ER
VIE
W
7
* Results given are for a base of 1,482 general counsel/senior litigators who were asked “Overall, how would you describethe fairness and reasonableness of state court liability systems in America—excellent, pretty good, only fair, or poor?”
2 0 1 0 S T A T E L I A B I L I T Y S Y S T E M S S U R V E Y
EXCELLENT PRETTY GOOD ONLY FAIR POOR NOT SURE/NO ANSWER
2002 20042003 2005 2006 2007 2008 2010
0%
10%
20%
30%
40%
50%
0%
10%
20%
30%
40%
50%
0%
10%
20%
30%
40%
50%
42% (Pretty Good)
47% (Only Fair)
1% (Not Sure/No Answer)
2% (Excellent)
9% (Poor)EXCELLENT PRETTY GOOD ONLY FAIR POOR NOT SURE/NO ANSWER
2002 20042003 2005 2006 2007 2008 2010
0%
10%
20%
30%
40%
50%
2010200420032002 2005 2006 2007 2008
0%
10%
20%
30%
40%
50%
0%
10%
20%
30%
40%
50%
42% (Pretty Good)
47% (Only Fair)
1% (Not Sure/No Answer)
2% (Excellent)
9% (Poor)
Perception of State CourtLiability Systems Overall*
8
* Results given are for a base of 1,482 general counsel/senior litigators who were asked “How likely would you say it isthat the litigation environment in a state could affect an important business decision at your company such as where tolocate or do business? Would you say very likely, somewhat likely, somewhat unlikely or very unlikely?”
2 0 1 0 S T A T E L I A B I L I T Y S Y S T E M S S U R V E Y
67%
33%12%
1%
25%
42%
21%
VERY LIKELY SOMEWHAT LIKELY SOMEWHAT UNLIKELY VERY UNLIKELY NOT SURE/NO ANSWER
67%
33%12%
1%
25%
42%
21%
VERY LIKELY SOMEWHAT LIKELY SOMEWHAT UNLIKELY VERY UNLIKELY NOT SURE/NO ANSWER
Impact of Litigation Environmenton Important Decisions such as
Where to Locate or Do Business*
OV
ER
VIE
W
9
* Scores displayed in this table have been rounded to one decimal point. However, when developing the ranking, scoreswere evaluated based on two decimal points. Therefore, states that appear tied based upon the scores in this table werenot tied when two decimal points were taken into consideration. See details on p. 30.
2 0 1 0 S T A T E L I A B I L I T Y S Y S T E M S S U R V E Y
Overall Rankingsof State LiabilitySystems ‘02-‘10*
10
* The responses displayed in this table were volunteered by the respondents. Mentions by at least 2% given above. Resultsgiven are for a base of 1,482 general counsel/senior litigators who were asked “What do you think is the single worst aspectof the litigation environment that state policy makers should focus on to improve the business climate in their states?”
2 0 1 0 S T A T E L I A B I L I T Y S Y S T E M S S U R V E Y
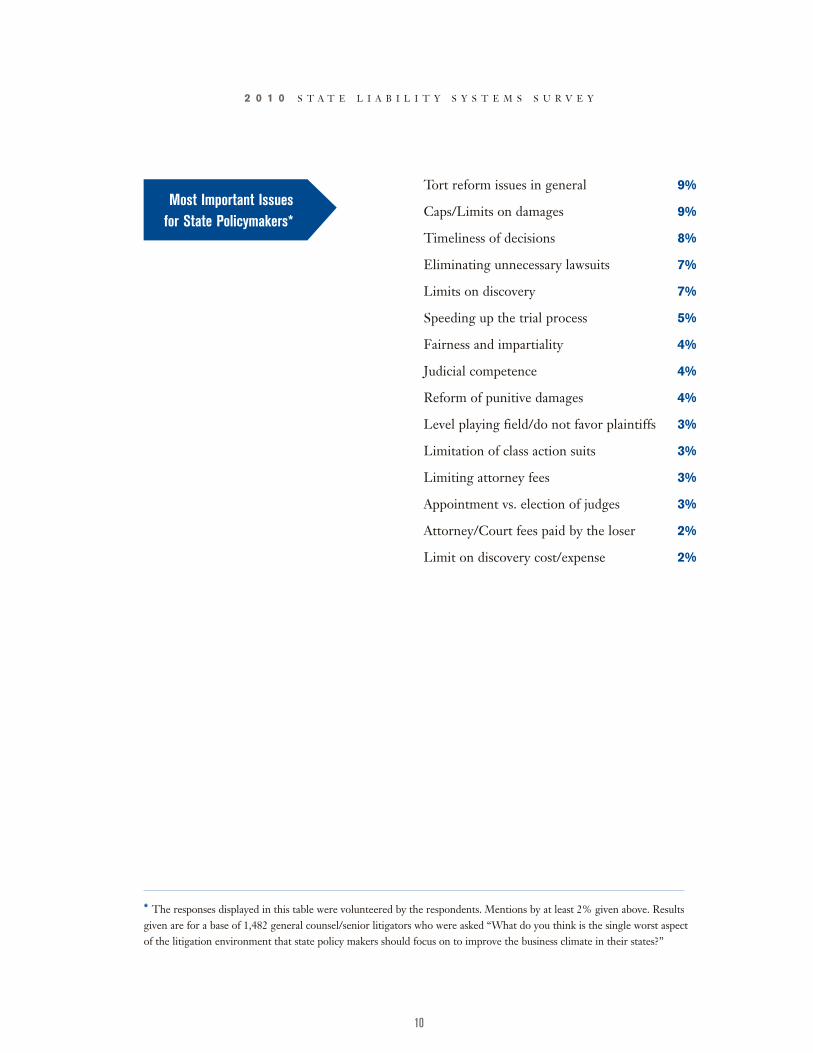
Tort reform issues in general 9%
Caps/Limits on damages 9%
Timeliness of decisions 8%
Eliminating unnecessary lawsuits 7%
Limits on discovery 7%
Speeding up the trial process 5%
Fairness and impartiality 4%
Judicial competence 4%
Reform of punitive damages 4%
Level playing field/do not favor plaintiffs 3%
Limitation of class action suits 3%
Limiting attorney fees 3%
Appointment vs. election of judges 3%
Attorney/Court fees paid by the loser 2%
Limit on discovery cost/expense 2%
Most Important Issuesfor State Policymakers*
11
* Responses displayed above were volunteered by respondents. Mentions of at least 2% given above. Results given are for abase who were asked, “Thinking about the entire country, what do you think are the five worst city or county courts? That is,which city or county courts have the least fair and reasonable litigation environment for both defendants and plaintiffs?”
** Each “unspecified” parenthetical denotes a response of the state name; no specific city or county within the state was mentioned.
*** The “other mentions” parenthetical denotes miscellaneous cities and counties in that particular state that were men-tioned by 1% of respondents or fewer.
2 0 1 0 S T A T E L I A B I L I T Y S Y S T E M S S U R V E Y
SP
OT
LIG
HT
Chicago/CookCounty, Illinois 14%
Los Angeles, California 12%
California (unspecified**) 10%
Texas (unspecified) 9%
Madison County, Illinois 8%
San Francisco, California 6%
Mississippi (unspecified) 6%
New York (unspecified) 5%
Louisiana (unspecified) 5%
New Orleans, Louisiana 4%
Miami/DadeCounty, Florida 4%
West Virginia (unspecified) 4%
Philadelphia, Pennsylvania 3%
Alabama (unspecified) 3%
Texas (other mentions***) 3%
Beaumont, Texas 3%
Florida (unspecified) 3%
New York GreaterMetropolitan Area 3%
East Texas 2%
Illinois (unspecified) 2%
St. Louis, Missouri 2%
California (other mentions) 2%
Houston, Texas 2%
Dallas/Fort Worth, Texas 2%
Jackson, Mississippi 2%
Washington, DC 2%
Detroit, Michigan 2%
Cities or Counties withLeast Fair and Reasonable
Litigation Environment*
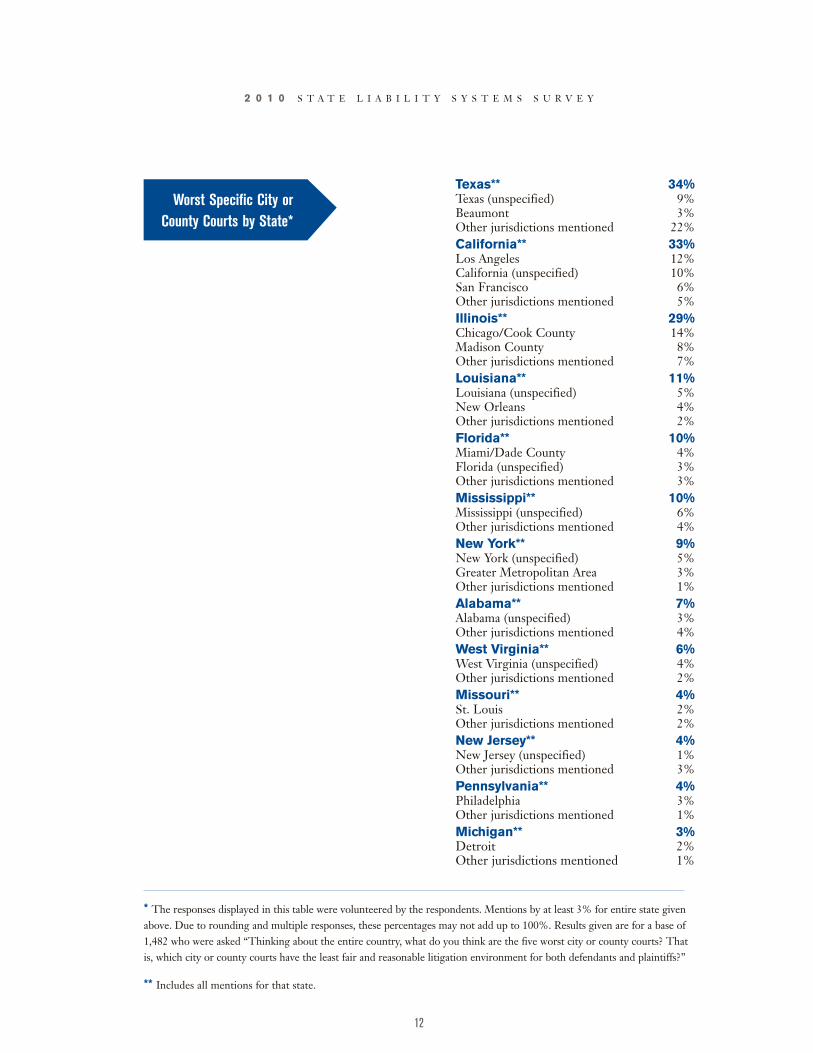
12
* The responses displayed in this table were volunteered by the respondents. Mentions by at least 3% for entire state givenabove. Due to rounding and multiple responses, these percentages may not add up to 100%. Results given are for a base of1,482 who were asked “Thinking about the entire country, what do you think are the five worst city or county courts? Thatis, which city or county courts have the least fair and reasonable litigation environment for both defendants and plaintiffs?”
** Includes all mentions for that state.
2 0 1 0 S T A T E L I A B I L I T Y S Y S T E M S S U R V E Y
Texas** 34%Texas (unspecified) 9%Beaumont 3%Other jurisdictions mentioned 22%California** 33%Los Angeles 12%California (unspecified) 10%San Francisco 6%Other jurisdictions mentioned 5%Illinois** 29%Chicago/Cook County 14%Madison County 8%Other jurisdictions mentioned 7%Louisiana** 11%Louisiana (unspecified) 5%New Orleans 4%Other jurisdictions mentioned 2%Florida** 10%Miami/Dade County 4%Florida (unspecified) 3%Other jurisdictions mentioned 3%Mississippi** 10%Mississippi (unspecified) 6%Other jurisdictions mentioned 4%New York** 9%New York (unspecified) 5%Greater Metropolitan Area 3%Other jurisdictions mentioned 1%Alabama** 7%Alabama (unspecified) 3%Other jurisdictions mentioned 4%West Virginia** 6%West Virginia (unspecified) 4%Other jurisdictions mentioned 2%Missouri** 4%St. Louis 2%Other jurisdictions mentioned 2%New Jersey** 4%New Jersey (unspecified) 1%Other jurisdictions mentioned 3%Pennsylvania** 4%Philadelphia 3%Other jurisdictions mentioned 1%Michigan** 3%Detroit 2%Other jurisdictions mentioned 1%
Worst Specific City orCounty Courts by State*
13
* The responses displayed in this table were volunteered by the respondents. Mentions by at least 2% are given above.Results given are for a base of 1,001 who were asked “Why do you say [Insert Name of City or County] has the LEASTfair and reasonable litigation environment for both defendants and plaintiffs?”
2 0 1 0 S T A T E L I A B I L I T Y S Y S T E M S S U R V E Y
SP
OT
LIG
HT
Biased/Partial juries/judges 37%
Corrupt/Unfair system 8%
Excessive damage awards 6%
Unfair juries/judges 5%
Incompetent juries/judges 5%
Slow process 5%
Does not adhere to laws/rules 5%
Heavily influenced by politics 4%
Poor quality of juries/judges 4%
Other negative jury/judge mentions 4%
High jury verdicts 4%
Good old boy system/Depends on who you know 3%
Composition of jury pool 3%
Unpredictable juries/judges 3%
Overburdened with cases/Too many cases 3%
Election of judges 3%
Expensive/High court costs 3%
Uneducated jury pool 3%
Dislike the juries/judges 2%
Liberal juries/judges 2%
Inefficient court system 2%
Other inconvenience mentions 2%
Inconsistent application of the law 2%
Negative personal experience incity/county (non-specific reason) 2%
Top Issues Mentioned as Creatingthe Least Fair and Reasonable
Litigation Environment*
14
2 0 1 0 S T A T E L I A B I L I T Y S Y S T E M S S U R V E Y
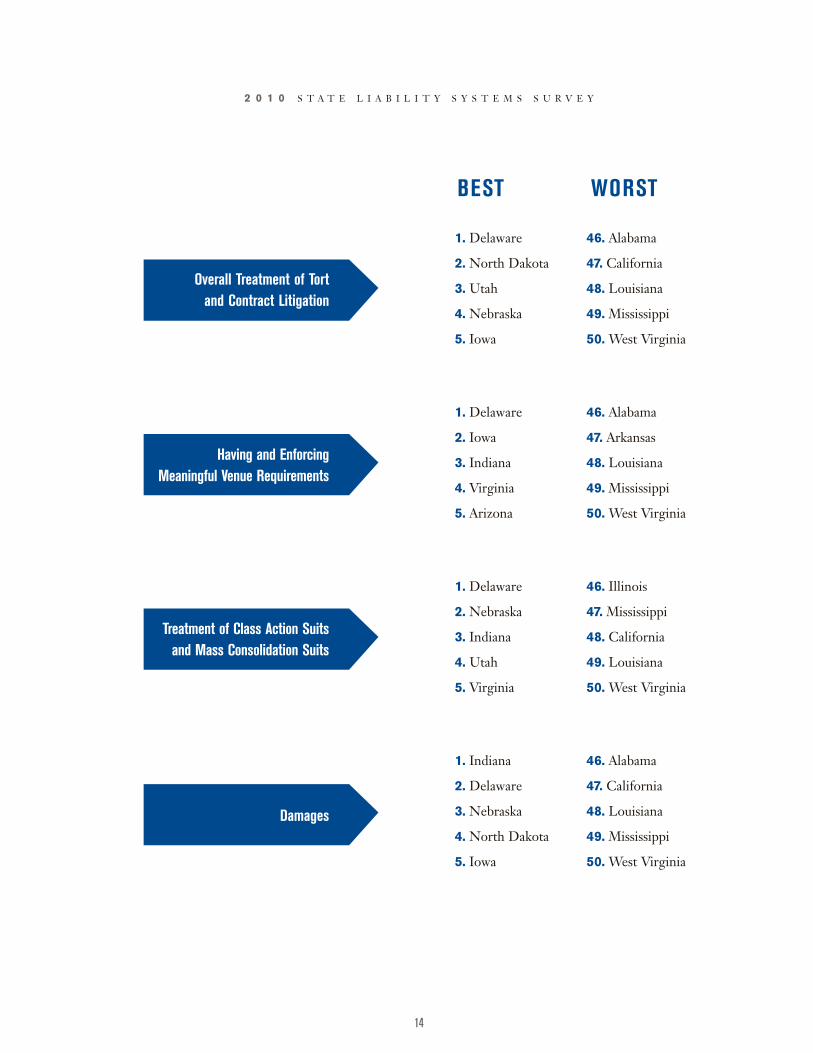
1. Delaware
2. North Dakota
3. Utah
4. Nebraska
5. Iowa
1. Delaware
2. Iowa
3. Indiana
4. Virginia
5. Arizona
1. Delaware
2. Nebraska
3. Indiana
4. Utah
5. Virginia
1. Indiana
2. Delaware
3. Nebraska
4. North Dakota
5. Iowa
46. Alabama
47. California
48. Louisiana
49. Mississippi
50. West Virginia
46. Alabama
47. Arkansas
48. Louisiana
49. Mississippi
50. West Virginia
46. Illinois
47. Mississippi
48. California
49. Louisiana
50. West Virginia
46. Alabama
47. California
48. Louisiana
49. Mississippi
50. West Virginia
BEST WORST
Having and EnforcingMeaningful Venue Requirements
Treatment of Class Action Suitsand Mass Consolidation Suits
Damages
Overall Treatment of Tortand Contract Litigation
15
2 0 1 0 S T A T E L I A B I L I T Y S Y S T E M S S U R V E Y
1. Delaware
2. North Dakota
3. Virginia
4. Indiana
5. Nebraska
1. Delaware
2. Iowa
3. Indiana
4. Nebraska
5. Utah
1. Delaware
2. Colorado
3. Massachusetts
4. Utah
5. Virginia
1. Delaware
2. North Dakota
3. South Dakota
4. Iowa
5. Nebraska
46. California
47. Illinois
48. Mississippi
49. Louisiana
50. West Virginia
46. Illinois
47. California
48. Louisiana
49. Mississippi
50. West Virginia
46. Alabama
47. Arkansas
48. Louisiana
49. Mississippi
50. West Virginia
46. Illinois
47. Alabama
48. Mississippi
49. Louisiana
50. West Virginia
BEST WORST
Discovery
Scientific andTechnical Evidence
Judges' Impartiality
Timeliness of SummaryJudgment or Dismissal
SP
OT
LIG
HT
1. Delaware
2. North Dakota
3. Nebraska
4. Maine
5. Virginia
1. Nebraska
2. North Dakota
3. Iowa
4. Indiana
5. Delaware
46. Arkansas
47. Alabama
48. Mississippi
49. Louisiana
50. West Virginia
46. California
47. Alabama
48. Louisiana
49. Mississippi
50. West Virginia
BEST WORST
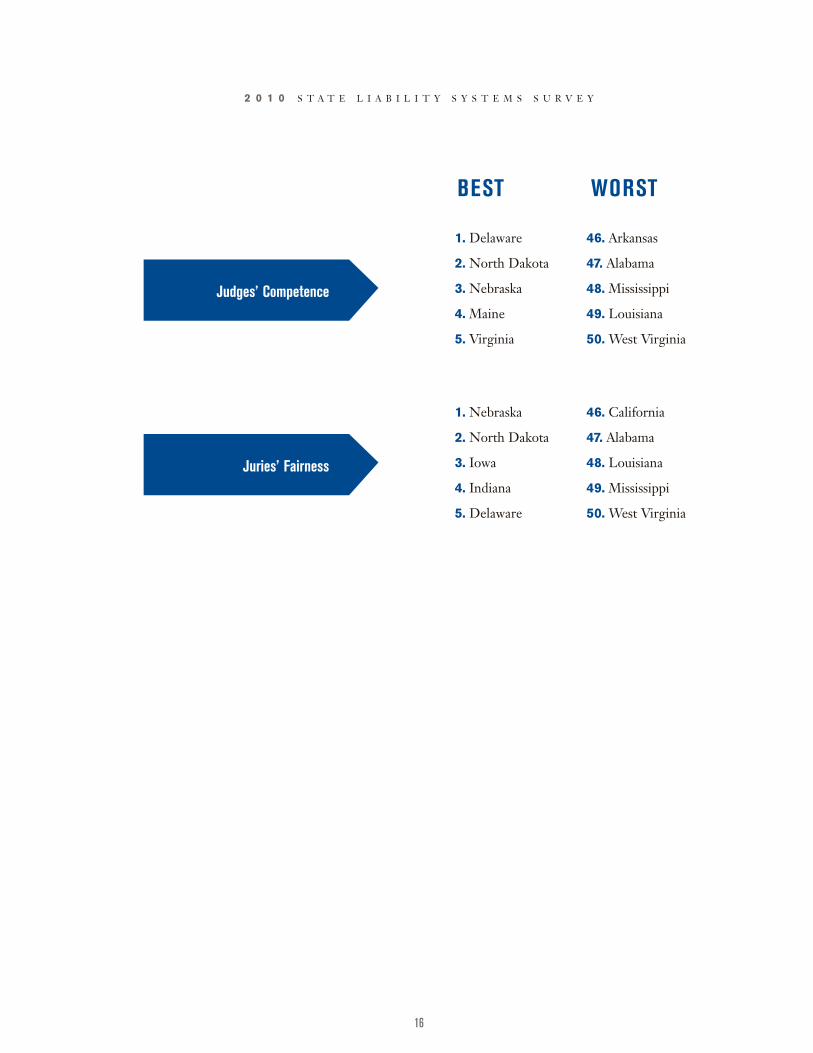
Juries’ Fairness
Judges’ Competence
16
2 0 1 0 S T A T E L I A B I L I T Y S Y S T E M S S U R V E Y
17
2 0 1 0 S T A T E L I A B I L I T Y S Y S T E M S S U R V E Y
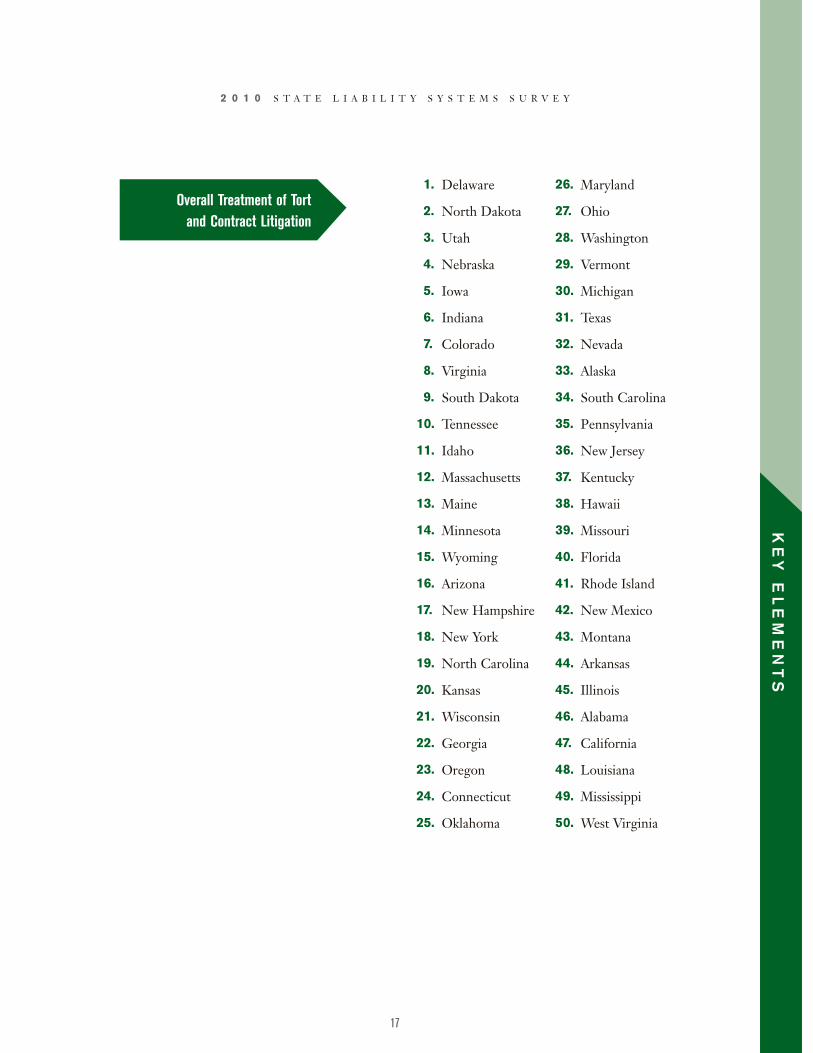
Overall Treatment of Tortand Contract Litigation
KE
YE
LE
ME
NT
S
1.
2.
3.
4.
5.
6.
7.
8.
9.
10.
11.
12.
13.
14.
15.
16.
17.
18.
19.
20.
21.
22.
23.
24.
25.
26.
27.
28.
29.
30.
31.
32.
33.
34.
35.
36.
37.
38.
39.
40.
41.
42.
43.
44.
45.
46.
47.
48.
49.
50.
Delaware
North Dakota
Utah
Nebraska
Iowa
Indiana
Colorado
Virginia
South Dakota
Tennessee
Idaho
Massachusetts
Maine
Minnesota
Wyoming
Arizona
New Hampshire
New York
North Carolina
Kansas
Wisconsin
Georgia
Oregon
Connecticut
Oklahoma
Maryland
Ohio
Washington
Vermont
Michigan
Texas
Nevada
Alaska
South Carolina
Pennsylvania
New Jersey
Kentucky
Hawaii
Missouri
Florida
Rhode Island
New Mexico
Montana
Arkansas
Illinois
Alabama
California
Louisiana
Mississippi
West Virginia
18
2 0 1 0 S T A T E L I A B I L I T Y S Y S T E M S S U R V E Y
Having and Enforcing MeaningfulVenue Requirements
1.
2.
3.
4.
5.
6.
7.
8.
9.
10.
11.
12.
13.
14.
15.
16.
17.
18.
19.
20.
21.
22.
23.
24.
25.
26.
27.
28.
29.
30.
31.
32.
33.
34.
35.
36.
37.
38.
39.
40.
41.
42.
43.
44.
45.
46.
47.
48.
49.
50.
Delaware
Iowa
Indiana
Virginia
Arizona
North Carolina
Utah
Nebraska
Massachusetts
North Dakota
Colorado
New York
Kansas
Tennessee
Minnesota
Ohio
Nevada
Oklahoma
Michigan
Connecticut
Georgia
Maine
Missouri
Wisconsin
Oregon
Maryland
Wyoming
Pennsylvania
New Jersey
Idaho
South Dakota
Hawaii
Washington
Texas
New Hampshire
New Mexico
Vermont
Florida
Alaska
Rhode Island
South Carolina
Kentucky
Montana
California
Illinois
Alabama
Arkansas
Louisiana
Mississippi
West Virginia
19
2 0 1 0 S T A T E L I A B I L I T Y S Y S T E M S S U R V E Y
Treatment of Class Action Suitsand Mass Consolidation Suits
KE
YE
LE
ME
NT
S
1.
2.
3.
4.
5.
6.
7.
8.
9.
10.
11.
12.
13.
14.
15.
16.
17.
18.
19.
20.
21.
22.
23.
24.
25.
26.
27.
28.
29.
30.
31.
32.
33.
34.
35.
36.
37.
38.
39.
40.
41.
42.
43.
44.
45.
46.
47.
48.
49.
50.
Delaware
Nebraska
Indiana
Utah
Virginia
Iowa
North Dakota
Tennessee
Wyoming
Massachusetts
Maine
Arizona
Colorado
Georgia
North Carolina
New York
Minnesota
Ohio
Michigan
Kansas
Oregon
Idaho
Texas
New Hampshire
South Dakota
Wisconsin
Washington
Connecticut
Maryland
New Jersey
Pennsylvania
Hawaii
Vermont
Kentucky
Rhode Island
South Carolina
Montana
Missouri
Nevada
Alaska
Florida
Oklahoma
New Mexico
Alabama
Arkansas
Illinois
Mississippi
California
Louisiana
West Virginia
20
2 0 1 0 S T A T E L I A B I L I T Y S Y S T E M S S U R V E Y
Damages
1.
2.
3.
4.
5.
6.
7.
8.
9.
10.
11.
12.
13.
14.
15.
16.
17.
18.
19.
20.
21.
22.
23.
24.
25.
26.
27.
28.
29.
30.
31.
32.
33.
34.
35.
36.
37.
38.
39.
40.
41.
42.
43.
44.
45.
46.
47.
48.
49.
50.
Indiana
Delaware
Nebraska
North Dakota
Iowa
South Dakota
Idaho
Utah
Colorado
New Hampshire
Virginia
Kansas
Maine
Wyoming
Massachusetts
Tennessee
Arizona
Minnesota
North Carolina
Wisconsin
Georgia
Oklahoma
Michigan
New York
Nevada
Vermont
Maryland
Ohio
Washington
Connecticut
Oregon
New Jersey
Missouri
Texas
Hawaii
South Carolina
Kentucky
Pennsylvania
Rhode Island
Alaska
Florida
Montana
New Mexico
Arkansas
Illinois
Alabama
California
Louisiana
Mississippi
West Virginia
21
2 0 1 0 S T A T E L I A B I L I T Y S Y S T E M S S U R V E Y
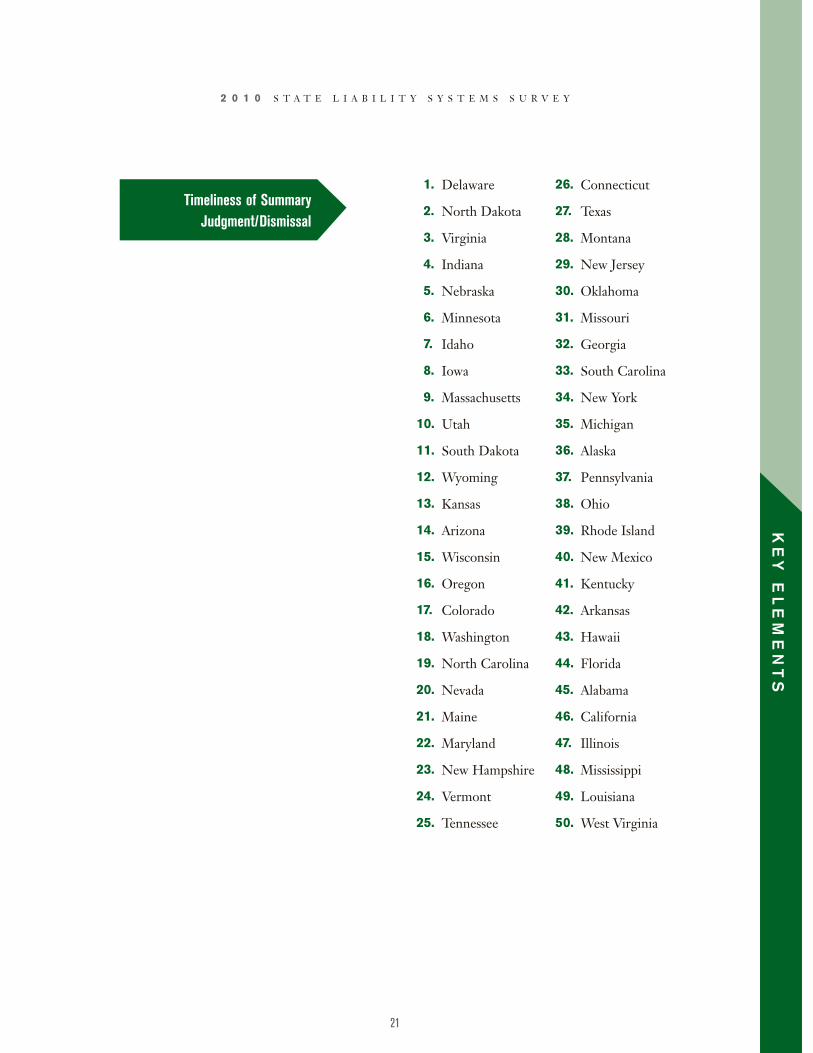
Timeliness of SummaryJudgment/Dismissal
KE
YE
LE
ME
NT
S
1.
2.
3.
4.
5.
6.
7.
8.
9.
10.
11.
12.
13.
14.
15.
16.
17.
18.
19.
20.
21.
22.
23.
24.
25.
26.
27.
28.
29.
30.
31.
32.
33.
34.
35.
36.
37.
38.
39.
40.
41.
42.
43.
44.
45.
46.
47.
48.
49.
50.
Delaware
North Dakota
Virginia
Indiana
Nebraska
Minnesota
Idaho
Iowa
Massachusetts
Utah
South Dakota
Wyoming
Kansas
Arizona
Wisconsin
Oregon
Colorado
Washington
North Carolina
Nevada
Maine
Maryland
New Hampshire
Vermont
Tennessee
Connecticut
Texas
Montana
New Jersey
Oklahoma
Missouri
Georgia
South Carolina
New York
Michigan
Alaska
Pennsylvania
Ohio
Rhode Island
New Mexico
Kentucky
Arkansas
Hawaii
Florida
Alabama
California
Illinois
Mississippi
Louisiana
West Virginia
22
2 0 1 0 S T A T E L I A B I L I T Y S Y S T E M S S U R V E Y
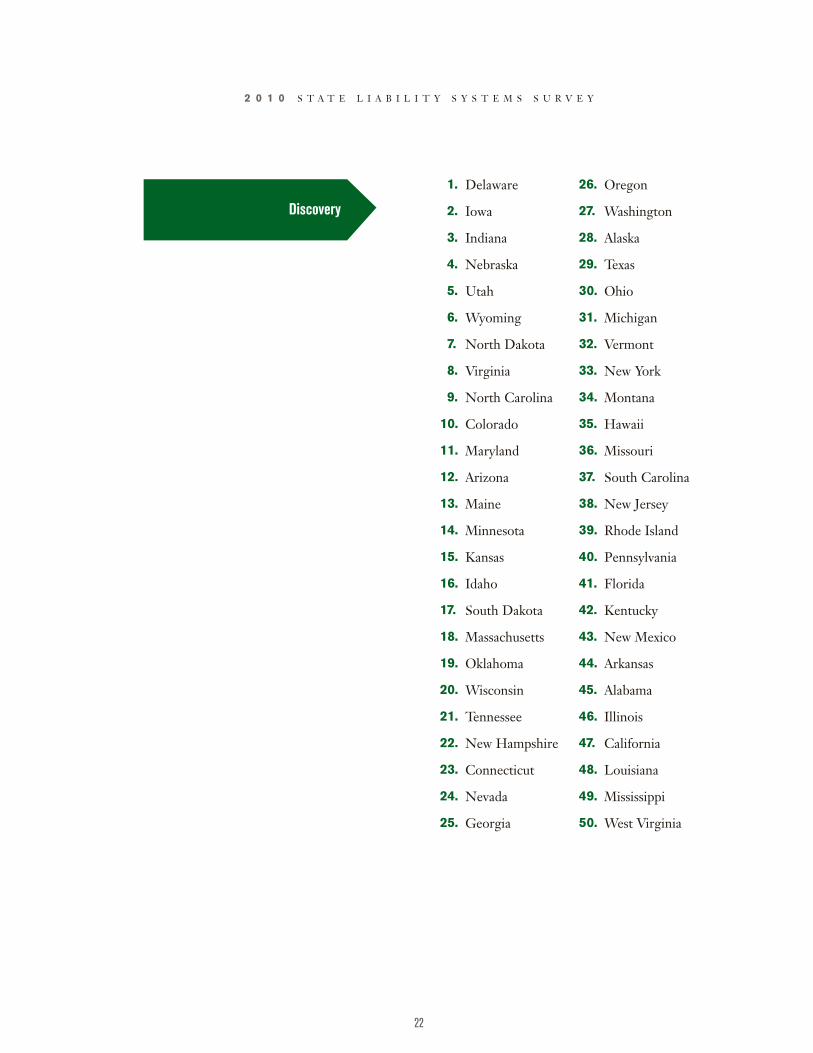
Discovery
1.
2.
3.
4.
5.
6.
7.
8.
9.
10.
11.
12.
13.
14.
15.
16.
17.
18.
19.
20.
21.
22.
23.
24.
25.
26.
27.
28.
29.
30.
31.
32.
33.
34.
35.
36.
37.
38.
39.
40.
41.
42.
43.
44.
45.
46.
47.
48.
49.
50.
Delaware
Iowa
Indiana
Nebraska
Utah
Wyoming
North Dakota
Virginia
North Carolina
Colorado
Maryland
Arizona
Maine
Minnesota
Kansas
Idaho
South Dakota
Massachusetts
Oklahoma
Wisconsin
Tennessee
New Hampshire
Connecticut
Nevada
Georgia
Oregon
Washington
Alaska
Texas
Ohio
Michigan
Vermont
New York
Montana
Hawaii
Missouri
South Carolina
New Jersey
Rhode Island
Pennsylvania
Florida
Kentucky
New Mexico
Arkansas
Alabama
Illinois
California
Louisiana
Mississippi
West Virginia
23
2 0 1 0 S T A T E L I A B I L I T Y S Y S T E M S S U R V E Y
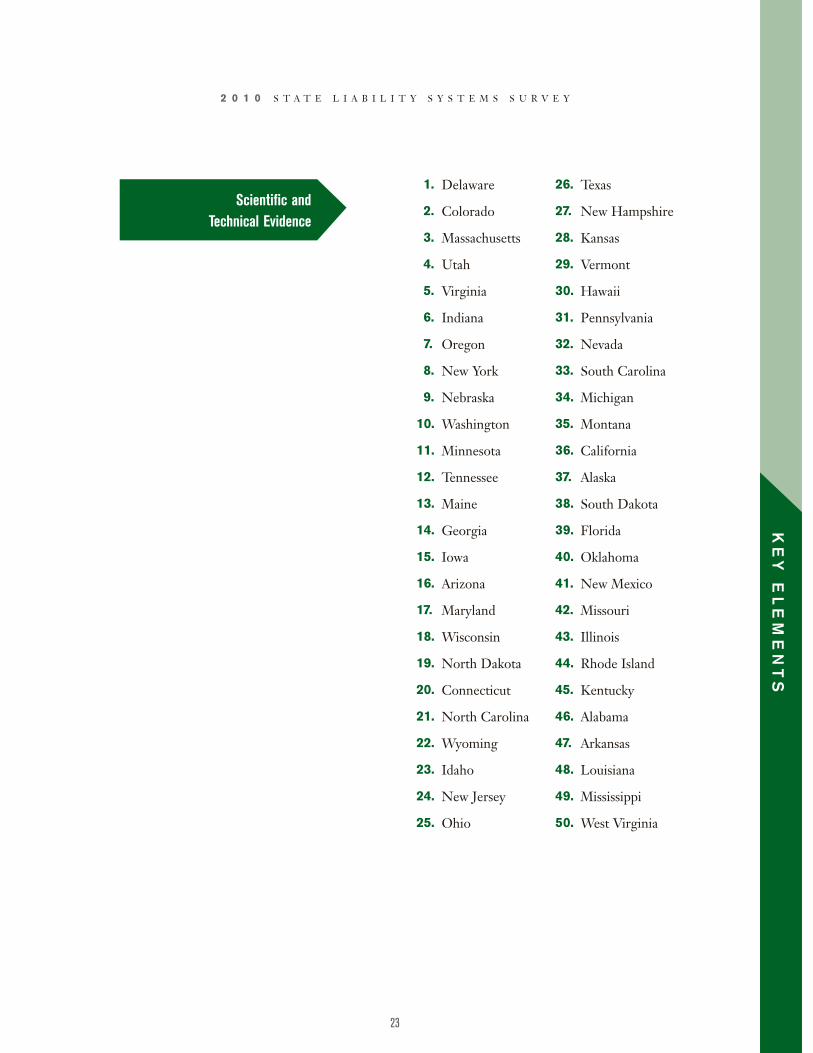
Scientific andTechnical Evidence
KE
YE
LE
ME
NT
S
1.
2.
3.
4.
5.
6.
7.
8.
9.
10.
11.
12.
13.
14.
15.
16.
17.
18.
19.
20.
21.
22.
23.
24.
25.
26.
27.
28.
29.
30.
31.
32.
33.
34.
35.
36.
37.
38.
39.
40.
41.
42.
43.
44.
45.
46.
47.
48.
49.
50.
Delaware
Colorado
Massachusetts
Utah
Virginia
Indiana
Oregon
New York
Nebraska
Washington
Minnesota
Tennessee
Maine
Georgia
Iowa
Arizona
Maryland
Wisconsin
North Dakota
Connecticut
North Carolina
Wyoming
Idaho
New Jersey
Ohio
Texas
New Hampshire
Kansas
Vermont
Hawaii
Pennsylvania
Nevada
South Carolina
Michigan
Montana
California
Alaska
South Dakota
Florida
Oklahoma
New Mexico
Missouri
Illinois
Rhode Island
Kentucky
Alabama
Arkansas
Louisiana
Mississippi
West Virginia
24
2 0 1 0 S T A T E L I A B I L I T Y S Y S T E M S S U R V E Y
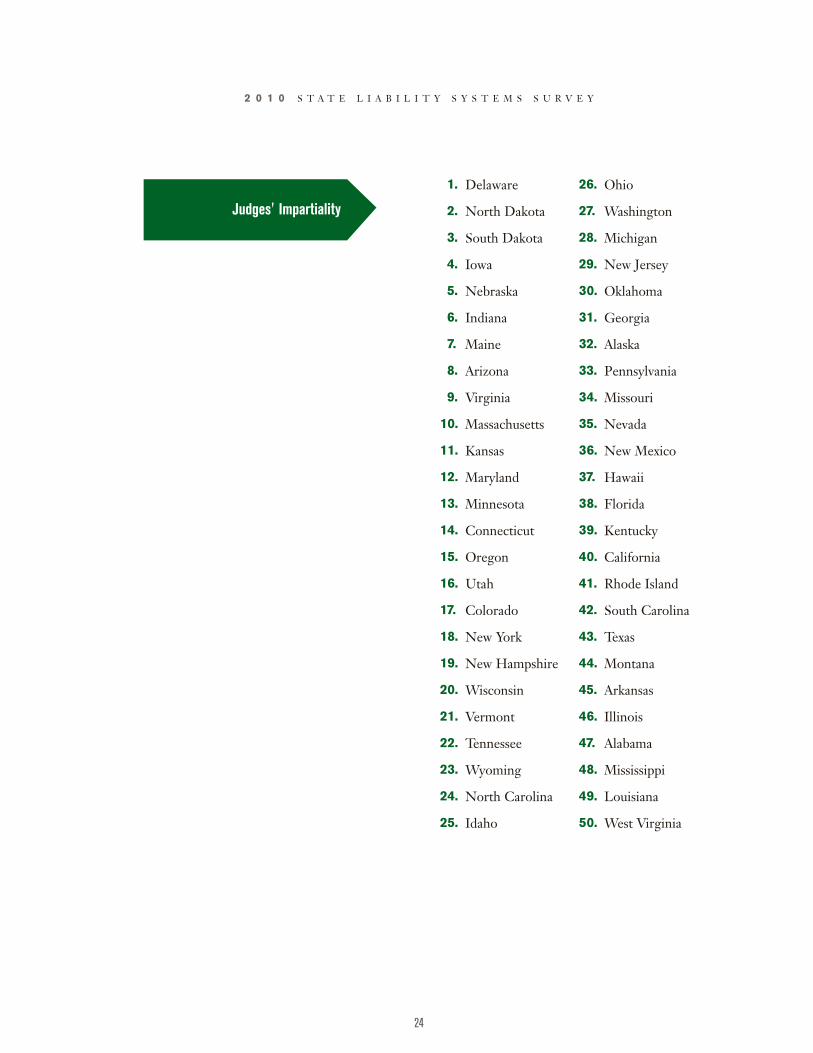
Judges' Impartiality
1.
2.
3.
4.
5.
6.
7.
8.
9.
10.
11.
12.
13.
14.
15.
16.
17.
18.
19.
20.
21.
22.
23.
24.
25.
26.
27.
28.
29.
30.
31.
32.
33.
34.
35.
36.
37.
38.
39.
40.
41.
42.
43.
44.
45.
46.
47.
48.
49.
50.
Delaware
North Dakota
South Dakota
Iowa
Nebraska
Indiana
Maine
Arizona
Virginia
Massachusetts
Kansas
Maryland
Minnesota
Connecticut
Oregon
Utah
Colorado
New York
New Hampshire
Wisconsin
Vermont
Tennessee
Wyoming
North Carolina
Idaho
Ohio
Washington
Michigan
New Jersey
Oklahoma
Georgia
Alaska
Pennsylvania
Missouri
Nevada
New Mexico
Hawaii
Florida
Kentucky
California
Rhode Island
South Carolina
Texas
Montana
Arkansas
Illinois
Alabama
Mississippi
Louisiana
West Virginia
25
2 0 1 0 S T A T E L I A B I L I T Y S Y S T E M S S U R V E Y
Judges' Competence
KE
YE
LE
ME
NT
S
1.
2.
3.
4.
5.
6.
7.
8.
9.
10.
11.
12.
13.
14.
15.
16.
17.
18.
19.
20.
21.
22.
23.
24.
25.
26.
27.
28.
29.
30.
31.
32.
33.
34.
35.
36.
37.
38.
39.
40.
41.
42.
43.
44.
45.
46.
47.
48.
49.
50.
Delaware
North Dakota
Nebraska
Maine
Virginia
Massachusetts
Vermont
South Dakota
Indiana
Minnesota
Connecticut
Washington
Wyoming
Maryland
Utah
North Carolina
Kansas
New Hampshire
Iowa
Colorado
New York
Arizona
Wisconsin
Oregon
Tennessee
Idaho
Georgia
Ohio
Rhode Island
Alaska
Oklahoma
New Jersey
Nevada
Michigan
Pennsylvania
Hawaii
South Carolina
Texas
Missouri
Kentucky
California
Florida
New Mexico
Illinois
Montana
Arkansas
Alabama
Mississippi
Louisiana
West Virginia
26
2 0 1 0 S T A T E L I A B I L I T Y S Y S T E M S S U R V E Y
Juries’ Fairness
1.
2.
3.
4.
5.
6.
7.
8.
9.
10.
11.
12.
13.
14.
15.
16.
17.
18.
19.
20.
21.
22.
23.
24.
25.
26.
27.
28.
29.
30.
31.
32.
33.
34.
35.
36.
37.
38.
39.
40.
41.
42.
43.
44.
45.
46.
47.
48.
49.
50.
Nebraska
North Dakota
Iowa
Indiana
Delaware
South Dakota
Utah
Minnesota
Virginia
Kansas
Oregon
Massachusetts
New Hampshire
Colorado
Maine
Idaho
Wisconsin
Arizona
Connecticut
Washington
Tennessee
Georgia
Wyoming
Vermont
Maryland
North Carolina
Michigan
Nevada
New York
Oklahoma
Rhode Island
Ohio
Pennsylvania
New Jersey
Hawaii
Kentucky
Missouri
Alaska
Montana
Florida
Texas
South Carolina
New Mexico
Arkansas
Illinois
California
Alabama
Louisiana
Mississippi
West Virginia
27
2 0 1 0 S T A T E L I A B I L I T Y S Y S T E M S S U R V E Y
ME
TH
OD
OL
OG
Y
Phone interviews averaging 16 minutes
in length were conducted with a total of
821 respondents and took place between
October 23, 2009 and January 21, 2010.
Online interviews using the same
questionnaire and averaging 14 minutes
in length were conducted with a total of
661 respondents that took place between
October 22, 2009 and January 21, 2010.
The previous research was conducted
during similar time frames in the years
2002-2008. A pilot survey was conducted
in 2009 among 104 respondents to pre-
test and validate the methodology.
Sample DesignFor the telephone sample, a
comprehensive list of general counsel at
companies with annual revenues of at
least $100 million was compiled using
idExec, Dun & Bradstreet, AMI, and
Aggressive List. An alert letter was sent
to the general counsel at each company.
This letter provided general information
about the study, notified them of the
option to take the survey online or by
phone, and told them that an
interviewer from Harris Interactive
would be contacting them to request
The 2010 State Liability Systems Ranking Study was conducted for
the U.S. Chamber Institute for Legal Reform by Harris Interactive.
The final results are based on interviews with a nationally
representative sample of 1,482 in-house general counsel, senior
litigators or attorneys, and other senior executives who are
knowledgeable about litigation matters at public and private
companies with annual revenues of at least $100 million.
28
2 0 1 0 S T A T E L I A B I L I T Y S Y S T E M S S U R V E Y
their participation if they chose not to
take the survey online. The letter
included an 800 number for respondents
to call and schedule a survey
appointment, and it also alerted the
general counsel to a $50 charitable
incentive or check in exchange for
qualified participation in the study.
For the online sample, a representative
sample of general counsel and other
senior attorneys was drawn from the
Association of Corporate Counsel and
LinkedIn. These respondents received an
electronic version of the alert letter,
which included a password-protected
link to take the survey. They were
screened to ensure that they worked for
companies with more than $100 million
in annual revenues.
Sample Characteristics An overwhelming majority (92%) of
respondents were general counsel,
corporate counsel, associate or assistant
counsel or some other senior litigator
or attorney. The remaining respondents
were senior executives knowledgeable
about or responsible for litigation at
their companies. Respondents had an
average of 20 years of relevant legal
experience, including their current
position, and had been involved in or
were familiar with litigation at their
current companies for an average of 8.6
years. Most respondents (82%) were
familiar with or had litigated in the
states they rated within the past three
years. The most common industry
represented was manufacturing,
followed by services.
TelephoneInterviewing ProceduresThe telephone interviews utilized a
computer-assisted telephone
interviewing (CATI) system, whereby
trained interviewers call and immediately
input responses into the computer. This
system greatly enhances reporting
reliability. It reduces clerical error by
eliminating the need for keypunching,
since interviewers enter respondent
answers directly into a computer
29
2 0 1 0 S T A T E L I A B I L I T Y S Y S T E M S S U R V E Y
ME
TH
OD
OL
OG
Y
terminal during the interview itself. This
data entry program does not permit
interviewers to inadvertently skip
questions, since each question must be
answered before the computer moves on
to the next question. The data entry
program also ensures that all skip
patterns are correctly followed. The
online data editing system refuses to
accept punches that are out-of-range,
demands confirmation of responses that
exceed expected ranges, and asks for
explanations for inconsistencies between
certain key responses.
To achieve high participation, in addition
to the alert letters, numerous telephone
callbacks were made to reach
respondents and conduct the interviews
at a convenient time. Interviewers also
offered to send respondents an e-mail
invitation so that respondents could take
the survey online on their own time.
Online Interviewing ProceduresAll online interviews were hosted on
Harris Interactive’s server and were
conducted using a self-administered,
online questionnaire via proprietary
Web-assisted interviewing software.
The mail version of the alert letter
directed respondents to a URL and
provided participants with a unique ID
and password that they were required
to enter on the landing page of the
survey. Those who received an e-mail
version of the alert letter accessed the
survey by clicking on the password-
protected URL included in the e-mail.
Due to password protection, it was not
possible for a respondent to answer the
survey more than once. Respondents
for whom we had e-mail addresses
received an initial invitation as well as
one to two reminder e-mails that were
sent roughly two to three days after
the previous invitation.
Interviewing ProtocolAfter determining that respondents
were qualified, they identified which
states’ liability systems they were
familiar with. Then the respondents
30
2 0 1 0 S T A T E L I A B I L I T Y S Y S T E M S S U R V E Y
were asked to identify the last time they
litigated in or were familiar with the
states’ liability systems. From there,
respondents were given the opportunity
to evaluate the states’ liability systems,
prioritized by most recent litigation
experience. On average, respondents
evaluated three states via telephone and
four states online.
Rating and Scoring of StatesStates were given a grade (A, B, C, D or
F) by respondents for each of the key
elements of their liability systems. The
Overall Ranking of State Liability Systems
table was developed by creating an index
using the grades given on each of the key
elements plus the overall performance
grade. All of the key elements were highly
correlated with one another and with
overall performance. The differences in
the relationship between each element and
overall performance were trivial, so it was
determined that each element should
contribute equally to the index score. To
create the index, each grade across the
elements plus the overall performance
grade were rescaled from 0 to 100 (A =
100, B = 75, C = 50, D = 25, and F = 0).
Then, any evaluation that contained 5 or
more “not sure” or “decline to answer”
responses per state was removed. A total of
6.5% of state evaluations were unusable.
From the usable evaluations, the scores on
the elements were then averaged together
to create the index score from 0 to 100.
The scores displayed in this report have
been rounded to one decimal point.
However, when developing the ranking,
scores were evaluated based on two
decimal points. Therefore, states that
appear tied based upon the scores in this
report were not tied when two decimal
points were taken into consideration.
The scores for states that appear tied
based on one decimal place are
Massachusetts (65.64) and South Dakota
(65.62), Vermont (61.62) and
Washington (61.57), Alaska (56.58) and
Pennsylvania (56.56), and New Mexico
(53.89) and Florida (53.86).
31
2 0 1 0 S T A T E L I A B I L I T Y S Y S T E M S S U R V E Y
ME
TH
OD
OL
OG
Y
For the Ranking on Key Elements, a
score was calculated per element for
each state based on the 0 to 100
rescaled performance grades. The states
were then ranked by their mean scores
on that element.
Reliability ofSurvey PercentagesThe results from any sample survey are
subject to sampling variation. The
sampling variation (or error) that applies
to the results for this survey of 1,482
respondents is plus or minus 2.5
percentage points. That is, the chances
are 95 in 100 that a survey result does
not vary, plus or minus, by more than 2.5
percentage points from the result that
would have been obtained if interviews
were conducted with all persons in the
universe represented by the sample.
Note that survey results based on
subgroups of smaller sizes can be subject
to larger sampling error.
Sampling error of the type so far
discussed is only one type of error.
Survey research is also susceptible to
other types of error, such as refusals to
be interviewed (nonresponse error),
question wording and question order,
interviewer error, and weighting by
demographic control data. Although it is
difficult or impossible to quantify these
types of error, the procedures followed
by Harris Interactive keep errors of these
types to a minimum.
A full copy of the report, including
grades for each state on each of the
key elements, is available at
www.InstituteForLegalReform.com
1615 H Street, N.W. Washington D.C. 20062-2000 P: 202-463-5724 F: 202-463-5302 InstituteForLegalReform.com