80
LA TAP (Tap Water Action Plan): Evaluating the Customer Experience of Tap Water in Los Angeles By: Virdiana Auger-Velez Rachel LaCoe Caleb Rabinowitz Bei Zhao

LA TAP (Tap Water Action Plan):
Evaluating the Customer Experience of Tap Water in Los Angeles
By: Virdiana Auger-Velez
Rachel LaCoe
Caleb Rabinowitz
Bei Zhao

1
Disclaimer
This report was prepared in partial fulfillments for the requirements for the Master in Public Policy
degree in the Department of Public Policy at the University of California, Los Angeles. It was prepared
at the direction of the Department and the Water Foundation as a policy client. The views expressed
herein are those of the authors and not necessarily those of the Department, the UCLA Luskin School
of Public Affairs, UCLA as a whole, or the client.
2
Executive Summary
California’s recent experience with drought and water scarcity has increased consumer concerns on issues of water conservation and quality. For this reason many government, nonprofit, and philanthropic organizations are prioritizing water management in their efforts to increase sustainability, access and cleanliness of supply. The question of water quality is of particular importance in Los Angeles.
The Water Foundation is a non-profit philanthropy working to address these issues in the Western United States.1 As part of their work, they are exploring water quality equity in urban areas of Southern California. The largest provider of that water in the region is the Los Angeles Department of Water and Power (LADWP). As a city-owned water provider, the department is dedicated to providing safe and reliable drinking water to all of its customers.
Water delivered to homes by LADWP is in compliance with all state and federal quality standards; however, inequities in customer experience with tap water persist. While some quality issues are due to external events that cause a temporary increase in contaminants, LADWP insists that most problems are caused by aging or poorly maintained pipes in customer residences, outside of the utility’s responsibility and control.2
Our analysis demonstrates a gap between the public’s perception of tap water and the utility provider’s confidence in the safety of supply. Our recommendations address this gap by analyzing water quality and perception data to develop policy options to improve tap water quality as well as public understanding of tap water safety. Based on our data analysis, qualitative interviews and literature review, we recommend four policy options that will help improve public confidence around water safety.
We address the following policy question in our report:
For LADWP customers that have a negative experience with tap water in their home, what policy
solutions can we recommend to The Water Foundation to mitigate gaps in customer experience?
1 “Who we are.” Waterfdn.org. http://waterfdn.org/who-we-are/ 2 Joe Ramallo, in-person communication, November 14, 2017

3
Glossary
Bottled beverages Bottled beverages refer to bottled water or sugar sweetened beverages.
Contaminants The Safe Drinking Water Act (SDWA) defines contaminant as “any physical, chemical, biological or radiological substance or matter in water. Drinking water may reasonably be expected to contain at least small amounts of some contaminants. Some contaminants may be harmful if consumed at certain levels in drinking water. The presence of contaminants does not necessarily indicate that the water poses a health risk.”3
Filter A device that removes impurities by lowering contamination of water using a fine physical barrier, a chemical process, or a biological process.
Maximum contaminant level(MCL)
The maximum allowable amount of a contaminant in drinking water delivered by a public water system.
Plumbing Any system that conveys fluids for a wide range of applications. Plumbing uses pipes, valves, plumbing fixtures, tanks, and other apparatuses to convey fluids. In our report, plumbing refers to conveyances of utility-provided drinking water.
Residential property A type of leased property, containing either a single family or multifamily structure, that is available for occupation for non-business purposes. Commonly used to signify an owner-occupied residence, even though a rental house is technically a residential property.
Sensory Human senses of color, odor and taste for the purposes of evaluating water quality.
Tap water Water supplied to a tap or faucet with uses that include drinking, washing, cooking, and the flushing of toilets.
Utility provider A public or private organization providing a community with water, power, gas, electricity, or some combination of the former.
3 Definition Of "contaminant".Epa.gov. https://www.epa.gov/ccl/definition-contaminant

4
Acronyms
CAM Criteria-alternative matrix
CWS Community Water System
CDC Center for Disease Control
EBMUD East Bay Municipal Utility District’s
EPA United States Environmental Protection Agency
IBWA International Bottled Water Association
LADWP Los Angeles Department of Water and Power
MCL Maximum contaminant level
MWA Macon Water Authority
MWD Metropolitan Water District
NGO Non-Governmental Organization
NTNCWS Non-Transient Non-Community Water System
QLI Los Angeles County Quality of Life Index
SES Socioeconomic status
TNCWS Transient Non-Community Water System

5
Acknowledgments
Professor Manisha Shah, Advisor
The Water Foundation: Alex Paxton and Juliet Christensen
LADWP Water Quality Division Team, including Albert Gastelum,
Jonathan Leung, Houri Mandjikian and Ku Chung
The Luskin Center for Innovation
Professors: JR DeShazo, Gregory Pierce, John Villasenor
Public Policy Department Reviewers: Isaac Bryan, Sarah Burtner, Yuharu Nagiri, Alvin Teng
Additional Reviewers & Support: Paula Daniels, Adan Ortega, Joseph Ramallo, Monika Shankar
Spousal Support: Lisa Walldez
Paws for Applause: Lucie Windle, Maven Walldez-Rabinowitz, Mocha & Junebug(Alien) LaCoe
6

7
Table of Contents
Introduction ............................................................................................................................ 8
Chapter 1: Client & Policy Problem .......................................................................................... 9
Chapter 2: Background .......................................................................................................... 12
Chapter 3: Literature Review ................................................................................................. 16
Chapter 4: Quantitative Analysis ........................................................................................... 23
Chapter 5: Policy Options ...................................................................................................... 33
Chapter 6: Evaluative Criteria ................................................................................................ 37
Chapter 7: Evaluation of Policy Options ................................................................................. 40
Chapter 8: Prioritization of Policy Recommendations ............................................................ 48
Chapter 9: Sensitivity Analysis ............................................................................................... 53
Chapter 10: Conclusion .......................................................................................................... 57
Appendix 1: Water Management Structure in Los Angeles .................................................... 62
Appendix 2: U.S. EPA MCLs versus LADWP MCLs ................................................................... 63
Appendix 3: LADWP Service Area .......................................................................................... 67
Appendix 4: Water Management in Los Angeles .................................................................... 68
Appendix 5: Data & Methods ................................................................................................ 70
Appendix 6: CAM Tables ........................................................................................................ 77

8
Introduction
Increased media attention on water scarcity and quality issues in the United States and Canada have led some to question the safety of utility-provided tap water. Government officials claim to take water quality very seriously and state that drinking water is safe for human consumption. Despite government assurance on the safety of tap water, many people lack trust in official statements regarding water quality and refuse to drink tap water.4
Research into North American consumption patterns shows frequent use of alternatives to tap water, including bottled water and water treatment devices. In survey responses, people express concern over the quality and safety of the municipal water supplied to their homes. Some people describe their tap water as “bad-tasting,”5 others say they can “see things floating around in it,”6 and one person was so dissatisfied she “wouldn't even let her cats drink it.”7 In Los Angeles, experts estimate 50-80% of LADWP consumers do not trust the quality of their tap water, despite data indicating that water provided within its service area is as safe or safer than bottled water.8 For low-income households, this lack of confidence in tap water safety is particularly concerning: the price of LADWP water is half a cent per gallon, compared to an average of $1.22 per gallon of bottled water.9
Public mistrust of tap water has led many people to either only drink bottled water or drink water alternatives (soda, juice, coffee, etc.) that contain high amounts of sugar. Not only are tap water alternatives often less healthy, they also require substantially more energy, water, and (for plastics) petroleum derivatives. Substituting from tap water to bottled alternatives has the potential to create large scale negative effects on both public health and environmental sustainability.
4 Lucy Schouten. 2016. “Most Americans don't drink (or trust) tap water: Should they?” The Christian Science Monitor, March 5th, 2016. https://www.csmonitor.com/Environment/2016/0305/Most-Americans-don-t-drink-or-trust-tap-water-Should-they 5 Ibid. https://www.csmonitor.com/Environment/2016/0305/Most-Americans-don-t-drink-or-trust-tap-water-Should-they 6 Lex Talamo. 2016. “East Mooringsport customer: 'I don't trust this water'.” The Times, Dec.13th, 2016. http://www.shreveporttimes.com/story/news/2016/12/13/east-mooringsport-customer-dont-trust-water/85260338/ 7 Ibid. 8 Jonathan Lung, in-person communication, December 19, 2017 . 9 Cota-Robles, M. (2017, April 11). LA tap water as clean as bottled water; LADWP report finds. Retrieved from http://abc7.com/1861985/

9
Chapter 1: Client & Policy Problem
Current research indicates that a lack of consumer knowledge about the water system contributes to concerns about water quality and safety. In Los Angeles, these concerns are exacerbated by the complex system of water management and regulation. Without accessible information about the water system, many residents rely on personal perception to judge the safety of their tap water. Often, decisions about safety are based on sensory qualities of the water, such as color, smell and taste, rather than empirical testing.10
The Los Angeles Department of Water and Power Annual Quality Report demonstrates compliance with all federal and state regulations for water safety.11 Overall, LADWP has reported very few water quality issues over the past decade, and is - as required by law - transparent about where and when these violations have occurred.12 Available customer complaint data and associated water quality sampling from fiscal years 2016 and 2017 verify LADWP’s claims of providing safe drinking water to its customers in most instances.
Despite testing that demonstrates water meets safety regulations in LADWP’s service area, some customers report dissatisfaction with their tap water. One survey conducted in 2017 found that an overwhelming number of residents (87%) in the Jordan Downs public housing project in Watts reported
10 Jardine, Cynthia G., Nancy Gibson, and Steve E. Hrudey. "Detection of odour and health risk perception of drinking water." Water Science and Technology 40, no. 6 (1999): 91-98. 11 Los Angeles Department of Water and Power (2016) 2016 Drinking Water Quality Report 12 Ibid.

10
having brown or murky tap water.13 All residents surveyed in that study indicated that they purchase single-use bottled water, large containers of bottled water, or use a water-delivery service for their drinking and cooking needs.14 This is particularly alarming, as all residents housed in Jordan Downs are low-income and/or otherwise qualify for public housing. Substituting away from tap water to purchased alternatives increases the cost of poverty for these individuals. This is not a unique story to Jordan Downs - customer complaint data from LADWP shows multiple isolated reports of discolored or “dirty” water coming out of the tap. Even if water quality testing does not reveal dangerous levels of contaminants, most people are reluctant to drink water if it comes out of the tap discolored or with an unpleasant taste or smell.
We also recognize that there are individuals who do not feel comfortable drinking water out of their tap due to individual preferences or a perception that their water is not safe, despite appearing clean and testing evidence that demonstrates otherwise. While we are not as concerned with individuals who self-select away from using tap water and do not face financial constraints by purchasing alternatives, we believe our policy solutions can encourage broader public consumption of tap water by ensuring all customers have access to user-friendly information about water quality and safety.
Our project aims to close the gap between available information that shows water is safe throughout LADWP’s service area and consumers who do not drink tap water. We address this issue by determining if there is a problem with water safety or cleanliness (i.e. water tests safe, but displays sensory qualities that are undesirable). If LADWP tap water is safe to consume without additional treatment, we will offer policy options to provide a more uniform customer experience with tap water across the service area and encourage public consumption of safe, clean tap water.
We also provide a roadmap for future research to the Water Foundation and other Luskin applied policy project teams. Due to the limited availability of qualitative and empirical research in this area, we believe there is a significant need for continued study and innovative, intersectional approaches to the outlined policy problems.
Policy Question
For LADWP customers that have a negative experience with tap water in their home, what policy
solutions can we recommend to the Water Foundation to mitigate gaps in customer experience?
13Jordan Downs Health Needs Assessment, Preliminary Findings. Jordan Downs Health Summit. Presented on June 3, 2017. 14 Ibid.
11
Our Client
The Water Foundation is a nonprofit philanthropy dedicated to exploring solutions for better water management in the Western United States. Their mission is to “help funders identify and act on opportunities to better manage water and engage in thoughtful, strategic grantmaking to nonprofit partners to drive change.”15 Through strategic city, county, and statewide partnerships, the Water Foundation aims to bring innovative, creative solutions to address water concerns and meet needs. Their partners come from many sectors, including business groups, conservation NGOs, agricultural organizations, municipal water utilities, environmental justice groups, and local, state and federal agencies.
One of the Water Foundation’s strategic priorities is to “provide safe and clean drinking water for California households that currently lack it.”16 They also want to improve water efficiency and conservation standards in cities across California. These two areas overlap with the scope and policy focus of our project. Currently, the Water Foundation is exploring the safety of drinking water in California’s Central Valley communities that face contamination from agricultural runoff. While they are interested in expanding to water quality in urban communities, they have not yet launched a similar initiative in this area.
By determining geographic or other correlates of poor sensory water quality in Los Angeles and policy options to address gaps in tap water experience, this report seeks to identify targets for action and advocacy for the Foundation. Our project addresses urban water quality issues in the context of assessing an equitable water experience for customers, and offers solutions that require an intersectional, collaborative approach. This fits perfectly with the Water Foundation’s role as a grantmaker and partnership builder. Additionally, implementation of our policy recommendations will require a great deal of acumen and expertise with the legislative system and political climate in California. This is another area where the Water Foundation has significant experience, as they have been able to successfully advocate for policy change across the state. Our future research recommendations will provide a framework for continued study and policy change in this area.
15 “Who we are.” Waterfdn.org. http://waterfdn.org/who-we-are/ 16 Ibid.
12
Chapter 2: Background
Safe Drinking Water Act
The Safe Drinking Water Act (SDWA) of 1972 (amended in 1986 and 1996) is a Federal law that protects drinking water supplies across the United States and applies to all water actually or potentially designed for drinking water use in a public water system.17 The Act defines a “public water system” as one that provides “water for human consumption through pipes or other constructed conveyances to at least 15 service connections or serves an average of at least 25 people for at least 60 days a year.”18 The need for such regulation came from a nationwide study of community water systems, which found that water quality related health risks resulted from poor operating procedures, inadequate infrastructure, and negligent management of water supplies in communities of all sizes (see Appendix 1).19
17 Office of Water (4606). 2004. “Understanding the Safe Drinking Water Act.” EPA 816-F-04-030. www.epa.gov/safewater. www.epa.gov/safewater. 18 US EPA, OW. 2015. “Information about Public Water Systems.” Collections and Lists. US EPA. September 21, 2015. https://www.epa.gov/dwreginfo/information-about-public-water-systems. 19 Tiemann, Mary. "Safe Drinking Water Act: Implementation and Issues." Congressional Research Service, Library of Congress, 2003.

13
The SDWA authorized the Environmental Protection Agency to establish federal standards through National Primary Drinking Water Regulations. These regulations set enforceable primary maximum contaminant levels (MCLs) or mandatory treatment methods for removing such contaminants for all public water systems.20 In addition to creating primary MCLs, the act created a federal-state agreement which allows states and tribes to take primary enforcement and implementation authority (primacy) for drinking water programs.21 California has primary enforcement responsibility for public water systems in the State.
Water Management in Los Angeles
Persistent drought, water shortages, and access issues across the state prompted California to become the first state in the nation to establish a human right to water with Assembly Bill 685. The bill added Section 106.3 to the state water code, which reads “every human being has the right to safe, clean, affordable, and accessible water adequate for human consumption, cooking, and sanitary purposes.”22 In addition to leading the way in establishing drinking water access, California has established state MCLs that are more stringent than those created by the EPA. For a comparison of state and federal MCLs, see Appendix 2. Despite progressive state-level water policy, most decision-making power for water-related issues remains at the local level.23
In Los Angeles County, there are 228 public and private agencies responsible for fulfilling the human right to water for more than one million residents.24 Los Angeles County is primarily served by small private water systems, small mutual water
20 Office of Water (4606). 2004. “Understanding the Safe Drinking Water Act.” EPA 816-F-04-030. www.epa.gov/safewater. www.epa.gov/safewater. 21 Tiemann, Mary. "Safe Drinking Water Act: Implementation and Issues." Congressional Research Service, Library of Congress, 2003. 22 “Human Right to Water | California State Water Quality Control Board.” 2018. .gov. March 16, 2018. https://www.waterboards.ca.gov/water_issues/programs/hr2w/. 23Stephanie Pincetl, Madelyn Glickfeld, Deborah Cheng, Miriam Cope, Kartiki Naik, and Erik Porse, Kristen Holdworth, and Celine Kuklowski (2015). Water Management in Los Angeles County; a Research Report. Presented to the John Randolph Haynes and Dora Haynes Foundation. UCLA Institute of the Environment and Sustainability. 24 Deshazo, J. R., and H. McCann. "Los Angeles County Community Water System Atlas and Policy Guide, Volume I." UCLA Luskin Center for Innovation, Los Angeles, CA (2015).
Figure 1: Onus of Pipe Maintenance and Replacement

14
systems, and municipal water systems.25 In the City of Los Angeles, the utility that delivers both water and power to customers is LADWP. A map of LADWP’s service area and additional information on water management in Los Angeles can be found in Appendices 3 and 4. Our report focuses exclusively on the residential experience with tap water in LADWP’s service area, due to availability of data. LADWP is responsible for water quality issues upstream of a consumer’s water meter, before the service line crosses the residential property line (see figure 1). While the water provided to LADWP customers is below mandated MCL levels, poorly maintained infrastructure on the residential side of the service line may lead to quality and cleanliness issues at the tap.
Negative Externalities of Tap Water Substitutes
Despite stringent national and state level drinking water quality regulations, 50-80% of Los Angeles residents do not drink their tap water. Empirical and anecdotal evidence indicates that consumers substitute to bottled beverages (bottled water or sugar sweetened beverages) when they distrust their tap water. Bottled beverages may offer consumers a convenient and seemingly low-cost alternative to tap water; however, environmental, as well as individual and community health consequences drive up the true cost of bottled beverages.
Bottled water production is much more energy intensive than tap water. Water bottle production requires 17 million barrels of water annually; this number increases to 50 million if the energy used to pump, process, and transport bottled water is taken into account.26 Bottled water production can require up to 2,000 times more energy than what is required to produce tap water.27 Additional environmental burdens come from the resources required to discard empty bottles. In the US more than 75% of these single-use bottles are discarded in landfills; when bottles are recycled, the carbon impact from the bottle’s life is only reduced by 10%.28
Substituting away from tap water has additional and disproportional negative health impacts. Mistrust in tap water quality and consumption of sugar sweetened beverages are higher among low-
25 Ibid. 26 Schriever, Norm. 2013. “Plastic Water Bottles Causing Flood of Harm to Our Environment.” Huffington Post (blog). July 29, 2013. https://www.huffingtonpost.com/norm-schriever/post_5218_b_3613577.html.
27 Zyga, Lisa. 2009. “How Much Energy Goes Into Making a Bottle of Water?” How Much Energy Goes Into Making a Bottle of Water? March 17, 2009. https://phys.org/news/2009-03-energy-bottle.html.
28 Patrick, Katie. 2016. “21 Reasons Why Plastic Bottles Ruin Everything: Recycling Won’t Fix It, Zero Waste Will.” Huffington Post (blog). November 17, 2016. https://www.huffingtonpost.com/katie-patrick/21-reasons-why-plastic-bo_b_12848918.html.

15
income non-Hispanic blacks and Mexican Americans.29 Research indicates an association between mistrust in the safety of local tap water and low intake of plain water among all non-whites, leading to negative health outcomes (e.g., obesity, poor mental health, type 2 diabetes).30 Substituting to sugar sweetened beverages has additional negative health impacts including higher rates of cavities and dental disease.31
29 CDC. 2017. “Sugar Sweetened Beverage Intake.” Centers for Disease Control and Prevention. April 7, 2017. https://www.cdc.gov/nutrition/data-statistics/sugar-sweetened-beverages-intake.html. 30 Onufrak, Stephen J., Sohyun Park, Joseph R. Sharkey, and Bettylou Sherry. "The relationship of perceptions of tap water safety with intake of sugar-sweetened beverages and plain water among US adults." Public health nutrition 17, no. 1 (2014): 179-185. 31 “Selling The Health Benefits Of Denver’s Tap Water — After Flint.” 2016. NPR.org. February 13, 2016. https://www.npr.org/sections/health-shots/2016/02/13/466109816/selling-the-health-benefits-of-denvers-tap-water-after-flint.

16
Chapter 3: Literature Review
Our recommendations are based in part on a comprehensive literature review of scholarly sources, news articles, government, and industry reports which allowed us to develop a framework for understanding the current environment of tap water quality and perception in Los Angeles. Whenever possible, we used available quantitative data from LADWP and the City of LA to support our qualitative analysis; when unavailable, we used information from other municipalities in California or similar metropolitan areas.
Our literature review addresses the following key themes related to water in Los Angeles:
● What physical properties of water affect a person’s perception of safety?
● What socioeconomic or geographic factors affect perceptions of water quality?
● What factors influence public trust of water safety?
● What have other cities done to mitigate customer concerns over water safety?

17
Physical Properties of Water that Affect Perception of Safety
Empirical evidence demonstrates that most residential users of tap water rely on personal perception of water safety and physical properties of water to make decisions about use.32 Individuals often abstain from drinking or using their tap water if it is discolored or presents a bad taste and/or smell.33 One qualitative study conducted in Ontario, Canada, showed that water having a brown tint, presenting a strong chlorine taste, and foul odor were the most common reasons users chose not to drink their tap water.34 From this survey, over half of the participants opted to rely mostly on bottled water or used a water treatment device as an alternative to tap water.35
Another study conducted in Canada determined that foul odor and color were often associated with perceived health risks of consuming tap water.36 Among individuals who cited bad taste or smell as reasons for switching to alternative water sources (or, in some cases, boiling water prior to consumption), 67-90% of them believed that their tap water was unsafe.37 This is congruent with anecdotal evidence from water health experts and customers, which makes it clear that sensory perception of water often influences the choice to either drink or not drink tap water.
The same study demonstrated that there is an inconsistent relationship between customer perception of water safety and actual health risks from high contaminant levels.38 Data on 59 separate potential contaminants showed that most consumers cannot determine when there is an overabundance of a contaminant based on taste or smell alone.39 Interviews conducted with members of LADWP’s Water Quality Division further support this point. “It’s what you can’t see or taste that can kill you,” one quality manager said.40
Sociodemographic Factors that Affect Perception of Tap Water Safety
In addition to sensory properties of water, socioeconomic and geographic factors can affect an individual’s likelihood to trust the overall safety of tap water. Overwhelmingly, lower socioeconomic
32 Jones, Andria Q., Catherine E. Dewey, Kathryn Doré, Shannon E. Majowicz, Scott A. McEwen, David Waltner-Toews, Spencer J. Henson, and Eric Mathews. "A qualitative exploration of the public perception of municipal drinking water." Water Policy 9, no. 4 (2007): 425-438. 33 Ibid. 34 Ibid. 35 Ibid. 36 Jardine, Cynthia G., Nancy Gibson, and Steve E. Hrudey. "Detection of odour and health risk perception of drinking water." Water Science and Technology 40, no. 6 (1999): 91-98. 37 Ibid. 38 Ibid. 39 Ibid. 40 Jonathan Lung, in-person communication, December 19, 2017

18
status is associated with a host of negative conditions: higher rates of crime, lower performing schools, increased levels of air, water, and soil pollution, older housing stock, and poorer public health. These factors may directly or indirectly be linked to perception of tap water; while not a strong determinant, demographic factors can be related to risk perception, trust in utility provider, and detection of sensory qualities of water.41 In certain areas of Los Angeles, anecdotal evidence demonstrates these may be associated with lower levels of overall satisfaction with tap water.
The public housing project in Jordan Downs provides a micro-level environment where socioeconomic status interacts with known air pollutants, soil and groundwater contamination, and higher incidences of negative health conditions like asthma and heart disease.42 In this community, only five percent of residents surveyed state that they trust the safety of their tap water.43 While our report does not focus exclusively on tap water quality in public housing projects, these are similar to results of other studies that demonstrate a lower satisfaction of tap water and/or higher self-reporting of foul colored, tasting, or smelling water in communities with lower socioeconomic factors.
Factors that Influence Public Trust of Tap Water Safety
Existing literature and anecdotal evidence show that public trust in tap water safety is closely related to overall trust in the utility provider. One study that was conducted in regions where tap water overwhelmingly tests as safe concluded that higher levels of substitution away from utility-delivered water are an indicator of overall lower levels of trust in government institutions.44 Further, most utility providers do not take sufficient steps to address this lack of trust, therefore perpetuating or aggravating public opinion.
Most residential users of water do not consume information provided by their utility company (either due to lack of access, interest, or complexity) beyond their water bill. This leads to lower levels of information about water quality, but also the water utility itself. This lack of knowledge about spending and testing practices can lead some consumers to have lower levels of trust in the provider.45
41 de França Doria, Miguel. "Factors influencing public perception of drinking water quality." Water policy 12, no. 1 (2010): 1-19. 42 Jordan Downs Health Needs Assessment, Preliminary Findings. Jordan Downs Health Summit. Presented on June 3, 2017. 43 Ibid. 44 Parag, Yael, and J. Timmons Roberts. "A battle against the bottles: building, claiming, and regaining tap-water trustworthiness." Society and Natural Resources 22, no. 7 (2009): 625-636. 45Jones, Andria Q., Catherine E. Dewey, Kathryn Doré, Shannon E. Majowicz, Scott A. McEwen, David Waltner-Toews, Spencer J. Henson, and Eric Mathews. "A qualitative exploration of the public perception of municipal drinking water." Water Policy 9, no. 4 (2007): 425-438.

19
Many water agencies engage in predominantly reactive forms of communication, which means customers are regularly only receiving negative information about their tap water.46 Incidences of actual water contaminant violations can have a significant impact on public trust and perceived levels of safety of drinking water. When there are bacterial outbreaks or other types of contamination that are communicated to the public, customer trust in the safety of tap water typically declines.47 Infrequent or inaccurate information exacerbates these concerns, as in the case with the City of Maywood, California.48 Customers discovered that while the utility was providing annual drinking water quality reports, they were actually recycling old testing data which falsely presented the water as safe to drink.49 These incidents further violate public trust, and make it difficult for the utility to regain a positive image among consumers.
Lack of information in the systems that deliver municipal water, along with poor or infrequent communication, contribute to a heightened perception of risk among customers.50 That sense of risk interacts strongly with overall trust in the safety of delivered water, and the public utility as a whole.51
Learning From Other Utilities
Limited consumer knowledge about water system management contributes to water quality and safety concerns in Los Angeles. Without accessible and easily digestible utility-level water quality information, many residents rely on media and other sources of information to judge the safety of their tap water. Increased information sharing through web based platforms has increased public awareness of serious water safety issues, such as the inexcusable system failures in Flint, Michigan. While this type of information sharing is critical in resolving water quality issues, it can be detrimental to water systems that provide safe drinking water to their customers.
For many utilities, residential customers are the lifeblood of their operations. When customers decide to substitute away from utility-provided tap water, there is less revenue available for necessary distribution and quality-monitoring infrastructure. This is particularly true for LADWP, as it is the largest municipally owned and operated water retailer in the United States and is subject to public control and
46 Shovlin, Marjorie G., and Sandra S. Tanaka. "Risk communication in Los Angeles: a case study." Journal (American Water Works Association) (1990): 40-44. 47 Jones, Andria Q., Catherine E. Dewey, Kathryn Doré, Shannon E. Majowicz, Scott A. McEwen, David Waltner-Toews, Spencer J. Henson, and Eric Mathews. "A qualitative exploration of the public perception of municipal drinking water." Water Policy 9, no. 4 (2007): 425-438. 48 Community Member Panel. “At the Tap Water Conference.” Los Angeles, California. February 20, 2018. 49 Ibid. 50 Anadu, Edith C., and Anna K. Harding. "Risk perception and bottled water use." American Water Works Association. Journal 92, no. 11 (2000): 82. 51 Ibid.

20
regulation. A number of water utilities have sought to combat issues of public trust through innovative programs that address both quality issues and gaps in consumer knowledge.
DC Water
DC water faced a public health crisis in 2001 when the utility’s decision to switch from Chlorine to Chloramine as a treatment chemical led to premature pipe corrosion and a spike in lead far above the federal action level.52 Adding insult to injury, news reports revealed that DC Water and the EPA failed in their duties to quickly inform the public of the health risk and adequately respond to the problem. Since the incident, DC water has taken several steps to improve safety and regain public trust. In an interview with The Washington Post, George S. Hawkins, general manager of DC Water, was quoted as saying “We certainly learned from it, and now we have a very advanced [lead] control system in place. [Since 2010] DC Water has been as safe or even more safe in terms of lead than other U.S. cities with lead pipes.”53
Actions taken by DC Water include:
● Distribution of more than 30,000 free water filters
● Creation of an interactive lead service line map searchable by DC residents
● Free annual lead testing for residential customers
● Income-eligible grants for replacing lead service lines on residential property
NYC Water
New York has a reputation for having the ‘champagne of tap water’; however, NYC Water does not rely on its reputation alone to convince residential customers of its benefits. NYC Water partnered with several city agencies for a perception campaign designed to encourage residents to drink more tap water and to educate them on the impact of bottled alternatives on both the environment and the city’s water infrastructure.54
Campaign initiatives include:
● A custom NYC Water branded reusable water bottle
52 Shaver, Katherine, and Dana Hedgpeth. 2016. “D.C.’s Decade-Old Problem of Lead in Water Gets New Attention during Flint Crisis.” Washington Post, March 17, 2016, sec. Local. https://www.washingtonpost.com/local/dcs-decade-old-problem-of-lead-in-water-gets-new-attention-during-flint-crisis/2016/03/17/79f8d476-ec64-11e5-b0fd-073d5930a7b7_story.html. 53 Ibid. 54 “About NYC Water Campaign.” n.d. NYC.gov. Accessed March 20, 2018. http://www.nyc.gov/html/nycwater/html/about/about.shtml.

21
● Seasonal portable water fountains in all five boroughs
● A mobile app including hours of operation, maps, and directions to the nearest water fountain
Denver Water
Similar to other large metropolitan water districts, Denver has a large population of recent immigrants who lack trust in utility-provided tap water and instead substitute to sugar sweetened beverages.55 To combat the negative health impacts of such substitutions, the Delta Dental of Colorado Foundation partnered with the community group Westwood Unidos for an education campaign targeted at Latino communities. The aim of the campaign is to let these communities know that their tap water is safe and clean.56 The campaign is supported by Denver Water, the state’s largest water utility, which hosted a tour of Denver’s water infrastructure for a group of community leaders, pastors, and educators in the largely Latino community of Westwood.57 In addition to the education campaign, the utility has taken steps to improve communication with the public.
Communication and outreach efforts include:
● Contributions to and sponsorship of external organizations
● Water connections for special events and water trailers for large outdoor events
● A Speaker’s Bureau that provides free speakers on water topics
● Public and private group tours of Denver Water treatment plants
London On Tap
In 2007, Thames Water and the Mayor of London launched the ‘London On Tap’ campaign to highlight the negative impacts of bottled water use on climate change and the environment.58 In 2008, the campaign narrowed its focus to shifting public perception by addressing the stigma around ordering tap water in restaurants. To do so, the campaign launched a carafe challenge that highlighted local
55Daley, John. 2016. “Selling The Health Benefits Of Denver’s Tap Water — After Flint.” NPR.org. February 13,2016. https://www.npr.org/sections/health-shots/2016/02/13/466109816/selling-the-health-benefits-of-denvers-ta -water-after-flint.
56 Ibid. 57 Ibid. 58 Sahakian, Marlyne, and Harold Wilhite. "Making practice theory practicable: Towards more sustainable forms of consumption." Journal of Consumer Culture 14, no. 1 (2014): 25-44.

22
designers. By focusing on the social norms around ordering tap water, the campaign was able to reduce bottled water consumption by eight percent.59
Macon Water Authority
Macon Water Authority (MWA) provides water to the metropolitan area of Macon, Georgia and surrounding Bibb County. MWA utilizes public-private partnerships to address real and perceived water cleanliness issues. In 2017 the utility formed The Macon Water Alliance, a non-profit subsidiary designed to facilitate partnerships with organizations and individuals in the community and industry.60 The aim of the Alliance is to “chang[e] lives, minds, and the environment” through its partnerships.61
Partnership initiatives include:
● MWA employees working with Rebuilding Macon, Inc. to provide free in-home plumbing repairs to low-income MWA customers
● Hosting an MWA Kids Fishing Derby in partnership with the Georgia Department of Natural Resources
● Supporting local Adopt-A-Stream trainings by providing test kits and equipment to volunteers
● Public education on the importance of source water protection through participation in Macon’s Annual River Cleanup
59 Ibid.
60 “Water Quality Report 2017.” 2017. Macon Water Authority. http://www.maconwater.org/pdf/MWA%202017%20WQR%20FINAL%20Proof.pdf.
61 Ibid.

23
Chapter 4: Quantitative Analysis
Data Sources & Collection
Based on existing research of water quality issues, we focused our quantitative analysis on determining the extent and nature of both perception of water safety in LADWP’s service areas and measured quality. We used a combination of public polling, internal utility data on complaints and quality sampling, publicly available demographic socioeconomic data, and data on the age, value and transaction history for residential properties in our area of interest. Through a series of regression models, we developed an understanding of the interrelationships between perceived water quality and demographic, geographic and property characteristics, as well as the relationships between measured water quality and temporal, geographic, physical and selected socioeconomic and demographic characteristics.

24
Table 1: Data Sources
Dataset Name Source Data Years
Los Angeles Department of Water and Power Water Quality Complaints and Testing Results
LADWP 2016-2017
Los Angeles County Quality of Life Index
UCLA Luskin School of Public Affairs & FM3 Consulting
2017
2016 ACS 5-Year Estimates U.S. Census Bureau 2016-2017
LA County Assessor Database Los Angeles County Office of the Assessor Online Property Database
2016
CalEnviroScreen 3.0 California Environmental Protection Agency, Office of Environmental Health Hazard Assessment
2017
Using Water Quality Complaint data provided by LADWP, we examined reports from 2016 to 2017, including 2,157 individual complaints. Over the two years of data, customers reported from 1 to 7 problems (including requests for water testing) per call, with 95% reporting 2 or 3 issues.
Hypotheses
We tested the following four hypotheses:
1. Delivered water in the LADWP service area meets federal and state regulations for safety.
2. There is a difference in water quality between in-home tests and supply side tests.
3. Older homes are more likely to experience lower water quality.
4. Individuals with lower socioeconomic status and non-white Angelenos are less satisfied with their water.
25
Hypothesis 1: Delivered Water in the LADWP Service Area Meets Federal & State Standards for Safety.
To begin, we addressed the question of whether the LADWP service area water supply meets federal and state safety regulations. While system-wide drinking water quality testing has shown no ongoing MCL violations, we sought to examine the at-the-tap experience of people in LADWP’s service area. LADWP customers can email or call the main customer service phone number to report a water quality concern. At that time, in addition to reporting any quality issues, customers can request that LADWP conduct a free water quality inspection at their home. Sampling data collected from these site visits gives us a unique opportunity to look beyond the system-level tests to the water quality within the homes of people in many different parts of Los Angeles.
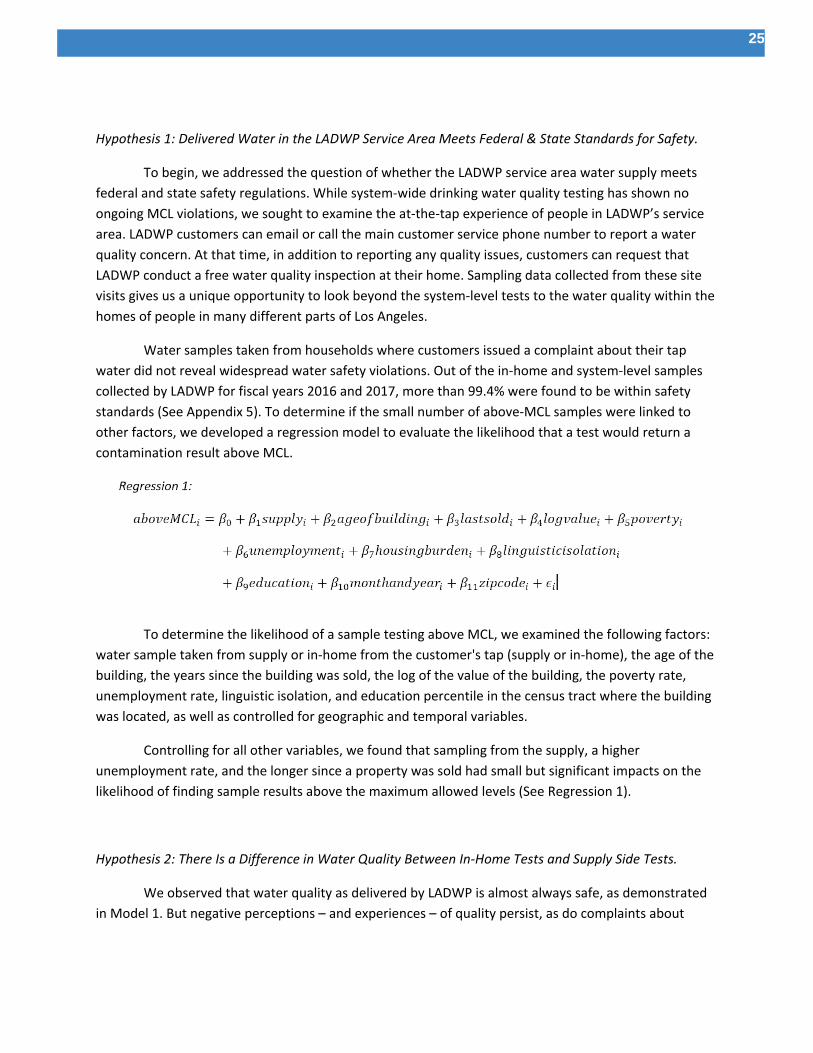
Water samples taken from households where customers issued a complaint about their tap water did not reveal widespread water safety violations. Out of the in-home and system-level samples collected by LADWP for fiscal years 2016 and 2017, more than 99.4% were found to be within safety standards (See Appendix 5). To determine if the small number of above-MCL samples were linked to other factors, we developed a regression model to evaluate the likelihood that a test would return a contamination result above MCL.
To determine the likelihood of a sample testing above MCL, we examined the following factors: water sample taken from supply or in-home from the customer's tap (supply or in-home), the age of the building, the years since the building was sold, the log of the value of the building, the poverty rate, unemployment rate, linguistic isolation, and education percentile in the census tract where the building was located, as well as controlled for geographic and temporal variables.
Controlling for all other variables, we found that sampling from the supply, a higher unemployment rate, and the longer since a property was sold had small but significant impacts on the likelihood of finding sample results above the maximum allowed levels (See Regression 1).
Hypothesis 2: There Is a Difference in Water Quality Between In-Home Tests and Supply Side Tests.
We observed that water quality as delivered by LADWP is almost always safe, as demonstrated in Model 1. But negative perceptions – and experiences – of quality persist, as do complaints about

26
water quality. To further examine the differences between in-home tests and supply-side tests, we looked at the minimum detection levels for contaminants as tested through the water quality inspections. Developing this model allowed us to examine whether the interior pipes in a home play any role in the water quality experience at the tap.
To determine the likelihood of detection of contaminants, we examined the following factors: supply or in-home, the age of the building, the years since the building was sold, the log of the value of the building, the poverty rate, unemployment rate, linguistic isolation, and education percentile in the census tract where the building was located, as well as controlled for geographic and temporal variables.
Our model demonstrated that sampling inside the home rather than at the water supply increases the likelihood of detecting contaminants by about 2.2 percentage-points, controlling for all other variables (See Regression 2). This finding indicates that the problem in contamination detected at the tap – while still below MCL safety standards – is higher for water that has passed through in-home piping, and that by the time the water reaches the tap, it may have picked up some additional contaminants.
Hypothesis 3: Older Homes are More Likely to Experience Lower Water Quality.
Replacing plumbing inside a home is an extremely costly renovation, and one that homeowners and landlords are unlikely to commit to without urgent reasons, such as leaks or other plumbing failures. To gain a rough estimate of the age of the pipes in the buildings, we used the age of the home, controlling as well for new renovations that might have taken place due to recent sales. We also know that a median home in Los Angeles was built in 1953 – compared to 1977, for the rest of the United States (See Appendix 5). We suspect that the age of the home may have an impact on the number of complaints about water quality, possibly through the mechanism of older pipes or fixtures.

27
In Models 1 and 2, we did not find that the age of the home had significant effects on the measured water quality. However, a third model we developed allowed us to estimate the relationship between the complaints themselves and the home age, value and how recently it had been sold.
Controlling for the physical location by using the property ZIP code, we found that individuals living in older properties, those that had been sold a longer time ago, and those that were more valuable were more likely to report complaints about water quality to LADWP (See Regression 3).
Our results from Model 3 give us increasing confidence that the key intervention point in improving water quality and the experience of water quality lies inside the homes and buildings of people in Los Angeles. The greater number of complaints from older properties and from properties that have not been sold for a longer time suggest that the age of interior pipes may play a role in perceptions of water quality. The greater number of complaints from higher-valued properties also points to the challenges facing residents of disadvantaged communities, who may be less likely to complain across a wide range of issues, including water quality.
Hypothesis 4: Individuals with Lower Socioeconomic Status and non-White Angelenos Are Less Satisfied with their Water.
For a snapshot of the overall satisfaction with tap water quality, we looked to The Los Angeles County Quality of Life Index (QLI), a poll conducted by FM3 Consulting for the UCLA Luskin School of Public Affairs. The QLI asked several questions relating to satisfaction with tap water quality, in addition to detailed demographic information. The 2017 poll surveyed a representative sampling of LA County residents made up of 1,747 individuals, including 828 LA City residents.
The poll found that overall, LA City residents were less satisfied with their water than those living in the rest of the County (See Appendix 5). We developed a fourth regression model to test our hypothesis that race, sex, SES status, education and tenancy could have an impact on the perception of water quality.
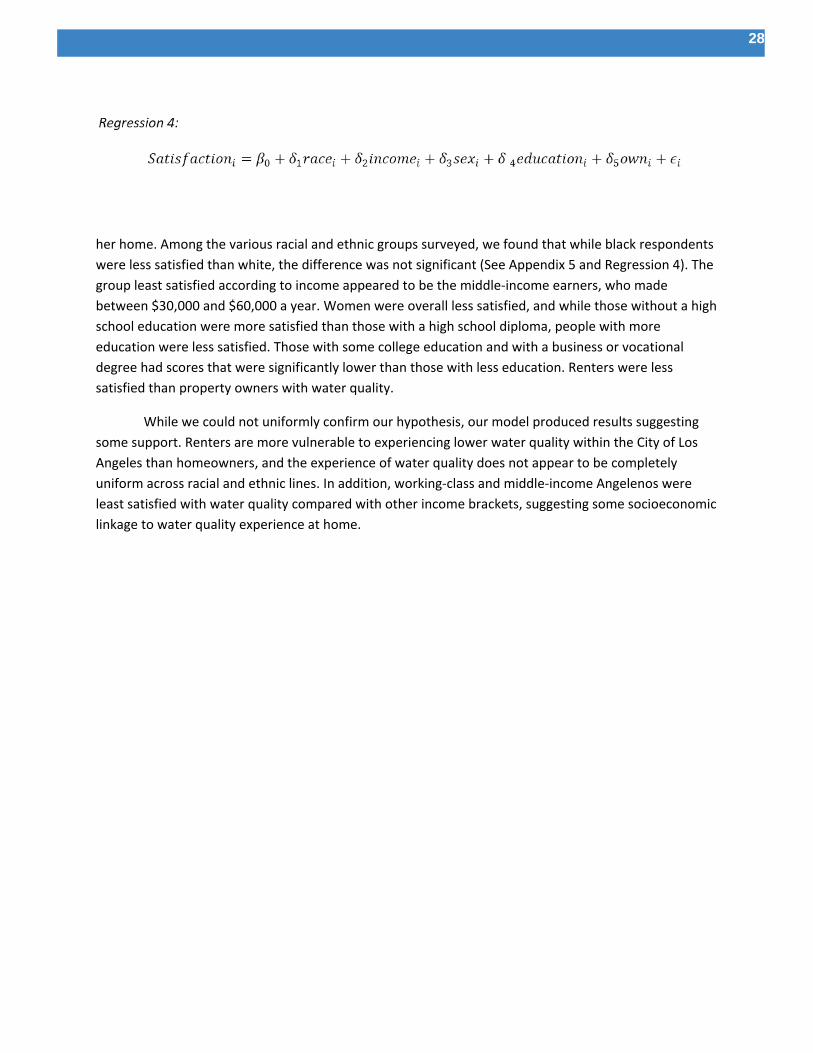
We examined the outcome of satisfaction, from 1 to 10, with water quality, dependent on race or ethnicity, income level, sex, education level, and whether or not the individual owns or rents his or
28
her home. Among the various racial and ethnic groups surveyed, we found that while black respondents were less satisfied than white, the difference was not significant (See Appendix 5 and Regression 4). The group least satisfied according to income appeared to be the middle-income earners, who made between $30,000 and $60,000 a year. Women were overall less satisfied, and while those without a high school education were more satisfied than those with a high school diploma, people with more education were less satisfied. Those with some college education and with a business or vocational degree had scores that were significantly lower than those with less education. Renters were less satisfied than property owners with water quality.
While we could not uniformly confirm our hypothesis, our model produced results suggesting some support. Renters are more vulnerable to experiencing lower water quality within the City of Los Angeles than homeowners, and the experience of water quality does not appear to be completely uniform across racial and ethnic lines. In addition, working-class and middle-income Angelenos were least satisfied with water quality compared with other income brackets, suggesting some socioeconomic linkage to water quality experience at home.

29
Table 2: Regression Output Summary
Model 1
MCL Compliance Model 2
Detection Model 3
Complaints Model 4
Satisfaction Supply 0.00369** 0.0217*
-0.00146 -0.0113 Age of Structure 2.29E-06 0.000169 2.41e-05*** -6.36E-05 -0.000431 -2.35E-06 Years Since Last Sold 0.000134* -0.00015 0.000102*** -7.62E-05 -0.000849 -7.75E-06 Log of Property Value -0.000241 0.00334 0.00200*** -0.000905 -0.0127 -0.000141 Poverty Rate -0.000147 -0.000519
-0.000124 -0.00121 Unemployment Rate 0.00134*** -0.00374 -0.000462 -0.00354 Linguistic Isolation Rate 0.000213 0.00126 -0.000222 -0.00243 Education Percentile -0.000145 0.000189 -0.000107 -0.00106
Race/Ethnicity
Latino 0.44 -0.278 Black 0.357 -0.434 Korean -1.275 -1.114 Chinese 0.0377 -0.801 Filipino 2.048*** -0.742 Other API 0.316 -0.622 Other -0.978 -0.639 Mixed Race -0.375 -1.061 DK/Refuse 0.243 -0.703
Income
<$30,000 0.53 -0.337 $60,001-$90,000 0.00521 -0.371 $90,000-$120,000 0.0288 -0.403 $120,001-$150,000 1.127** -0.552

30
Model 1
MCL Compliance Model 2
Detection Model 3
Complaints Model 4
Satisfaction >$150,000 0.248 -0.467 DK/Refuse 0.309 -0.362
Female -0.774***
-0.213
Education
Grades 1-8 1.443* -0.741 Grades 9-11 0.113 -0.601 Some College -1.025*** -0.386 Business or Vocational School -1.548*** -0.53 College Graduate -0.282 -0.368 Post-Grad/Professional -0.224 -0.468 Don't Know -1.531 -1.007
Rent -0.799*** -0.265 Don't Know 0.00795 -0.503
Constant 1.000*** 0.614*** -0.0280*** 5.125*** -0.0182 -0.216 -0.0018 -1.244 Controls ZIP Code Fixed Effects Yes Yes Yes Yes Observations 6,371 6,371 714,965 752 R-squared 0.054 0.056 0.003 0.24 Robust standard errors are below coefficients; *** p<0.01, ** p<0.05, * p<0.1

31
Relevance of Quantitative Analysis
The results of our quantitative analysis strongly support our findings from the literature review. For customers in the LADWP service area who recorded a complaint, there are differences in perception of tap water based on a variety of factors. Specifically, we found that:
1. There are differences in water quality between in-home and supply-side tests. Sampling inside of the home increases the likelihood of detecting contaminants, indicating that the pipes within the home through which water is delivered have some effect on tested water quality at the tap.
2. Individuals who live in older homes, or houses that have not been sold for a long time are more likely to file a water quality complaint with LADWP. There are more complaints from individuals living in properties of higher value. These results show that age and value of a property have an effect on an individual’s likelihood to file a complaint, validating our assumption that customer experience of tap water in Los Angeles is affected by factors in the home.
3. There are some socioeconomic factors that impact a customer’s satisfaction with delivered tap water in LADWP’s service area. Based on our analysis of the Quality of Life Survey respondents, renters and working-class/middle-income Angelenos are less satisfied with their tap water than other groups. Additionally, water satisfaction differs across race, ethnicity and gender.
These findings lead us to determine that while water may test safe, other factors have an effect on an individual’s perception of tap water cleanliness and quality in Los Angeles. Our policy recommendations are therefore aimed at not only ensuring ongoing safe and clean water delivery, but also at resolving gaps between customer perception of delivered water and water quality test results, especially for individuals who experience lower satisfaction with their water at the tap. As there are some differences in customer experience based on socioeconomic factors, education efforts may be most effective if geared specifically for target audiences. Additionally, our recommendations include solutions that will mitigate water cleanliness issues for individuals experiencing them at home.

32
Limitations
Los Angeles is the largest city in LA County, and LADWP – the municipal water provider for the City – is the largest in the state. Of the 10 million residents of Los Angeles County, LADWP serves over 4 million.62 Sixty percent of LA County residents do not receive water service from LADWP, and our data on the quality of water supplied to and within residences does not directly address the broader question of water quality County-wide.
We limited our analysis of the water quality test results to events with pairs of in-home and supply-side samples, dropping events where multiple in-home samples were conducted. In addition, we restricted our sample to sites where we were confident a good geocoding match for census tracts existed. For the physical structure examination, we restricted our sample to residential buildings in Los Angeles, and those where ZIP codes were reliably recorded. Most importantly, our data from LADWP represents a non-random sampling of individuals and households who have selected into our analysis by taking the affirmative step of complaining to DWP. In addition, the individuals had to provide access to their homes to DWP inspectors to be members of our sampling group. Expert interviews and qualitative research indicates that marginal communities, such as undocumented and mixed-status households, are less likely to file formal complaints. Our data is unable to capture individuals who have water quality concerns but are unable or feel uncomfortable expressing these concerns.
A non-trivial number of DWP inspection addresses (545) did not appear in the LA County Assessor’s database. This may be due to data entry errors (in either database or in this team’s cleaning), or due to restrictions in the County Assessor data universe examined (non-residential locations).
Finally, although we find significant (albeit small) effects, R-squared values for regressions developed are small, suggesting that unexamined variables may explain more variation in our sample than our variables of interest.
62 “Facts & Figures,” accessed January 20, 2018, https://www.ladwp.com/ladwp/faces/ladwp/aboutus/a-water/a-w-factandfigures?_adf.ctrl-state=5a77ln23p_4&_afrLoop=1086343356544126.

33
Chapter 5: Policy Options
Our literature review, interviews, and quantitative analysis suggest four policy options for the Water Foundation’s consideration. We believe that these options represent robust solutions to solve disparities in customer experience with tap water and increase overall public education and trust in water safety. It is important to choose recommendations that capture the Water Foundation’s goal of providing clean and safe water to Angelenos, along with the interests of stakeholders. Water cleanliness affects multiple aspects of urban life, and our policy recommendations must consider those impacts.
Policy Option 1: Point-of-Sale Updates to Residential Plumbing
While LADWP offers in home testing to customers, they have no authority to regulate plumbing quality or upkeep on private property. The Water Foundation’s ongoing experience successfully navigating legislative advocacy around water quality and access represents a powerful opportunity to address a root cause of urban water quality failure: residential plumbing. Policy options that could incentivise property owners to update and maintain plumbing are well-aligned with the Foundation’s mission to develop long-term solutions to water challenges.
Currently, California Civil Code requires the disclosure of the presence of lead-based paint and other environmental hazards when a real property of 1 to 4 dwelling units is transferred by any option

34
to purchase.63 We propose expanding this legislation to mandate that homes with plumbing that tests for elevated contaminants be upgraded or replaced at the point of sale. This has the advantage of splitting the true replumbing cost between current and future owners; however, a potential consequence of such regulation is the inability to sell older homes due to the high cost of replumbing.
Policy Option 2: Point-of-Use Filters for LADWP Customers
In-home point-of-use water treatment devices can offer customers a low-cost solution to water quality issues resulting from old or poorly-maintained plumbing. LADWP water quality control officials support the use of in-home point-of-use filtration devices and expressed their willingness to provide them to customers in their service area at little to no cost.64
Point-of-use water treatment varies in type and price, but all versions are designed to filter small amounts of water at the “point” (or faucet) where water is used for consumption. Point-of-use water treatment is proven to significantly reduce traditionally monitored organic and inorganic contaminants.65 While point-of-use filtration has mixed effects on improvements to the sensory qualities of water (e.g., odor, taste, color), it can be effective in eliminating harmful contaminants from residential plumbing issues.66
This option would place the cost burden on LADWP, who would provide point-of-use filters to customers in its service area. Filters would be sent to customers upon request, as well as distributed at specific community events and engagement activities. Information on proper maintenance would be included with provided filters, and LADWP would mail out replacements per the required timeline. LADWP would have control over selecting the type of filter given to the consumer; they would likely select a low cost option that might not satisfy all customer complaints over water cleanliness issues.
Although The Water Foundation seeks long term solutions for Los Angeles residents experiencing unclean tap water, point-of-use treatment may play a valuable role in improving LADWP customers’ overall satisfaction with their tap water.
63Bae, Hyunhoe. "The impact of the residential lead paint disclosure rule on house prices: findings in the American Housing Survey." Journal of Housing and the Built Environment 31, no. 1 (2016): 19-30. 64 Joe Ramallo, in-person communication, November 14, 2017 65 Brown, K. W., Gessesse, B., Butler, L. J., & MacIntosh, D. L. (2017). Potential Effectiveness of Point-of-Use Filtration to Address Risks to Drinking Water in the United States. Environmental health insights, 11, 1178630217746997. 66 Ibid.
35
Policy Option 3: Persuasion & Education Campaign throughout Los Angeles
Despite the limited body of research on perception and behavior change in relation to tap water, most evidence points to the need for both factual information and shifts in social norms. An effective education campaign will incorporate hard facts about the benefits of drinking tap water, including the staggering cost of substituting tap water for bottled beverages. Additionally, messaging should capture cross-cultural and socioeconomic differences in order to appeal to Los Angeles’s diverse audiences.
We propose an education and marketing campaign aimed at removing perception-based biases associated with drinking tap water. The goal of the education campaign will be to emphasize the quality and safety of the tap water supply and increase awareness about the health and environmental benefits of choosing tap water over bottled water or other substitutes. We recommend that such efforts focus on increasing public awareness, community engagement, and transparency through an integrated social and traditional media campaign. Public trust in water utilities, including LADWP, has proven to be low, so it is unlikely that customers will believe water quality information provided directly by the utility. As a neutral third party, the Water Foundation could play a key role by partnering with organizations (e.g. Physicians for Social Responsibility and East Yard Communities for Environmental Justice) to disseminate information about water quality.
Policy Option 4: Water Quality Cost Callout in Utility Bill
A final proposed solution is a change in the information included in consumers’ water bills. This option would be modeled after the East Bay Municipal Utility District (EBMUD) WaterSmart Home Report, which indicates to consumers how they compare to other residents’ water use. The EBMUD report includes a call to action about water conservation, and social-norm messaging about comparison households.
The Water Quality and Safety Bill Report would be an ongoing way to communicate with consumers about LADWP’s performance on its water safety and quality efforts. By including a visual representation (i.e. a partially-filled water drop) of the percentage of a user’s water cost that is going toward different categories such as water quality, infrastructure, delivery, and conservation efforts, the revamped water bill would increase transparency to improve public trust in the utility and consumer knowledge on water cost.

36
LADWP could deploy a random assignment of this bill addendum, including links to existing water quality data and reports, and the proposed water quality education materials. Along with water quality surveys, tracking visits to the included sites could allow ongoing measurement of the bill structure’s efficacy.
Figure 2: EBMUD Water Bill Example

37
Chapter 6: Evaluative Criteria
To analyze our proposed policy alternatives, we have established a set of four evaluative criteria that will allow us to narrow options and decide between potential alternatives. These criteria reflect the scope of our policy problem and are intended to effectively differentiate between policies based on concrete principles. Rather than include a separate criterion for efficacy, our combined criteria will give us an overall indication of effectiveness for each policy option. It was important to select criteria that captured the Water Foundation’s policy goals, the varied interests of stakeholders, and robust impact of our policy options.
Regarding our weighted criterion, we assigned values primarily on the Water Foundation’s mission and policy goals. We believe that equity is the most closely aligned criterion with the strategic priority “to provide safe and clean drinking water for California households that currently lack it,”67 and thus we assign it the highest weight in our analysis. Costs to consumer also interact strongly with this objective, as households must be able to afford our policy recommendations to achieve cleaner drinking water. It therefore receives our second-highest weight. Political feasibility is the next highest ranking criterion. For any of our policy recommendations to be achievable, we must have some degree of confidence in the Water Foundation’s ability to partner with LADWP and the City of Los Angeles to implement them. Lastly, we assign our lowest rank to scalability. Because recommendations in this
67 “Who we are.” Waterfdn.org. http://waterfdn.org/who-we-are/

38
report only address households within LADWP’s service area, we are not as concerned with scalability of solutions at this time. Additionally, the Water Foundation is mostly interested in regional approaches to water cleanliness issues; therefore, we do not view scalability outside of the City of Los Angeles as a priority to our client.
Table 3:Summary of Criteria
Summary of Criteria
Criterion Weight Highest Score For
Equity
0.4 Uniform Water Cleanliness Across Service Area
Costs
0.3 Lowest Costs to Consumer
Political Feasibility
0.2 Water Foundation Could Easily Gain Support from LADWP to Implement
Scalability
0.1 Ease of Implementation Across Service Area (Includes Costs to Provider)
Equity
We evaluate equity in the context of achieving a uniform water experience across all zip codes in LADWP’s service area, regardless of socioeconomic differences. Policy alternatives will be scored according to their ability to improve water cleanliness for customers that have low satisfaction with tap water. Thus, policy options that work to increase public trust in tap water, and can curb unnecessary spending from purchasing bottled alternatives will be most desirable. We will also assess racial equity, as measured by overall ranked satisfaction with tap water from the LA County Quality of Life Index. We can measure water cleanliness by the level of secondary contaminants physically being filtered out, as well as sensory qualities of water (taste, odor, color).

39
Costs
We define this criterion as cost to consumer. Since we propose that mitigating water cleanliness issues is more cost prohibitive for lower-income residents, we will weigh cost to consumer as an important measure of policy efficacy. Selected policies should be cost-effective for low-income residents, and not cost-prohibitive. Common alternatives to tap water from perceived or actual poor water quality are costs borne by the consumer, and thus our policy alternatives should lessen this burden.
Political Feasibility
Feasibility is defined as the ability for the Water Foundation to convince LADWP and the City of Los Angeles to implement proposed recommendations. For LADWP, it will be important to maintain an image that conveys absolution of liability for low customer experience with tap water, and also demonstrate intent to appease public concern. Education or persuasion campaigns and re-structuring the water bill would be initiatives taken on by LADWP, and thus their interest in and ability to implement these proposals are important considerations. The City of Los Angeles would have to support and approve any policy recommendations that focus on required landlord maintenance of piping, and point-of-sale inspections for homes; therefore, a discussion of political feasibility from the City’s perspective will also be relevant to our analysis. Both players have a vested interest in conveying a commitment to public health, safety, and satisfaction with tap water for residents, which we will also consider when assessing feasibility.
Scalability
Certain solutions will be easier to expand throughout the service area than others. A compact, point-of-use carbon filter is certainly easier to transport and install than changing or upgrading piping. Costs, ease of transportation, availability of materials, and public interest will all factor into this criteria.
We will also consider scalability to mean whether our proposed policies can be expanded to other parts of LA County. For this part of the analysis, the Water Foundation can provide a key role in providing recommendations, identifying partner organizations, providing grants to nonprofits working in this field, and working with legislators on statewide policy initiatives. While our project does not focus on areas outside of the LADWP service area, we can consider the Water Foundation’s ability to continue this research and work with partners to implement some of our recommendations beyond the LA region.

40
Chapter 7: Evaluation of Policy Options
We utilize a weighted criteria-alternative-matrix (CAM) as our primary method of evaluating the effectiveness of our proposed policy options. Our CAM is a useful tool, considering some of our criteria are not easily quantified into cost. Overall, this will help us ensure that we are not skewing our analysis toward one specific criterion and are evaluating each independently. We have opted not to do a cost-effectiveness analysis - as our client, the Water Foundation, would not be incurring any direct costs for implementation of our policy recommendations beyond providing community-based grants.
All options were measured on a 1 to 4 scale for fit where a 1 is ‘no fit’ and a 4 is ‘good fit’. Half-scores were given when appropriate. The CAMs used for this evaluation can be found in Appendix 6.

41
Policy Option 1: Point-of-Sale Updates to Residential Plumbing
Equity: low-moderate fit
We give this option a 2.5 out of 4 for equity. Replacing plumbing would address the root cause of a majority of water quality complaints, ensuring that the quality of the water customers receive at their tap matches the quality of water on the supply side. However, the average rate of turn over for a property in Los Angeles is 15 years. Thus, achieving uniform water quality through point-of-sale plumbing updates would likely take decades.
While this option ensures uniform water quality and cleanliness across the LADWP service area, it does not address non-plumbing related water quality issues, such as taste and odor complaints caused by the utility’s treatment process. Additionally, it does not address differences in perceived water quality that are unrelated to actual water cleanliness (e.g. institutional mistrust and beliefs about water quality based on country of origin).
Cost: moderate fit
We give point-of-sale plumbing updates a score of 3 out of 4 for cost. Point-of-sale updates will place the burden of cost on consumers. While the cost can be divided between property buyers and sellers, plumbing updates are expensive, ranging from $2,000 to more than $15,000.68 Mandating plumbing updates is likely going to drive up housing costs for both homeowners and renters and may have the unintended consequence of further exacerbating issues of housing affordability in Los Angeles. The Water Foundation can offset some of the consumer cost burden through strategic grant making. Either Los Angeles or LADWP can follow the precedent set by Denver Water and the Macon Water Authority by partnering with the Water Foundation to lower the cost burden for low-income residents.
68 Bousquin, Joe. 2016. “Replacing Plumbing Pipes: Costs and Options.” Houselogic. August 23, 2016. https://www.houselogic.com/organize-maintain/home-maintenance-tips/replacing-plumbing-pipes-costs-and-options/.

42
Political Feasibility: low-moderate fit
We give point-of-sale updates a 2.5 for political feasibility. From LADWP’s perspective, regulation that mandates point-of-sale plumbing updates would be the most desirable option as it would remove any burden of cost and responsibility from the utility. At both the city and county level, government officials have set the homelessness crisis as a priority. Point-of-sale plumbing update requirements may face political push back since it has the potential to increase home costs in a region already struggling with issues of affordable housing. Despite the current political climate, the Water Foundation is experienced in the type of legislative advocacy necessary to achieve point-of-sale plumbing update regulations.
This option would be of no cost to LADWP, as the city would be responsible for implementation and enforcement. The city would bare additional costs associated with enforcement; however, similar regulation, such as requirements for water-conserving plumbing fixtures, has been successfully implemented statewide, creating precedent for this option.
Scalability: low-moderate fit
We give this option a 2.5 of 4 for scalability. Regulating plumbing updates requires legislative action and is only feasible in certain political environments. Legislation can be passed at the city, county, state, or national level; however, a majority of this type of legislation has passed at the state level. If point-of-sale plumbing updates prove effective at the city level, it is likely to pass at the county level and in regions with similar water quality issues and political atmosphere.
Policy Option 2: Point-of-Use Filters for LADWP Customers

43
Equity: good fit
We score utility provided point-of-use filters 4 out of 4 for equity. LADWP would be providing the same filter to any customer who requests one within its service area. While filters will not solve quality issues related to plumbing, they do offer a stop-gap solution to customers experiencing these types of water cleanliness issues. For customers with sufficiently maintained plumbing, additional filtration may improve the perceived quality of LADWP water (e.g. unpleasant taste due to treatment methods), even if there is no actual improvement in water safety.
Cost: moderate-good fit
We score point-of-use filters 3.5 out of 4 for cost. Utility provided point-of-use filters would be of no cost to LADWP customers. The utility would bear all of the costs associated with this option, including purchasing and distributing filters.
Utility provided point-of-use filters have been used by DC water as a cost effective way of combating issues arising from lead service lines. Marc Edwards at Virginia Tech estimated the cost of filters at roughly $US 40 per unit.69 However, installation and maintenance costs may affect the cost-effectiveness of this option, particularly if that burden is placed on LADWP customers.
Political Feasibility: moderate-good fit
We score point-of-use filters 3.5 out of 4 for political feasibility. Since LADWP is willing to provide carbon filters to its customers, there would be little to no pushback at the utility level. The City of Los Angeles is unlikely to oppose such an initiative, as residents would experience benefits of improved water quality at no direct cost to the city. There is a small possibility that distributing filters would be perceived as utility provider admission of water quality issues. If this is seen to be a significant risk, LADWP may be unwilling to support this option.
While there is precedent for utility provided point-of-use filtration devices, it has been in response to lead-related health emergencies or by small utilities who’s cost of centralized treatment outweighs the cost of point-of-use treatment. California has established strict guidelines for utilities who use point-of-use filtration as their primary water treatment mechanism and require that the agency take
69 Walton, Brett. “No Filter: Treating Drinking Water At the Faucet Is Rarely a Utility's Contamination Solution.” January 11, 2017. http://www.circleofblue.org/2017/world/no-filter-treating-drinking-water-faucet-rarely-utilitys-contamination-solution/
44
responsibility for filter maintenance.70 Since, LADWP would be adding filters to its already robust treatment methods, it is unlikely they would be impacted by this regulation.
Scalability: good fit
We gave point-of-use filters 4 out of 4 for scalability. The infrastructure for purchasing and delivering point-of-use filters to the LADWP service area (wholesalers and USPS) is already in place. This same infrastructure can be used to expand point-of-use filter delivery to other parts of Los Angeles County. Since water utilities vary in size and management structure, scaling this option to all of Los Angeles County, or outside of the region, may require local government involvement and support. However, as mentioned previously, a number of utilities have utilized this option in the municipalities they serve.
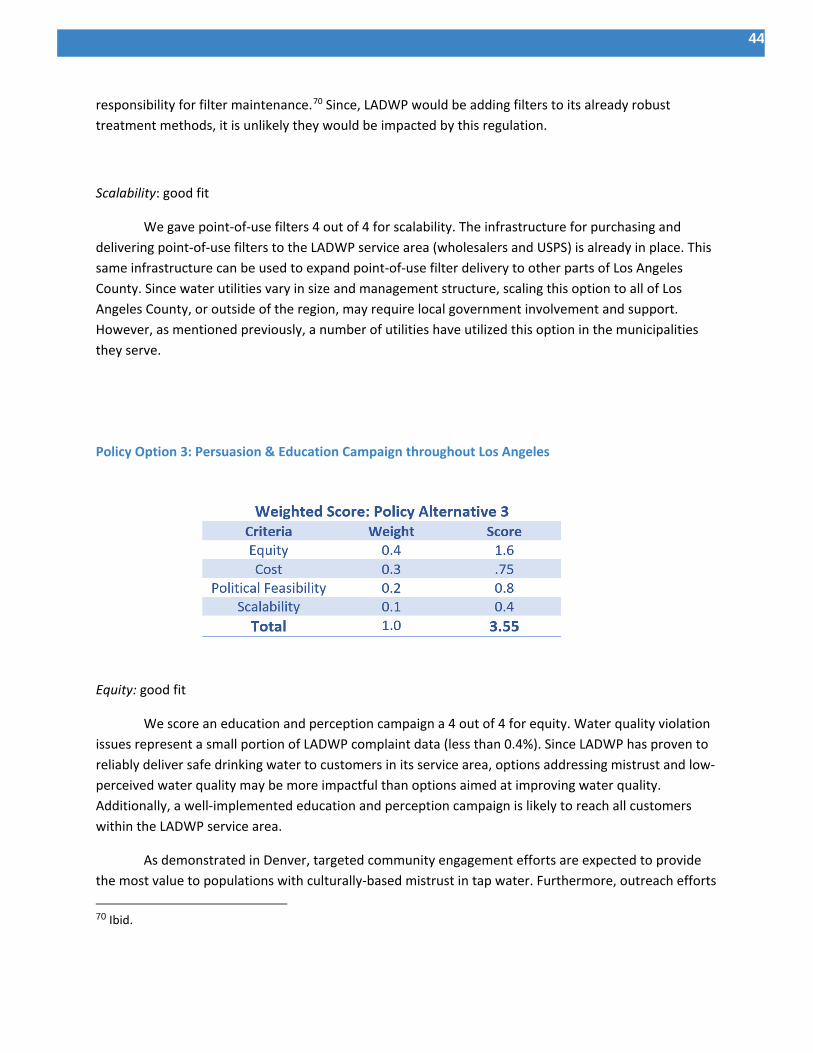
Policy Option 3: Persuasion & Education Campaign throughout Los Angeles
Equity: good fit
We score an education and perception campaign a 4 out of 4 for equity. Water quality violation issues represent a small portion of LADWP complaint data (less than 0.4%). Since LADWP has proven to reliably deliver safe drinking water to customers in its service area, options addressing mistrust and low-perceived water quality may be more impactful than options aimed at improving water quality. Additionally, a well-implemented education and perception campaign is likely to reach all customers within the LADWP service area.
As demonstrated in Denver, targeted community engagement efforts are expected to provide the most value to populations with culturally-based mistrust in tap water. Furthermore, outreach efforts 70 Ibid.
45
aimed at communities who may be underrepresented in LADWP’s complaint data due to lack of trust in government institutions (as may be present in mixed status households) is expected to reduce gaps in customer knowledge. While we rank this option as a good fit for equity within the LADWP service area, this score may change when scaling this policy option to other water utilities in the county and state.
Cost: low-moderate fit
We score an education and perception campaign 2.5 out of 4 for cost. There will be no direct cost to LADWP customers; however, they will likely face opportunity costs of time spent engaging in education and outreach efforts. Regardless, consumer benefits from well-executed education and perception campaigns (e.g. reduced spending on bottled beverages, improved health outcomes) should outweigh any opportunity costs borne by the consumer.
Political Feasibility: good fit
We score an education and perception campaign 4 out of 4 for political feasibility. There is a precedence for education and perception campaigns by LADWP, the City and County of Los Angeles, and the State of California. There is also precedence for city-sponsored tap water advertising campaigns (NYC Water and London on Tap). LADWP is likely to support this option as it maintains an image of having no liability for differences in customer experience with tap water, and also demonstrates intent to address public concern. We do not expect push back from either the City or County for similar reasons.
While an education and perception campaign should be uniquely targeted to the LADWP service area, the EPA provides educational materials and financial support programs for such efforts. Most of the costs associated with this option will go toward staff hours and advertising space (billboards, radio, etc). Costs to the utility will likely be similar to the costs of other LADWP sponsored campaigns (e.g. Save The Drop). Costs to the utility can also be mitigated through strategic partnerships with outside organizations.
Scalability: good fit
We score an education and perception campaign 4 out of 4 for scalability. This option can be easily and effectively implemented in other regions of Los Angeles and California; however, it would need to be adjusted to fit the unique demographics of the communities in these regions. While education on the value of tap water is not likely to be region dependent, efforts to shift water quality perception should be. Our literature review uncovered several factors associated with low levels of

46
satisfaction in tap water. Stigma and misperceptions related to tap water are largely cultural, and therefore also region specific.
Policy Option 4: Water Quality Cost Callout in Utility Bill
Equity: moderate fit
We score reformatting the LADWP water bill to reflect water quality spending as 3 out of 4 for equity. This option would equally impact all customers who receive a water bill in the LADWP service area. Customers who do not receive a water bill (renters) would be unaffected by this option. However, the utility or the Water Foundation could address this gap by providing a water quality cost callout to all addresses in the LADWP service area.
It is difficult to determine the impact that a reformatted water bill will have on overall satisfaction with LADWP water as it cannot be tailored to address the wide range of factors that contribute to mistrust and low satisfaction with tap water. Unlike an education and persuasion campaign, a reformatted bill highlighting LADWP’s commitment to water quality is a passive option, in that it does not require the utility to actively engage with its customers. Since this option does not include active community outreach, it is likely to have little or no effect on water quality perception for customers who already lack trust in information provided by LADWP.
Cost: moderate fit
We score reformatting the water bill 3 out of 4 for cost. This option would have no real cost for customers and a minimal opportunity cost, as customers would not be expected to use time outside of what they already allot for bill payment.

47
Political Feasibility: good fit
We score reformatting the water bill 4 out of 4 for political feasibility. Aside from point-of-sale plumbing updates, this option is closest to a ‘business as usual’ approach for LADWP. Since the resources required to implement this option are minimal, we expect support from LADWP. However, due to the recently settled class action lawsuit alleging overbilling and other billing errors, the utility may be reluctant to make any changes in its current practices.
Outside of the initial cost of reformatting, there is no ongoing expense associated with this option. LADWP currently tracks spending on water quality, as rate setting and billing are strictly regulated. However, there may be costs associated with ensuring that the information can be easily digested by customers.
Scalability: good fit
We score reformatting the water bill 4 out of 4 for scalability. Since this option is the least resource intensive, adoption by water utilities in other regions of the County and State is probable. Unlike a persuasion and education campaign, this option would require minimal changes across regions and utilities. Utilities could use LADWP formatting to display their own water quality spending practices.

48
Chapter 8: Prioritization of Policy Recommendations
We believe all of our policy recommendations work to resolve disparities in the customer experience with tap water in Los Angeles and improve overall public education around water safety. However, as the Water Foundation does not have direct decision-making power over the City of Los Angeles and LADWP, and as staff time and financial resources for grant-making are limited, it will be necessary to prioritize these strategies as part of our implementation plan. We prioritized our recommendations in order of scoring from our weighted criteria alternative matrix. Based on our evaluation, our policy recommendations fall into the following ranking:
Rank Order of Policy Options
1. Point-of-use Filters Distributed by LADWP 2. Persuasion & Education Campaign 3. Water Quality Cost Callout in Utility Bill 4. Point-of-Sale Updates to Residential Plumbing

49
Evaluative Criteria Ranking
Table 4:Ranking of Policy Options
Ranking of Policy Options
Criterion Policy Alternatives
Point-of-Sale Updates to Plumbing
Point-of-Use Filters
Persuasion Campaign
Reformat Water Bill
Equity 1 1.6 1.6 1.2 Costs 0.9 1.05 0.75 0.9
Political Feasibility 0.5 0.7 0.8 0.8 Scalability 0.25 0.4 0.4 0.4
Total Score (Weighted) 2.65 3.75 3.55 3.3
Twofold Policy Recommendation
The complexity of the existing policy environment and the wide-reaching implications of addressing water quality inequities in Los Angeles necessitate a robust policy recommendation. In addition to our prioritization based on criteria scores, we believe a twofold approach including the distribution of point-of-use filters along with a persuasion campaign will be the most important to implement first. Distribution of point-of-use filters is a cost-effective way to mitigate many water cleanliness issues for customers; since LADWP would directly provide and distribute these filters, we also believe this would work to restore and improve public trust in the safety of tap water and the utility. However, customers’ lack of knowledge about how filters improve water quality, or on how to maintain the filters could limit their benefit. We therefore propose the implementation of a persuasion campaign along with distributing filters as the most comprehensive and effective policies to prioritize. The persuasion campaign would work to increase public awareness of water quality (for example: online tools that outline contaminant levels in your service area), ways that LADWP is working to consistently provide water that is safe and clean, and proper filter maintenance and care. Additionally, the campaign would include a marketing component aimed at changing cultural perception of tap water and increase consumption by making it more trendy and hip, and selling its affordability, cleanliness and sustainability.

50
The Water Foundation would play a key role in allocating grants to community partners to support the persuasion campaign, and work with LADWP to prioritize communication strategies and channels. They could also help determine metrics for program evaluation and efficacy.
Regional Partnerships & Engagement Strategy
The Water Foundation has a fundamental and critical role in the implementation of these strategies in Los Angeles, and eventually throughout California. Its position as a regional grantmaker can help leverage important relationships with stakeholders in the public, private, and nonprofit sectors.
California’s growing focus on issues of water safety, conservation and management makes this an ideal climate for policy makers to identify strategic solutions to these issues. The Water Foundation’s experience working with legislators to implement policies at the state level could be key in taking advantage of this policy window and make recommendations for improving water quality across the region.
Future Research Recommendations
In conducting our research and preparing this report, we noticed a significant lack of qualitative and quantitative analysis of urban tap water quality issues in the United States. We believe there is significant interest in more information from the public and philanthropic sectors, as well as residential users of tap water. We recommend that the Water Foundation and other UCLA Luskin research teams prioritize the following action items in future study.
Scalability Outside the City of Los Angeles
While our report only addresses quality issues experienced by LADWP customers, this issue is not limited to the City of Los Angeles. We recommend that the Water Foundation work with partners throughout the county and southern California region to determine opportunities to expand proposed policies throughout the state.
Regional Issues with Age of Buildings and Pipes
In our quantitative analysis, we examined data from the Los Angeles County Assessor’s database to draw preliminary conclusions about the interaction between age of buildings, pipes, and the customer experience with tap water. We believe this is an area where additional research could support

51
the policy option that would most directly address water quality in the home - replacing piping through point-of-sale regulations. Since the Water Foundation would not directly take on the task of pipe replacement, we did not conduct a thorough assessment of associated costs. We also did not examine the average age of pipes in homes throughout Los Angeles (instead assuming that age of buildings and the time since the sale of a property were proxies for age of pipes in our regression analysis). Both of these factors could contribute significantly to policy options that would resolve “curb to meter” quality disparities throughout Los Angeles. In the future, a cost-effectiveness analysis that included relative costs of pipe replacement, research into the specific quality issues caused by old or poorly-maintained pipes, and identification of the risk factors involved would be essential for evaluating policy recommendations.
Emerging Contaminants
LADWP adheres to federal and state standards for primary and secondary containments throughout its service area.71 Many of these contaminants are odorless, colorless, and tasteless - meaning that the average consumer of tap water would not detect any quality issues resulting from an excess of these components in their tap. However, there are a host of contaminants (some which do cause negative sensory effects) that some advocacy groups believe should be regulated at the state and federal level. These can be contaminants brought about by old or poorly maintained pipes, or chemicals that are now in our water supply due to human activity. Additional research into the health effects of these various contaminants could affect water quality regulation if found to pose significant health risks.
Additional Surveys of Customer Experience in Los Angeles Region
As addressed in our limitations, our quantitative quality data is limited to customers that chose to file a complaint with LADWP. We recognize that some individuals who may experience unclean tap water do not issue a formal complaint - because they do not know the procedure to make a complaint, do not believe that their water experience will improve if they make a complaint, or for other reasons. To address this issue of sampling bias, a random survey of households in LADWP’s service area would better determine the tap water experience representative of most customers.
Randomized Sampling of Tap and Supply Quality Pairs
Additionally, due to the selection bias and limited sample size of individuals who filed a complaint to LADWP, we have a similar limitation for evaluating tests of supply and tap water. We
71 Los Angeles Department of Water and Power (2016) 2016 Drinking Water Quality Report

52
therefore recommend that LADWP or future researchers conduct a randomized sampling customer locations, testing water at both the supply and the tap, to provide a more robust analysis of overall water quality in the region. With a larger sample size and minimizing sampling bias, we could more clearly and decisively determine if there are regions of Los Angeles that experience lower water quality in the home.
53
Chapter 9: Sensitivity Analysis
We identified two potential sources of uncertainty in our conclusions - our method of analysis and our prioritization of criteria. We present a group of sensitivity analyses to address the extent to which our choices in both instances may impact our recommendations. By acknowledging that alternatives exist to our choices in criteria weighting, we demonstrate the relative insensitivity of our policy rankings across varying weighting scenarios. Additionally, we demonstrate the robustness of our policy rankings across an alternative method of analysis where we rank order our policy options for each criterion.
Weighting:
In rating the relative effectiveness of our policy alternatives using our criteria matrix, we relied on our assessment of the relative importance of each criterion. Evaluating the relative rankings of the policy proposals across four additional scenarios allows us to determine the robustness of our prioritization. For Scenario 1, we assigned equal weights across all of our criteria. For Scenario 2, we allowed the political feasibility of our proposals to dominate the weighting. For Scenario 3, we allow cost consideration to dominate. For Scenario 4, we invert our default rating choices, prioritizing scalability, followed by political feasibility, costs, and finally equity and find that point of use filters and a reformatted water bill are the highest ranked policy alternatives. (See Tables 5-7).

54
Table 5:Sensitivity Analysis of Criteria Weighting
Decision Model Point-of-Sale Updates Point-of-Use Filter Persuasion Campaign
Reformat Water Bill Criterion Weight Rating Score Rating Score Rating Score Rating Score
Equity 0.4 2.5 1 4 1.6 4 1.6 3 1.2 Costs 0.3 3 0.9 3.5 1.05 2.5 0.75 3 0.9
Political Feasibility 0.2 2.5 0.5 3.5 0.7 4 0.8 4 0.8 Scalability 0.1 2.5 0.25 4 0.4 4 0.4 4 0.4
Total 1 10.5 2.65 15 3.75 14.5 3.55 14 3.3
Decision Model: Scenario 1 Point-of-Sale Updates Point-of-Use Filter Persuasion Campaign
Reformat Water Bill Criterion Weight Rating Score Rating Score Rating Score Rating Score
Equity 0.25 2.5 0.625 4 1 4 1.6 3 0.75 Costs 0.25 3 0.75 3.5 0.875 2.5 0.75 3 0.75
Political Feasibility 0.25 2.5 0.625 3.5 0.875 4 0.8 4 1 Scalability 0.25 2.5 0.625 4 1 4 0.4 4 1
Total 1 10.5 2.625 15 3.75 14.5 3.55 14 3.5
Decision Model: Scenario 2 Point-of-Sale Updates Point-of-Use Filter Persuasion Campaign
Reformat Water Bill Criterion Weight Rating Score Rating Score Rating Score Rating Score
Equity 0.1 2.5 0.25 4 0.4 4 1.6 3 0.3 Costs 0.2 3 0.6 3.5 0.7 2.5 0.75 3 0.6
Political Feasibility 0.5 2.5 1.25 3.5 1.75 4 0.8 4 2 Scalability 0.2 2.5 0.5 4 0.8 4 0.4 4 0.8
Total 1 10.5 2.6 15 3.65 14.5 3.55 14 3.7
Decision Model: Scenario 3 Point-of-Sale Updates Point-of-Use Filter Persuasion Campaign
Reformat Water Bill Criterion Weight Rating Score Rating Score Rating Score Rating Score
Equity 0.2 2.5 0.5 4 0.8 4 1.6 3 0.6 Costs 0.5 3 1.5 3.5 1.75 2.5 0.75 3 1.5
Political Feasibility 0.2 2.5 0.5 3.5 0.7 4 0.8 4 0.8 Scalability 0.1 2.5 0.25 4 0.4 4 0.4 4 0.4
Total 1 10.5 2.75 15 3.65 14.5 3.55 14 3.3
Decision Model: Scenario 4 Point-of-Sale Updates Point-of-Use Filter Persuasion Campaign
Reformat Water Bill Criterion Weight Rating Score Rating Score Rating Score Rating Score
Equity 0.1 2.5 0.25 4 0.4 4 1.6 3 0.3 Costs 0.2 3 0.6 3.5 0.7 2.5 0.75 3 0.6
Political Feasibility 0.3 2.5 0.75 3.5 1.05 4 0.8 4 1.2 Scalability 0.4 2.5 1 4 1.6 4 0.4 4 1.6
Total 1 10.5 2.6 15 3.75 14.5 3.55 14 3.7

55
Scores or Ranks?
Our criteria analysis relies on a scoring system for measuring each alternative’s strengths and weaknesses across criteria. Several options can - and indeed, do - achieve identical scores for some criteria in our analysis. In this case, the higher the weighted score, the more desirable the policy alternative is found to be. An alternative method of evaluating relative differences among policy choices is to rank each option relative to each other within each criterion. This ordering method does not allow ties within criteria. Here in Scenario 5, we assign rankings of 4 (best) to 1 (worst) for each option within each criterion. We retain our original weighting of our criteria.
Table 6:Sensitivity Analysis of Scoring
Decision Model: Scenario 5, Rank Order
Point-of-Sale Updates
Point-of-Use Filter
Persuasion Campaign
Reformat Water Bill
Criterion Weight Rating Score Rating Score Rating Score Rating Score Equity 0.4 1 0.4 4 1.6 4 1.6 2 0.8 Costs 0.3 1 0.3 2 0.6 2.5 0.75 4 1.2
Political Feasibility 0.2 1 0.2 2 0.4 4 0.8 3 0.6 Scalability 0.1 4 0.4 2 0.2 4 0.4 1 0.1
Total 1 7 1.3 10 2.8 14.5 3.55 10 2.7
Robustness:
In three out of the five total alternative scenarios, we find that our prioritization of policy alternatives is unchanged. For Scenario 2, where we overweight Political Feasibility, we find that our Persuasion Campaign and Water Bill Reformat very slightly outweigh the Point of Use Filter alternative. Point-of-Sale Update requirements remains lowest priority of the four. When considering Cost as the primary constraint, we find that while filters still remain the leading recommendation, the lower cost associated with Water Bill Reformat moves that option above Persuasion Campaign. For Scenario 5, we find that Point of Sale and Water Bill Reformat remain the lowest and second-lowest priorities, respectively, while Persuasion outperforms Point of Use Filters.
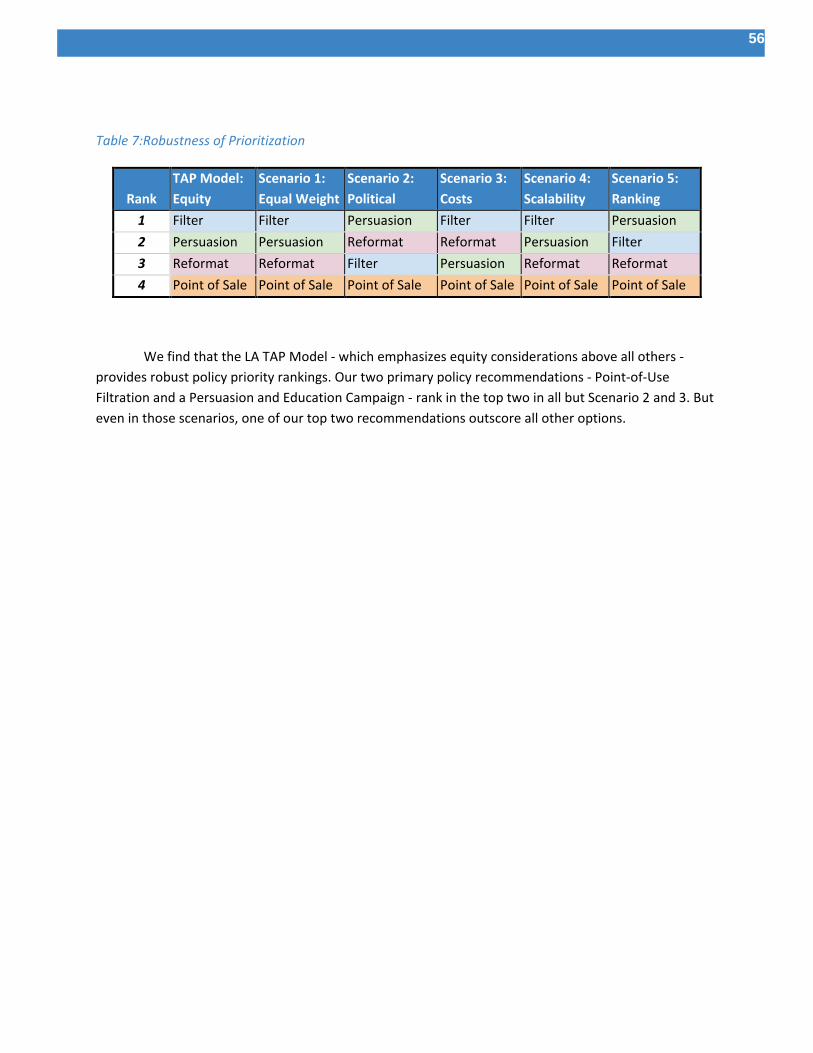
56
Table 7:Robustness of Prioritization
Rank TAP Model: Equity
Scenario 1: Equal Weight
Scenario 2: Political
Scenario 3: Costs
Scenario 4: Scalability
Scenario 5: Ranking
1 Filter Filter Persuasion Filter Filter Persuasion 2 Persuasion Persuasion Reformat Reformat Persuasion Filter 3 Reformat Reformat Filter Persuasion Reformat Reformat 4 Point of Sale Point of Sale Point of Sale Point of Sale Point of Sale Point of Sale
We find that the LA TAP Model - which emphasizes equity considerations above all others - provides robust policy priority rankings. Our two primary policy recommendations - Point-of-Use Filtration and a Persuasion and Education Campaign - rank in the top two in all but Scenario 2 and 3. But even in those scenarios, one of our top two recommendations outscore all other options.
57
Chapter 10: Conclusion
We hope that the recommendations provided in this report will provide an effective strategy for addressing inequalities in customer tap water experience, and increase public awareness of tap water quality in Los Angeles. Our twofold policy recommendation of distributing point-of-use filters along with a persuasion and education campaign can work to improve consumer trust in tap water quality; more importantly, it can increase cleanliness for a majority of households experiencing less-than-ideal water at the tap.
We recognize that while point-of-use filters will increase water cleanliness at the tap, it does not solve the root cause of water quality issues for most residents due to poorly maintained or aging pipes. Therefore the next step in this process will involve significant research from the Water Foundation, the City of LA, and relevant stakeholders on age of residential pipes in Los Angeles and effects on water quality and safety. This will be essential in analyzing the potential impact of these policies, including costs. Additional research can determine if point-of-sale updates for pipes have a positive overall impact on equity, and effectively serve Los Angeles’s diverse communities. For the Water Foundation specifically, we recommend that they focus on building consensus among regional and state legislative bodies to pass point-of-sale upgrade policies.
Finally, we believe that the impact of additional consumer engagement and education can have significant implications in changing public perception of tap water safety, which can have positive effects on long term economic and environmental sustainability in Los Angeles. A successful persuasion and education strategy in Los Angeles can provide a model framework to expand across the state of California.

58
References
Anadu, Edith C., and Anna K. Harding. "Risk perception and bottled water use." American Water Works Association. Journal 92, no. 11 (2000): 82 “About NYC Water Campaign.” n.d. NYC.gov. Accessed March 20, 2018. http://www.nyc.gov/html/nycwater/html/about/about.shtml. Bae, Hyunhoe. "The impact of the residential lead paint disclosure rule on house prices: findings in the American Housing Survey." Journal of Housing and the Built Environment 31, no. 1 (2016): 19-30. Bousquin, Joe. 2016. “Replacing Plumbing Pipes: Costs and Options.” Houselogic. August 23, 2016. https://www.houselogic.com/organize-maintain/home-maintenance-tips/replacing-plumbing-pipes-costs-and-options/. Brown, K. W., Gessesse, B., Butler, L. J., & MacIntosh, D. L. (2017). Potential Effectiveness of Point-of-Use Filtration to Address Risks to Drinking Water in the United States. Environmental health insights, 11, 1178630217746997. Community Member Panel. “At the Tap Water Conference.” Los Angeles, California. February 20, 2018. Cota-Robles, M. (2017, April 11). LA tap water as clean as bottled water; LADWP report finds. Retrieved from http://abc7.com/1861985/.
CDC. 2017. “Sugar Sweetened Beverage Intake.” Centers for Disease Control and Prevention. April 7, 2017. https://www.cdc.gov/nutrition/data-statistics/sugar-sweetened-beverages-intake.html. Definition Of "contaminant".Epa.gov. https://www.epa.gov/ccl/definition-contaminant.
Daley, John. 2016. “Selling The Health Benefits Of Denver’s Tap Water — After Flint.” NPR.org. February 13,2016. https://www.npr.org/sections/health-shots/2016/02/13/466109816/ selling-the-health-benefits-of-denvers-ta-water-after-flint.
Deshazo, J. R., and H. McCann. "Los Angeles County Community Water System Atlas and Policy Guide, Volume I." UCLA Luskin Center for Innovation, Los Angeles, CA (2015).
de França Doria, Miguel. "Factors influencing public perception of drinking water quality." Water policy 12, no. 1 (2010): 1-19. “Facts & Figures,” accessed January 20, 2018, https://www.ladwp.com/ladwp/faces/ladwp/aboutus/a-water/a-w-factandfigures?_adf.ctrl-state=5a77ln23p_4&_afrLoop=1086343356544126.

59
Gumprecht, Blake. “51 Miles of Concrete: The Exploitation and Transformation of the Los Angeles River.” Southern California Quarterly. 79.4 (Winter 1997): 431-486. “Human Right to Water | California State Water Quality Control Board.” 2018. .gov. March 16, 2018. https://www.waterboards.ca.gov/water_issues/programs/hr2w/. Jardine, Cynthia G., Nancy Gibson, and Steve E. Hrudey. "Detection of odour and health risk perception of drinking water." Water Science and Technology 40, no. 6 (1999): 91-98. Joe Ramallo, in-person communication, November 14, 2017. Jonathan Lung, in-person communication, December 19, 2017. Jones, Andria Q., Catherine E. Dewey, Kathryn Doré, Shannon E. Majowicz, Scott A. McEwen, David Waltner-Toews, Spencer J. Henson, and Eric Mathews. "A qualitative exploration of the public perception of municipal drinking water." Water Policy 9, no. 4 (2007): 425-438. Jordan Downs Health Needs Assessment, Preliminary Findings. Jordan Downs Health Summit. Presented on June 3, 2017. Lex Talamo. 2016. “East Mooringsport customer: 'I don't trust this water'.” The Times, Dec.13th, 2016. http://www.shreveporttimes.com/story/news/2016/12/13/east-mooringsport-customer-dont-trust-water/85260338/. Los Angeles Department of Water and Power (2016) 2016 Drinking Water Quality Report. Los Angeles County Community Water Systems: Atlas and Policy Guide 2015. Office of Water (4606). 2004. “Understanding the Safe Drinking Water Act.” EPA 816-F-04-030. www.epa.gov/safewater. www.epa.gov/safewater. Onufrak, Stephen J., Sohyun Park, Joseph R. Sharkey, and Bettylou Sherry. "The relationship of perceptions of tap water safety with intake of sugar-sweetened beverages and plain water among US adults." Public health nutrition 17, no. 1 (2014): 179-185. Parag, Yael, and J. Timmons Roberts. "A battle against the bottles: building, claiming, and regaining tap-water trustworthiness." Society and Natural Resources 22, no. 7 (2009): 625-636. Patrick, Katie. 2016. “21 Reasons Why Plastic Bottles Ruin Everything: Recycling Won’t Fix It, Zero Waste Will.” Huffington Post (blog). November 17, 2016. https://www.huffingtonpost.com/katie-patrick/21-reasons-why-plastic-bo_b_12848918.html. Sahakian, Marlyne, and Harold Wilhite. "Making practice theory practicable: Towards more sustainable forms of consumption." Journal of Consumer Culture 14, no. 1 (2014): 25-44.

60
Schriever, Norm. 2013. “Plastic Water Bottles Causing Flood of Harm to Our Environment.” Huffington Post (blog). July 29, 2013. https://www.huffingtonpost.com/norm-schriever/post_5218_b_3613577.html. “Selling The Health Benefits Of Denver’s Tap Water — After Flint.” 2016. NPR.org. February 13, 2016. https://www.npr.org/sections/health-shots/2016/02/13/466109816/selling-the-health-benefits-of-denvers-tap-water-after-flint. Shaver, Katherine, and Dana Hedgpeth. 2016. “D.C.’s Decade-Old Problem of Lead in Water Gets New Attention during Flint Crisis.” Washington Post, March 17, 2016, sec. Local. https://www.washingtonpost.com/local/dcs-decade-old-problem-of-lead-in-water-gets-new-attention-during-flint-crisis/2016/03/17/79f8d476-ec64-11e5-b0fd-073d5930a7b7_story.html. Shovlin, Marjorie G., and Sandra S. Tanaka. "Risk communication in Los Angeles: a case study." Journal (American Water Works Association) (1990): 40-44. Stephanie Pincetl, Madelyn Glickfeld, Deborah Cheng, Miriam Cope, Kartiki Naik, and Erik Porse, Kristen Holdworth, and Celine Kuklowski (2015). Water Management in Los Angeles County; a Research Report. Presented to the John Randolph Haynes and Dora Haynes Foundation. UCLA Institute of the Environment and Sustainability. Tiemann, Mary. "Safe Drinking Water Act: Implementation and Issues." Congressional Research Service, Library of Congress, 2003. U.S. Census Bureau (2017). Quick Facts: Los Angeles City, California. Retrieved from https://www.census.gov/quickfacts/fact/table/losangelescitycalifornia/PST045216. U.S. Census Bureau (2010) Census U.S. Gazetteer Files – Places – California. Retrieved from https://www2.census.gov/geo/docs/maps-data/data/gazetteer/2010_place_list_06.txt US EPA, OW. 2015. “Information about Public Water Systems.” Collections and Lists. US EPA. September 21, 2015. https://www.epa.gov/dwreginfo/information-about-public-water-systems. Walton, Brett. “No Filter: Treating Drinking Water At the Faucet Is Rarely a Utility's Contamination Solution.” January 11, 2017. http://www.circleofblue.org/2017/world/no-filter-treating-drinking-water-faucet-rarely-utilitys-contamination-solution/.
“Water Quality Report 2017.” 2017. Macon Water Authority. http://www.maconwater.org/pdf/MWA%202017%20WQR%20FINAL%20Proof.pdf.
“Who we are.” Waterfdn.org. http://waterfdn.org/who-we-are/.

61
Zyga, Lisa. 2009. “How Much Energy Goes Into Making a Bottle of Water?” How Much Energy Goes Into Making a Bottle of Water? March 17, 2009. https://phys.org/news/2009-03-energy-bottle.html

62
Appendix 1: Water Management Structure in Los Angeles
Sourced from EPA (2017) Information about Public Water Systems

63
Appendix 2: U.S. EPA MCLs versus LADWP MCLs Source: Los Angeles DWP, Water Quality Division

64

65

66

67
Appendix 3: LADWP Service Area

68
Appendix 4: Water Management in Los Angeles
The City of Los Angeles is the second most populous city in the nation and the most populous city in California, with a US Census population estimate of 3,976,233 as of 2016.72 The 503 square mile city73 is located within Los Angeles County (the most populated county in the country), which is situated in a large coastal basin surrounded by mountains. Founded September 4, 1781, the City of Los Angeles rapidly expanded after the discovery of oil in the 1890s and continued to grow after the 1913 completion of the Los Angeles Aqueduct, which significantly expanded access to water for residents.74
The Aqueduct is just one part of the complex infrastructure used to provide potable water to more than 10 million Los Angeles County residents.75 The current system of over 200 public and private agencies delivering water developed from the redistribution of supply and ownership from native people to Spanish settlers.76 This was under the ownership theory that whoever built and maintained a water system also owned distributed water. These early structures of inequitable resource distribution and access are reinforced by the current fragmented mechanisms of water resource management, leading to complex governance systems with varying levels of transparency and accountability that often exclude the residential consumer.
72 U.S. Census Bureau (2017). Quick Facts: Los Angeles City, California. Retrieved from https://www.census.gov/quickfacts/fact/table/losangelescitycalifornia/PST045216. 73 U.S. Census Bureau (2010) Census U.S. Gazetteer Files – Places – California. Retrieved from https://www2.census.gov/geo/docs/maps-data/data/gazetteer/2010_place_list_06.txt 74 Gumprecht, Blake. “51 Miles of Concrete: The Exploitation and Transformation of the Los Angeles River.” Southern California Quarterly. 79.4 (Winter 1997): 431-486. 75 Los Angeles County Community Water Systems: Atlas and Policy Guide 2015 76 Gumprecht, Blake. “51 Miles of Concrete: The Exploitation and Transformation of the Los Angeles River.” Southern California Quarterly. 79.4 (Winter 1997): 431-486
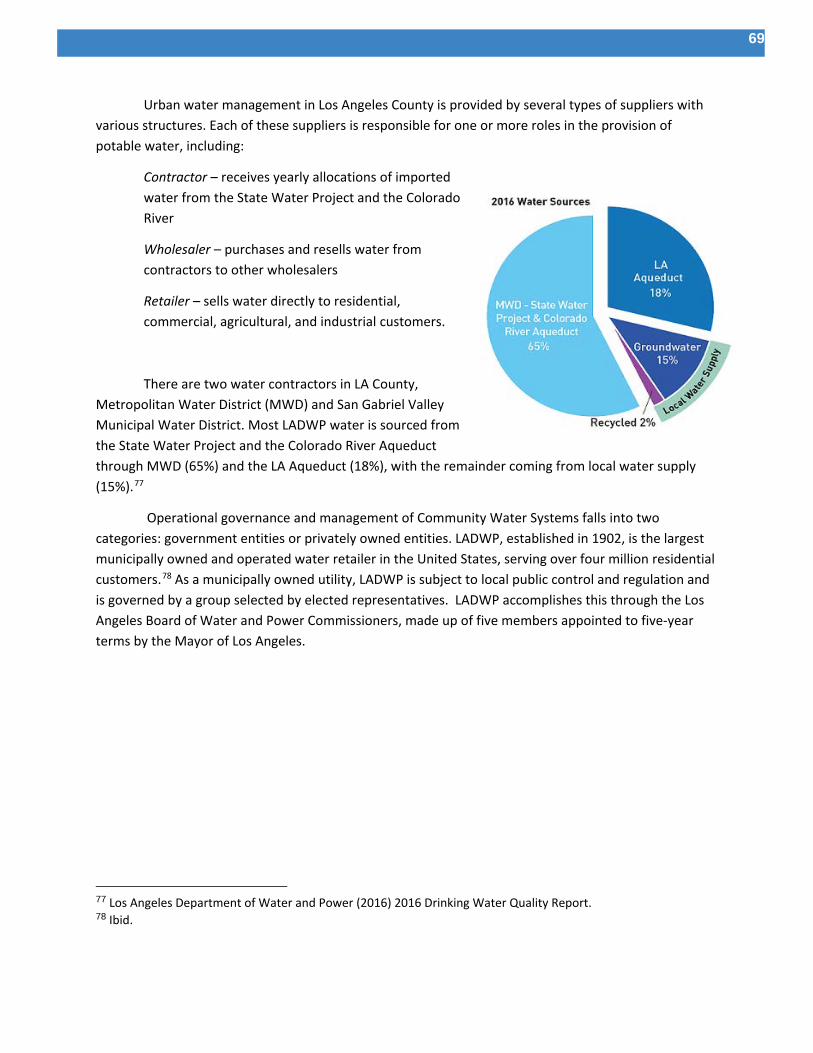
69
Urban water management in Los Angeles County is provided by several types of suppliers with various structures. Each of these suppliers is responsible for one or more roles in the provision of potable water, including:
Contractor – receives yearly allocations of imported water from the State Water Project and the Colorado River
Wholesaler – purchases and resells water from contractors to other wholesalers
Retailer – sells water directly to residential, commercial, agricultural, and industrial customers.
There are two water contractors in LA County, Metropolitan Water District (MWD) and San Gabriel Valley Municipal Water District. Most LADWP water is sourced from the State Water Project and the Colorado River Aqueduct through MWD (65%) and the LA Aqueduct (18%), with the remainder coming from local water supply (15%).77
Operational governance and management of Community Water Systems falls into two categories: government entities or privately owned entities. LADWP, established in 1902, is the largest municipally owned and operated water retailer in the United States, serving over four million residential customers.78 As a municipally owned utility, LADWP is subject to local public control and regulation and is governed by a group selected by elected representatives. LADWP accomplishes this through the Los Angeles Board of Water and Power Commissioners, made up of five members appointed to five-year terms by the Mayor of Los Angeles.
77 Los Angeles Department of Water and Power (2016) 2016 Drinking Water Quality Report. 78 Ibid.

70
Appendix 5: Data & Methods
General Introduction of Data and Cleaning
Using Water Quality Complaints data provided by LADWP, we examined reports from 2016 to 2017, as well as those two years of complaint quality sampling data.
The variables included in the complaint data set were: ● Event ID ● Category of Complaint ● Description of Complaint ● Time of Problem Onset ● Event Creation Time ● Termination Time ● Address of Complaint Location ● ZIP Code of Complaint Location ● Water Quality District ● Status of Closure
In addition, the water quality sampling data included:
● Event ID ● Sample ID ● Collection Date and Time ● Location Coding ● Location Description ● Analysis Code ● Reference Method ● Analyte ● Result ● Units ● Detection Limits, as appropriate ● State MCL, as appropriate ● Inspector
The complaint dataset included 3724 reported issues over 2241 complaints from 1876 addresses. The sampling dataset was made up of 607 sampling visits and 13,646 total collected samples, testing for 164 different analytes.
To examine the SES of the locations, we needed to identify the census tracts of each complaint site. Using the US Census Geolocator applet, we associated census tracts with each complaint building. We dropped data-points where there was no address or ZIP code listed, and where the address was not

71
able to be mapped to a census tract, leaving 1875 identifiable unique addresses, over 2157 unique events with 3557 total issues reported. We next merged our newly census-tract-rich database with the CalEnviroScreen 3.0 database to associate SES data with our complaint reports.
From our database of test results, we merged the census tract and SES data by matching unique Event IDs from the previously-matched complaint data. To ease our comparison of sampling across interior and supply samples, we restricted our data universe by selecting events where only one interior sampling event took place. This left us with 7390 samples collected over 1232 site visits to 296 addresses.
To evaluate the age, value and sales history of each structure, we used data from the LA County Assessor’s Office, restricted to residential property. We matched the databases by the property addresses, and found that of our 1875 complaint addresses, 1330 (71%) were present in the County Assessor’s data. The additional properties that were not matched may be entered incorrectly in either of the databases, or may represent non-residential structures. An examination of a sampling of the unmatched addresses found no evidence of significant exclusion of particular classes of property or neighborhoods. Descriptive Data Overview
Over the two years of data, customers reported from 1 to 7 problems (including requests for water testing) per call, with 95% reporting 2 or 3 issues.
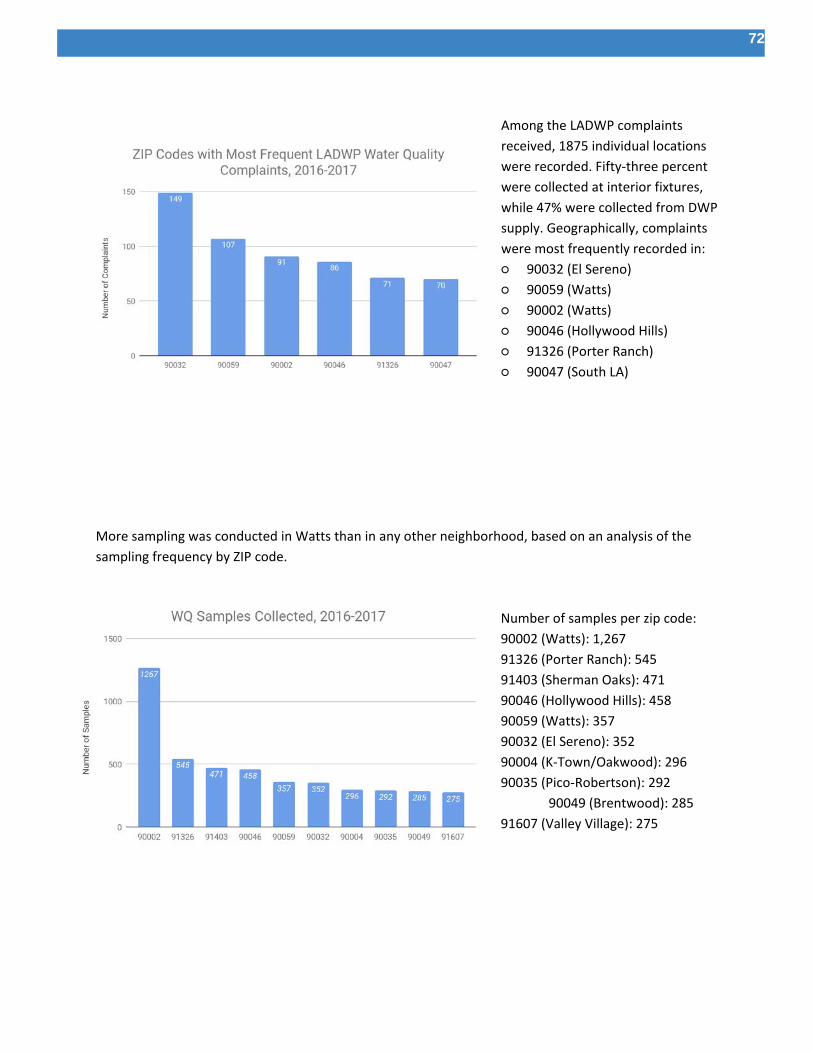
72
Among the LADWP complaints received, 1875 individual locations were recorded. Fifty-three percent were collected at interior fixtures, while 47% were collected from DWP supply. Geographically, complaints were most frequently recorded in: ○ 90032 (El Sereno) ○ 90059 (Watts) ○ 90002 (Watts) ○ 90046 (Hollywood Hills) ○ 91326 (Porter Ranch) ○ 90047 (South LA)
More sampling was conducted in Watts than in any other neighborhood, based on an analysis of the sampling frequency by ZIP code.
Number of samples per zip code: 90002 (Watts): 1,267 91326 (Porter Ranch): 545 91403 (Sherman Oaks): 471 90046 (Hollywood Hills): 458 90059 (Watts): 357 90032 (El Sereno): 352 90004 (K-Town/Oakwood): 296 90035 (Pico-Robertson): 292
90049 (Brentwood): 285 91607 (Valley Village): 275
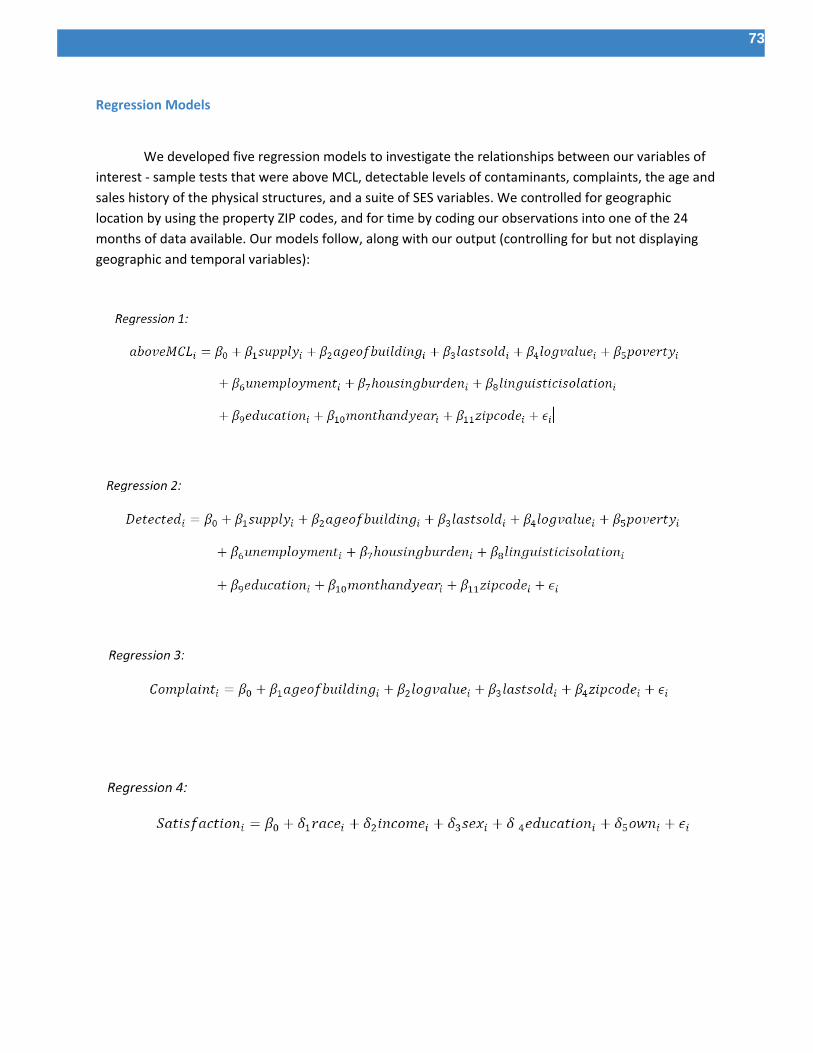
73
Regression Models
We developed five regression models to investigate the relationships between our variables of
interest - sample tests that were above MCL, detectable levels of contaminants, complaints, the age and sales history of the physical structures, and a suite of SES variables. We controlled for geographic location by using the property ZIP codes, and for time by coding our observations into one of the 24 months of data available. Our models follow, along with our output (controlling for but not displaying geographic and temporal variables):

74
Regression Models
Model 1 Model 2 Model 3 Model 4
VARIABLES MCL Compliance Detection Complaints Satisfaction
Supply 0.00369** 0.0217*
(-0.00146) (-0.0113)
Age of Structure 2.29E-06 0.000169 2.41e-05***
(-6.36E-05) (-0.000431) (-2.35E-06)
Years Since Last Sold 0.000134* -0.00015 0.000102***
(-7.62E-05) (-0.000849) (-7.75E-06)
Log of Property Value -0.000241 0.00334 0.00200***
(-0.000905) (-0.0127) (-0.000141)
Poverty Rate -0.000147 -0.000519
(-0.000124) (-0.00121)
Unemployment Rate 0.00134*** -0.00374
(-0.000462) (-0.00354)
Linguistic Isolation Rate 0.000213 0.00126
(-0.000222) (-0.00243)
Education Percentile -0.000145 0.000189
(-0.000107) (-0.00106)
Race/Ethnicity
Latino 0.44
(-0.278)
Black 0.357
(-0.434)
Korean -1.275
(-1.114)
Chinese 0.0377
(-0.801)
Filipino 2.048***
(-0.742)

75
Other API 0.316
(-0.622)
Other -0.978
(-0.639)
Mixed Race -0.375
(-1.061)
DK/Refuse 0.243
(-0.703)
Income
<$30,000 0.53
(-0.337)
$60,001-$90,000 0.00521
(-0.371)
$90,000-$120,000 0.0288
(-0.403)
$120,001-$150,000 1.127**
(-0.552)
>$150,000 0.248
(-0.467)
DK/Refuse 0.309
(-0.362)
Female -0.774***
(-0.213)
Education
Grades 1-8 1.443*
(-0.741)
Grades 9-11 0.113

76
(-0.601)
Some College -1.025***
(-0.386)
Business or Vocational School
-1.548***
(-0.53)
College Graduate -0.282
(-0.368)
Post-Grad/Professional -0.224
(-0.468)
Don't Know -1.531
(-1.007)
Rent -0.799***
(-0.265)
Don't Know 0.00795
(-0.503)
Constant 1.000*** 0.614*** -0.0280*** 5.125***
(-0.0182) (-0.216) (-0.0018) (-1.244)
Observations 6,371 6,371 714,965 752
R-squared 0.054 0.056 0.003 0.24
Robust standard errors in parentheses
*** p<0.01, ** p<0.05, * p<0.1

77
Appendix 6: CAM Tables
Unweighted Criteria Alternative Matrices

78
Weighted Criteria Alternative Matrices
###


