19
Lab 16: Visio Introduction Armand Poblete (© 2016)

Lab 16: Visio Introduction
Armand Poblete (© 2016)

2 | P a g e Armand Poblete © 2016
CONTENTS
1 Visio- Introduction to DFD – Data Flow Diagraming ............................................................................. 2
1.1 In-Lab ............................................................................................................................................ 3
1.1.1 In-Lab Materials .................................................................................................................... 3
1.1.2 In-Lab Instructions ................................................................................................................ 3
2 Getting started: Let’s decompose the project ...................................................................................... 8
3 Start Diagraming a context diagram ..................................................................................................... 8
4 Start Modeling .................................................................................................................................... 14
4.1 ........................................................................................................................................................... 17
4.2 ........................................................................................................................................................... 17
4.3 Sample ......................................................................................................................................... 17
4.4 Out-Lab........................................................................................................................................ 18
4.5 Out-Lab Materials ....................................................................................................................... 18
4.5.1 Out-Lab Instructions ............................................................................................................. 2
1 VISIO- INTRODUCTION TO DFD – DATA FLOW DIAGRAMING
You've heard it again and again. "A picture is worth a thousand words." But you have to admit: It's true.
And it's truer than ever when you've got Visio on your side.
A two-dimensional diagram that explains how data is processed and transferred in a system and how a
system outputs information. Individuals seeking to draft a data flow diagram must (1) identify external
inputs and outputs, (2) determine how the inputs and outputs relate to each other, and (3) explain with
graphical notation using only 4 symbols.
This powerful program is waiting to help you make picture-perfect diagrams. Maybe you need a
flowchart, an organization chart, an office layout.
Today you will learn how in business we model how data flows into a business system and how it is
processes into information useful for a business to make strategic decisions. It also discovers how data
gets stored, extracted, and reported.
We use a concept called Data Flow Diagraming (DFD) and we will use the Sarson and Gane model in
establishing the basic concepts of DFDs

3 | P a g e Armand Poblete © 2016
1.1 IN-LAB Scenario: You will need is to create an ITIL Process map new clients creating a new account for a small
bank. You will need to include the following process:
1. Client needs to contact bank account specialist to open a new checking or savings account. 2. Client must provide documents e.g. driver’s license and two forms of mailing addresses i.e. gas
or electric bill 3. Bank account specialist must log into the banking system to 4. Notices of service agreements must be signed by both client and specialist, the hardcopy
documents must be scanned and upload to the Bank Database. 5. Once the process is complete then the client should receive a welcome packet and temporary
usernames and passwords for the online account access.
You must create a Context Diagram using a DFD model
1.1.1 In-Lab Materials
1. Microsoft Visio (any version) 2. Internet
1.1.2 In-Lab Instructions
1.1.2.1.1 Step 1: Understanding the rules of DFD or Data Flow Diagrams
Represent both physical and logical information systems.
Only four symbols are used.
Useful for depicting purely logical information flows.
DFDs that detail physical systems differ from system flowcharts which depict details of physical
computing equipment.
4 | P a g e Armand Poblete © 2016
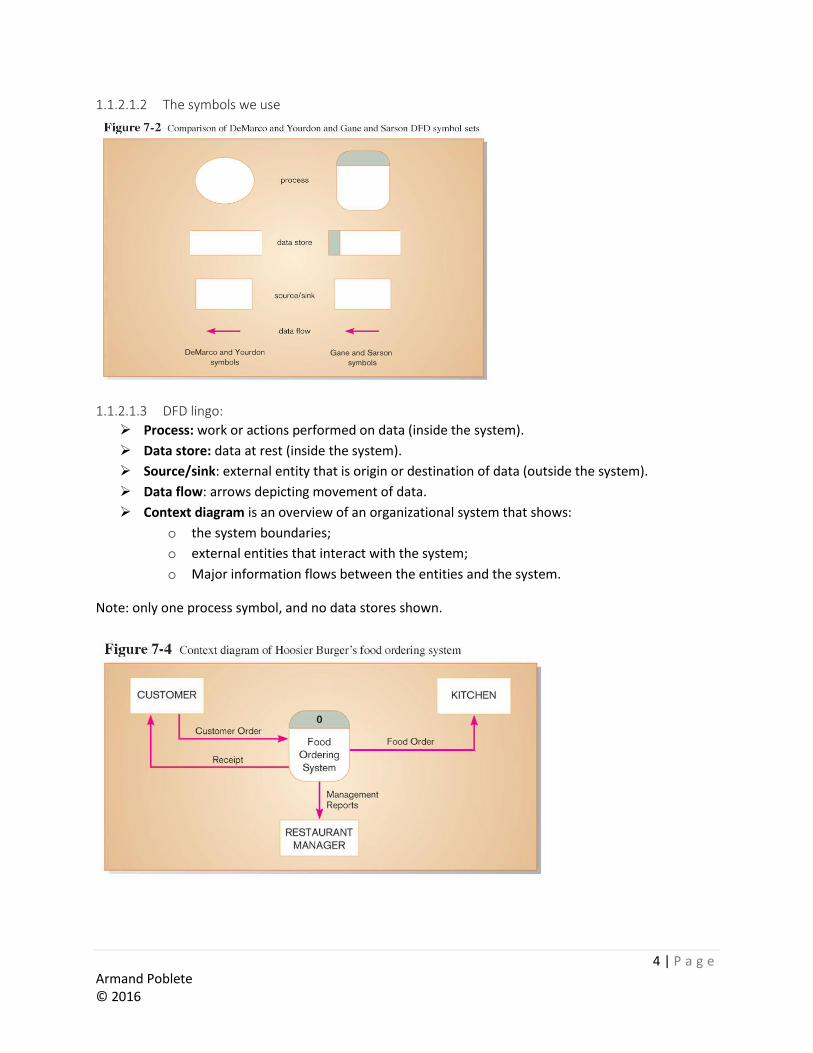
1.1.2.1.2 The symbols we use
1.1.2.1.3 DFD lingo:
Process: work or actions performed on data (inside the system).
Data store: data at rest (inside the system).
Source/sink: external entity that is origin or destination of data (outside the system).
Data flow: arrows depicting movement of data.
Context diagram is an overview of an organizational system that shows:
o the system boundaries;
o external entities that interact with the system;
o Major information flows between the entities and the system.
Note: only one process symbol, and no data stores shown.
5 | P a g e Armand Poblete © 2016
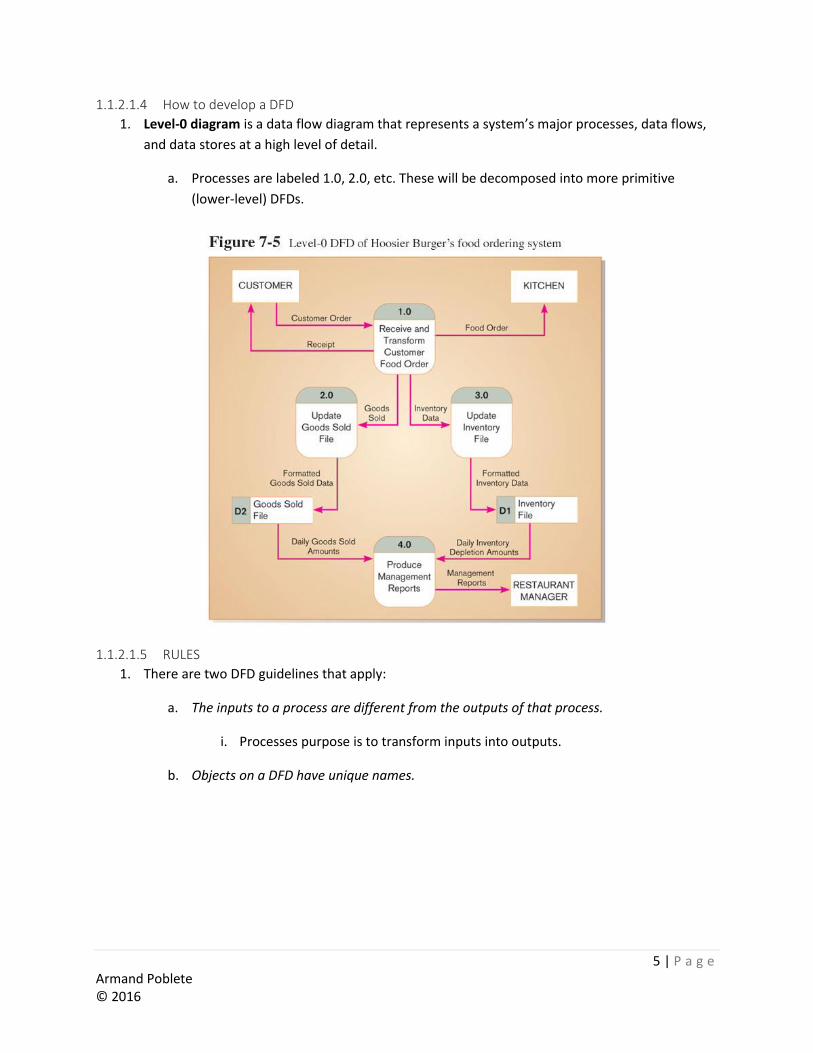
1.1.2.1.4 How to develop a DFD
1. Level-0 diagram is a data flow diagram that represents a system’s major processes, data flows,
and data stores at a high level of detail.
a. Processes are labeled 1.0, 2.0, etc. These will be decomposed into more primitive
(lower-level) DFDs.
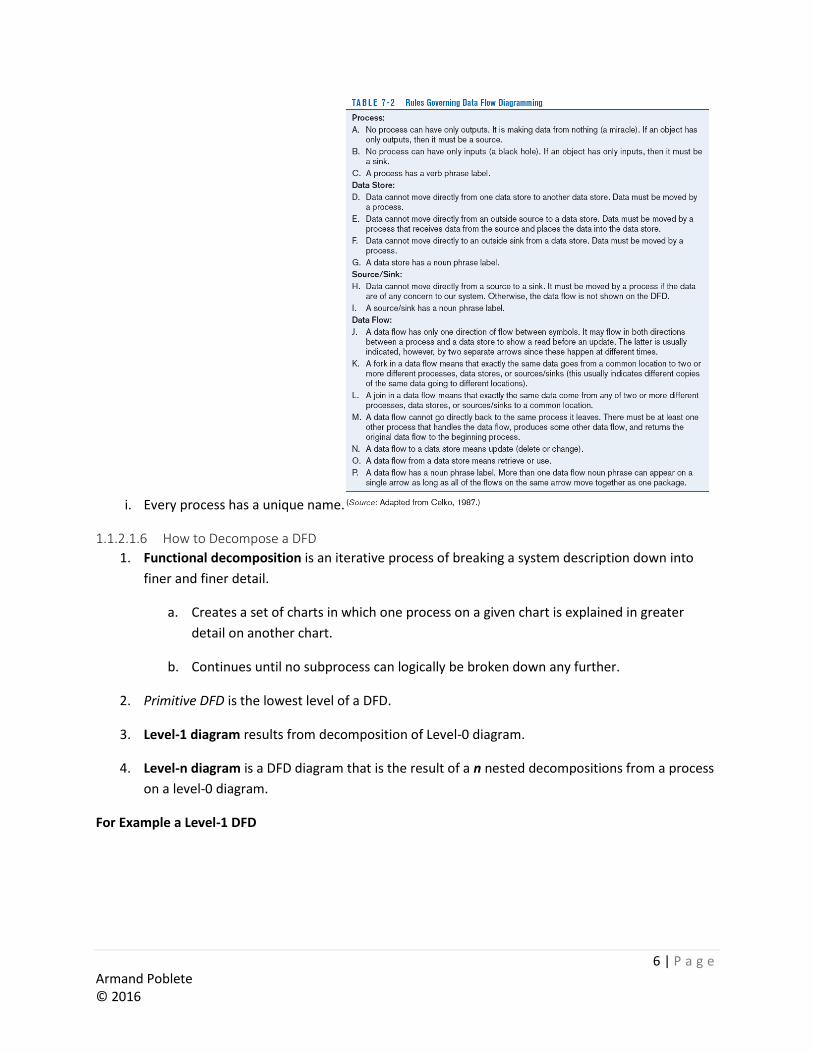
1.1.2.1.5 RULES
1. There are two DFD guidelines that apply:
a. The inputs to a process are different from the outputs of that process.
i. Processes purpose is to transform inputs into outputs.
b. Objects on a DFD have unique names.
6 | P a g e Armand Poblete © 2016
i. Every process has a unique name.
1.1.2.1.6 How to Decompose a DFD
1. Functional decomposition is an iterative process of breaking a system description down into
finer and finer detail.
a. Creates a set of charts in which one process on a given chart is explained in greater
detail on another chart.
b. Continues until no subprocess can logically be broken down any further.
2. Primitive DFD is the lowest level of a DFD.
3. Level-1 diagram results from decomposition of Level-0 diagram.
4. Level-n diagram is a DFD diagram that is the result of a n nested decompositions from a process
on a level-0 diagram.
For Example a Level-1 DFD

7 | P a g e Armand Poblete © 2016
Level-1 DFD shows the sub-processes of one of the processes in the Level-0 DFD.
This is a Level-1 DFD for Process 4.0.
Processes are labeled 4.1, 4.2, etc. These can be further decomposed in more primitive (lower-level)
DFDs if necessary.
A Level-n DFD Example
Level-n DFD shows the sub-processes of one of the processes in the Level n-1 DFD.
This is a Level-2 DFD for Process 4.3.
Processes are labeled 4.3.1, 4.3.2, etc. If this is the lowest level of the hierarchy, it is called a primitive
DFD.

8 | P a g e Armand Poblete © 2016
2 GETTING STARTED: LET’S DECOMPOSE THE PROJECT
Start by identifying the following Roles for the Context Diagram:
Processes Bank System
Source/Sink Client, Account Specialist
Data Store Bank Database
Data Flow - Client contact account specialist -Client provides documents -Client Receives documents to be signed -Account specialist logs into system -Account specialist gives documents to be signed Account Specialist receives signed documents -Files are stored to the Bank Database - Client receives welcome packet
3 START DIAGRAMING A CONTEXT DIAGRAM
Open Visio

9 | P a g e Armand Poblete © 2016

10 | P a g e Armand Poblete © 2016
Once open you should see the following page
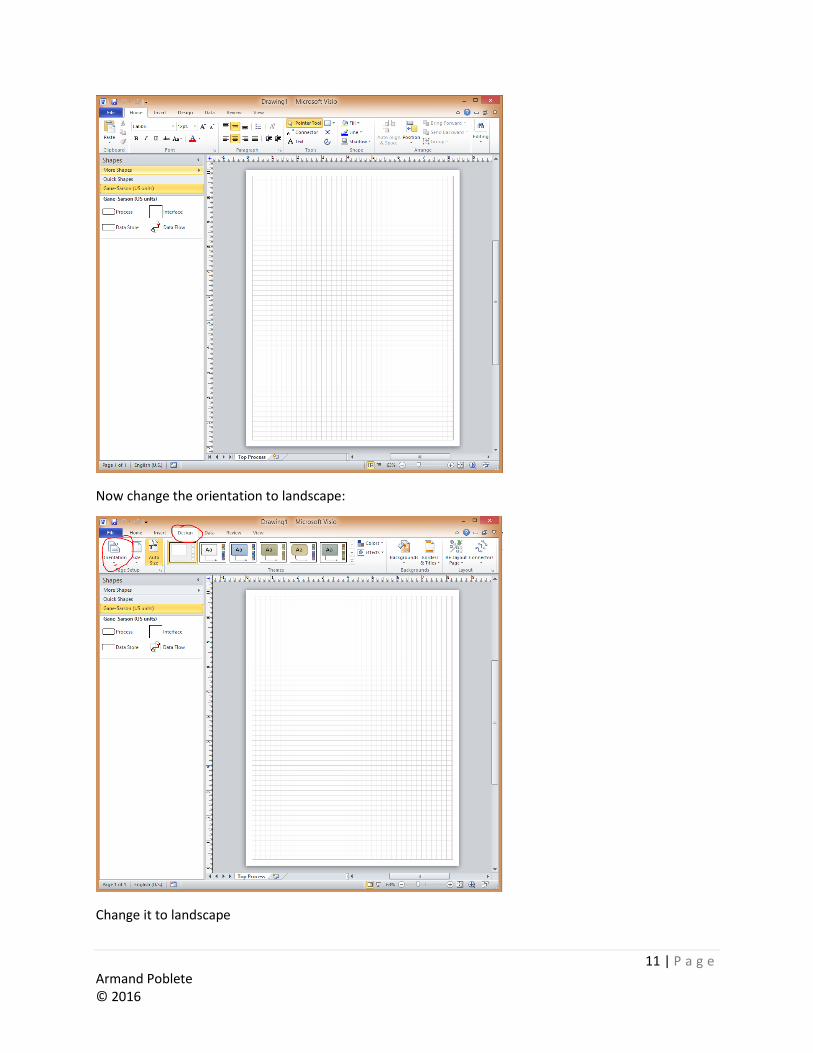
11 | P a g e Armand Poblete © 2016
Now change the orientation to landscape:
Change it to landscape

12 | P a g e Armand Poblete © 2016
Now let’s add a theme
Then let’s add a border and title
I used Urban theme

13 | P a g e Armand Poblete © 2016
Now to add the title look at the bottom left of your document

14 | P a g e Armand Poblete © 2016
Click on the VBacground to edit the title, then click on the Title and start typing the title Creating a New
Account
Once you click out of it should go back to the templage
Now go back to the Top Process Tab and we want to change the tab title by double-clicking on the tab
Once all the formatting is complete then we can start modeling
4 START MODELING
On the left panel you will see the four shapes we are going to work with
* Note that Interface is the same as the source/sink
Based on our decomposition analysis we have 1 process, 2 sources, one data store, and 7 data flows.
Start by adding 1 process by simply dragging the process into the document.

15 | P a g e Armand Poblete © 2016
Repeat the process for the Interface and Data Store. We will work with the data flows once we can see
all our actors in the document
You can resize each object by adjusting the handlebars.
Now we need to label each object by double clicking on each object.

16 | P a g e Armand Poblete © 2016
Now let’s connect them using a data flow arrow. Drag the data flow into client until you see a red
border appear around the client object.

17 | P a g e Armand Poblete © 2016
Connect the Client to the Banking System by stretching the arrow end until 0.0 Banking System gets a
red border.
Double click on the data flow to label it
4.1
4.2
4.3 SAMPLE

18 | P a g e Armand Poblete © 2016
4.4 OUT-LAB Scenario: A cable TV company needs a new system for tech support. So the process is:
1. Operator receives an emailed repair request from a customer and inputs it to the CRM System (Customer Relationship Manager System)
2. A repair analyst logs into the CRM System and forwards the issues to the Technician through the CRM System 3. The CRM System emails the Technician. The tech then logs into the CRM System and emails the Customer via
the CRM on dates and times for the repair 4. Once the technician is completed the work then they go to the CRM System and updates the Work order as
complete and stores the completed work order into the Complete Work Order DB
4.5 OUT-LAB MATERIALS 1. Microsoft Visio 2. Access to the Internet

2 | P a g e Armand Poblete © 2016
4.5.1 Out-Lab Instructions
Step 1: Create the decomposition table below to help you.
DFD OBJECT DEFINITION SHAPE
PROCESSES Process Notations. A process transforms
incoming data flow into outgoing data flow.
EXTERNAL
ENTITIES/SOURCES/SINKS
External Entity Notations. External entities are objects outside the system, with which the system communicates. External entities are sources and destinations of the system's inputs and outputs.
DATA STORES Datastore Notations. Datastores are
repositories of data in the system. They are
sometimes also referred to as files.
DATA FOLLOWS
Dataflow Notations. Dataflows are pipelines
through which packets of information flow.
Label the arrows with the name of the data that
moves through it.
Step 2: Using Visio create DFD using the Gane-Sarson Model


