BIO241 CELL BIOLOGY Wine Fermentation Dr. Newton, Fall 2012 LAB 4: DAY 1 DIRECTIONS PART I. INTRODUCTION 1. Listen and take notes on the background information about fermentation presented in class. Be able to address the following questions in the introduction of your lab report (you will need outside materials to answer some of these questions) a. What is fermentation? How is sugar converted to alcohol and CO 2 ? b. When making alcoholic beverages, what organisms are commonly used? What organism are we using? c. How is fermentation different from cellular respiration? d. Why is it important to keep organisms in anaerobic (without oxygen) conditions? e. Do yeast undergoing fermentation divide? f. What is our biological question? g. What is your hypothesis regarding? The amount of alcohol produced compared to the amount of sugar added? The change in the number of cells compared to 1) the amount of sugar and 2) during fermentation? The amount of CO 2 produced during the first week of fermentation? PART II: LAB INSTRUCTIONS. At the end of lab, 1 group member will need to give me the complete data for their group 1. Form 5 groups, with 4 -5 members each. Write name of group members in lab notebook and on data worksheet. Inform the instructor at the end of the lab. 2. This is experiment will be a classroom effort. Therefore, each group will be making 1 sample that we are testing. I will distribute the complete data of everyone to the class through Moodle. Have 1 group member randomly draw the sample they will be making from the instructor. SAMPLE________________________M
Transcript
BIO241 CELL BIOLOGY Wine Fermentation Dr Newton Fall 2012 LAB 4 DAY 1 DIRECTIONS PART I INTRODUCTION
1 Listen and take notes on the background information about fermentation presented in class Be able to address the following questions in the introduction of your lab report (you will need outside materials to answer some of these questions)
a What is fermentation How is sugar converted to alcohol and CO2 b When making alcoholic beverages what organisms are commonly used What
organism are we using c How is fermentation different from cellular respiration d Why is it important to keep organisms in anaerobic (without oxygen) conditions e Do yeast undergoing fermentation divide f What is our biological question
g What is your hypothesis regarding The amount of alcohol produced compared to the amount of sugar added
The change in the number of cells compared to 1) the amount of sugar and 2) during fermentation
The amount of CO2 produced during the first week of fermentation
PART II LAB INSTRUCTIONS At the end of lab 1 group member will need to give me the complete data for their group
1 Form 5 groups with 4 -5 members each Write name of group members in lab notebook and on data worksheet Inform the instructor at the end of the lab
2 This is experiment will be a classroom effort Therefore each group will be making 1 sample
that we are testing I will distribute the complete data of everyone to the class through Moodle Have 1 group member randomly draw the sample they will be making from the instructor SAMPLE________________________M
BIO241 CELL BIOLOGY Wine Fermentation Dr Newton Fall 2012 SOLUTION CALCULATIONS AND INITIAL MEASUREMENTS
3 Calculate the mass of sugar you will need to add to 600mL to make the Molar solution of your sample Put this calculation in your lab notebook Report this amount the instructor for your group Make your solution of sugar and grape juice using proper measuring techniques (what piece of equipment will you use to measure volume)
4 Once you have made your sugargrape juice solution take initial measurements on the alcohol content of both distilled water and your sugargrape juice solution using the vinometer The questions in italics should be answered in your lab report
bull You will need 500mL to complete the experiment Use the 100mL extra to take your measurements DO NOT GO OVER 100mL for measurements
bull Read the directions in the handouts about how to take measurements using the vinometer
bull Measure and record the alcohol content of pure water (What is the purpose of this measurement)
bull Measure and record the alcohol content of your grape juice + sugar mixture (What is the purpose of this measurement How is it different from the measurement of pure water)
INITIAL CELL NUMBER MEASUREMENTS
5 Next you will take measurements on the amount of yeast you are adding to the wine culture Be sure to pay attention to all instructions regarding how to count cellshellip this is very likely a lab practical question
bull Read about using the hemocytometer in the lab handouts and become familiar with the counting grid and its measurements
bull Focus onto the grid using a 40X objective lens bull Pipette 10microL of well-mixed starter culture onto each loading chamber of the
hemocytometer Liquidcell mixture should spread across the grid bull Count the number of cells in a 1mm2 square of each grid If you are unsure of what to
count ask the instructor bull Have each member of the group count the number of cells on each side of the chamber
and record the results bull Using the formula in the handout determine the number of cells mL in the starter
culture This will tell you the concentration of cells that we are beginning with in the starter culture
bull For your lab report Preparation of starter culture Starter culture was prepared by incubating ~05g of active dry bakerrsquos yeast (Fleischmannrsquos All Natural Active Dry Yeast) to 50mL conical tube at room temperature overnight with the lid loosely capped
6 Calculate the TOTAL number of cells that we are adding the grape juicesugar solution
7 Calculate the TOTAL number of cells present in the 500mL grape juicesugar solution
8 Once you have 1) made your sugargrape juice solution and completed calculations 2) had
each group member count the number of yeast cells in the starting amount inform the instructor and together we will set-up the air-lock system in the back of the lab
BIO241 CELL BIOLOGY Wine Fermentation Dr Newton Fall 2012
a Draw the fermentation set-up in your lab notebook and use labels to describe what you see
b What is the importance putting a piece of the set-up tubing in a flask of water c Why is there an escaper hose
INITIAL CO2 or GAS MEASUREMENTS
9 Describe in your notebook the whether there are bubbles or gas forming 1) AT the time of sample inoculation (when we added the yeast) 2) 2 hours after inoculation (view videos posted on MOODLE)
You are free to leave whenhellip
1) Your calculations are complete and your air-locked sample is prepared 2) Our initial measurements from ALL lab group members are complete 3) Group data has been given to instructor
LOOK ON MOODLE FOR 1) CLASS DATA SET and 2) VIDEOPHOTOGRAPH DATA
Data Collection Worksheet for Wine Fermentation
Part I Day 1Date Sample
1 Vinometer measurementsA What is the alcohol in the water Measure 2X - take average
B What is the alcohol for the wine + sugar Measure 2X - take average
2 Measurement of the number of yeast cellsA The number of cells in the starter culture
No Squares Counted Total Cell Count trials No Squares
Counted Total Cell Count
GRID 1 1
GRID 2 2
Average 3
4
5
6
Average
Calculate the amount of cellsmL of starter cultureUse Average of counts for Group Members
B The amount of cells added to the wine
(number of cells mL) x 2 mL =Total number of cells added to culture
C Calculated number of cells mL in the wine + sugar mixtures cellsmL in culture = (total number of cells added to culture ) 500 mL
3 CO2 FormationA Examine your solution at day 0 time 0 Is there formation of CO2
Average Counts for Group MembersCounts in each Field of View
C Was the measurement for the water compared to (wine + sugar) measurement similar or different Explain why
101012 620 PMHow to Measure the Alcohol Content of Wine | eHowcom
Page 1 of 4httpwwwehowcomhow_5846231_measure-alcohol-content-winehtml
Featured Halloween Allergies
eHow raquo Food amp Drink raquo Wine amp Champagne raquo Alcohol Content in Wine raquo How to Measure the Alcohol Content of Wine
How to Calculate Alcohol Content inWine
How to Calculate Alcohol WithHydrometers
How to Measure the Alcohol Content ofWine
The fermentation is over and you are ready to bottle the wine that you have been carefullynurturing The taste is right but you cannot tell the alcohol content from taste For thatyou need a device called a vinometer an inexpensive tool found at brewing stores or onlineDoes this Spark an idea
Other People Are Reading
Related Ads
Wine for Sale Online
Red Wine
Making Wine
Homemade Wine
Blood Alcohol Content
Search
By Jim Walrod eHow Contributor
1
2
3
4
InstructionsWithdraw a small sample from thefermentor To get an accurate readingespecially with sweet wines mix 1teaspoon of the wine you are testingwith 1 teaspoon of water in a cleancontainer and stir the mixture well Fill the reservoir of the vinometer withthe prepared sample Continue to fill the reservoir until some wine exitsfrom the other end of the device Make sure there are no air bubbles in thetube If they appear tap lightly with your finger until the bubbles disperse
Holding the vinometer upright rotate it 180 degrees and carefully set it on aflat plate Watch as the mixture drains and then record the reading whenthe sample is stabilized in the capillary tube
Sponsored Links
Density MeasurementAccurately Measure Mass Flow and Density with 2-Wire Coriolis MetersEmersonProcesscomMicroMotion
Multiply the number you have recorded by 2 to give the alcohol content ofyour wine For example if the vinometer shows 4 percent then your winehas an alcohol content of 8 percent
Repeat the process three times carefully cleaning all the testing equipmentbetween each sampling Add the results and divide by 3 to reach the final
Things Youll Need
Vinometer
Bite Into Autumn JustAdd Pumpkin
View Photos
Login Ideafeed Get Advice Spark
0
0
1
Like
Send
ExpertsBasics Family Cooking Daily Dishes Entertaining
More eHow
VickiNewton
Text Box
How to use a Vinometer to measure wine content - Document 1
101012 620 PMHow to Measure the Alcohol Content of Wine | eHowcom
Page 2 of 4httpwwwehowcomhow_5846231_measure-alcohol-content-winehtml
How to Make Wine High inAlcohol Content
How to Measure Alcohol
How to Test for AlcoholContent in Homemade Wine
How to Calculate AlcoholContent
How to Calculate BloodAlcohol Content
How to Test for FoodAlcohol Content
How to Calculate the AlcoholContent in Beer
How to test fuels for alcoholcontent
You May Like
5
alcohol content figure You should check the alcohol content of your wineright up to the final bottling
Another way to test for alcohol content is with a winemakers hydrometer Itrequires a larger sample of the wine to be drawn Since alcohol contentneeds to be monitored regularly a hyrdrometer may not be appropriate forthe small batch home winemaker
Sponsored Links
Tips amp Warnings
Clean the vinometer thoroughly after each use
The vinometer is made of glass and is extremely fragile
Related Searches
Vinometer
White Wine Glass
Wine Tasting Trips
Good Wine
Alcohol Hydrometer
References
How to Test for AlcoholContent in Homemade Wine
How to Make Wine High inAlcohol Content
More to ExploreA Dangerous Duo Alcoholand Depression (video)(Health Guru)
Video Courses Learn Shake(Lyndacom)
Whats this
by Josh Ozersky07022012 24631 PM
by Josh Ozersky03192012 13440 PM
The Fried Chicken to End AllFried Chicken
There are by my count at least sevenlevels of fried chicken The worst of
them is good the best which I waited forty-fouryears to find led to what can only be called an out-of-body experience Letrsquos start at hellip
Know Your Knives JoshOzerskyrsquos ComprehensiveGuide
I have a lot of knives You probably dotoo I really donrsquot know what to do with
them all Therersquos a Chinese cleaver a giganticmultipurpose tool I bought for ten dollars a decadeago and which has never hellip
Recent Blog Posts
Recent Blog Posts
Recent Blog Posts
Recent Blog Posts
Recent Blog Posts
Recent Blog Posts
Recent Blog Posts
Recent Blog Posts
Recent Blog Posts
Recent Blog Posts
Recent Blog Posts
Recent Blog Posts
Recent Blog Posts
Recent Blog Posts
Recent Blog Posts
Recent Blog Posts
Recent Blog Posts
Recent Blog PostsRecent Blog Posts
Recent Blog PostsRecent Blog Posts
101012 947 PMStillCooker | Vinometer
Page 1 of 2httpwwwstillcookercommaterials-vinometerphp
Vinometer
A vinometer is a piece apparatus that consist of an open graduated glass tube with a small filling reservoir
The vinometers reservoir or funnel is filled with a small amount of wine being tested until some wine exitsout at the other end It is then turned around and placed on a flat surface filling resevoir side down andallowed to self drain
The alcohol concentration level is read of the vinometers scale on the capillary at the top of the liquid beingmeasured in vv alcohol
The level of the liquid is determined by the modifying affect that alcohol has on the interfacial tensionbetween water and glass and the opposing surface tension of water The greater the alcohol concentration theless marked the liquids capillary action and the lower it will sit in the tube of the vinometer
The vinometer is calculated on the basis of pure alcohol and water solutions whereas wort is not a purewateralcohol solution and the accuracy of a vinometer can not be relied upon
Sugar interferes with the interfacial effects that a vinometers action relies on and hence the method can onlybe applied to fully fermented wort Similarly other components in wort can also interfere with accuratemeasurements
As a rough approximation of the wort alcohol content the use of a vinometer with an internal triangular crosssection has been reported to give improved accuracy
Basic rules you have to keep in mind
Dont spend a fortune on these things They should not cost more than $5 - $10
Where to get it
Check your local homebrew shop They will have them - no doubt about itCheck the web if there is no homebrew shop in your area
Atomic Force Microscopy$24950 Innovative Robust Open Image Nanostructures In Your Lab
wwwafmworkshopcom
VickiNewton
Text Box
How to use a Vinometer to measure wine content - Document 2
Page 1 of 2httpwwwhausserscientificcomproductsreichert_bright_linehtml
935 Horsham Road Suite CHorsham PA 190442156757769
ABOUT US OUR PRODUCTS CUSTOM ORDERS CONTACT US
OUR PRODUCTS
Metallized HemacytometerReichert Bright-Line
The Bright-Line Hemacytometer is molded from a single piece of thermal and shock-resistant glass An H-shaped moat forms two countingareas or plateaus A V slash at the loading side of each plateau facilitates charing and reduces the possibility of overflow into the moat Eachplateau features enhanced Neubauer rulings The ruled surface is 01mm below the cover glass limiting the volume of blood or fluid over asquare mm at 01cumm and over each of 400 squares (within the central square mm) to 000025 cu mm Contact of the flat polished coverglass surfaces with cover glass supports produces an exact volume of fluid over the counting area The difference in surface tensioncharacteristics between the metallic surface on the chamber and the polished cover glass assures smooth capillarity for precise loading andmore even cell distribution
Photograph of 1490 Photograph of 1475
Catalog Description
1490 Counting chamber only
1492 Counting chamber with 2 cover slips
1483 Complete set
1475 Phase counting chamber (used with Phase microscope)
Rulings cover 9 square millimeters Boundary lines of the Neubauer ruling are the center lines of the groups of three (These are indicated inthe illustration below) The central square millimeter is ruled into 25 groups of 16 small squares each group separated by triple lines themiddle one of which is the boundary The ruled surface is 010mm below the cover glass so that the volume over each of the 16 smallsquares is 00025 cubic mm
VickiNewton
Text Box
Product sheet for Reichart Hemocytometer Provides basis for cell count formula
VickiNewton
Text Box
We are using C-chip disposable hemocytometers with the improved Neubauer grid from the INCYTO company
Page 2 of 2httpwwwhausserscientificcomproductsreichert_bright_linehtml
Neubauer Ruling
The number of cells per cubic millimeter = Number of cells counted per square millimeter X dilution (if used) X 10
The number of cells per milliliter = Number of cells counted per square millimeter X dilution (if used) X 10000
One (1) Milliliter = 1000 cubic millimeters (cu mm)
One (1) Microliter (ul) = One (1) cubic millimeter (cu mm)
To clean the counting chamber After completing the count remove the cover glass and clean the counting chamber with water or a mildcleaning solution (10 solution of bleach) Dry the counting chamber with a soft cloth or wipe or rinse with acetone
VickiNewton
Rectangle
9710 220 PMHemocytometer - Wikipedia the free encyclopedia
Page 1 of 3httpenwikipediaorgwikiHemocytometer
A hemocytometer The two semi-reflective rectangles are the
counting chambers
Load a chamber
The parts of the hemocytometer(as viewed from the side) are
The hemocytometer or haemocytometer is a device originallydesigned for the counting of blood cells It is now also used to countother types of cells as well as other microscopic particles
The hemocytometer was invented by Louis-Charles Malassez andconsists of a thick glass microscope slide with a rectangular indentationthat creates a chamber This chamber is engraved with a laser-etchedgrid of perpendicular lines The device is carefully crafted so that thearea bounded by the lines is known and the depth of the chamber isalso known It is therefore possible to count the number of cells orparticles in a specific volume of fluid and thereby calculate theconcentration of cells in the fluid overall
PrinciplesThe ruled area of the hemocytometer consists of several large 1 x 1 mm(1 mm2) squares These are subdivided in 3 ways 025 x 025 mm(00625 mm2) 025 x 020 mm (005 mm2) and 020 x 020 mm(004 mm2) The central 020 x 020 mm marked 1 x 1 mm square isfurther subdivided into 005 x 005 mm (00025 mm2) squares The raisededges of the hemocytometer hold the coverslip 01 mm off the markedgrid This gives each square a defined volume
Dimensions Area Volume at 01 mm depth1 x 1 mm 1 mm2 100 nl
025 x 025 mm 00625 mm2 625 nl
025 x 020 mm 005 mm2 5 nl
020 x 020 mm 004 mm2 4 nl
005 x 005 mm 00025 mm2 025 nl
The cell-sized structures to be counted are those which lie between themiddle of the three lines on the top and right of the square and the innerof the three lines on the bottom and left of the square
In an improved Neubauer hemocytometer (common medium) the totalnumber of cells per ml can be discovered by simply multiplying thetotal number of cells found in the hemocytometer grid (area equal to thered square in picture on right) by 104 (10000)
UsageWhen a liquid sample containing immobilized cells is placed on the chamber it is covered with a cover glassand capillary action completely fills the chamber with the sample Looking at the chamber through amicroscope the number of cells in the chamber can be determined by counting Different kinds of cells can becounted separately as long as they are visually distinguishable The number of cells in the chamber is used to
9710 220 PMHemocytometer - Wikipedia the free encyclopedia
Page 2 of 3httpenwikipediaorgwikiHemocytometer
Empty hemocytometer grid at 100xpower
calculate the concentration or density of the cells in the mixture from which the sample was taken it is thenumber of cells in the chamber divided by the chambers volume (the chambers volume is known from thestart) taking account of any dilutions and counting shortcuts
In the most common design the volume of each large square is 01 mm3 The cells in four large squares arecounted and cells over or touching the lines on top and on the left are counted but cells over or touching theright or bottom lines are ignored The concentration in cells per ml = cells in four squares4 times 10000[1]
Hemocytometers are often used to count blood corpuscles organelles within cells blood cells in cerebrospinalfluid after performing a lumbar puncture or other cell types in suspension Using a hemocytometer to countbacteria results in a total count as it is difficult to distinguish between living and dead organisms unlessTrypan blue is used to stain the non-viable cells
Usage TipsMix the original mixture thoroughly before taking a sample Thisensures that the sample is representative and not just an artifactof the particular region of the original mixture from which it wasdrawnUse an appropriate dilution of the mixture with regard to thenumber of cells to be counted If the sample is not dilutedenough the cells will be too crowded and difficult to count If itis too dilute the sample size will not be enough to make stronginferences about the concentration in the original mixtureNaturally a rough idea of the concentration must be knownbefore beginning in order to guess an appropriate dilution If themixture is colored it may be helpful to memorize a particularintensity of that color at which the mixture tends to be easy toanalyze
Analyze multiple chambers By performing a redundant test on a second chamber the results can becompared If they differ greatly the method of taking the sample may be unreliable (eg the originalmixture is not mixed thoroughly) Take the average of the results for a more accurate calculation
Make sure to put enough liquid on the instrument that some leaks out of the cover glass when it is placedover the chamber Otherwise it is uncertain whether the space under the cover glass is completely filledwith liquid This volume should be the same every time the instrument is used
Do not use a paper wipe to dry the excess liquid The same capillary action that filled the chamber willthen dry it out If using trypan blue rinse the hemocytometer with distilled water to remove the dye andallow it to dry Methylated spirits or alcohol (preferably ethanol) may also be used to cleanse thehemocytometer and it is safe to use lens tissue to wipe the excess away as long as great care is takennot to warp the hemocytometer grid For this reason it is not safe to autoclave (sterilize) ahemocytometer however sterilization should not be essential
Watch out for the objective lens Remember that the hemocytometer is thicker than a normal microscopeslide If focused too closely the objective lens may contact the instrument This may affect the choice ofobjective lens used
Count across the rows or down the columns Use the gridlines to help remember which areas cells havealready been counted
There is no need to count the whole chamber If there are lot of cells perform a count in a section of thechamber and use the grid to determine what proportion of the chamber that is Then extrapolate toestimate how many cells are in the chamber and use that figure in the final calculation This gives speedat the expense of potential accuracy if possible using a more appropriate dilution is better
Are the lines in or out Some cells inevitably fall on top of the outside gridlines that mark the edges ofthe chamber The usual practice is to include cells overlapping the top and left lines but not thoseoverlapping the bottom or right lines - this has the advantage of eliminating redundant counting ifadjacent regions are counted
References
9710 220 PMHemocytometer - Wikipedia the free encyclopedia
Page 3 of 3httpenwikipediaorgwikiHemocytometer
1 ^ Strober W (2001) Monitoring cell growth in Coligan JE Bierer BE Margulies DH Sherach EM Strober WCurrent Protocols in Immunology 5 USA John Wiley amp Sons p A2A1 doi1010020471142735ima03as21(httpdxdoiorg1010022F0471142735ima03as21)
Retrieved from httpenwikipediaorgwikiHemocytometerCategories Laboratory equipment
This page was last modified on 24 August 2010 at 0849Text is available under the Creative Commons Attribution-ShareAlike License additional terms mayapply See Terms of Use for detailsWikipediareg is a registered trademark of the Wikimedia Foundation Inc a non-profit organization
a
b
c
d
Num
ber o
f Cel
ls
are
a co
unte
d (m
m2 )
Dilu
tion
Fact
or
100
00
This
is th
e to
tal s
ize
of th
e ar
ea to
be
coun
ted
in m
m2
a
1 m
m2
b
00
625
mm
2 (16
squ
ares
= 1
mm
2)
c 0
04
mm
2 (25
squ
ares
= 1
mm
2 )
d
0 0
025
mm
2
Indi
cate
s w
here
a s
mal
l vol
ume
was
take
n an
d pu
t int
o a
larg
er v
olum
e to
m
ake
less
con
cent
rate
d
Dilu
tion
Fact
or =
Tot
al V
olum
e of
(sam
ple
+ di
luen
t)
V
olum
e of
sam
ple
The
tota
l num
ber o
f cel
ls th
at
wer
e co
unte
d in
ALL
squ
ares
th
at w
ere
coun
ted
= N
umbe
r of C
ells
m
L (c
ells
m
L)
Form
ula
to c
alcu
late
cel
lsm
L us
ing
Impr
oved
Neu
baue
r Hem
ocyt
omet
er g
rid
BIO241 Cell Biology Lab 5 10-18-2012 Dr Victoria Newton FALL 2012
13 1
Laboratory 5 Directions These are the instructions for the lab and lab report The section of the lab report in which each part should be addressed is indicated in the heading or instructions Instructions for the graphs and table in the results section is described in PART VI The questions in PART VII do not need to be answered in lab but must be answered in the discussion (in paragraph form Do not number should be like a written journal communication) Post your lab results on the chalkboard before you leave lab PART I Observational Results
1 Go to your wine sample Note any change in appearance (in color scent etc) of the culture from Day 1 Indicate whether you see bubbles rising in the flask and if there is froth (bubbles at top) present
PART II Information for Methods Sections For your methods section you will need to identify the information indicated below Use this information to address questions in discussion (PART VI of Lab 5)
1 List ALL the ingredients in order of the grape juice Why is the order of the ingredients important
2 Look at the nutrition and front label of the bottle a What is the volume (in L) of grape juice in the bottle
b Identify the total carbohydrate in grams
c Identify the amount of sugar in g
d You need to calculate the TRUE starting molar concentration Picking either b or c as the mass and using the molecular weight of sugar from the previous lab (Lab 4) what is the starting molar concentration ( b c )
e Based on your answers to the above questions i Is 0 M TRULY 0 M (0 M = zero molar)
ii If not explain why and indicate what the 0M solution is representing and how is it still a useful control
BIO241 Cell Biology Lab 5 10-18-2012 Dr Victoria Newton FALL 2012
13 2
PART III Measure and report the change in the amount of alcohol in your sample
1 Measure a plain water sample using the vinometer and record the results in your notebook This is to confirm that your vinometer measures the liquid similar to previous measurements Note any difference between the samples
2 Record the appearance and CO2 production of your sample (PART I) 3 Dismantle your wine and pour it into the provided plastic beaker Do not disturb the sample for
at least 10 minutes to allow it to settle 4 Measure the alcohol of your wine (juice + sugar) sample using the vinometer and record
the results 5 Calculate the percent () change in ethanol production To calculate the change see the
attached instructions PART IV Measure and report the change in the number of cells in your sample
1 Dilute your wine sample 110 in EXACTLY the same manner as you diluted your sample in Lab 4 (the lab prior to this)
2 Using the hemocytometer provided have a member of the group (who did not load the sample before) load 10microL of your wine sample at each end of the hemocytometer
a For each member of the group count the number of cells using EXACTLY the same protocol that was used in Lab 4 (Same size square(s) same area)
3 Calculate (cellsmL) using the same formula from Lab 4 4 Calculate the change in the number of cellsmL of YOUR SAMPLE using the formula
provided Record your calculations on your results worksheet Your initial measurement is your final calculation of the number of cellsmL in the wine sample
PART V ABSOLUTELY BEFORE YOU LEAVE
1 Write your FINAL results on the chalkboard 2 Make sure I have received either an emailed or handed-in version of the initial measurements
of your group If not give them to me before you leave -------------------------------You have completed the data collection for today-----------------------------
BIO241 Cell Biology Lab 5 10-18-2012 Dr Victoria Newton FALL 2012
13 3
PART VI Graphs to be made for results section Graphs should be made using class data All results and analysis should be completed using the class data Graph 1 change in the alcohol percentage (or content) of all the samples X-axis will have the concentration of sugar with the Y-axis showing the percent change You may use either bar or line graphs Table 1 CO2 production You will have observations for Day 0 Day 4 and Day 7 for each of the conditions Indicate if there bubbles were present Was culture actively bubbling Note any change in appearance Graph 2 change in cells or cell growth in response to additional sugar The X-axis will have the concentration of sugar with the Y-axis showing the percent change in growth PART VII Questions to be answered in your discussion You have questions from the first lab that are to be answered in the Introduction The following questions must be answered in the discussion session of the introduction All of these questions should be answered using the full class data Vinometer measurements
1 Are vinometers a completely reliable measuring tool for alcohol content Explain your reasoning This was the purpose of your plain water measurement since we know this answer should be zero
2 Can sugar content interfere with vinometer measurements Is more sugar likely to increase or decrease the vinometer measurements You will need to research outside material to answer this question correctly
3 Based on the class results explain how the amount of sugar affected the production of ethanol
and carbon dioxide What does this tell you about the amount or rate of fermentation Cell counts
4 As the sugar content of the grape juice increased how did this affect the change in the number of cells that were present
5 Based on the class results explain how the concentration of sugar affects the proliferation of yeast (proliferation = cell division) How does this relate to the energy needs of a cell during cell division
6 Using reputable sources compare the rate of cell growth during fermentation compared to
when oxygen is present and hypothesize when cell division would be faster How could your experiment be altered to test your hypothesis
BIO241 Cell Biology Lab 5 10-18-2012 Dr Victoria Newton FALL 2012
13 4
101712 508 PMHow to calculate percentage change - Math Central
Page 1 of 1httpmathcentralureginacaQQdatabaseQQ0906sgalland1html
Math Central Quandaries amp Queries
Question from Galland
I am working on graphs and I need to find the percentage of increase from one figure to anotherHow do I do that For instance staff hours for 2006 were 28011 and for 2007 were 31230 How do Ifind the percentage of increase
Hi Galland
Percentage change is calculated this way
The sign indicates whether it is a decrease or increase For your example
Since this is a positive figure it is an 115 increase
Hope this helpsStephen La Rocque
Math Central is supported by the University of Regina and the Imperial Oil Foundation
101012 620 PMHow to Measure the Alcohol Content of Wine | eHowcom
Page 2 of 4httpwwwehowcomhow_5846231_measure-alcohol-content-winehtml
How to Make Wine High inAlcohol Content
How to Measure Alcohol
How to Test for AlcoholContent in Homemade Wine
How to Calculate AlcoholContent
How to Calculate BloodAlcohol Content
How to Test for FoodAlcohol Content
How to Calculate the AlcoholContent in Beer
How to test fuels for alcoholcontent
You May Like
5
alcohol content figure You should check the alcohol content of your wineright up to the final bottling
Another way to test for alcohol content is with a winemakers hydrometer Itrequires a larger sample of the wine to be drawn Since alcohol contentneeds to be monitored regularly a hyrdrometer may not be appropriate forthe small batch home winemaker
Sponsored Links
Tips amp Warnings
Clean the vinometer thoroughly after each use
The vinometer is made of glass and is extremely fragile
Related Searches
Vinometer
White Wine Glass
Wine Tasting Trips
Good Wine
Alcohol Hydrometer
References
How to Test for AlcoholContent in Homemade Wine
How to Make Wine High inAlcohol Content
More to ExploreA Dangerous Duo Alcoholand Depression (video)(Health Guru)
Video Courses Learn Shake(Lyndacom)
Whats this
by Josh Ozersky07022012 24631 PM
by Josh Ozersky03192012 13440 PM
The Fried Chicken to End AllFried Chicken
There are by my count at least sevenlevels of fried chicken The worst of
them is good the best which I waited forty-fouryears to find led to what can only be called an out-of-body experience Letrsquos start at hellip
Know Your Knives JoshOzerskyrsquos ComprehensiveGuide
I have a lot of knives You probably dotoo I really donrsquot know what to do with
them all Therersquos a Chinese cleaver a giganticmultipurpose tool I bought for ten dollars a decadeago and which has never hellip
Recent Blog Posts
Recent Blog Posts
Recent Blog Posts
Recent Blog Posts
Recent Blog Posts
Recent Blog Posts
Recent Blog Posts
Recent Blog Posts
Recent Blog Posts
Recent Blog Posts
Recent Blog Posts
Recent Blog Posts
Recent Blog Posts
Recent Blog Posts
Recent Blog Posts
Recent Blog Posts
Recent Blog Posts
Recent Blog PostsRecent Blog Posts
Recent Blog PostsRecent Blog Posts
101012 947 PMStillCooker | Vinometer
Page 1 of 2httpwwwstillcookercommaterials-vinometerphp
Vinometer
A vinometer is a piece apparatus that consist of an open graduated glass tube with a small filling reservoir
The vinometers reservoir or funnel is filled with a small amount of wine being tested until some wine exitsout at the other end It is then turned around and placed on a flat surface filling resevoir side down andallowed to self drain
The alcohol concentration level is read of the vinometers scale on the capillary at the top of the liquid beingmeasured in vv alcohol
The level of the liquid is determined by the modifying affect that alcohol has on the interfacial tensionbetween water and glass and the opposing surface tension of water The greater the alcohol concentration theless marked the liquids capillary action and the lower it will sit in the tube of the vinometer
The vinometer is calculated on the basis of pure alcohol and water solutions whereas wort is not a purewateralcohol solution and the accuracy of a vinometer can not be relied upon
Sugar interferes with the interfacial effects that a vinometers action relies on and hence the method can onlybe applied to fully fermented wort Similarly other components in wort can also interfere with accuratemeasurements
As a rough approximation of the wort alcohol content the use of a vinometer with an internal triangular crosssection has been reported to give improved accuracy
Basic rules you have to keep in mind
Dont spend a fortune on these things They should not cost more than $5 - $10
Where to get it
Check your local homebrew shop They will have them - no doubt about itCheck the web if there is no homebrew shop in your area
Atomic Force Microscopy$24950 Innovative Robust Open Image Nanostructures In Your Lab
wwwafmworkshopcom
VickiNewton
Text Box
How to use a Vinometer to measure wine content - Document 2
Page 1 of 2httpwwwhausserscientificcomproductsreichert_bright_linehtml
935 Horsham Road Suite CHorsham PA 190442156757769
ABOUT US OUR PRODUCTS CUSTOM ORDERS CONTACT US
OUR PRODUCTS
Metallized HemacytometerReichert Bright-Line
The Bright-Line Hemacytometer is molded from a single piece of thermal and shock-resistant glass An H-shaped moat forms two countingareas or plateaus A V slash at the loading side of each plateau facilitates charing and reduces the possibility of overflow into the moat Eachplateau features enhanced Neubauer rulings The ruled surface is 01mm below the cover glass limiting the volume of blood or fluid over asquare mm at 01cumm and over each of 400 squares (within the central square mm) to 000025 cu mm Contact of the flat polished coverglass surfaces with cover glass supports produces an exact volume of fluid over the counting area The difference in surface tensioncharacteristics between the metallic surface on the chamber and the polished cover glass assures smooth capillarity for precise loading andmore even cell distribution
Photograph of 1490 Photograph of 1475
Catalog Description
1490 Counting chamber only
1492 Counting chamber with 2 cover slips
1483 Complete set
1475 Phase counting chamber (used with Phase microscope)
Rulings cover 9 square millimeters Boundary lines of the Neubauer ruling are the center lines of the groups of three (These are indicated inthe illustration below) The central square millimeter is ruled into 25 groups of 16 small squares each group separated by triple lines themiddle one of which is the boundary The ruled surface is 010mm below the cover glass so that the volume over each of the 16 smallsquares is 00025 cubic mm
VickiNewton
Text Box
Product sheet for Reichart Hemocytometer Provides basis for cell count formula
VickiNewton
Text Box
We are using C-chip disposable hemocytometers with the improved Neubauer grid from the INCYTO company
Page 2 of 2httpwwwhausserscientificcomproductsreichert_bright_linehtml
Neubauer Ruling
The number of cells per cubic millimeter = Number of cells counted per square millimeter X dilution (if used) X 10
The number of cells per milliliter = Number of cells counted per square millimeter X dilution (if used) X 10000
One (1) Milliliter = 1000 cubic millimeters (cu mm)
One (1) Microliter (ul) = One (1) cubic millimeter (cu mm)
To clean the counting chamber After completing the count remove the cover glass and clean the counting chamber with water or a mildcleaning solution (10 solution of bleach) Dry the counting chamber with a soft cloth or wipe or rinse with acetone
VickiNewton
Rectangle
9710 220 PMHemocytometer - Wikipedia the free encyclopedia
Page 1 of 3httpenwikipediaorgwikiHemocytometer
A hemocytometer The two semi-reflective rectangles are the
counting chambers
Load a chamber
The parts of the hemocytometer(as viewed from the side) are
The hemocytometer or haemocytometer is a device originallydesigned for the counting of blood cells It is now also used to countother types of cells as well as other microscopic particles
The hemocytometer was invented by Louis-Charles Malassez andconsists of a thick glass microscope slide with a rectangular indentationthat creates a chamber This chamber is engraved with a laser-etchedgrid of perpendicular lines The device is carefully crafted so that thearea bounded by the lines is known and the depth of the chamber isalso known It is therefore possible to count the number of cells orparticles in a specific volume of fluid and thereby calculate theconcentration of cells in the fluid overall
PrinciplesThe ruled area of the hemocytometer consists of several large 1 x 1 mm(1 mm2) squares These are subdivided in 3 ways 025 x 025 mm(00625 mm2) 025 x 020 mm (005 mm2) and 020 x 020 mm(004 mm2) The central 020 x 020 mm marked 1 x 1 mm square isfurther subdivided into 005 x 005 mm (00025 mm2) squares The raisededges of the hemocytometer hold the coverslip 01 mm off the markedgrid This gives each square a defined volume
Dimensions Area Volume at 01 mm depth1 x 1 mm 1 mm2 100 nl
025 x 025 mm 00625 mm2 625 nl
025 x 020 mm 005 mm2 5 nl
020 x 020 mm 004 mm2 4 nl
005 x 005 mm 00025 mm2 025 nl
The cell-sized structures to be counted are those which lie between themiddle of the three lines on the top and right of the square and the innerof the three lines on the bottom and left of the square
In an improved Neubauer hemocytometer (common medium) the totalnumber of cells per ml can be discovered by simply multiplying thetotal number of cells found in the hemocytometer grid (area equal to thered square in picture on right) by 104 (10000)
UsageWhen a liquid sample containing immobilized cells is placed on the chamber it is covered with a cover glassand capillary action completely fills the chamber with the sample Looking at the chamber through amicroscope the number of cells in the chamber can be determined by counting Different kinds of cells can becounted separately as long as they are visually distinguishable The number of cells in the chamber is used to
9710 220 PMHemocytometer - Wikipedia the free encyclopedia
Page 2 of 3httpenwikipediaorgwikiHemocytometer
Empty hemocytometer grid at 100xpower
calculate the concentration or density of the cells in the mixture from which the sample was taken it is thenumber of cells in the chamber divided by the chambers volume (the chambers volume is known from thestart) taking account of any dilutions and counting shortcuts
In the most common design the volume of each large square is 01 mm3 The cells in four large squares arecounted and cells over or touching the lines on top and on the left are counted but cells over or touching theright or bottom lines are ignored The concentration in cells per ml = cells in four squares4 times 10000[1]
Hemocytometers are often used to count blood corpuscles organelles within cells blood cells in cerebrospinalfluid after performing a lumbar puncture or other cell types in suspension Using a hemocytometer to countbacteria results in a total count as it is difficult to distinguish between living and dead organisms unlessTrypan blue is used to stain the non-viable cells
Usage TipsMix the original mixture thoroughly before taking a sample Thisensures that the sample is representative and not just an artifactof the particular region of the original mixture from which it wasdrawnUse an appropriate dilution of the mixture with regard to thenumber of cells to be counted If the sample is not dilutedenough the cells will be too crowded and difficult to count If itis too dilute the sample size will not be enough to make stronginferences about the concentration in the original mixtureNaturally a rough idea of the concentration must be knownbefore beginning in order to guess an appropriate dilution If themixture is colored it may be helpful to memorize a particularintensity of that color at which the mixture tends to be easy toanalyze
Analyze multiple chambers By performing a redundant test on a second chamber the results can becompared If they differ greatly the method of taking the sample may be unreliable (eg the originalmixture is not mixed thoroughly) Take the average of the results for a more accurate calculation
Make sure to put enough liquid on the instrument that some leaks out of the cover glass when it is placedover the chamber Otherwise it is uncertain whether the space under the cover glass is completely filledwith liquid This volume should be the same every time the instrument is used
Do not use a paper wipe to dry the excess liquid The same capillary action that filled the chamber willthen dry it out If using trypan blue rinse the hemocytometer with distilled water to remove the dye andallow it to dry Methylated spirits or alcohol (preferably ethanol) may also be used to cleanse thehemocytometer and it is safe to use lens tissue to wipe the excess away as long as great care is takennot to warp the hemocytometer grid For this reason it is not safe to autoclave (sterilize) ahemocytometer however sterilization should not be essential
Watch out for the objective lens Remember that the hemocytometer is thicker than a normal microscopeslide If focused too closely the objective lens may contact the instrument This may affect the choice ofobjective lens used
Count across the rows or down the columns Use the gridlines to help remember which areas cells havealready been counted
There is no need to count the whole chamber If there are lot of cells perform a count in a section of thechamber and use the grid to determine what proportion of the chamber that is Then extrapolate toestimate how many cells are in the chamber and use that figure in the final calculation This gives speedat the expense of potential accuracy if possible using a more appropriate dilution is better
Are the lines in or out Some cells inevitably fall on top of the outside gridlines that mark the edges ofthe chamber The usual practice is to include cells overlapping the top and left lines but not thoseoverlapping the bottom or right lines - this has the advantage of eliminating redundant counting ifadjacent regions are counted
References
9710 220 PMHemocytometer - Wikipedia the free encyclopedia
Page 3 of 3httpenwikipediaorgwikiHemocytometer
1 ^ Strober W (2001) Monitoring cell growth in Coligan JE Bierer BE Margulies DH Sherach EM Strober WCurrent Protocols in Immunology 5 USA John Wiley amp Sons p A2A1 doi1010020471142735ima03as21(httpdxdoiorg1010022F0471142735ima03as21)
Retrieved from httpenwikipediaorgwikiHemocytometerCategories Laboratory equipment
This page was last modified on 24 August 2010 at 0849Text is available under the Creative Commons Attribution-ShareAlike License additional terms mayapply See Terms of Use for detailsWikipediareg is a registered trademark of the Wikimedia Foundation Inc a non-profit organization
a
b
c
d
Num
ber o
f Cel
ls
are
a co
unte
d (m
m2 )
Dilu
tion
Fact
or
100
00
This
is th
e to
tal s
ize
of th
e ar
ea to
be
coun
ted
in m
m2
a
1 m
m2
b
00
625
mm
2 (16
squ
ares
= 1
mm
2)
c 0
04
mm
2 (25
squ
ares
= 1
mm
2 )
d
0 0
025
mm
2
Indi
cate
s w
here
a s
mal
l vol
ume
was
take
n an
d pu
t int
o a
larg
er v
olum
e to
m
ake
less
con
cent
rate
d
Dilu
tion
Fact
or =
Tot
al V
olum
e of
(sam
ple
+ di
luen
t)
V
olum
e of
sam
ple
The
tota
l num
ber o
f cel
ls th
at
wer
e co
unte
d in
ALL
squ
ares
th
at w
ere
coun
ted
= N
umbe
r of C
ells
m
L (c
ells
m
L)
Form
ula
to c
alcu
late
cel
lsm
L us
ing
Impr
oved
Neu
baue
r Hem
ocyt
omet
er g
rid
BIO241 Cell Biology Lab 5 10-18-2012 Dr Victoria Newton FALL 2012
13 1
Laboratory 5 Directions These are the instructions for the lab and lab report The section of the lab report in which each part should be addressed is indicated in the heading or instructions Instructions for the graphs and table in the results section is described in PART VI The questions in PART VII do not need to be answered in lab but must be answered in the discussion (in paragraph form Do not number should be like a written journal communication) Post your lab results on the chalkboard before you leave lab PART I Observational Results
1 Go to your wine sample Note any change in appearance (in color scent etc) of the culture from Day 1 Indicate whether you see bubbles rising in the flask and if there is froth (bubbles at top) present
PART II Information for Methods Sections For your methods section you will need to identify the information indicated below Use this information to address questions in discussion (PART VI of Lab 5)
1 List ALL the ingredients in order of the grape juice Why is the order of the ingredients important
2 Look at the nutrition and front label of the bottle a What is the volume (in L) of grape juice in the bottle
b Identify the total carbohydrate in grams
c Identify the amount of sugar in g
d You need to calculate the TRUE starting molar concentration Picking either b or c as the mass and using the molecular weight of sugar from the previous lab (Lab 4) what is the starting molar concentration ( b c )
e Based on your answers to the above questions i Is 0 M TRULY 0 M (0 M = zero molar)
ii If not explain why and indicate what the 0M solution is representing and how is it still a useful control
BIO241 Cell Biology Lab 5 10-18-2012 Dr Victoria Newton FALL 2012
13 2
PART III Measure and report the change in the amount of alcohol in your sample
1 Measure a plain water sample using the vinometer and record the results in your notebook This is to confirm that your vinometer measures the liquid similar to previous measurements Note any difference between the samples
2 Record the appearance and CO2 production of your sample (PART I) 3 Dismantle your wine and pour it into the provided plastic beaker Do not disturb the sample for
at least 10 minutes to allow it to settle 4 Measure the alcohol of your wine (juice + sugar) sample using the vinometer and record
the results 5 Calculate the percent () change in ethanol production To calculate the change see the
attached instructions PART IV Measure and report the change in the number of cells in your sample
1 Dilute your wine sample 110 in EXACTLY the same manner as you diluted your sample in Lab 4 (the lab prior to this)
2 Using the hemocytometer provided have a member of the group (who did not load the sample before) load 10microL of your wine sample at each end of the hemocytometer
a For each member of the group count the number of cells using EXACTLY the same protocol that was used in Lab 4 (Same size square(s) same area)
3 Calculate (cellsmL) using the same formula from Lab 4 4 Calculate the change in the number of cellsmL of YOUR SAMPLE using the formula
provided Record your calculations on your results worksheet Your initial measurement is your final calculation of the number of cellsmL in the wine sample
PART V ABSOLUTELY BEFORE YOU LEAVE
1 Write your FINAL results on the chalkboard 2 Make sure I have received either an emailed or handed-in version of the initial measurements
of your group If not give them to me before you leave -------------------------------You have completed the data collection for today-----------------------------
BIO241 Cell Biology Lab 5 10-18-2012 Dr Victoria Newton FALL 2012
13 3
PART VI Graphs to be made for results section Graphs should be made using class data All results and analysis should be completed using the class data Graph 1 change in the alcohol percentage (or content) of all the samples X-axis will have the concentration of sugar with the Y-axis showing the percent change You may use either bar or line graphs Table 1 CO2 production You will have observations for Day 0 Day 4 and Day 7 for each of the conditions Indicate if there bubbles were present Was culture actively bubbling Note any change in appearance Graph 2 change in cells or cell growth in response to additional sugar The X-axis will have the concentration of sugar with the Y-axis showing the percent change in growth PART VII Questions to be answered in your discussion You have questions from the first lab that are to be answered in the Introduction The following questions must be answered in the discussion session of the introduction All of these questions should be answered using the full class data Vinometer measurements
1 Are vinometers a completely reliable measuring tool for alcohol content Explain your reasoning This was the purpose of your plain water measurement since we know this answer should be zero
2 Can sugar content interfere with vinometer measurements Is more sugar likely to increase or decrease the vinometer measurements You will need to research outside material to answer this question correctly
3 Based on the class results explain how the amount of sugar affected the production of ethanol
and carbon dioxide What does this tell you about the amount or rate of fermentation Cell counts
4 As the sugar content of the grape juice increased how did this affect the change in the number of cells that were present
5 Based on the class results explain how the concentration of sugar affects the proliferation of yeast (proliferation = cell division) How does this relate to the energy needs of a cell during cell division
6 Using reputable sources compare the rate of cell growth during fermentation compared to
when oxygen is present and hypothesize when cell division would be faster How could your experiment be altered to test your hypothesis
BIO241 Cell Biology Lab 5 10-18-2012 Dr Victoria Newton FALL 2012
13 4
101712 508 PMHow to calculate percentage change - Math Central
Page 1 of 1httpmathcentralureginacaQQdatabaseQQ0906sgalland1html
Math Central Quandaries amp Queries
Question from Galland
I am working on graphs and I need to find the percentage of increase from one figure to anotherHow do I do that For instance staff hours for 2006 were 28011 and for 2007 were 31230 How do Ifind the percentage of increase
Hi Galland
Percentage change is calculated this way
The sign indicates whether it is a decrease or increase For your example
Since this is a positive figure it is an 115 increase
Hope this helpsStephen La Rocque
Math Central is supported by the University of Regina and the Imperial Oil Foundation
9710 220 PMHemocytometer - Wikipedia the free encyclopedia
Page 3 of 3httpenwikipediaorgwikiHemocytometer
1 ^ Strober W (2001) Monitoring cell growth in Coligan JE Bierer BE Margulies DH Sherach EM Strober WCurrent Protocols in Immunology 5 USA John Wiley amp Sons p A2A1 doi1010020471142735ima03as21(httpdxdoiorg1010022F0471142735ima03as21)
Retrieved from httpenwikipediaorgwikiHemocytometerCategories Laboratory equipment
This page was last modified on 24 August 2010 at 0849Text is available under the Creative Commons Attribution-ShareAlike License additional terms mayapply See Terms of Use for detailsWikipediareg is a registered trademark of the Wikimedia Foundation Inc a non-profit organization
a
b
c
d
Num
ber o
f Cel
ls
are
a co
unte
d (m
m2 )
Dilu
tion
Fact
or
100
00
This
is th
e to
tal s
ize
of th
e ar
ea to
be
coun
ted
in m
m2
a
1 m
m2
b
00
625
mm
2 (16
squ
ares
= 1
mm
2)
c 0
04
mm
2 (25
squ
ares
= 1
mm
2 )
d
0 0
025
mm
2
Indi
cate
s w
here
a s
mal
l vol
ume
was
take
n an
d pu
t int
o a
larg
er v
olum
e to
m
ake
less
con
cent
rate
d
Dilu
tion
Fact
or =
Tot
al V
olum
e of
(sam
ple
+ di
luen
t)
V
olum
e of
sam
ple
The
tota
l num
ber o
f cel
ls th
at
wer
e co
unte
d in
ALL
squ
ares
th
at w
ere
coun
ted
= N
umbe
r of C
ells
m
L (c
ells
m
L)
Form
ula
to c
alcu
late
cel
lsm
L us
ing
Impr
oved
Neu
baue
r Hem
ocyt
omet
er g
rid
BIO241 Cell Biology Lab 5 10-18-2012 Dr Victoria Newton FALL 2012
13 1
Laboratory 5 Directions These are the instructions for the lab and lab report The section of the lab report in which each part should be addressed is indicated in the heading or instructions Instructions for the graphs and table in the results section is described in PART VI The questions in PART VII do not need to be answered in lab but must be answered in the discussion (in paragraph form Do not number should be like a written journal communication) Post your lab results on the chalkboard before you leave lab PART I Observational Results
1 Go to your wine sample Note any change in appearance (in color scent etc) of the culture from Day 1 Indicate whether you see bubbles rising in the flask and if there is froth (bubbles at top) present
PART II Information for Methods Sections For your methods section you will need to identify the information indicated below Use this information to address questions in discussion (PART VI of Lab 5)
1 List ALL the ingredients in order of the grape juice Why is the order of the ingredients important
2 Look at the nutrition and front label of the bottle a What is the volume (in L) of grape juice in the bottle
b Identify the total carbohydrate in grams
c Identify the amount of sugar in g
d You need to calculate the TRUE starting molar concentration Picking either b or c as the mass and using the molecular weight of sugar from the previous lab (Lab 4) what is the starting molar concentration ( b c )
e Based on your answers to the above questions i Is 0 M TRULY 0 M (0 M = zero molar)
ii If not explain why and indicate what the 0M solution is representing and how is it still a useful control
BIO241 Cell Biology Lab 5 10-18-2012 Dr Victoria Newton FALL 2012
13 2
PART III Measure and report the change in the amount of alcohol in your sample
1 Measure a plain water sample using the vinometer and record the results in your notebook This is to confirm that your vinometer measures the liquid similar to previous measurements Note any difference between the samples
2 Record the appearance and CO2 production of your sample (PART I) 3 Dismantle your wine and pour it into the provided plastic beaker Do not disturb the sample for
at least 10 minutes to allow it to settle 4 Measure the alcohol of your wine (juice + sugar) sample using the vinometer and record
the results 5 Calculate the percent () change in ethanol production To calculate the change see the
attached instructions PART IV Measure and report the change in the number of cells in your sample
1 Dilute your wine sample 110 in EXACTLY the same manner as you diluted your sample in Lab 4 (the lab prior to this)
2 Using the hemocytometer provided have a member of the group (who did not load the sample before) load 10microL of your wine sample at each end of the hemocytometer
a For each member of the group count the number of cells using EXACTLY the same protocol that was used in Lab 4 (Same size square(s) same area)
3 Calculate (cellsmL) using the same formula from Lab 4 4 Calculate the change in the number of cellsmL of YOUR SAMPLE using the formula
provided Record your calculations on your results worksheet Your initial measurement is your final calculation of the number of cellsmL in the wine sample
PART V ABSOLUTELY BEFORE YOU LEAVE
1 Write your FINAL results on the chalkboard 2 Make sure I have received either an emailed or handed-in version of the initial measurements
of your group If not give them to me before you leave -------------------------------You have completed the data collection for today-----------------------------
BIO241 Cell Biology Lab 5 10-18-2012 Dr Victoria Newton FALL 2012
13 3
PART VI Graphs to be made for results section Graphs should be made using class data All results and analysis should be completed using the class data Graph 1 change in the alcohol percentage (or content) of all the samples X-axis will have the concentration of sugar with the Y-axis showing the percent change You may use either bar or line graphs Table 1 CO2 production You will have observations for Day 0 Day 4 and Day 7 for each of the conditions Indicate if there bubbles were present Was culture actively bubbling Note any change in appearance Graph 2 change in cells or cell growth in response to additional sugar The X-axis will have the concentration of sugar with the Y-axis showing the percent change in growth PART VII Questions to be answered in your discussion You have questions from the first lab that are to be answered in the Introduction The following questions must be answered in the discussion session of the introduction All of these questions should be answered using the full class data Vinometer measurements
1 Are vinometers a completely reliable measuring tool for alcohol content Explain your reasoning This was the purpose of your plain water measurement since we know this answer should be zero
2 Can sugar content interfere with vinometer measurements Is more sugar likely to increase or decrease the vinometer measurements You will need to research outside material to answer this question correctly
3 Based on the class results explain how the amount of sugar affected the production of ethanol
and carbon dioxide What does this tell you about the amount or rate of fermentation Cell counts
4 As the sugar content of the grape juice increased how did this affect the change in the number of cells that were present
5 Based on the class results explain how the concentration of sugar affects the proliferation of yeast (proliferation = cell division) How does this relate to the energy needs of a cell during cell division
6 Using reputable sources compare the rate of cell growth during fermentation compared to
when oxygen is present and hypothesize when cell division would be faster How could your experiment be altered to test your hypothesis
BIO241 Cell Biology Lab 5 10-18-2012 Dr Victoria Newton FALL 2012
13 4
101712 508 PMHow to calculate percentage change - Math Central
Page 1 of 1httpmathcentralureginacaQQdatabaseQQ0906sgalland1html
Math Central Quandaries amp Queries
Question from Galland
I am working on graphs and I need to find the percentage of increase from one figure to anotherHow do I do that For instance staff hours for 2006 were 28011 and for 2007 were 31230 How do Ifind the percentage of increase
Hi Galland
Percentage change is calculated this way
The sign indicates whether it is a decrease or increase For your example
Since this is a positive figure it is an 115 increase
Hope this helpsStephen La Rocque
Math Central is supported by the University of Regina and the Imperial Oil Foundation
a
b
c
d
Num
ber o
f Cel
ls
are
a co
unte
d (m
m2 )
Dilu
tion
Fact
or
100
00
This
is th
e to
tal s
ize
of th
e ar
ea to
be
coun
ted
in m
m2
a
1 m
m2
b
00
625
mm
2 (16
squ
ares
= 1
mm
2)
c 0
04
mm
2 (25
squ
ares
= 1
mm
2 )
d
0 0
025
mm
2
Indi
cate
s w
here
a s
mal
l vol
ume
was
take
n an
d pu
t int
o a
larg
er v
olum
e to
m
ake
less
con
cent
rate
d
Dilu
tion
Fact
or =
Tot
al V
olum
e of
(sam
ple
+ di
luen
t)
V
olum
e of
sam
ple
The
tota
l num
ber o
f cel
ls th
at
wer
e co
unte
d in
ALL
squ
ares
th
at w
ere
coun
ted
= N
umbe
r of C
ells
m
L (c
ells
m
L)
Form
ula
to c
alcu
late
cel
lsm
L us
ing
Impr
oved
Neu
baue
r Hem
ocyt
omet
er g
rid
BIO241 Cell Biology Lab 5 10-18-2012 Dr Victoria Newton FALL 2012
13 1
Laboratory 5 Directions These are the instructions for the lab and lab report The section of the lab report in which each part should be addressed is indicated in the heading or instructions Instructions for the graphs and table in the results section is described in PART VI The questions in PART VII do not need to be answered in lab but must be answered in the discussion (in paragraph form Do not number should be like a written journal communication) Post your lab results on the chalkboard before you leave lab PART I Observational Results
1 Go to your wine sample Note any change in appearance (in color scent etc) of the culture from Day 1 Indicate whether you see bubbles rising in the flask and if there is froth (bubbles at top) present
PART II Information for Methods Sections For your methods section you will need to identify the information indicated below Use this information to address questions in discussion (PART VI of Lab 5)
1 List ALL the ingredients in order of the grape juice Why is the order of the ingredients important
2 Look at the nutrition and front label of the bottle a What is the volume (in L) of grape juice in the bottle
b Identify the total carbohydrate in grams
c Identify the amount of sugar in g
d You need to calculate the TRUE starting molar concentration Picking either b or c as the mass and using the molecular weight of sugar from the previous lab (Lab 4) what is the starting molar concentration ( b c )
e Based on your answers to the above questions i Is 0 M TRULY 0 M (0 M = zero molar)
ii If not explain why and indicate what the 0M solution is representing and how is it still a useful control
BIO241 Cell Biology Lab 5 10-18-2012 Dr Victoria Newton FALL 2012
13 2
PART III Measure and report the change in the amount of alcohol in your sample
1 Measure a plain water sample using the vinometer and record the results in your notebook This is to confirm that your vinometer measures the liquid similar to previous measurements Note any difference between the samples
2 Record the appearance and CO2 production of your sample (PART I) 3 Dismantle your wine and pour it into the provided plastic beaker Do not disturb the sample for
at least 10 minutes to allow it to settle 4 Measure the alcohol of your wine (juice + sugar) sample using the vinometer and record
the results 5 Calculate the percent () change in ethanol production To calculate the change see the
attached instructions PART IV Measure and report the change in the number of cells in your sample
1 Dilute your wine sample 110 in EXACTLY the same manner as you diluted your sample in Lab 4 (the lab prior to this)
2 Using the hemocytometer provided have a member of the group (who did not load the sample before) load 10microL of your wine sample at each end of the hemocytometer
a For each member of the group count the number of cells using EXACTLY the same protocol that was used in Lab 4 (Same size square(s) same area)
3 Calculate (cellsmL) using the same formula from Lab 4 4 Calculate the change in the number of cellsmL of YOUR SAMPLE using the formula
provided Record your calculations on your results worksheet Your initial measurement is your final calculation of the number of cellsmL in the wine sample
PART V ABSOLUTELY BEFORE YOU LEAVE
1 Write your FINAL results on the chalkboard 2 Make sure I have received either an emailed or handed-in version of the initial measurements
of your group If not give them to me before you leave -------------------------------You have completed the data collection for today-----------------------------
BIO241 Cell Biology Lab 5 10-18-2012 Dr Victoria Newton FALL 2012
13 3
PART VI Graphs to be made for results section Graphs should be made using class data All results and analysis should be completed using the class data Graph 1 change in the alcohol percentage (or content) of all the samples X-axis will have the concentration of sugar with the Y-axis showing the percent change You may use either bar or line graphs Table 1 CO2 production You will have observations for Day 0 Day 4 and Day 7 for each of the conditions Indicate if there bubbles were present Was culture actively bubbling Note any change in appearance Graph 2 change in cells or cell growth in response to additional sugar The X-axis will have the concentration of sugar with the Y-axis showing the percent change in growth PART VII Questions to be answered in your discussion You have questions from the first lab that are to be answered in the Introduction The following questions must be answered in the discussion session of the introduction All of these questions should be answered using the full class data Vinometer measurements
1 Are vinometers a completely reliable measuring tool for alcohol content Explain your reasoning This was the purpose of your plain water measurement since we know this answer should be zero
2 Can sugar content interfere with vinometer measurements Is more sugar likely to increase or decrease the vinometer measurements You will need to research outside material to answer this question correctly
3 Based on the class results explain how the amount of sugar affected the production of ethanol
and carbon dioxide What does this tell you about the amount or rate of fermentation Cell counts
4 As the sugar content of the grape juice increased how did this affect the change in the number of cells that were present
5 Based on the class results explain how the concentration of sugar affects the proliferation of yeast (proliferation = cell division) How does this relate to the energy needs of a cell during cell division
6 Using reputable sources compare the rate of cell growth during fermentation compared to
when oxygen is present and hypothesize when cell division would be faster How could your experiment be altered to test your hypothesis
BIO241 Cell Biology Lab 5 10-18-2012 Dr Victoria Newton FALL 2012
13 4
101712 508 PMHow to calculate percentage change - Math Central
Page 1 of 1httpmathcentralureginacaQQdatabaseQQ0906sgalland1html
Math Central Quandaries amp Queries
Question from Galland
I am working on graphs and I need to find the percentage of increase from one figure to anotherHow do I do that For instance staff hours for 2006 were 28011 and for 2007 were 31230 How do Ifind the percentage of increase
Hi Galland
Percentage change is calculated this way
The sign indicates whether it is a decrease or increase For your example
Since this is a positive figure it is an 115 increase
Hope this helpsStephen La Rocque
Math Central is supported by the University of Regina and the Imperial Oil Foundation
BIO241 Cell Biology Lab 5 10-18-2012 Dr Victoria Newton FALL 2012
13 4
101712 508 PMHow to calculate percentage change - Math Central
Page 1 of 1httpmathcentralureginacaQQdatabaseQQ0906sgalland1html
Math Central Quandaries amp Queries
Question from Galland
I am working on graphs and I need to find the percentage of increase from one figure to anotherHow do I do that For instance staff hours for 2006 were 28011 and for 2007 were 31230 How do Ifind the percentage of increase
Hi Galland
Percentage change is calculated this way
The sign indicates whether it is a decrease or increase For your example
Since this is a positive figure it is an 115 increase
Hope this helpsStephen La Rocque
Math Central is supported by the University of Regina and the Imperial Oil Foundation


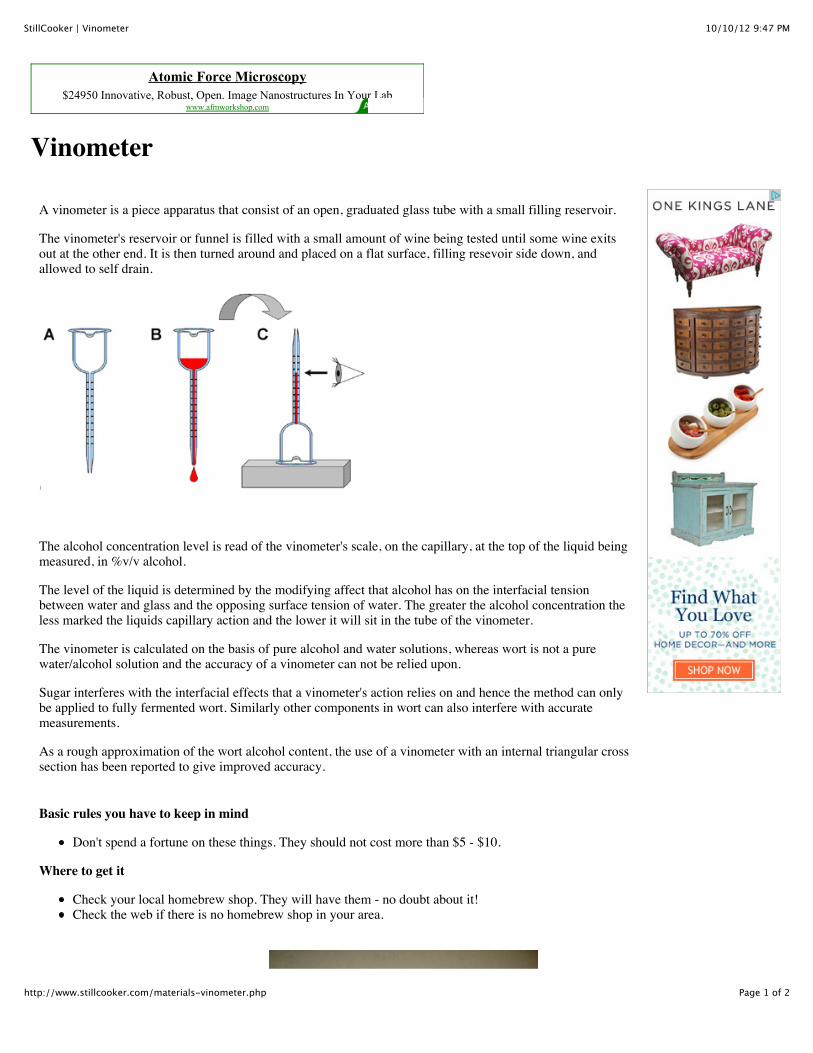


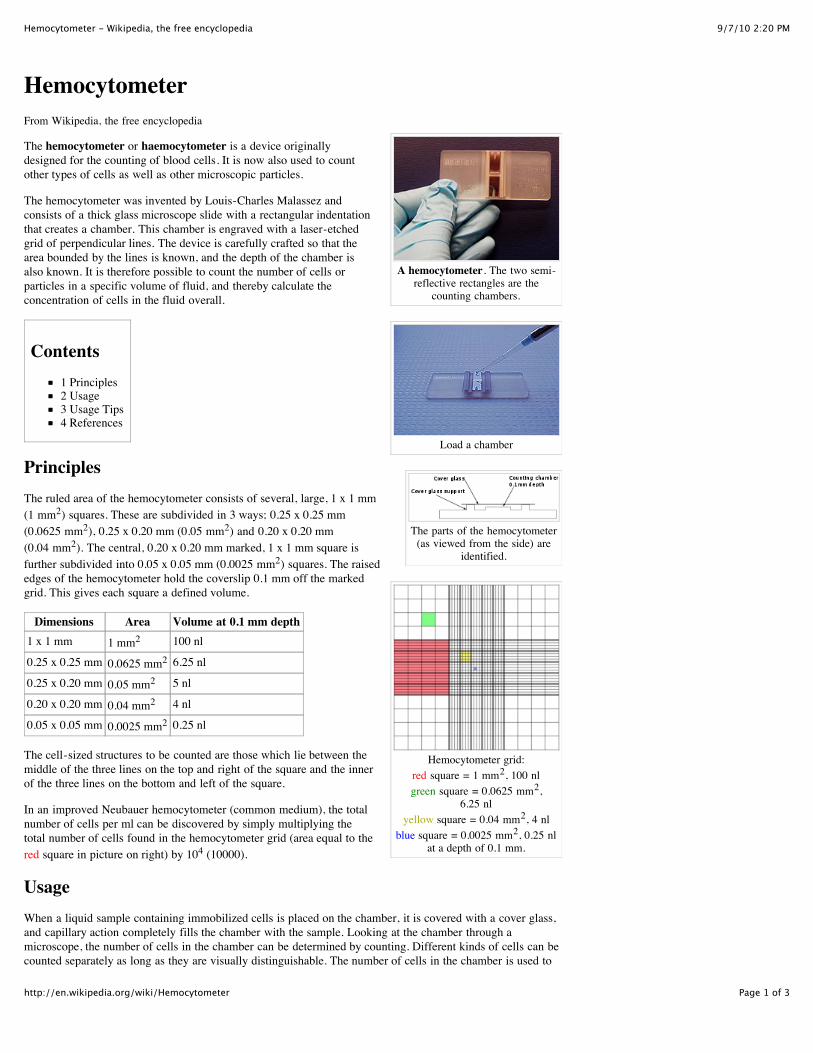


![Electronics LAB [with Arduino] | DAY 1](https://static.documents.pub/doc/80x56/5400e5a08d7f72df628b45ec/electronics-lab-with-arduino-day-1.jpg)


