Page 1
United Kingdom Accreditation Service 2 Pine Trees, Chertsey Lane, Staines-upon-Thames, TW18 3HR Website: www.ukas.com Publications requests email: [email protected]
© United Kingdom Accreditation Service. UKAS copyright exists on all UKAS publications.
LAB 48 Edition 3 Page 1 of 37
LAB 48
Edition 3 June 2020
Decision Rules and Statements of Conformity
Page 2
Decision Rules and Statements of Conformity
United Kingdom Accreditation Service 2 Pine Trees, Chertsey Lane, Staines-upon-Thames, TW18 3HR Website: www.ukas.com Publications requests email: [email protected]
© United Kingdom Accreditation Service. UKAS copyright exists on all UKAS publications.
LAB 48 Edition 3 Page 2 of 37
Contents
Introduction 3
Example 1: Test standard is a “validated” method 4
Example 2: Test scenario with no uncertainty in the outcome 5
Example 3: Test scenario in which a customer asks a laboratory to “ignore uncertainty” 6
Example 4: Test standard does not mention measurement uncertainty 7
Example 5: Double sided tolerance limit, DR: pc ≥ 95 % 8
Example 6: Single sided lower tolerance limit (JCGM106 7.3.3 Ex 2) 9
Example 7: Single sided upper tolerance limit (JCGM106 7.3.3 Ex 1) 11
Example 8: Single sided upper tolerance limit, DR: Pass when PFA ≤ PFAmax 12
Example 9: Single sided upper tolerance limit, DR: Accept when PFA ≤ PFAmax 13
Example 10: Single sided lower tolerance limit, DR: Accept when PFA ≤ PFAmax 14
Example 11: Single sided upper tolerance limit, DR: Accept when PFA ≤ PFAmax (JCGM106 8.3.3.2 Ex 1) 16
Example 12: Double sided tolerance limits (JCGM106 7.4) 17
Example 13: Double sided tolerance limit, DR1: w = 2u; DR2: ‘Constrained’ Simple Acceptance with u ≤ umax 19
Example 14: Inspection of levels (conformity decisions for discrete measurements) 20
Appendix A: Glossary 22
Appendix B: Measurement results and specifications 23
Appendix C: Conformance probability and risk 25
Appendix D: Guard-band factor kw 30
Appendix E: The problem with decision rules that do not take account of measurement uncertainty 33
Reference documents 37
Changes since last edition
Minor corrections:
1. Replace symbol used for guard band factor 𝑘 with 𝑘𝑤 to avoid potential for confusion with coverage
factor used to define coverage intervals when reporting measurement results
2. Correction to example following C.6 to state the correct degrees of freedom (3 not 5)
3. Correction to equation D.4, introducing missing terms for degrees of freedom
4. Correction to step 4 in procedure for establishing coverage factor for double-sided acceptance
intervals, removing superfluous equation
Page 3
Decision Rules and Statements of Conformity
United Kingdom Accreditation Service 2 Pine Trees, Chertsey Lane, Staines-upon-Thames, TW18 3HR Website: www.ukas.com Publications requests email: [email protected]
© United Kingdom Accreditation Service. UKAS copyright exists on all UKAS publications.
LAB 48 Edition 3 Page 3 of 37
Introduction
The general requirements that testing and calibration laboratories have to meet if they wish to demonstrate
that they operate to a quality system, are technically competent and are able to generate technically valid
results are contained within ISO/IEC 17025:2017. This international standard forms the basis for international
laboratory accreditation and in cases of differences in interpretation remains the authoritative document at
all times.
Additional guidance for the purposes of accreditation is provided by ILAC in the form of policy requirements
and guidance. In particular, ILAC G8:09/2019 ‘Guidelines on Decision Rules and Statements of Conformity’
provides an overview of the requirements stated in ISO/IEC 17025:2017 that concern statements of
conformity (not reproduced here) and describes how certain Decision Rules can be selected and how
uncertainty can (and must) be taken into account by either ‘direct’ or ‘indirect’ means. It also provides a
limited number of worked examples.
The stated purpose of ILAC-G8 is to provide “an overview for assessors, laboratories, regulators and
customers concerning decision rules and conformity with requirements. It does not enter into the details
regarding underlying statistics and mathematics but refers readers to the relevant literature. This means that
some laboratories, their personnel and their customers may be required to improve their knowledge related
to decision rule risks and associated statistics.” This UKAS guidance document, LAB 48, provides some
supporting material and additional guidance examples to assist in that process.
The material provided here is quite varied, but it is not intended to cover all possible decision scenarios,
rather it is intended to demonstrate various principles. In keeping with the diverse nature of practical
conformity decision scenarios the format and structure of the examples is also intentionally diverse.
The main body of this document begins with several examples that address various hypothetical Decision
Rule (DR) scenarios. Later examples demonstrate how conformance probability and specific risk may be
calculated for various situations and how suitable Decision Rules might be defined.
Finally, several Appendices are provided that give a glossary of some of the terminology used in the main
body examples, as well as an overview of how conformance probability and risk can be calculated using
standard Excel Worksheet functions in situations where the measurement uncertainty can be described by
a Gaussian probability density function (PDF) or a PDF based upon a t-distribution (the same approach
remains valid for other PDFs). This later material is provided to support several of the examples, however,
as will be seen, evaluation of probability and risk are often not routinely required.
Page 4
Decision Rules and Statements of Conformity
United Kingdom Accreditation Service 2 Pine Trees, Chertsey Lane, Staines-upon-Thames, TW18 3HR Website: www.ukas.com Publications requests email: [email protected]
© United Kingdom Accreditation Service. UKAS copyright exists on all UKAS publications.
LAB 48 Edition 3 Page 4 of 37
Example 1: Test standard is a “validated” method
Certain types of test are conducted using what is termed a ‘validated’ method or procedure. These range
greatly in robustness from, for example, fully validated analytical methods (e.g. following ISO 5725) through
to ‘industry accepted’ methods (e.g. based on ad hoc accepted norms).
The degree to which uncertainty has already been incorporated into a method or standard may be clear and
explicit, for example a method uncertainty may be stated which simply needs to be combined with lab-specific
factors into a final measurement uncertainty. In these cases, deciding how to take account of measurement
uncertainty is usually clear. For example, in the field of regulated environmental testing (such as MCERTS
soil and water testing) the measurement uncertainty is usually taken into account through defined
performance characteristics for precision (repeatability and/or reproducibility) and bias (method and/or lab)
that have been established during validation to be the significant contributors to uncertainty in the methods.
Alternatively, in other situations (such as in MCERTS stack emission testing) a more rigorous evaluation of
uncertainty is required and need to make a conformity decision is avoided by simply reporting the results
(i.e. measured value and a rigorously evaluated measurement uncertainty) together with a statement of the
relevant limit value. In a more general sense this (latter) approach has the advantage that the customer
makes their decision on the acceptability of the result at their convenience, rather than committing to having
their decision recorded on the test or calibration report at the time of measurement.
In other cases, there may be no consideration of uncertainty within the standard, in which case the laboratory
must ascertain whether the customer wishes the uncertainty to be directly taken into account, as may be
possible using the approach described in Appendix C and demonstrated in certain of the later examples.
Alternatively, the customer may ask that an indirect account should be taken as in several of the next
examples.
Page 5
Decision Rules and Statements of Conformity
United Kingdom Accreditation Service 2 Pine Trees, Chertsey Lane, Staines-upon-Thames, TW18 3HR Website: www.ukas.com Publications requests email: [email protected]
© United Kingdom Accreditation Service. UKAS copyright exists on all UKAS publications.
LAB 48 Edition 3 Page 5 of 37
Example 2: Test scenario with no uncertainty in the outcome
In certain test scenarios there is no uncertainty in the outcome. Instead the outcome is influenced by the
conditions under which the test is performed, and these are subject to measurement uncertainty.
For example, suppose that the packaging for transportation of a fragile item is to be tested by packing a
certain type of glass bottle and then, under specified conditions, dropping the package before unpacking and
inspecting the bottle for damage.
The specification and decision rule might be defined as follows:
Specification for test on integrity of packaging containing a glass bottle:
The packaged bottle should remain intact when dropped under the following conditions - height ℎ in range
0.99 m to 1.05 m; temperature 𝑇 in range 18 C to 23 C
Decision Rule
Several rules can be established that take account of measurement uncertainty that has already been
evaluated by the laboratory1. For example:
“PASS” if bottle is unbroken AND measurement conditions conform to Simple Acceptance criteria for ℎ
and 𝑇 (i.e. 0.99 m ≤ ℎ ≤ 1.05 m; 18 C ≤ 𝑇 ≤ 23 C), provided also that 𝑢(ℎ) ≤ 0.5 cm, 𝑢(𝑇) ≤ 0.5 C;
“FAIL” otherwise.
Note that, as demonstrated above, a so called ‘Simple Acceptance’ decision rule is one in which the
Acceptance Interval (range of accepted measurement values) is the same as the Tolerance Interval. In
isolation, a Simple Acceptance decision rule does not meet the requirements of a Decision Rule as defined
in ISO/IEC 17025:2017 as measurement uncertainty is not taken into account either directly or indirectly.
(See Appendix E for further discussion)
The decision rule could alternatively have been expressed in terms of conformance probability for the test
conditions, e.g.
“PASS” if bottle is unbroken AND conformance probability, 𝑝𝑐 > 99 % for test conditions ℎ and 𝑇;
“FAIL” otherwise.
(See Appendix C for calculation of 𝑝𝑐)
1 “Already evaluated”, since it is an accreditation requirement to evaluate the uncertainty of all key measurements.
Page 6
Decision Rules and Statements of Conformity
United Kingdom Accreditation Service 2 Pine Trees, Chertsey Lane, Staines-upon-Thames, TW18 3HR Website: www.ukas.com Publications requests email: [email protected]
© United Kingdom Accreditation Service. UKAS copyright exists on all UKAS publications.
LAB 48 Edition 3 Page 6 of 37
Example 3: Test scenario in which a customer asks a laboratory to “ignore
uncertainty”
At some point it is likely that a customer will approach a laboratory and ask them to make a conformity
decision that “ignores uncertainty”.
Accredited reporting of the outcome for such a decision is not permitted by ISO/IEC 17025:2017 nor by ILAC-
G8:09/2019 which require that uncertainty should be taken into account (directly or indirectly) when
conformity decisions are made. (See Appendix E for further explanation of why rules that take no account of
uncertainty are not appropriate.)
The laboratory therefore needs to establish how their customer would like them to proceed.
Fortunately, in practice most customers usually do have some, albeit unrecognised or unstated expectation
concerning the ‘reliability’ of the measurement they are asking for. Would they be really be happy with
uncertainty of say 10, or a hundred, or a thousand times the specification?
Example
Suppose that a laboratory is approached to test the breaking strain of a sample of thread. The customer
declares that the thread is required to remain intact for loads up to 10 N and states that they would like the
laboratory to ‘ignore uncertainty’ since there is no uncertainty requirement mentioned in the associated
standard.
During contract review, the laboratory responds by explaining that, for the decision to be reported under their
accreditation, uncertainty cannot be ignored. The laboratory also explains that, being accredited for the test,
they have already established that the applied load can be measured with an expanded uncertainty of better
than 0.1 N (k = 2 for approximately 95% coverage probability). Also, to reduce the risk of false acceptance,
the laboratory proposes to apply a measured load of 10.1 N
The customer confirms that, in choosing an accredited provider, they had in fact already assumed that the
uncertainty would be appropriate for the test and that they are therefore content to have the measurement
performed under these conditions. The customer also confirms that they would like a binary, PASS/FAIL
decision.
Therefore, in this case the outcome might be…
Agreed and reported specification: Conforming thread remains intact under load of 10.1 N
Agreed and reported Decision Rule: “PASS” if the thread remains intact under an applied load of 10.1 N,
AND the expanded uncertainty of the measured load is no larger than 0.1 N (k = 2 for approximately 95%
coverage probability).
Reported decisions:
Thread remains intact for load L = 10.1 N: PASS
Thread is damaged by load L = 10.1 N: FAIL
The conformance probability for this result can be calculated using (Appendix C.2)
𝑝𝑐 = 1 − NORM. DIST(10, 10.1, 0.1/2, TRUE) = 0.97725
i.e. the probability of false acceptance (PFA) is (Appendix C.7)
𝑃𝐹𝐴 = 1 – 𝑝𝑐 = 2.3 %
Page 7
Decision Rules and Statements of Conformity
United Kingdom Accreditation Service 2 Pine Trees, Chertsey Lane, Staines-upon-Thames, TW18 3HR Website: www.ukas.com Publications requests email: [email protected]
© United Kingdom Accreditation Service. UKAS copyright exists on all UKAS publications.
LAB 48 Edition 3 Page 7 of 37
Example 4: Test standard does not mention measurement uncertainty
It is a common occurrence for a testing standard to make no mention of measurement uncertainty. There
are many possible reasons for this: the standard may predate the GUM (1995) and widespread use of the
‘uncertainty framework’; for some reason the authors of the standard may have chosen not to state their
requirements or assumptions about the uncertainty that would be achieved in conducting the tests with
specified equipment; or the standard may simply be deficient.
Whatever the reason, ISO/IEC 17025:2017 and ILAC-G8:09/2019 require measurement uncertainty to be
taken into account, whether directly or indirectly (not least so that the conformity decision is metrologically
traceable).
At first sight this seems to present a problem, however the situation is similar to that described in the earlier
example in which a customer asks a laboratory to “ignore uncertainty”.
Example
Suppose that a laboratory is asked to perform a calibration described in a standard ‘ABC123’ which defines
a hierarchy of equipment and specifies equipment ‘accuracy’ requirements in terms or ‘maximum permissible
error’ but does not mention measurement uncertainty. The customer states that they would like the laboratory
to ‘ignore uncertainty’ as there is no uncertainty requirement stated in the standard.
During contract review, the laboratory responds confirming that they are able to meet the ‘accuracy’
requirements and perform the relevant measurements, but for conformity statements to be reported under
their accreditation the measurement uncertainty cannot be ignored.
The laboratory further explains that in certain cases there could be an undesirable situation where a
laboratory’s test equipment meets the ‘accuracy’ (residual error) requirement within the standard but has
measurement uncertainties that are larger than the specification owing to factors such as instrument drift
and other measurement effects, which would increase the probability of false acceptance.
The laboratory explains however, that in their case the measurement uncertainties are no larger than the
accuracy requirement within the standard and provides the customer with the value of the upper limits of the
expanded uncertainty (k = 2 for 95 % coverage probability) expected for each measurement.
The customer confirms that the proposed limits on measurement uncertainties are appropriate for their
requirements. The customer also confirms that they would like a binary, PASS/FAIL decision.
Therefore, in this case…
Agreed and reported specification:
Calibration and tolerances as defined by the accuracy requirements in ABC123.
Agreed and reported Decision Rule:
“PASS” indicates that the instrument conforms with the relevant accuracy requirements of the testing
standard AND the expanded measurement uncertainty (k = 2 for approximately 95 % coverage probability)
is no greater in magnitude than the accuracy requirements defined in table X of ABC123.
Page 8
Decision Rules and Statements of Conformity
United Kingdom Accreditation Service 2 Pine Trees, Chertsey Lane, Staines-upon-Thames, TW18 3HR Website: www.ukas.com Publications requests email: [email protected]
© United Kingdom Accreditation Service. UKAS copyright exists on all UKAS publications.
LAB 48 Edition 3 Page 8 of 37
Example 5: Double sided tolerance limit, DR: pc ≥ 95 %
A customer’s acceptance criteria (specification) for a 2 MPa pressure transducer is that “calibration errors
should be no larger than 0.5 % of nominal full scale” but they have not specified a decision rule.
The laboratory therefore proposes the following rule:
DR: At each measured calibration pressure, report as “Pass” when there is at least 95 % probability that the
error meets specification. Otherwise report as “Fail”.
A set of calibration results can then be reported as follows:
Specification: Calibration errors should be no more than ±0.5 % of nominal full scale, 2 MPa
Decision Rule: At each measured calibration pressure, report as “Pass” when there is at least 95 %
probability that the error meets specification. Otherwise report as “Fail”.
Uncertainty of measurement for 𝑒 is 𝑈(𝑒) = 0.004 MPa = 0.2 % FS
The reported expanded uncertainty 𝑈(𝑒) is based on a standard uncertainty multiplied by a coverage factor k = 2, providing a coverage probability of approximately 95 %. The uncertainty evaluation has been carried out in accordance with UKAS requirements.
Results:
Indicated pressure
𝑝𝑖𝑛𝑑
/MPa
Transducer error
𝑒%FS /%
Decision Conformance probability
1.995 0.25 Pass 0.994
1.494 0.30 Pass 0.977
0.993 0.35 Fail 0.933
0.492 0.40 Fail 0.841
0.083 0.35 Fail 0.933
-0.006 0.30 Pass 0.977
Where, at each reference pressure, 𝑝𝑟𝑒𝑓, the transducer error is calculated from
𝑒%FS = 100 × (𝑝
𝑟𝑒𝑓− 𝑝
𝑖𝑛𝑑)
2 MPa
In use, corrected pressure, 𝑝 = 𝑝𝑖𝑛𝑑 + 𝑒%FS ×2
100
In this example the conformance probability has been calculated for each measurement of transducer error
with standard uncertainty 𝑢 = 0.1 % FS.
For example, conformance probability for 𝑝𝑖𝑛𝑑
= 1.995 MPa is evaluated from (Appendix C.3)
𝑝𝑐
= NORM. DIST(𝑇𝑈, 𝑒%FS , 𝑢, TRUE) − NORM. DIST(𝑇𝐿 , 𝑒%FS , 𝑢, TRUE) i.e.
𝑝𝑐
= NORM. DIST(0.5, 0.25, 0.1, TRUE) − NORM. DIST(−0.5, 0.25, 0.1, TRUE) = 0.994
(See Appendix C for details of this calculation)
Page 9
Decision Rules and Statements of Conformity
United Kingdom Accreditation Service 2 Pine Trees, Chertsey Lane, Staines-upon-Thames, TW18 3HR Website: www.ukas.com Publications requests email: [email protected]
© United Kingdom Accreditation Service. UKAS copyright exists on all UKAS publications.
LAB 48 Edition 3 Page 9 of 37
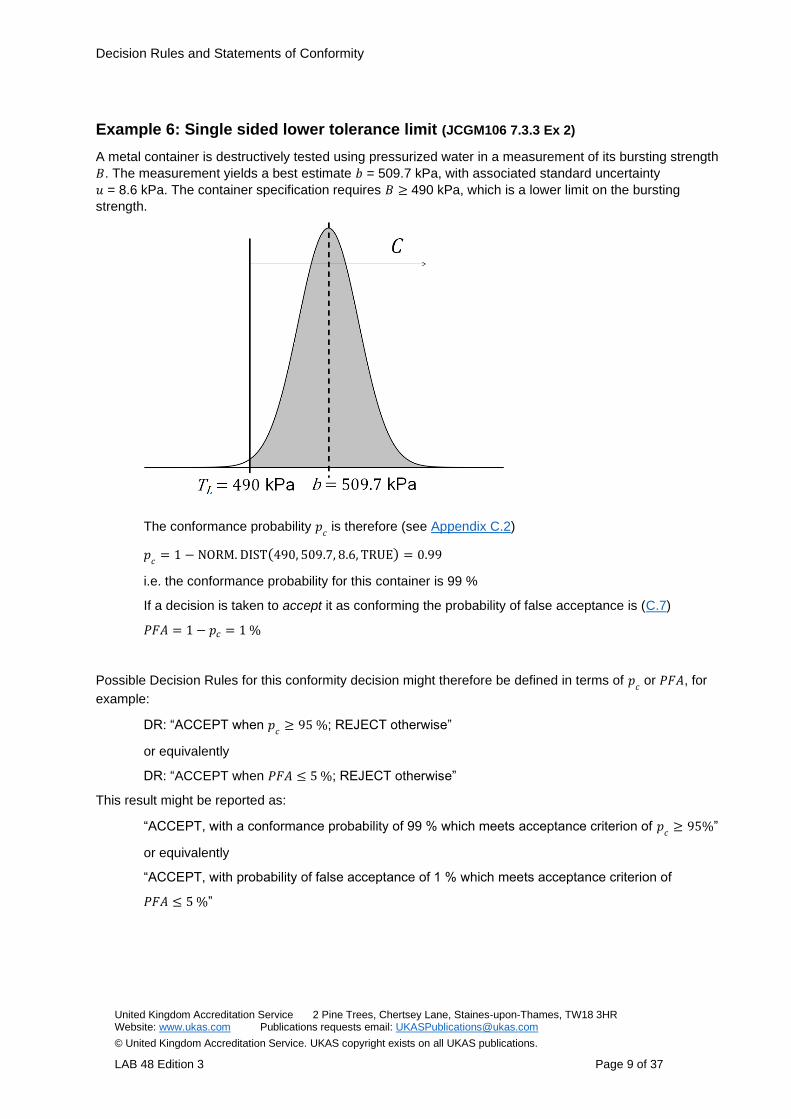
Example 6: Single sided lower tolerance limit (JCGM106 7.3.3 Ex 2)
A metal container is destructively tested using pressurized water in a measurement of its bursting strength
𝐵. The measurement yields a best estimate 𝑏 = 509.7 kPa, with associated standard uncertainty
𝑢 = 8.6 kPa. The container specification requires 𝐵 ≥ 490 kPa, which is a lower limit on the bursting
strength.
The conformance probability 𝑝𝑐 is therefore (see Appendix C.2)
𝑝𝑐
= 1 − NORM. DIST(490, 509.7, 8.6, TRUE) = 0.99
i.e. the conformance probability for this container is 99 %
If a decision is taken to accept it as conforming the probability of false acceptance is (C.7)
𝑃𝐹𝐴 = 1 − 𝑝𝑐 = 1 %
Possible Decision Rules for this conformity decision might therefore be defined in terms of 𝑝𝑐 or 𝑃𝐹𝐴, for
example:
DR: “ACCEPT when 𝑝𝑐
≥ 95 %; REJECT otherwise”
or equivalently
DR: “ACCEPT when 𝑃𝐹𝐴 ≤ 5 %; REJECT otherwise”
This result might be reported as:
“ACCEPT, with a conformance probability of 99 % which meets acceptance criterion of 𝑝𝑐
≥ 95%”
or equivalently
“ACCEPT, with probability of false acceptance of 1 % which meets acceptance criterion of
𝑃𝐹𝐴 ≤ 5 %”
Page 10
Decision Rules and Statements of Conformity
United Kingdom Accreditation Service 2 Pine Trees, Chertsey Lane, Staines-upon-Thames, TW18 3HR Website: www.ukas.com Publications requests email: [email protected]
© United Kingdom Accreditation Service. UKAS copyright exists on all UKAS publications.
LAB 48 Edition 3 Page 10 of 37
Supposing instead that 𝑏 = 495.2 kPa.
In this case
𝑝𝑐
= 1 − NORM. DIST(490, 495.2, 8.6, TRUE) = 0.73
This result might therefore be reported as:
“REJECT, with a conformance probability of only 73 % which does not meet acceptance criterion
of 𝑝𝑐
≥ 95%”
or
“REJECT, unable to meet 𝑃𝐹𝐴 requirements”
Page 11
Decision Rules and Statements of Conformity
United Kingdom Accreditation Service 2 Pine Trees, Chertsey Lane, Staines-upon-Thames, TW18 3HR Website: www.ukas.com Publications requests email: [email protected]
© United Kingdom Accreditation Service. UKAS copyright exists on all UKAS publications.
LAB 48 Edition 3 Page 11 of 37
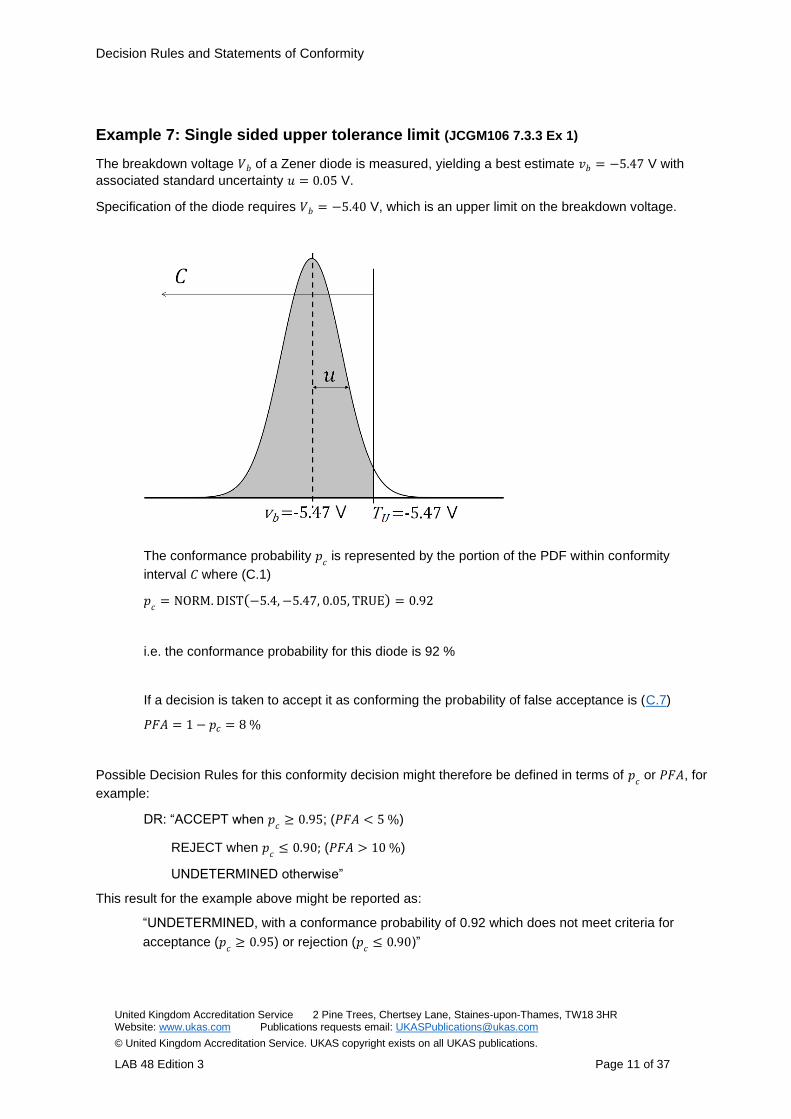
Example 7: Single sided upper tolerance limit (JCGM106 7.3.3 Ex 1)
The breakdown voltage 𝑉𝑏 of a Zener diode is measured, yielding a best estimate 𝑣𝑏 = −5.47 V with
associated standard uncertainty 𝑢 = 0.05 V.
Specification of the diode requires 𝑉𝑏 = −5.40 V, which is an upper limit on the breakdown voltage.
The conformance probability 𝑝𝑐 is represented by the portion of the PDF within conformity
interval 𝐶 where (C.1)
𝑝𝑐
= NORM. DIST(−5.4, −5.47, 0.05, TRUE) = 0.92
i.e. the conformance probability for this diode is 92 %
If a decision is taken to accept it as conforming the probability of false acceptance is (C.7)
𝑃𝐹𝐴 = 1 − 𝑝𝑐 = 8 %
Possible Decision Rules for this conformity decision might therefore be defined in terms of 𝑝𝑐 or 𝑃𝐹𝐴, for
example:
DR: “ACCEPT when 𝑝𝑐
≥ 0.95; (𝑃𝐹𝐴 < 5 %)
REJECT when 𝑝𝑐
≤ 0.90; (𝑃𝐹𝐴 > 10 %)
UNDETERMINED otherwise”
This result for the example above might be reported as:
“UNDETERMINED, with a conformance probability of 0.92 which does not meet criteria for
acceptance (𝑝𝑐
≥ 0.95) or rejection (𝑝𝑐
≤ 0.90)”
Page 12
Decision Rules and Statements of Conformity
United Kingdom Accreditation Service 2 Pine Trees, Chertsey Lane, Staines-upon-Thames, TW18 3HR Website: www.ukas.com Publications requests email: [email protected]
© United Kingdom Accreditation Service. UKAS copyright exists on all UKAS publications.
LAB 48 Edition 3 Page 12 of 37
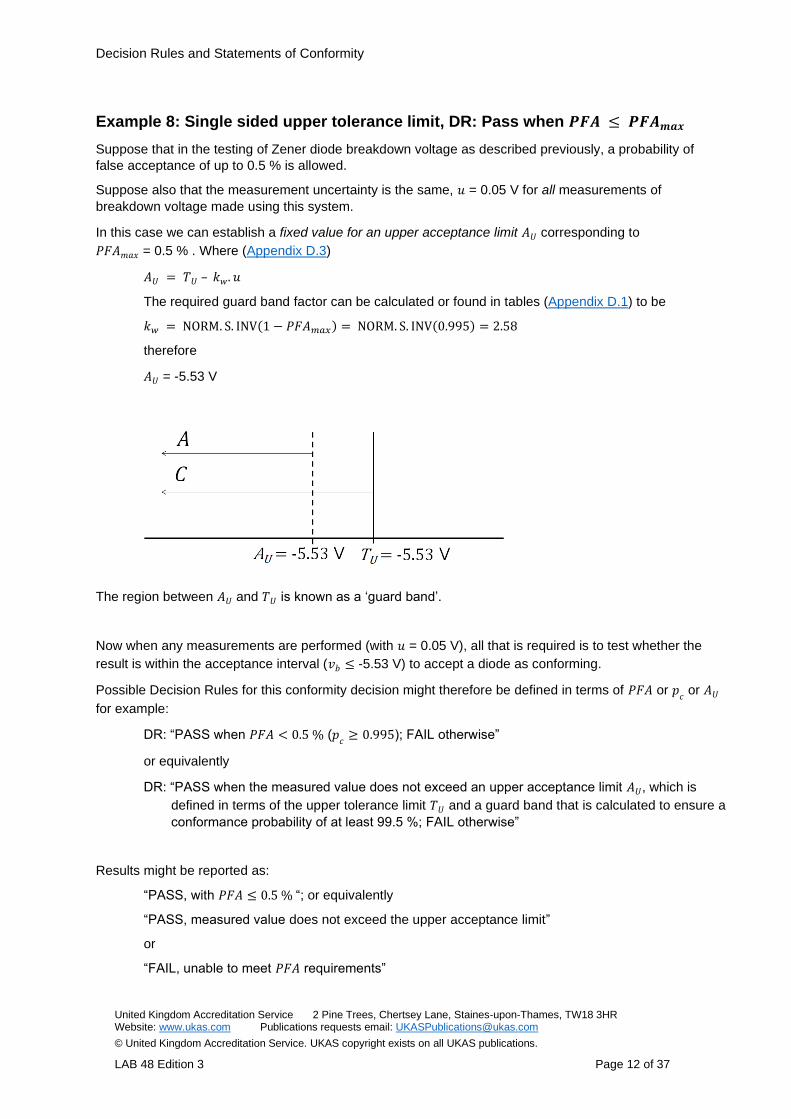
Example 8: Single sided upper tolerance limit, DR: Pass when 𝑷𝑭𝑨 ≤ 𝑷𝑭𝑨𝒎𝒂𝒙
Suppose that in the testing of Zener diode breakdown voltage as described previously, a probability of
false acceptance of up to 0.5 % is allowed.
Suppose also that the measurement uncertainty is the same, 𝑢 = 0.05 V for all measurements of
breakdown voltage made using this system.
In this case we can establish a fixed value for an upper acceptance limit 𝐴𝑈 corresponding to
𝑃𝐹𝐴𝑚𝑎𝑥 = 0.5 % . Where (Appendix D.3)
𝐴𝑈 = 𝑇𝑈 – 𝑘𝑤. 𝑢
The required guard band factor can be calculated or found in tables (Appendix D.1) to be
𝑘𝑤 = NORM. S. INV(1 − 𝑃𝐹𝐴𝑚𝑎𝑥) = NORM. S. INV(0.995) = 2.58
therefore
𝐴𝑈 = -5.53 V
The region between 𝐴𝑈 and 𝑇𝑈 is known as a ‘guard band’.
Now when any measurements are performed (with 𝑢 = 0.05 V), all that is required is to test whether the
result is within the acceptance interval (𝑣𝑏 ≤ -5.53 V) to accept a diode as conforming.
Possible Decision Rules for this conformity decision might therefore be defined in terms of 𝑃𝐹𝐴 or 𝑝𝑐 or 𝐴𝑈
for example:
DR: “PASS when 𝑃𝐹𝐴 < 0.5 % (𝑝𝑐
≥ 0.995); FAIL otherwise”
or equivalently
DR: “PASS when the measured value does not exceed an upper acceptance limit 𝐴𝑈, which is
defined in terms of the upper tolerance limit 𝑇𝑈 and a guard band that is calculated to ensure a
conformance probability of at least 99.5 %; FAIL otherwise”
Results might be reported as:
“PASS, with 𝑃𝐹𝐴 ≤ 0.5 % “; or equivalently
“PASS, measured value does not exceed the upper acceptance limit”
or
“FAIL, unable to meet 𝑃𝐹𝐴 requirements”
Page 13
Decision Rules and Statements of Conformity
United Kingdom Accreditation Service 2 Pine Trees, Chertsey Lane, Staines-upon-Thames, TW18 3HR Website: www.ukas.com Publications requests email: [email protected]
© United Kingdom Accreditation Service. UKAS copyright exists on all UKAS publications.
LAB 48 Edition 3 Page 13 of 37
Example 9: Single sided upper tolerance limit, DR: Accept when 𝑷𝑭𝑨 ≤ 𝑷𝑭𝑨𝒎𝒂𝒙
A machine is designed to shred pruned tree branches up to a diameter of 50 mm. Larger diameter
branches will go through the machine, but the owner of the machine does not wish this to happen more
frequently than 10 % of the time. He therefore uses a simple calliper to measure the diameter with a
standard uncertainty of 𝑢 = 5 mm.
What limit should he place on measured diameter? Or in other words, what size Guard Band should be
applied?
The owner wishes to only falsely accept (i.e. attempt to shred an oversized branch) 10 % of the time, i.e.
𝑃𝐹𝐴𝑚𝑎𝑥 = 0.1
Upper tolerance limit is 𝑇𝑈 = 50 mm
So (Appendix D.3)
𝐴𝑈 = 𝑇𝑈 − 𝑘𝑤. 𝑢
where 𝑘 is found by using the Table in Appendix D, or by calculation (D.1)
𝑘𝑤 = NORM. S. INV(1 − 0.1) = NORM. S. INV(0.9) = 1.28
Hence
𝐴𝑈 = 50 – 1.28 x 5 = 43.5 mm
The owner should only accept branches measured to have a diameter of 43.5 mm or less.
Possible Decision Rules for this conformity decision might therefore be defined in terms of 𝑃𝐹𝐴, for
example:
DR: “ACCEPT when measured diameter < 43.5 mm, for 𝑃𝐹𝐴 < 10 % ; REJECT otherwise”
Page 14
Decision Rules and Statements of Conformity
United Kingdom Accreditation Service 2 Pine Trees, Chertsey Lane, Staines-upon-Thames, TW18 3HR Website: www.ukas.com Publications requests email: [email protected]
© United Kingdom Accreditation Service. UKAS copyright exists on all UKAS publications.
LAB 48 Edition 3 Page 14 of 37
Example 10: Single sided lower tolerance limit, DR: Accept when 𝑷𝑭𝑨 ≤ 𝑷𝑭𝑨𝒎𝒂𝒙
In some situations, we may be more interested in not rejecting potentially conforming items i.e. we are
prepared to Accept, even when the chance of falsely accepting is high. (This is a so-called relaxed
acceptance scenario, in which the range of acceptable measurement results is wider that the tolerance
range for the measurand).
For example, a gold miner performs initial grading by measuring the apparent density of each ore sample.
Gold ore has a typical density of 19320 kg m-3.
Because of the potential value of the ore he is happy to bear the cost associated with a high probability of
false acceptance at this stage of his process, up to a maximum of 99.5 %.
Possible Decision Rules for this conformity decision might therefore be defined in terms of 𝑃𝐹𝐴 or 𝑝𝑐, for
example:
DR: “Accept when 𝑃𝐹𝐴 99.5 %; Reject otherwise”
or equivalently
DR: “Accept when 𝑝𝑐 0.5 %; Reject otherwise”
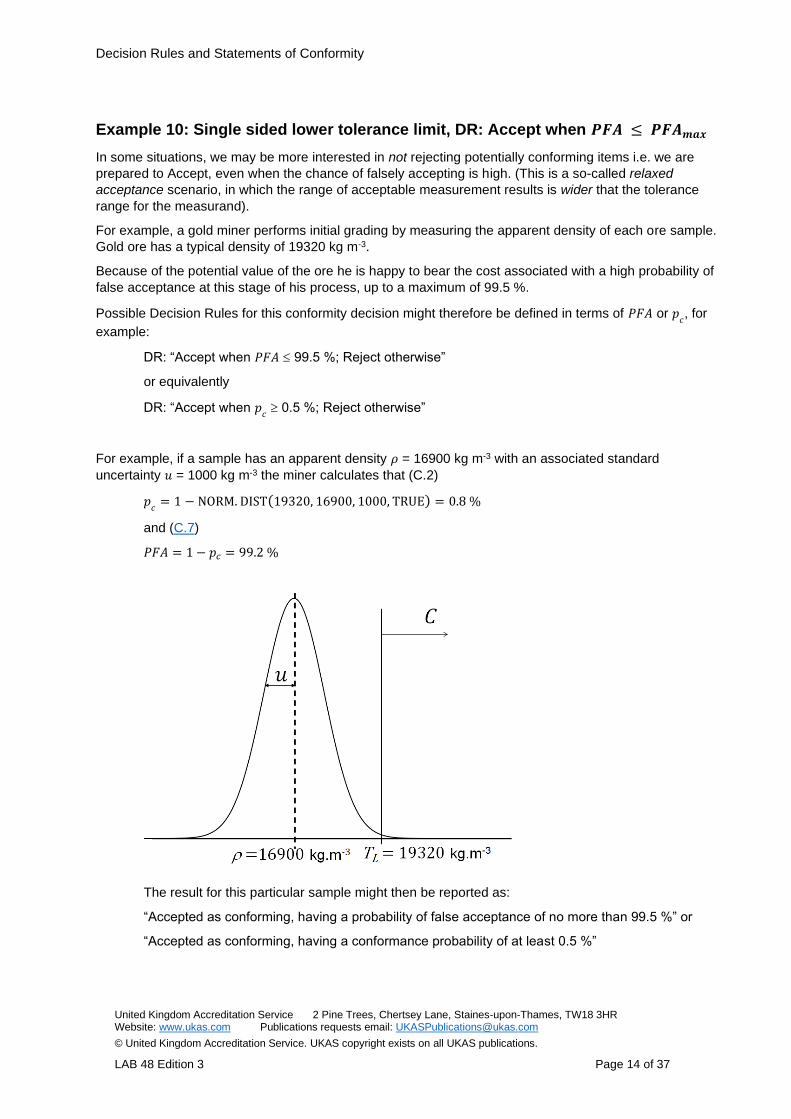
For example, if a sample has an apparent density 𝜌 = 16900 kg m-3 with an associated standard
uncertainty 𝑢 = 1000 kg m-3 the miner calculates that (C.2)
𝑝𝑐
= 1 − NORM. DIST(19320, 16900, 1000, TRUE) = 0.8 %
and (C.7)
𝑃𝐹𝐴 = 1 − 𝑝𝑐 = 99.2 %
The result for this particular sample might then be reported as:
“Accepted as conforming, having a probability of false acceptance of no more than 99.5 %” or
“Accepted as conforming, having a conformance probability of at least 0.5 %”
Page 15
Decision Rules and Statements of Conformity
United Kingdom Accreditation Service 2 Pine Trees, Chertsey Lane, Staines-upon-Thames, TW18 3HR Website: www.ukas.com Publications requests email: [email protected]
© United Kingdom Accreditation Service. UKAS copyright exists on all UKAS publications.
LAB 48 Edition 3 Page 15 of 37
If a second sample has an apparent density 𝜌 = 16500 kg m-3 also with an associated uncertainty of
𝑢 = 1000 kg m-3 the miner calculates that
𝑝𝑐
= 1 − NORM. DIST(19320, 16500, 1000, TRUE) = 0.2 %
𝑃𝐹𝐴 = 1 − 𝑝𝑐 = 99.8 %
This result might then be reported as:
“Rejected as non-conforming, unable to meet 𝑃𝐹𝐴 requirements”
or
“Rejected as non-conforming, having a conformance probability of less than 0.5 %”
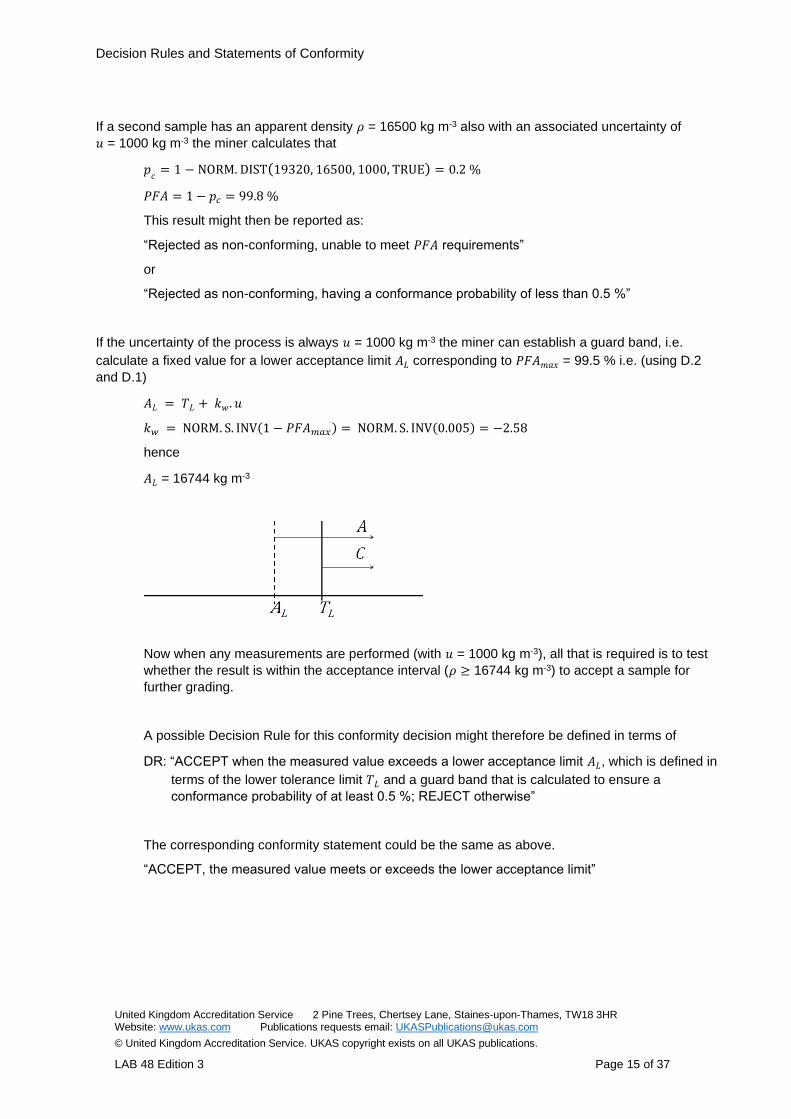
If the uncertainty of the process is always 𝑢 = 1000 kg m-3 the miner can establish a guard band, i.e.
calculate a fixed value for a lower acceptance limit 𝐴𝐿 corresponding to 𝑃𝐹𝐴𝑚𝑎𝑥 = 99.5 % i.e. (using D.2
and D.1)
𝐴𝐿 = 𝑇𝐿 + 𝑘𝑤. 𝑢
𝑘𝑤 = NORM. S. INV(1 − 𝑃𝐹𝐴𝑚𝑎𝑥) = NORM. S. INV(0.005) = −2.58
hence
𝐴𝐿 = 16744 kg m-3
Now when any measurements are performed (with 𝑢 = 1000 kg m-3), all that is required is to test
whether the result is within the acceptance interval (𝜌 ≥ 16744 kg m-3) to accept a sample for
further grading.
A possible Decision Rule for this conformity decision might therefore be defined in terms of
DR: “ACCEPT when the measured value exceeds a lower acceptance limit 𝐴𝐿, which is defined in
terms of the lower tolerance limit 𝑇𝐿 and a guard band that is calculated to ensure a
conformance probability of at least 0.5 %; REJECT otherwise”
The corresponding conformity statement could be the same as above.
“ACCEPT, the measured value meets or exceeds the lower acceptance limit”
Page 16
Decision Rules and Statements of Conformity
United Kingdom Accreditation Service 2 Pine Trees, Chertsey Lane, Staines-upon-Thames, TW18 3HR Website: www.ukas.com Publications requests email: [email protected]
© United Kingdom Accreditation Service. UKAS copyright exists on all UKAS publications.
LAB 48 Edition 3 Page 16 of 37
Example 11: Single sided upper tolerance limit, DR: Accept when 𝑷𝑭𝑨 ≤ 𝑷𝑭𝑨𝒎𝒂𝒙
(JCGM106 8.3.3.2 Ex 1)
In highway law enforcement, the speed of motorists is measured by police using devices such as radars
and laser guns. A decision to issue a speeding ticket, which may potentially lead to an appearance in court,
must be made with a high degree of confidence that the speed limit has actually been exceeded.
Using a Doppler radar, speed measurements in the field can be performed with a relative standard
uncertainty 𝑢(𝑣)/𝑣 of 2 % in the interval 50 km/h to 150 km/h. Knowledge of a measured speed 𝑣 in this
interval is assumed to be characterised by a normal PDF with expectation 𝑣 and standard deviation 0.02 𝑣.
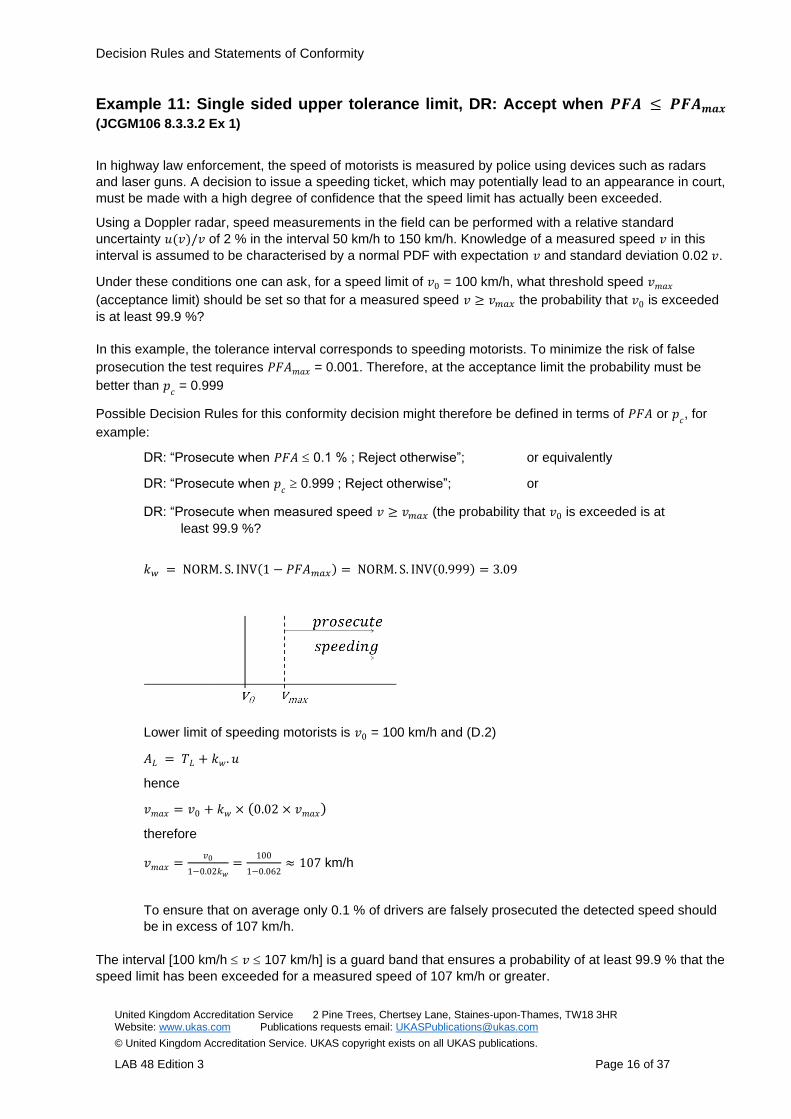
Under these conditions one can ask, for a speed limit of 𝑣0 = 100 km/h, what threshold speed 𝑣𝑚𝑎𝑥
(acceptance limit) should be set so that for a measured speed 𝑣 ≥ 𝑣𝑚𝑎𝑥 the probability that 𝑣0 is exceeded
is at least 99.9 %?
In this example, the tolerance interval corresponds to speeding motorists. To minimize the risk of false
prosecution the test requires 𝑃𝐹𝐴𝑚𝑎𝑥 = 0.001. Therefore, at the acceptance limit the probability must be
better than 𝑝𝑐 = 0.999
Possible Decision Rules for this conformity decision might therefore be defined in terms of 𝑃𝐹𝐴 or 𝑝𝑐, for
example:
DR: “Prosecute when 𝑃𝐹𝐴 0.1 % ; Reject otherwise”; or equivalently
DR: “Prosecute when 𝑝𝑐 0.999 ; Reject otherwise”; or
DR: “Prosecute when measured speed 𝑣 ≥ 𝑣𝑚𝑎𝑥 (the probability that 𝑣0 is exceeded is at
least 99.9 %?
𝑘𝑤 = NORM. S. INV(1 − 𝑃𝐹𝐴𝑚𝑎𝑥) = NORM. S. INV(0.999) = 3.09
Lower limit of speeding motorists is 𝑣0 = 100 km/h and (D.2)
𝐴𝐿 = 𝑇𝐿 + 𝑘𝑤. 𝑢
hence
𝑣𝑚𝑎𝑥 = 𝑣0 + 𝑘𝑤 × (0.02 × 𝑣𝑚𝑎𝑥)
therefore
𝑣𝑚𝑎𝑥 =𝑣0
1−0.02𝑘𝑤=
100
1−0.062≈ 107 km/h
To ensure that on average only 0.1 % of drivers are falsely prosecuted the detected speed should
be in excess of 107 km/h.
The interval [100 km/h 𝑣 107 km/h] is a guard band that ensures a probability of at least 99.9 % that the
speed limit has been exceeded for a measured speed of 107 km/h or greater.
Page 17
Decision Rules and Statements of Conformity
United Kingdom Accreditation Service 2 Pine Trees, Chertsey Lane, Staines-upon-Thames, TW18 3HR Website: www.ukas.com Publications requests email: [email protected]
© United Kingdom Accreditation Service. UKAS copyright exists on all UKAS publications.
LAB 48 Edition 3 Page 17 of 37
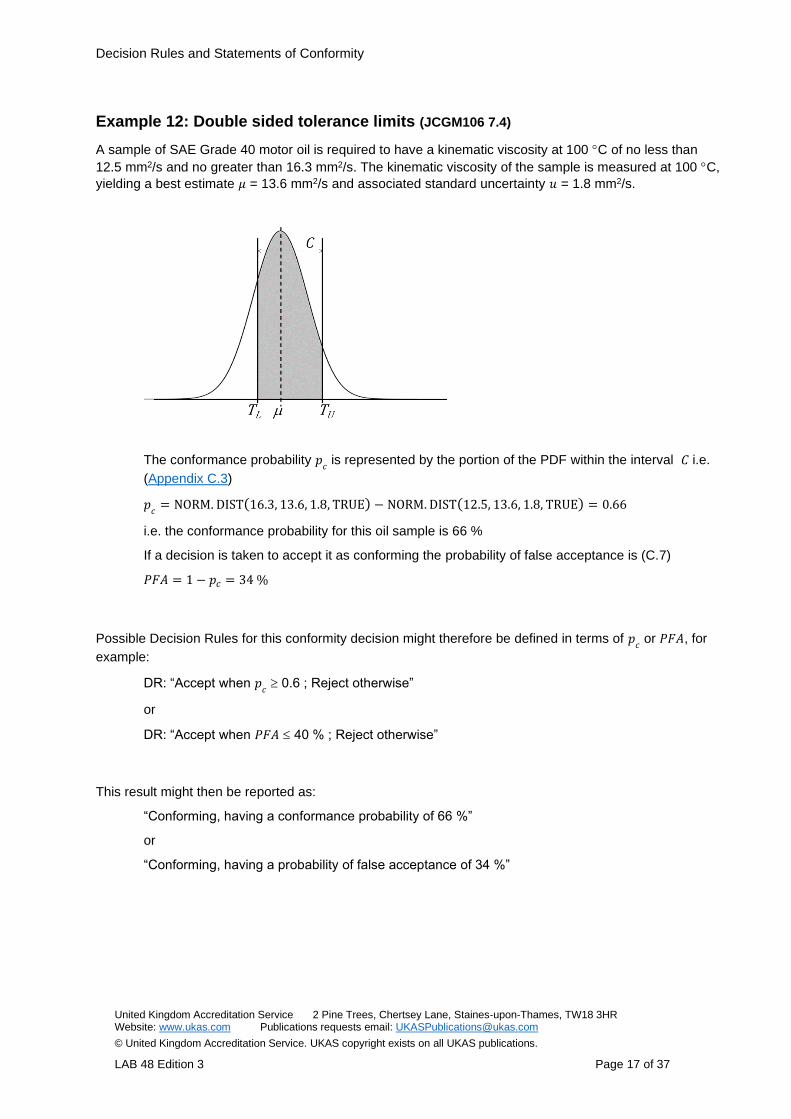
Example 12: Double sided tolerance limits (JCGM106 7.4)
A sample of SAE Grade 40 motor oil is required to have a kinematic viscosity at 100 C of no less than
12.5 mm2/s and no greater than 16.3 mm2/s. The kinematic viscosity of the sample is measured at 100 C,
yielding a best estimate 𝜇 = 13.6 mm2/s and associated standard uncertainty 𝑢 = 1.8 mm2/s.
The conformance probability 𝑝𝑐 is represented by the portion of the PDF within the interval 𝐶 i.e.
(Appendix C.3)
𝑝𝑐
= NORM. DIST(16.3, 13.6, 1.8, TRUE) − NORM. DIST(12.5, 13.6, 1.8, TRUE) = 0.66
i.e. the conformance probability for this oil sample is 66 %
If a decision is taken to accept it as conforming the probability of false acceptance is (C.7)
𝑃𝐹𝐴 = 1 − 𝑝𝑐 = 34 %
Possible Decision Rules for this conformity decision might therefore be defined in terms of 𝑝𝑐 or 𝑃𝐹𝐴, for
example:
DR: “Accept when 𝑝𝑐 0.6 ; Reject otherwise”
or
DR: “Accept when 𝑃𝐹𝐴 40 % ; Reject otherwise”
This result might then be reported as:
“Conforming, having a conformance probability of 66 %”
or
“Conforming, having a probability of false acceptance of 34 %”
Page 18
Decision Rules and Statements of Conformity
United Kingdom Accreditation Service 2 Pine Trees, Chertsey Lane, Staines-upon-Thames, TW18 3HR Website: www.ukas.com Publications requests email: [email protected]
© United Kingdom Accreditation Service. UKAS copyright exists on all UKAS publications.
LAB 48 Edition 3 Page 18 of 37
However, if the associated standard uncertainty was 𝑢 = 2.2 mm2/s this would instead result in a
conformance probability of
𝑝𝑐
= NORM. DIST(16.3, 13.6, 2.2, TRUE) − NORM. DIST(12.5, 13.6, 2.2, TRUE) = 0.58
i.e. the conformance probability for this (same) oil sample is 58 %
If a decision is taken to accept it as conforming the probability of false acceptance is
𝑃𝐹𝐴 = 1 − 𝑝𝑐 = 42 %
Applying the same Decision Rule, this result might then be reported as:
“Not conforming, having a conformance probability of only 58 %”
or
“Not conforming, unable to meet 𝑃𝐹𝐴 requirements ”
Suppose that instead of suggesting a Gaussian distribution for likely values of the measurand, the
uncertainty evaluation indicates that a 𝑡-distribution is more appropriate, having say 𝜈 = 3 degrees of
freedom. For the original example above, the conformance probability is now found (Appendix C.6) to be
𝑝𝑐 = T. DIST ((16.3−13.6
1.8) , 3, TRUE) − T. DIST ((
12.5−13.6
1.8) , 3, TRUE) = 0.593
(which in this case, according to the possible Decision Rule proposed, would change the conformity
decision from Accept to Reject).
Page 19
Decision Rules and Statements of Conformity
United Kingdom Accreditation Service 2 Pine Trees, Chertsey Lane, Staines-upon-Thames, TW18 3HR Website: www.ukas.com Publications requests email: [email protected]
© United Kingdom Accreditation Service. UKAS copyright exists on all UKAS publications.
LAB 48 Edition 3 Page 19 of 37
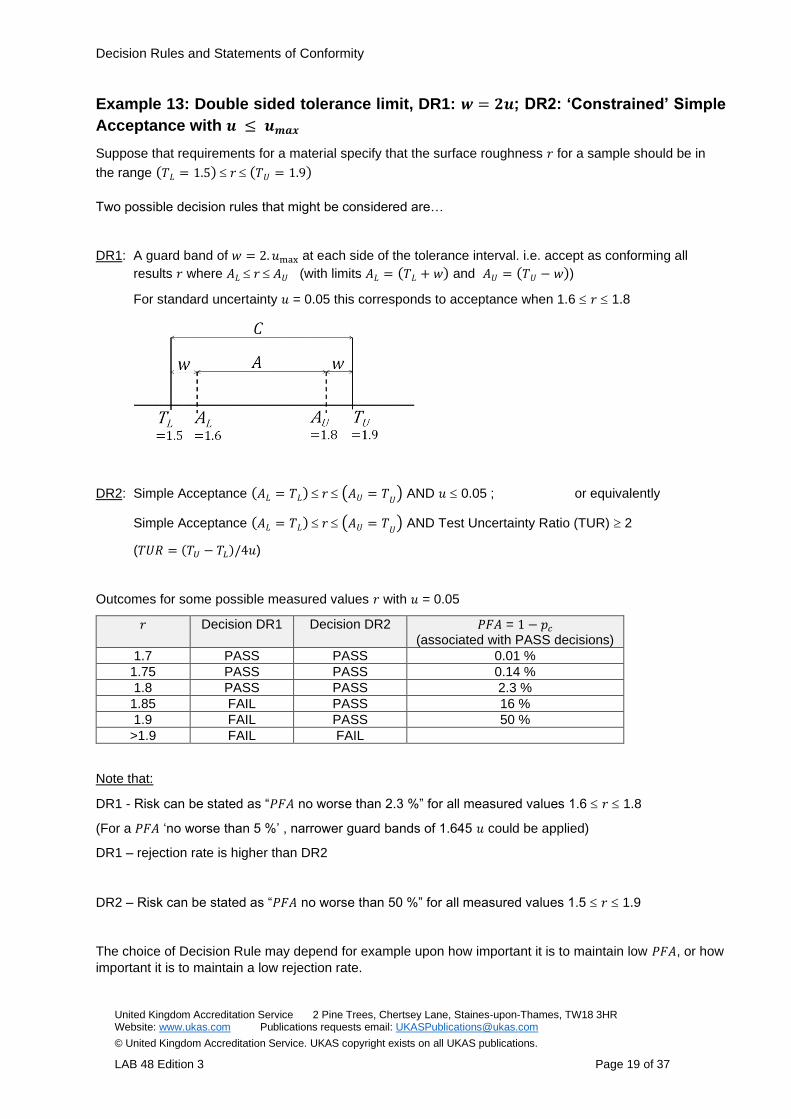
Example 13: Double sided tolerance limit, DR1: 𝒘 = 𝟐𝒖; DR2: ‘Constrained’ Simple
Acceptance with 𝒖 ≤ 𝒖𝒎𝒂𝒙
Suppose that requirements for a material specify that the surface roughness 𝑟 for a sample should be in
the range (𝑇𝐿 = 1.5) 𝑟 (𝑇𝑈 = 1.9)
Two possible decision rules that might be considered are…
DR1: A guard band of 𝑤 = 2. 𝑢max at each side of the tolerance interval. i.e. accept as conforming all
results 𝑟 where 𝐴𝐿 𝑟 𝐴𝑈 (with limits 𝐴𝐿 = (𝑇𝐿 + 𝑤) and 𝐴𝑈 = (𝑇𝑈 − 𝑤))
For standard uncertainty 𝑢 = 0.05 this corresponds to acceptance when 1.6 𝑟 1.8
DR2: Simple Acceptance (𝐴𝐿 = 𝑇𝐿) 𝑟 (𝐴𝑈 = 𝑇𝑈
) AND 𝑢 0.05 ; or equivalently
Simple Acceptance (𝐴𝐿 = 𝑇𝐿) 𝑟 (𝐴𝑈 = 𝑇𝑈
) AND Test Uncertainty Ratio (TUR) 2
(𝑇𝑈𝑅 = (𝑇𝑈 − 𝑇𝐿)/4𝑢)
Outcomes for some possible measured values 𝑟 with 𝑢 = 0.05
𝑟 Decision DR1 Decision DR2 𝑃𝐹𝐴 = 1 − 𝑝𝑐 (associated with PASS decisions)
1.7 PASS PASS 0.01 %
1.75 PASS PASS 0.14 %
1.8 PASS PASS 2.3 %
1.85 FAIL PASS 16 %
1.9 FAIL PASS 50 %
>1.9 FAIL FAIL
Note that:
DR1 - Risk can be stated as “𝑃𝐹𝐴 no worse than 2.3 %” for all measured values 1.6 𝑟 1.8
(For a 𝑃𝐹𝐴 ‘no worse than 5 %’ , narrower guard bands of 1.645 𝑢 could be applied)
DR1 – rejection rate is higher than DR2
DR2 – Risk can be stated as “𝑃𝐹𝐴 no worse than 50 %” for all measured values 1.5 𝑟 1.9
The choice of Decision Rule may depend for example upon how important it is to maintain low 𝑃𝐹𝐴, or how
important it is to maintain a low rejection rate.
Page 20
Decision Rules and Statements of Conformity
United Kingdom Accreditation Service 2 Pine Trees, Chertsey Lane, Staines-upon-Thames, TW18 3HR Website: www.ukas.com Publications requests email: [email protected]
© United Kingdom Accreditation Service. UKAS copyright exists on all UKAS publications.
LAB 48 Edition 3 Page 20 of 37
Example 14: Inspection of levels (conformity decisions for discrete measurements)
In its simplest form, the basic GUM law of propagation of uncertainties (LPU) approach to uncertainty
evaluation is based upon two assumptions: the Central Limit Theorem applies i.e. the ‘output’ probability
density function is taken to be Gaussian for the combination of ‘input’ quantities; and the variance in the
output (the square of the standard uncertainty) is the sum of variances for the input quantities.
When these two assumptions apply, calculating the probability of conformity with a specification is usually a
matter of establishing the proportion of the ‘output’ Gaussian distribution that overlaps the specification.
It is often incorrectly assumed that GUM LPU always applies or that it is ‘close enough’ that it can always be
used. In fact, this is not the case and various methods are available to establish a ‘better’ understanding or
representation of the uncertainty (e.g. Welch-Satterthwaite approach for dominant type A contributions with
low degrees of freedom).
The GUM allows for other situations to apply and allows other means of evaluation within the general GUM
framework. Such an approach is necessary in the case highlighted below. The approach makes use of the
probabilistic nature of uncertainty evaluation and allows for the discrete nature of the measurements.
Example measurement and conformity scenario
Suppose that a measurement can have only discrete values on a progressive scale of distinct levels. For
example, visual evaluation of colour fading when compared against a reference scale.
Specification for conformity is stated in terms of acceptable levels.
Example a:
The uncertainty is entirely determined by the ability to resolve adjacent levels and is such that when
measurement result is level ‘𝑚’ there is an equal probability of the ‘true’ level being (𝑚 − 1), 𝑚, or (𝑚 + 1)
Specification: A conforming result will be at or between levels 𝑎 and 𝑏
Decision Rule: A Simple Acceptance rule is to be applied. In addition, measurement uncertainty must be
“entirely determined by the ability to resolve adjacent levels i.e. if measurement result is level ‘𝑚’ then
there is an equal probability of the ‘true’ level being (𝑚 − 1), 𝑚, or (𝑚 + 1)”
Numerical example:
Suppose a scale is defined as (0, 0.5, 1.0, 1.5, 2.0, 2.5, 3.0, 3.5, 4.0…)
Suppose also that the specification is that result must be 2.0 ± 0.5, i.e. conforming values are 1.5, 2.0, or
2.5
Now suppose that measurement result is 1.5
As this result is within specification the result ‘conforms’ (Simple Acceptance criteria).
If the Decision Rule is provided to the laboratory there is no (ISO 17025:2017) requirement upon them to
evaluate the associated risk. The result can simply be reported as ‘conforming’ in terms of the associated
specification and Decision Rule.
If, however the Rule is defined by the laboratory then the Risk is established as follows… for the observed
result (1.5) there are three possible ‘true’ values that are equally probable according to our knowledge of
the uncertainty. These are (1.0, 1.5, 2.0). Of these possible values two are conforming (1.5 and 2.0) and
one is not (1.0). The probability of conformity is therefore 2/3 i.e. 66.7 %, and the probability of false
acceptance is 1/3 i.e. 33.3 %.
Page 21
Decision Rules and Statements of Conformity
United Kingdom Accreditation Service 2 Pine Trees, Chertsey Lane, Staines-upon-Thames, TW18 3HR Website: www.ukas.com Publications requests email: [email protected]
© United Kingdom Accreditation Service. UKAS copyright exists on all UKAS publications.
LAB 48 Edition 3 Page 21 of 37
Suppose instead that the result was 2.0. In this case, the three possible ‘true’ values that are equally
probable according to our knowledge of the uncertainty are (1.5, 2.0, 2.5). Of these possible values all
three are conforming so the probability of conformity is therefore 100 %.
This probability of conformity of course depends upon the fact that the uncertainty is “entirely determined
by the ability to resolve adjacent levels”. If there is any doubt that the uncertainty could be larger the ‘100
%’ claim cannot be made (although it may in practice be ‘approximately 100 %’).
For completeness, if the result was 2.5 the three possible ‘true’ values that are equally probable according
to our knowledge of the uncertainty are (2.0, 2.5, 3.0). Of these possible values two are conforming. The
probability of conformity is therefore 2/3 i.e. 66.7 %, and the probability of false acceptance is 1/3 i.e.
33.3 %.
On average, for all conforming results this example has probability of conformity, 𝑝𝑐 of 78 % i.e. a 𝑃𝐹𝐴 of
22 %.
Other possible scenarios might exist.
Example b:
As for Example (a) except that uncertainty is such that the observed level 𝑚 is twice as likely as an
adjacent level: 𝑝(𝑚 − 1) = 0.25, 𝑝(𝑚) = 0.5, 𝑝(𝑚 + 1) = 0.25
The numerical example then gives for conforming results:
Result 𝑝𝑐 𝑃𝐹𝐴
1.5 75 % 25 %
2.0 100 % 0 %
2.5 75 % 25 %
On average, for all conforming results this example has probability of conformity, 𝑝𝑐 of 83 % i.e. a 𝑃𝐹𝐴 of
17 %
Example c:
As for Example (a) except that the specification now only permits two acceptable levels (1.5, 2.0)
The numerical example then gives for conforming results:
Result 𝑝𝑐 𝑃𝐹𝐴
1.5 67 % 33 %
2.0 67 % 33 %
On average, for all conforming results this example has probability of conformity, 𝑝𝑐 of 67 % i.e. a 𝑃𝐹𝐴 of
33 %
Example d:
As for Example (b) except that the specification now only permits two acceptable levels (1.5, 2.0)
Numerical example then gives for conforming results:
Result 𝑝𝑐 𝑃𝐹𝐴
1.5 75 % 25 %
2.0 75 % 25 %
On average, for all conforming results this example has probability of conformity, 𝑝𝑐 of 75 % i.e. a 𝑃𝐹𝐴 of
25 %
Page 22
Decision Rules and Statements of Conformity
United Kingdom Accreditation Service 2 Pine Trees, Chertsey Lane, Staines-upon-Thames, TW18 3HR Website: www.ukas.com Publications requests email: [email protected]
© United Kingdom Accreditation Service. UKAS copyright exists on all UKAS publications.
LAB 48 Edition 3 Page 22 of 37
Appendix A: Glossary
Terminology used in this document is consistent with ISO/IEC Guide 98-4:2012 (JCGM 106).
𝑇𝑈 upper limit of conformity
𝑇𝐿 lower limit of conformity
𝐶 conformance interval, corresponding to conforming values for a measurand, usually described in
terms of a ‘tolerance’ or ‘specification’
𝐴𝑈 upper limit of acceptance
𝐴𝐿 lower limit of acceptance
𝐴 acceptance interval, corresponding to measured values that are accepted as demonstrating
conformity for the measurand.
𝑌 variable used to represent a measurand
𝜂 variable describing possible values of a measurand 𝑌
𝑦𝑚
measured estimate of the value of the measurand
𝑢, 𝑢𝑚 standard uncertainty associated with the measured quantity
𝑃𝐹𝐴 probability of false acceptance, sometimes known as ‘consumers risk’
𝑃𝐹𝑅 probability of false rejection, sometimes known as ‘producers’ risk’
𝑝𝑐 conformance probability
𝑘𝑤 guard band factor, used to define a guard band 𝑤 as a multiple of measurement uncertainty
𝑤 = 𝑘𝑤 . 𝑢
CAUTION: The symbol 𝑘 is commonly used to represent the guard band factor (hence its use here). It
should not be confused with the coverage factor that is used to establish an expanded uncertainty e.g. to
define a coverage interval for a measurement result.
Decision Rule: documented rule that describes how measurement uncertainty will be accounted for
with regard to accepting or rejecting an item, given a specified requirement and the result of a measurement
Simple Acceptance: condition under which an Acceptance Interval is defined to be the same as a
Conformity Interval, 𝐴 = 𝐶. Simple Acceptance on its own does not constitute a Decision Rule (as explained in Appendix E)
Guard band: interval between conformity limit and acceptance limit, usually defined as some
multiple of the uncertainty with the purpose of limiting the probability of false acceptance.
Page 23
Decision Rules and Statements of Conformity
United Kingdom Accreditation Service 2 Pine Trees, Chertsey Lane, Staines-upon-Thames, TW18 3HR Website: www.ukas.com Publications requests email: [email protected]
© United Kingdom Accreditation Service. UKAS copyright exists on all UKAS publications.
LAB 48 Edition 3 Page 23 of 37
Appendix B: Measurement results and specifications
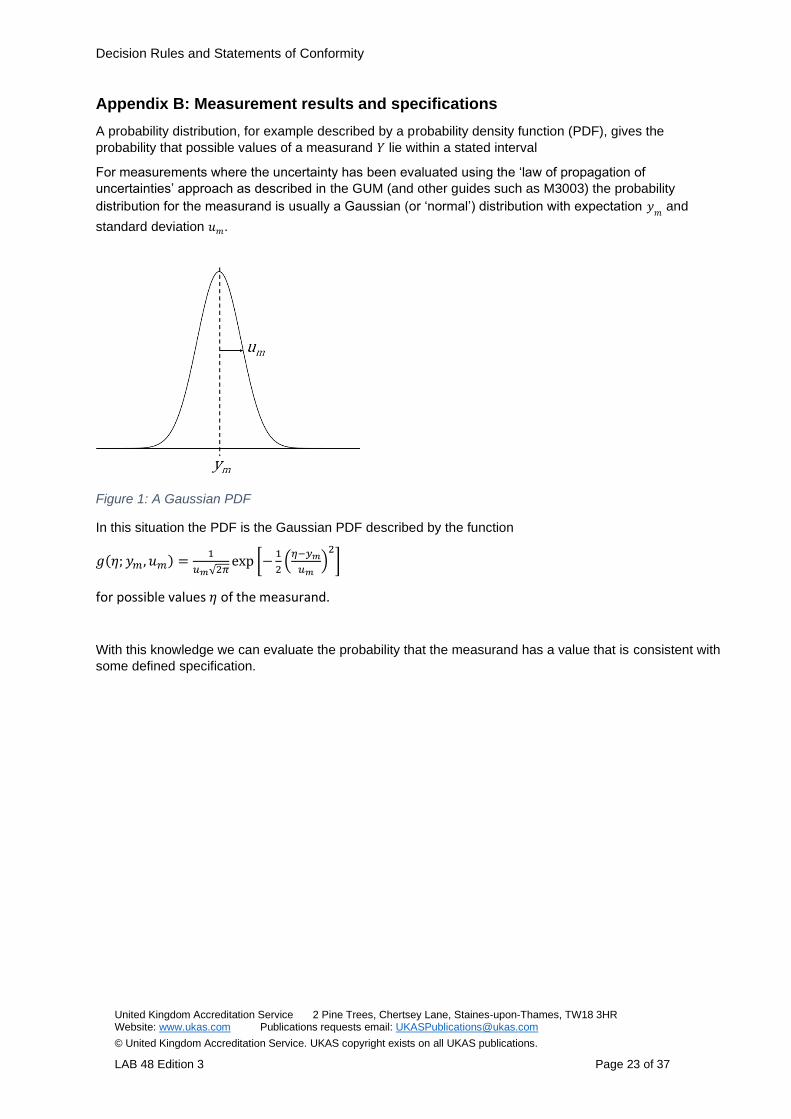
A probability distribution, for example described by a probability density function (PDF), gives the
probability that possible values of a measurand 𝑌 lie within a stated interval
For measurements where the uncertainty has been evaluated using the ‘law of propagation of
uncertainties’ approach as described in the GUM (and other guides such as M3003) the probability
distribution for the measurand is usually a Gaussian (or ‘normal’) distribution with expectation 𝑦𝑚
and
standard deviation 𝑢𝑚.
Figure 1: A Gaussian PDF
In this situation the PDF is the Gaussian PDF described by the function
𝑔(𝜂; 𝑦𝑚, 𝑢𝑚) =1
𝑢𝑚√2𝜋exp [−
1
2(
𝜂−𝑦𝑚
𝑢𝑚)
2]
for possible values 𝜂 of the measurand.
With this knowledge we can evaluate the probability that the measurand has a value that is consistent with
some defined specification.
Page 24
Decision Rules and Statements of Conformity
United Kingdom Accreditation Service 2 Pine Trees, Chertsey Lane, Staines-upon-Thames, TW18 3HR Website: www.ukas.com Publications requests email: [email protected]
© United Kingdom Accreditation Service. UKAS copyright exists on all UKAS publications.
LAB 48 Edition 3 Page 24 of 37
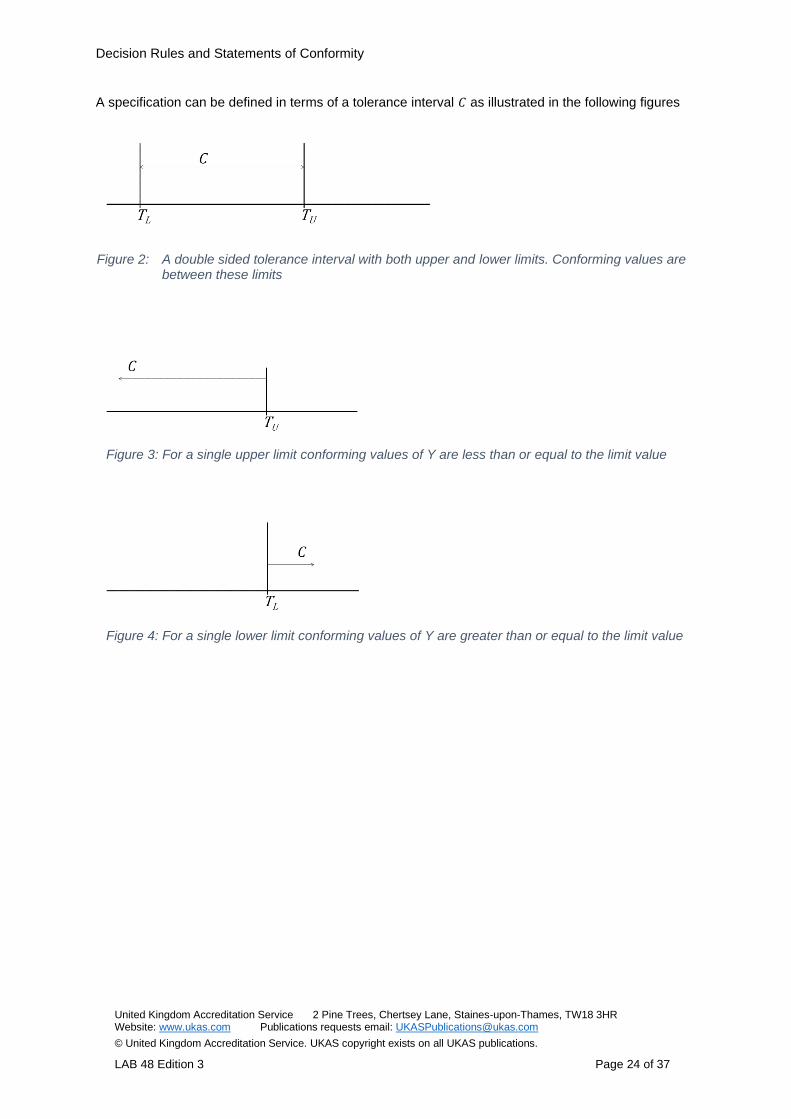
A specification can be defined in terms of a tolerance interval 𝐶 as illustrated in the following figures
Figure 2: A double sided tolerance interval with both upper and lower limits. Conforming values are between these limits
Figure 3: For a single upper limit conforming values of Y are less than or equal to the limit value
Figure 4: For a single lower limit conforming values of Y are greater than or equal to the limit value
Page 25
Decision Rules and Statements of Conformity
United Kingdom Accreditation Service 2 Pine Trees, Chertsey Lane, Staines-upon-Thames, TW18 3HR Website: www.ukas.com Publications requests email: [email protected]
© United Kingdom Accreditation Service. UKAS copyright exists on all UKAS publications.
LAB 48 Edition 3 Page 25 of 37
Appendix C: Conformance probability and risk
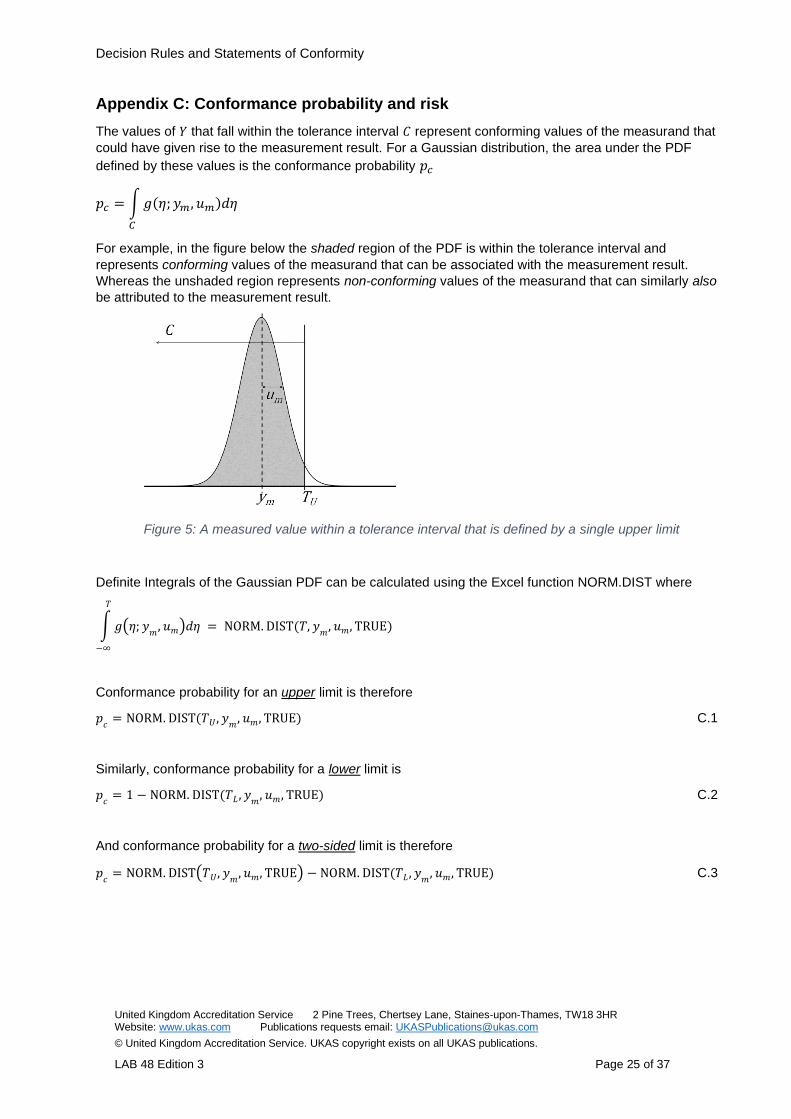
The values of 𝑌 that fall within the tolerance interval 𝐶 represent conforming values of the measurand that
could have given rise to the measurement result. For a Gaussian distribution, the area under the PDF
defined by these values is the conformance probability 𝑝𝑐
𝑝𝑐 = ∫ 𝑔(𝜂; 𝑦𝑚, 𝑢𝑚)𝑑𝜂
𝐶
For example, in the figure below the shaded region of the PDF is within the tolerance interval and
represents conforming values of the measurand that can be associated with the measurement result.
Whereas the unshaded region represents non-conforming values of the measurand that can similarly also
be attributed to the measurement result.
Figure 5: A measured value within a tolerance interval that is defined by a single upper limit
Definite Integrals of the Gaussian PDF can be calculated using the Excel function NORM.DIST where
∫ 𝑔(𝜂; 𝑦𝑚
, 𝑢𝑚)𝑑𝜂 = NORM. DIST(𝑇, 𝑦𝑚
, 𝑢𝑚, TRUE)
𝑇
−∞
Conformance probability for an upper limit is therefore
𝑝𝑐
= NORM. DIST(𝑇𝑈, 𝑦𝑚
, 𝑢𝑚, TRUE) C.1
Similarly, conformance probability for a lower limit is
𝑝𝑐
= 1 − NORM. DIST(𝑇𝐿 , 𝑦𝑚
, 𝑢𝑚, TRUE) C.2
And conformance probability for a two-sided limit is therefore
𝑝𝑐
= NORM. DIST(𝑇𝑈, 𝑦𝑚
, 𝑢𝑚, TRUE) − NORM. DIST(𝑇𝐿 , 𝑦𝑚
, 𝑢𝑚, TRUE) C.3
Page 26
Decision Rules and Statements of Conformity
United Kingdom Accreditation Service 2 Pine Trees, Chertsey Lane, Staines-upon-Thames, TW18 3HR Website: www.ukas.com Publications requests email: [email protected]
© United Kingdom Accreditation Service. UKAS copyright exists on all UKAS publications.
LAB 48 Edition 3 Page 26 of 37
For example, suppose that in the case shown above 𝑇𝑈 = 1.96, 𝑦𝑚
= 0, 𝑢𝑚 = 1 then
𝑝𝑐
= ∫ 𝑔(𝜂; 𝑦𝑚
, 𝑢𝑚)𝑑𝜂 = NORM. DIST(1.96,0,1, TRUE)
𝑇𝑈
−∞
i.e.
𝑝𝑐
= NORM. DIST(1.96, 0, 1, TRUE) = 0.975 = 97.5 %
The corresponding equations for calculating conformance probability for a 𝑡-distribution with 𝜈 degrees of
freedom are:
Conformance probability for an upper limit
𝑝𝑐
= T. DIST ((𝑇𝑈−𝑦𝑚
𝑢) , 𝜈, TRUE) C.4
Conformance probability for a lower limit
𝑝𝑐 = 1 − T. DIST ((𝑇𝐿−𝑦𝑚
𝑢) , 𝜈, TRUE) C.5
And conformance probability for a two-sided limit
𝑝𝑐 = T. DIST ((𝑇𝑈−𝑦𝑚
𝑢) , 𝜈, TRUE) − T. DIST ((
𝑇𝐿−𝑦𝑚
𝑢) , 𝜈, TRUE) C.6
For example, suppose that in the case shown above 𝑇𝑈 = 1.96, 𝑦𝑚 = 0, 𝑢𝑚 = 1 and 𝜈 = 3 then
𝑝𝑐
= T. DIST ((1.96−0
1) , 3, TRUE) = 0.928 = 92.8 %
Page 27
Decision Rules and Statements of Conformity
United Kingdom Accreditation Service 2 Pine Trees, Chertsey Lane, Staines-upon-Thames, TW18 3HR Website: www.ukas.com Publications requests email: [email protected]
© United Kingdom Accreditation Service. UKAS copyright exists on all UKAS publications.
LAB 48 Edition 3 Page 27 of 37
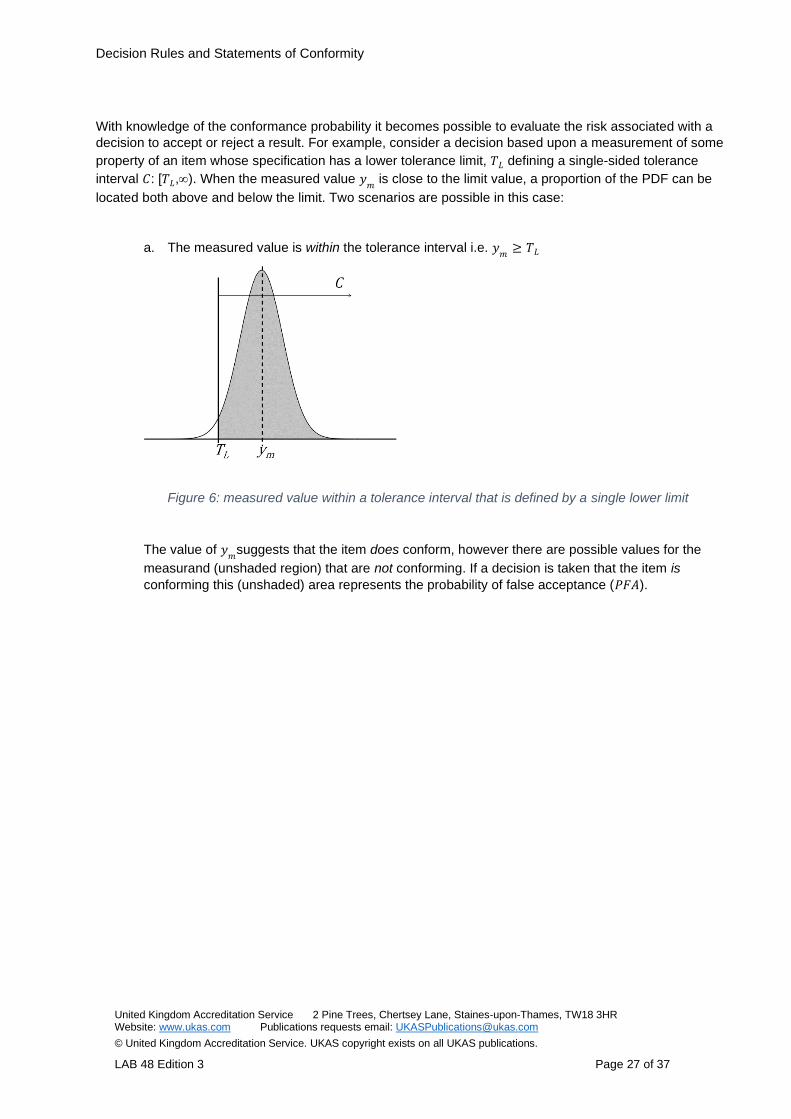
With knowledge of the conformance probability it becomes possible to evaluate the risk associated with a
decision to accept or reject a result. For example, consider a decision based upon a measurement of some
property of an item whose specification has a lower tolerance limit, 𝑇𝐿 defining a single-sided tolerance
interval 𝐶: [𝑇𝐿,). When the measured value 𝑦𝑚
is close to the limit value, a proportion of the PDF can be
located both above and below the limit. Two scenarios are possible in this case:
a. The measured value is within the tolerance interval i.e. 𝑦𝑚
≥ 𝑇𝐿
Figure 6: measured value within a tolerance interval that is defined by a single lower limit
The value of 𝑦𝑚
suggests that the item does conform, however there are possible values for the
measurand (unshaded region) that are not conforming. If a decision is taken that the item is
conforming this (unshaded) area represents the probability of false acceptance (𝑃𝐹𝐴).
Page 28
Decision Rules and Statements of Conformity
United Kingdom Accreditation Service 2 Pine Trees, Chertsey Lane, Staines-upon-Thames, TW18 3HR Website: www.ukas.com Publications requests email: [email protected]
© United Kingdom Accreditation Service. UKAS copyright exists on all UKAS publications.
LAB 48 Edition 3 Page 28 of 37
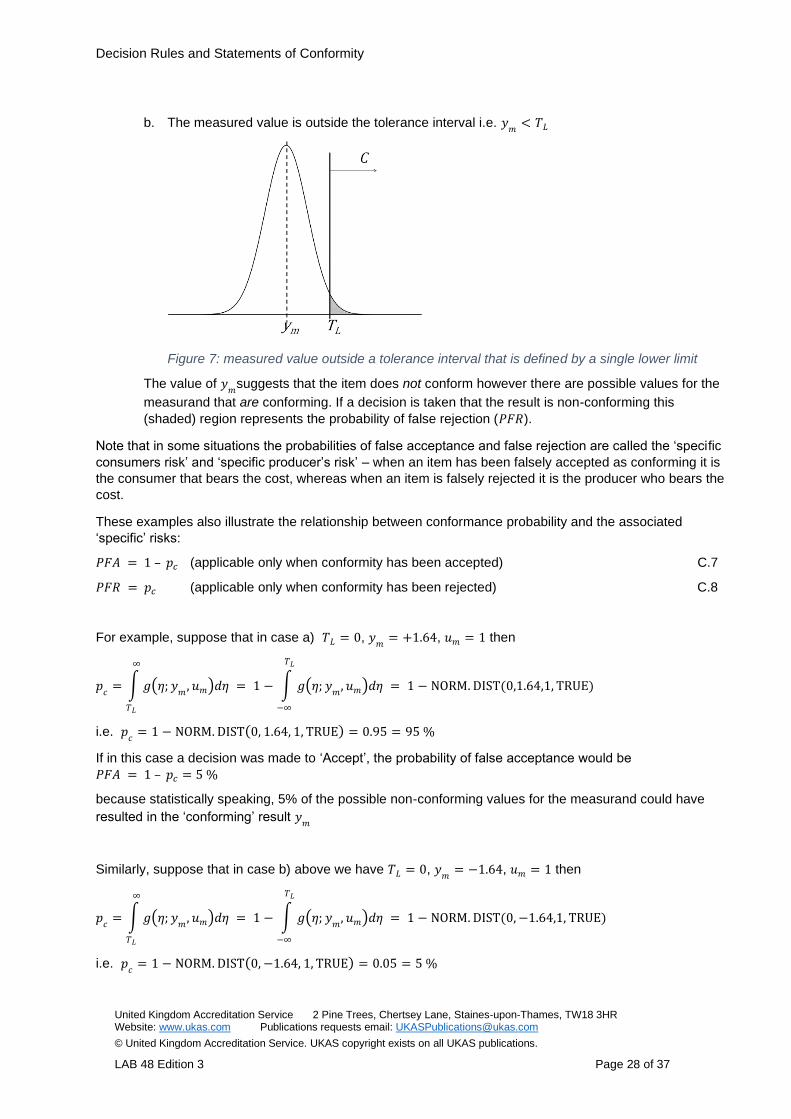
b. The measured value is outside the tolerance interval i.e. 𝑦𝑚
< 𝑇𝐿
Figure 7: measured value outside a tolerance interval that is defined by a single lower limit
The value of 𝑦𝑚
suggests that the item does not conform however there are possible values for the
measurand that are conforming. If a decision is taken that the result is non-conforming this
(shaded) region represents the probability of false rejection (𝑃𝐹𝑅).
Note that in some situations the probabilities of false acceptance and false rejection are called the ‘specific
consumers risk’ and ‘specific producer’s risk’ – when an item has been falsely accepted as conforming it is
the consumer that bears the cost, whereas when an item is falsely rejected it is the producer who bears the
cost.
These examples also illustrate the relationship between conformance probability and the associated
‘specific’ risks:
𝑃𝐹𝐴 = 1 – 𝑝𝑐 (applicable only when conformity has been accepted) C.7
𝑃𝐹𝑅 = 𝑝𝑐 (applicable only when conformity has been rejected) C.8
For example, suppose that in case a) 𝑇𝐿 = 0, 𝑦𝑚
= +1.64, 𝑢𝑚 = 1 then
𝑝𝑐
= ∫ 𝑔(𝜂; 𝑦𝑚
, 𝑢𝑚)𝑑𝜂 = 1 − ∫ 𝑔(𝜂; 𝑦𝑚
, 𝑢𝑚)𝑑𝜂 = 1 − NORM. DIST(0,1.64,1, TRUE)
𝑇𝐿
−∞
∞
𝑇𝐿
i.e. 𝑝𝑐
= 1 − NORM. DIST(0, 1.64, 1, TRUE) = 0.95 = 95 %
If in this case a decision was made to ‘Accept’, the probability of false acceptance would be 𝑃𝐹𝐴 = 1 – 𝑝𝑐 = 5 %
because statistically speaking, 5% of the possible non-conforming values for the measurand could have
resulted in the ‘conforming’ result 𝑦𝑚
Similarly, suppose that in case b) above we have 𝑇𝐿 = 0, 𝑦𝑚
= −1.64, 𝑢𝑚 = 1 then
𝑝𝑐
= ∫ 𝑔(𝜂; 𝑦𝑚
, 𝑢𝑚)𝑑𝜂 = 1 − ∫ 𝑔(𝜂; 𝑦𝑚
, 𝑢𝑚)𝑑𝜂 = 1 − NORM. DIST(0, −1.64,1, TRUE)
𝑇𝐿
−∞
∞
𝑇𝐿
i.e. 𝑝𝑐
= 1 − NORM. DIST(0, −1.64, 1, TRUE) = 0.05 = 5 %
Page 29
Decision Rules and Statements of Conformity
United Kingdom Accreditation Service 2 Pine Trees, Chertsey Lane, Staines-upon-Thames, TW18 3HR Website: www.ukas.com Publications requests email: [email protected]
© United Kingdom Accreditation Service. UKAS copyright exists on all UKAS publications.
LAB 48 Edition 3 Page 29 of 37
In this case if a decision was made to ‘Reject’, the probability of false rejection would be 𝑃𝐹𝑅 = 𝑝𝑐 = 5 %
because statistically speaking, 5% of the possible conforming values for 𝑌 could have resulted in the
‘non-conforming’ result 𝑦𝑚
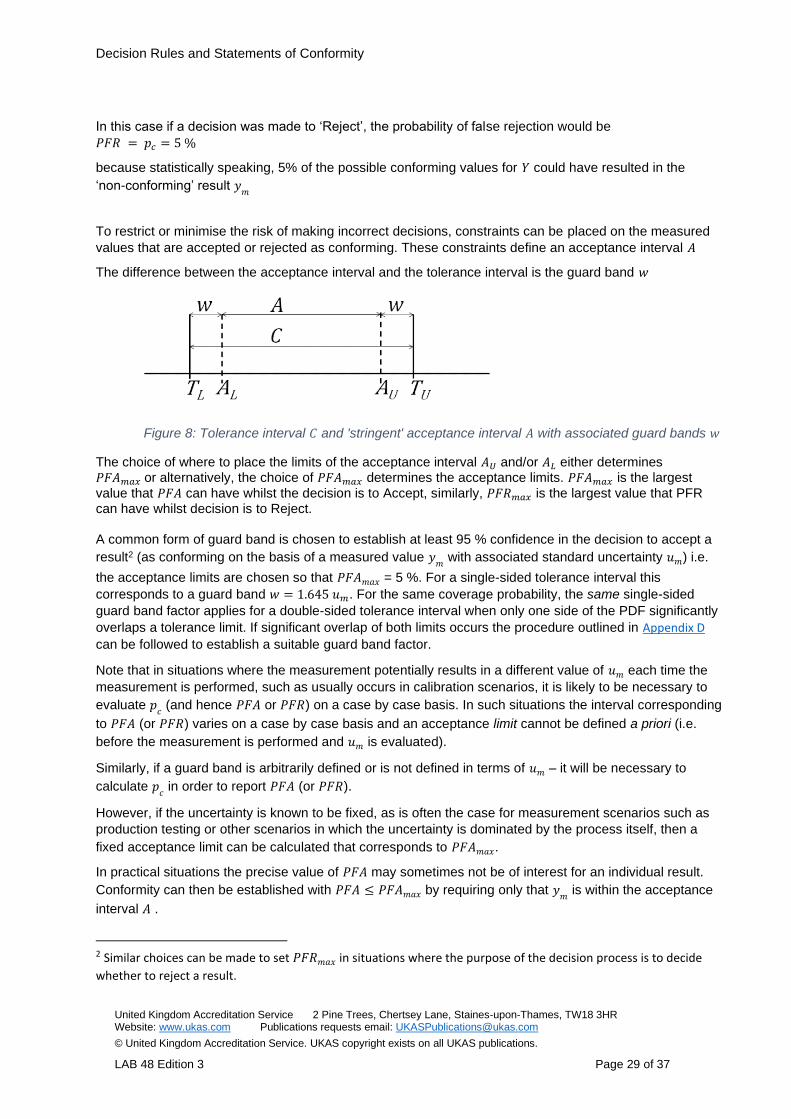
To restrict or minimise the risk of making incorrect decisions, constraints can be placed on the measured
values that are accepted or rejected as conforming. These constraints define an acceptance interval 𝐴
The difference between the acceptance interval and the tolerance interval is the guard band 𝑤
Figure 8: Tolerance interval 𝐶 and 'stringent' acceptance interval 𝐴 with associated guard bands 𝑤
The choice of where to place the limits of the acceptance interval 𝐴𝑈 and/or 𝐴𝐿 either determines 𝑃𝐹𝐴𝑚𝑎𝑥 or alternatively, the choice of 𝑃𝐹𝐴𝑚𝑎𝑥 determines the acceptance limits. 𝑃𝐹𝐴𝑚𝑎𝑥 is the largest
value that 𝑃𝐹𝐴 can have whilst the decision is to Accept, similarly, 𝑃𝐹𝑅𝑚𝑎𝑥 is the largest value that PFR can have whilst decision is to Reject. A common form of guard band is chosen to establish at least 95 % confidence in the decision to accept a
result2 (as conforming on the basis of a measured value 𝑦𝑚
with associated standard uncertainty 𝑢𝑚) i.e.
the acceptance limits are chosen so that 𝑃𝐹𝐴𝑚𝑎𝑥 = 5 %. For a single-sided tolerance interval this
corresponds to a guard band 𝑤 = 1.645 𝑢𝑚. For the same coverage probability, the same single-sided
guard band factor applies for a double-sided tolerance interval when only one side of the PDF significantly
overlaps a tolerance limit. If significant overlap of both limits occurs the procedure outlined in Appendix D
can be followed to establish a suitable guard band factor.
Note that in situations where the measurement potentially results in a different value of 𝑢𝑚 each time the
measurement is performed, such as usually occurs in calibration scenarios, it is likely to be necessary to
evaluate 𝑝𝑐 (and hence 𝑃𝐹𝐴 or 𝑃𝐹𝑅) on a case by case basis. In such situations the interval corresponding
to 𝑃𝐹𝐴 (or 𝑃𝐹𝑅) varies on a case by case basis and an acceptance limit cannot be defined a priori (i.e.
before the measurement is performed and 𝑢𝑚 is evaluated).
Similarly, if a guard band is arbitrarily defined or is not defined in terms of 𝑢𝑚 – it will be necessary to
calculate 𝑝𝑐 in order to report 𝑃𝐹𝐴 (or 𝑃𝐹𝑅).
However, if the uncertainty is known to be fixed, as is often the case for measurement scenarios such as
production testing or other scenarios in which the uncertainty is dominated by the process itself, then a
fixed acceptance limit can be calculated that corresponds to 𝑃𝐹𝐴𝑚𝑎𝑥.
In practical situations the precise value of 𝑃𝐹𝐴 may sometimes not be of interest for an individual result.
Conformity can then be established with 𝑃𝐹𝐴 ≤ 𝑃𝐹𝐴𝑚𝑎𝑥 by requiring only that 𝑦𝑚
is within the acceptance
interval 𝐴 .
2 Similar choices can be made to set 𝑃𝐹𝑅𝑚𝑎𝑥 in situations where the purpose of the decision process is to decide
whether to reject a result.
Page 30
Decision Rules and Statements of Conformity
United Kingdom Accreditation Service 2 Pine Trees, Chertsey Lane, Staines-upon-Thames, TW18 3HR Website: www.ukas.com Publications requests email: [email protected]
© United Kingdom Accreditation Service. UKAS copyright exists on all UKAS publications.
LAB 48 Edition 3 Page 30 of 37
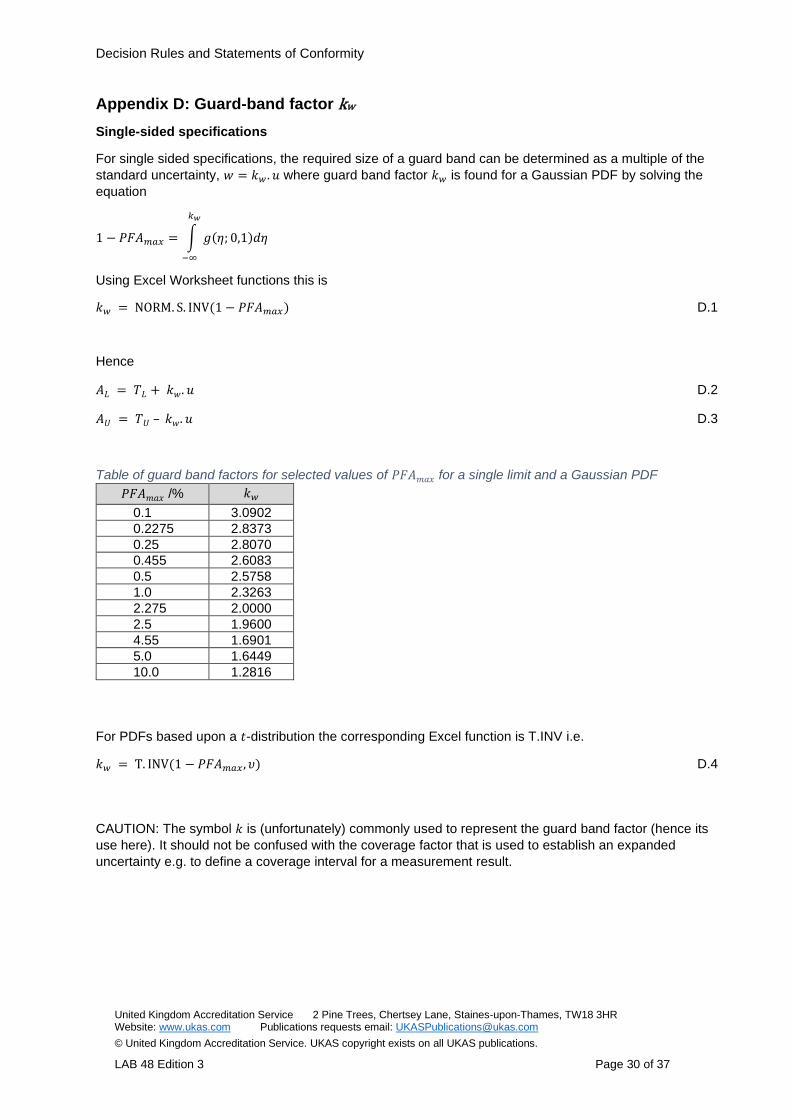
Appendix D: Guard-band factor kw
Single-sided specifications
For single sided specifications, the required size of a guard band can be determined as a multiple of the
standard uncertainty, 𝑤 = 𝑘𝑤 . 𝑢 where guard band factor 𝑘𝑤 is found for a Gaussian PDF by solving the
equation
1 − 𝑃𝐹𝐴𝑚𝑎𝑥 = ∫ 𝑔(𝜂; 0,1)𝑑𝜂
𝑘𝑤
−∞
Using Excel Worksheet functions this is
𝑘𝑤 = NORM. S. INV(1 − 𝑃𝐹𝐴𝑚𝑎𝑥) D.1
Hence
𝐴𝐿 = 𝑇𝐿 + 𝑘𝑤. 𝑢 D.2
𝐴𝑈 = 𝑇𝑈 – 𝑘𝑤. 𝑢 D.3
Table of guard band factors for selected values of 𝑃𝐹𝐴𝑚𝑎𝑥 for a single limit and a Gaussian PDF
𝑃𝐹𝐴𝑚𝑎𝑥 /% 𝑘𝑤
0.1 3.0902
0.2275 2.8373
0.25 2.8070
0.455 2.6083
0.5 2.5758
1.0 2.3263
2.275 2.0000
2.5 1.9600
4.55 1.6901
5.0 1.6449
10.0 1.2816
For PDFs based upon a 𝑡-distribution the corresponding Excel function is T.INV i.e.
𝑘𝑤 = T. INV(1 − 𝑃𝐹𝐴𝑚𝑎𝑥 , 𝜐) D.4
CAUTION: The symbol 𝑘 is (unfortunately) commonly used to represent the guard band factor (hence its
use here). It should not be confused with the coverage factor that is used to establish an expanded
uncertainty e.g. to define a coverage interval for a measurement result.
Page 31
Decision Rules and Statements of Conformity
United Kingdom Accreditation Service 2 Pine Trees, Chertsey Lane, Staines-upon-Thames, TW18 3HR Website: www.ukas.com Publications requests email: [email protected]
© United Kingdom Accreditation Service. UKAS copyright exists on all UKAS publications.
LAB 48 Edition 3 Page 31 of 37
Double-sided specifications
The single-sided guard band factor can often be applied to establish guard bands for double-sided
intervals.
A check can be performed to ensure that the guard band is consistent with the stated maximum risk of
false acceptance.
The process is as follows:
1. identify 𝑃𝐹𝐴𝑚𝑎𝑥, 𝑇𝑈, 𝑇𝐿, and 𝑢
2. first, calculate 𝑃𝐹𝐴 for a double-sided specification (using C.7 with C.3 or C.6 as appropriate) with
𝑦𝑚 = (𝑇𝑈 + 𝑇𝐿)/2
3. if 𝑃𝐹𝐴 > 𝑃𝐹𝐴𝑚𝑎𝑥 then it is not possible to define an Acceptance Interval consistent with 𝑃𝐹𝐴𝑚𝑎𝑥
4. otherwise… calculate the single-sided guard band factor 𝑘𝑤 using D.1 or D.4 as appropriate
5. calculate 𝐴𝐿 = 𝑇𝐿 + 𝑘𝑤 . 𝑢 (and for later use calculate 𝐴𝑈 = 𝑇𝑈 – 𝑘𝑤 . 𝑢)
6. calculate 𝑃𝐹𝐴 for a double-sided specification (using C.7 with C.3 or C.6 as appropriate) with
𝑦𝑚 = 𝐴𝐿
7. if 𝑃𝐹𝐴 ≈ 𝑃𝐹𝐴𝑚𝑎𝑥 then the PDF does not extend ‘significantly’3 beyond both limits for a value at the
limit of acceptance. The single-sided guard band factor (D.1 or D.4) is therefore suitable for a
double-sided specification at the proposed 𝑃𝐹𝐴𝑚𝑎𝑥
8. if instead 𝑃𝐹𝐴 is ‘significantly’ larger than 𝑃𝐹𝐴𝑚𝑎𝑥 a different guard band factor is required.
Precise calculation of the factor is not a straightforward procedure and it is probably best obtained
empirically… e.g. by progressively increasing 𝑘𝑤 and repeating steps 5. and 6. until an acceptable
interval is found, i.e. 𝑃𝐹𝐴 ≈ 𝑃𝐹𝐴𝑚𝑎𝑥
For example, suppose that we require 𝑃𝐹𝐴𝑚𝑎𝑥 = 0.050 for a Gaussian PDF with
𝑇𝐿 = −4
𝑇𝑈 = 4
𝑢 = 1
In this case we find that 𝑃𝐹𝐴 = 0.0500 when 𝑦𝑚 = (𝑇𝑈 + 𝑇𝐿)/2
therefore, a guard band for 𝑃𝐹𝐴𝑚𝑎𝑥 = 0.050 exists
the single-sided guard band factor is
𝑘𝑤 = NORM. S. INV(1 − 0.05) = 1.64485
𝐴𝐿 = −4 + 1.64485 × 1 = −2.35515
𝐴𝑈 = 4 − 1.64485 × 1 = 2.35515
Hence, for a double-sided specification, when 𝑦𝑚 = 𝐴𝐿 we calculate
𝑃𝐹𝐴 = 0.05000
Since 𝑃𝐹𝐴 ≈ 𝑃𝐹𝐴𝑚𝑎𝑥 we can use the single-sided guard band factor for the double-sided specification.
Suppose instead that 𝑢 = 2. Following the same steps, we now find that
𝐴𝐿 = −4 + 1.64485 × 2 = −0.71030
𝐴𝑈 = 4 − 1.64485 × 2 = 0.71030
and, for the double-sided specification, when 𝑦𝑚 = 𝐴𝐿 we calculate
𝑃𝐹𝐴 = 0.05926
which we may decide is ‘significantly’ larger than 𝑃𝐹𝐴𝑚𝑎𝑥
3 Deciding what is ‘significant’ depends upon the application and cannot be dictated in advance for all situations.
Page 32
Decision Rules and Statements of Conformity
United Kingdom Accreditation Service 2 Pine Trees, Chertsey Lane, Staines-upon-Thames, TW18 3HR Website: www.ukas.com Publications requests email: [email protected]
© United Kingdom Accreditation Service. UKAS copyright exists on all UKAS publications.
LAB 48 Edition 3 Page 32 of 37
If we increase 𝑘𝑤 by small increments and repeat the calculations for each new value, we find that when
𝑘𝑤 = 1.79, 𝑃𝐹𝐴 = 0.05028 , 𝐴𝐿 = −0.42 , 𝐴𝑈 = 0.42
𝑘𝑤 = 1.80, 𝑃𝐹𝐴 = 0.04983 , 𝐴𝐿 = −0.40 , 𝐴𝑈 = 0.40
𝑘𝑤 = 1.796, 𝑃𝐹𝐴 = 0.05001 , 𝐴𝐿 = −0.408 , 𝐴𝑈 = 0.408
allowing us to select an appropriate guard band factor.
Page 33
Decision Rules and Statements of Conformity
United Kingdom Accreditation Service 2 Pine Trees, Chertsey Lane, Staines-upon-Thames, TW18 3HR Website: www.ukas.com Publications requests email: [email protected]
© United Kingdom Accreditation Service. UKAS copyright exists on all UKAS publications.
LAB 48 Edition 3 Page 33 of 37
Appendix E: The problem with decision rules that do not take account of
measurement uncertainty
Conformity statements under ISO/IEC 17025:2017 require a Decision Rule (3.7) that takes account of
measurement uncertainty. Some people argue that it is possible to ‘take account’ by ignoring it, if that is
what the customer requests; however this seems to require a rather contradictory belief that you can be
‘doing something’ by ‘not doing something’ (is it possible to ‘obey a red stop light’ by ‘not obeying a red
stop light’?)
Besides the grammatical and logical inconsistency in this approach, others also argue that it is allowable
because ‘the customer accepts the risk associated with ignoring uncertainty’. This too is a flawed argument
as will be shown by a simple example.
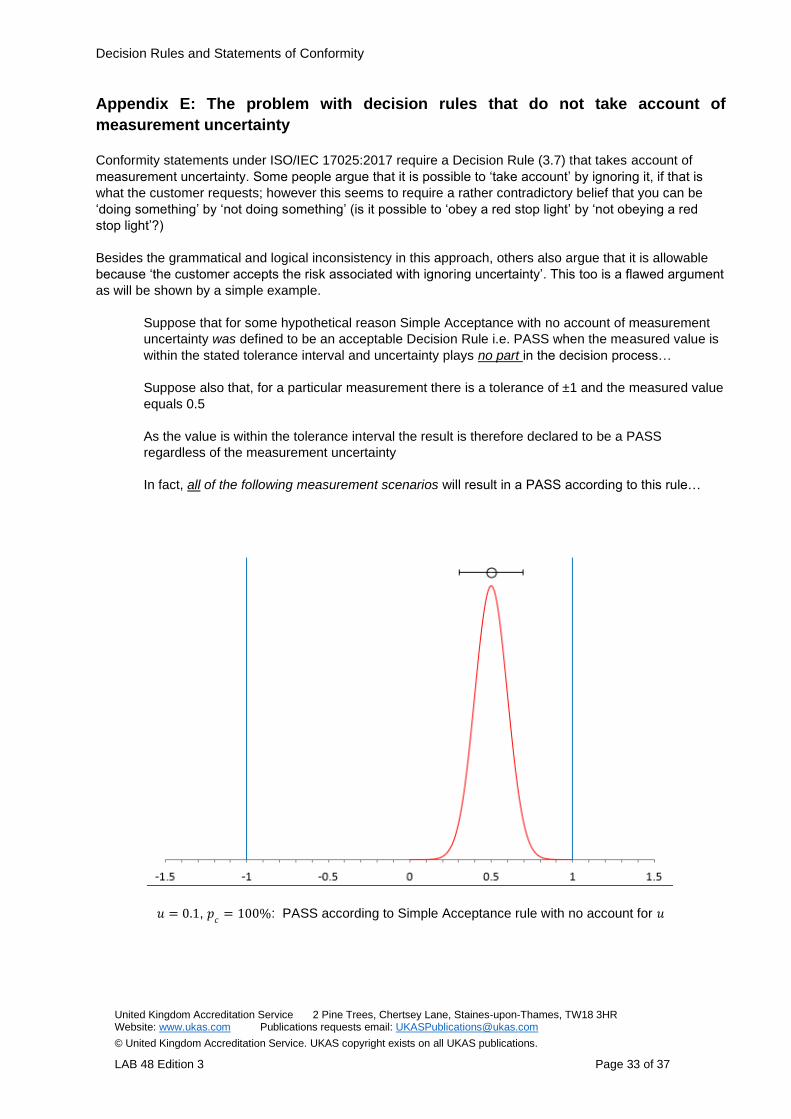
Suppose that for some hypothetical reason Simple Acceptance with no account of measurement
uncertainty was defined to be an acceptable Decision Rule i.e. PASS when the measured value is
within the stated tolerance interval and uncertainty plays no part in the decision process…
Suppose also that, for a particular measurement there is a tolerance of ±1 and the measured value
equals 0.5
As the value is within the tolerance interval the result is therefore declared to be a PASS
regardless of the measurement uncertainty
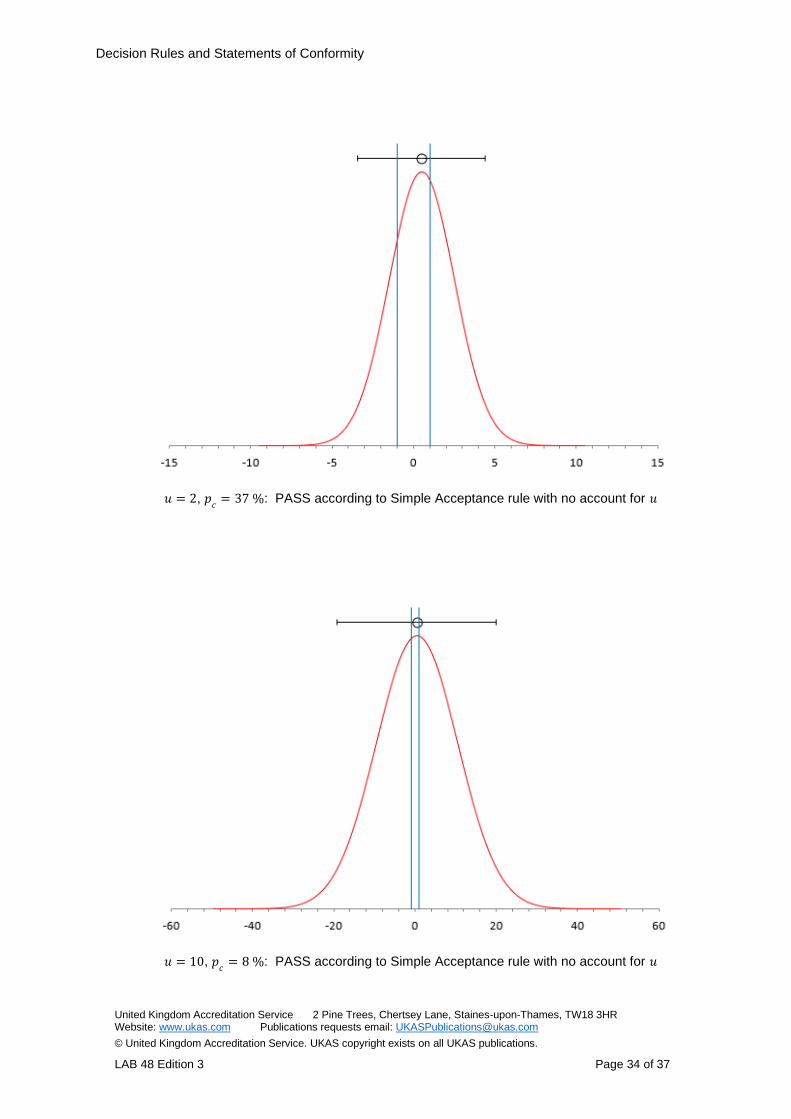
In fact, all of the following measurement scenarios will result in a PASS according to this rule…
𝑢 = 0.1, 𝑝𝑐
= 100%: PASS according to Simple Acceptance rule with no account for 𝑢
Page 34
Decision Rules and Statements of Conformity
United Kingdom Accreditation Service 2 Pine Trees, Chertsey Lane, Staines-upon-Thames, TW18 3HR Website: www.ukas.com Publications requests email: [email protected]
© United Kingdom Accreditation Service. UKAS copyright exists on all UKAS publications.
LAB 48 Edition 3 Page 34 of 37
𝑢 = 2, 𝑝𝑐
= 37 %: PASS according to Simple Acceptance rule with no account for 𝑢
𝑢 = 10, 𝑝𝑐
= 8 %: PASS according to Simple Acceptance rule with no account for 𝑢
Page 35
Decision Rules and Statements of Conformity
United Kingdom Accreditation Service 2 Pine Trees, Chertsey Lane, Staines-upon-Thames, TW18 3HR Website: www.ukas.com Publications requests email: [email protected]
© United Kingdom Accreditation Service. UKAS copyright exists on all UKAS publications.
LAB 48 Edition 3 Page 35 of 37
To reiterate, all of these scenarios (and an infinite number of others) are possible if there is “no account”
taken of measurement uncertainty and the associated Risk will vary on a case by case basis.
It isn’t therefore possible to ‘accept the risk associated with ignoring uncertainty’ as the risk is not only
undefined, it is undefinable when uncertainty is ignored.
It cannot be argued in defence that “in practice this wouldn’t be allowed to happen” and at the same time
claim to “ignore uncertainty”.
Suppose further, in this hypothetical situation, that a customer did understand that the risk was undefined
and still wished to proceed, it begs the question ‘for what legitimate purpose?’ If (for some yet to be
justified reason) such a Decision were to be allowed then, as in all cases, to avoid misrepresentation of the
outcome the decision would need to be accurately reported… for example:
“Decision Rule: Simple Acceptance rule ignoring uncertainty, by which it is not possible to state
any level of confidence or risk associated with the Decision”
It does not seem likely that this would be welcome, but to omit the final part of the sentence would
misrepresent the basis for the Decision.
A further consequence of ignoring measurement uncertainty is that the outcome of such a conformity
decision is not ‘metrologically’ traceable i.e. it could not be used to provide traceability for any subsequent
measurement activity such as calibration, testing, inspection or certification.
It is not ‘metrologically traceable’ because it is not the result of an unbroken chain of measurements and
associated uncertainties. In statistical terms it is not possible to establish a PDF for the measurand based
upon a conformity statement using a rule that does not somehow, directly or indirectly, take account of
measurement uncertainty.
Finally, it should also be noted that rules such as ‘Simple Acceptance ignoring measurement uncertainty in
the decision process but reporting measurement uncertainty together with the Decision outcome’ are also
not consistent with the ISO/IEC 17025:2017 definition of a Decision Rule because uncertainty has not been
involved in the decision process.
Reporting the uncertainty post-decision might allow risk to subsequently be evaluated, but it has not
influenced the earlier decision to accept or otherwise – it therefore represents a situation where a decision
is made regardless of risk.
The solution…
Often, in circumstances where ‘the customer asks’ the laboratory to ‘ignore uncertainty’ it is because they
do not have sufficient understanding of uncertainty or of risk to realise what they are asking for. Usually
however the customer actually does have some unarticulated belief about the appropriateness of the
measurements - in other words there is some implicit idea of a point beyond which the uncertainty is too
large.
Quantitatively establishing and applying that ‘point’ takes measurement uncertainty into account.
Page 36
Decision Rules and Statements of Conformity
United Kingdom Accreditation Service 2 Pine Trees, Chertsey Lane, Staines-upon-Thames, TW18 3HR Website: www.ukas.com Publications requests email: [email protected]
© United Kingdom Accreditation Service. UKAS copyright exists on all UKAS publications.
LAB 48 Edition 3 Page 36 of 37
Simple Acceptance criteria can be therefore used as the basis for identifying the acceptance interval
provided that it is used together with an identified constraint on the uncertainty, for example by agreeing an
upper limit for measurement uncertainty or agreeing a limit to the test uncertainty ratio (TUR).
Agreeing the limits for measurement uncertainty is a matter for review between the laboratory and their
customer. The laboratory might for example point out that, being an accredited laboratory, they have
already established values for the likely uncertainty of all key measurements...
To summarise:
A rule such as Simple Acceptance with no account for measurement uncertainty is not an appropriate
Decision Rule under ISO/IEC 17025:2017.
• At best it would simply be technically worthless, having undefinable risk and no metrological
traceability
• At worst it is misleading, using a laboratory’s accreditation status to pass off a meaningless
decision as something more credible than it is
Rules based upon Simple Acceptance criteria can be a part of a valid Decision Rule when used together
with indirect accounting for measurement uncertainty. Under these conditions
• It provides traceability (a PDF can be established if required)
• There is a definable risk in the decision outcome
Page 37
Decision Rules and Statements of Conformity
United Kingdom Accreditation Service 2 Pine Trees, Chertsey Lane, Staines-upon-Thames, TW18 3HR Website: www.ukas.com Publications requests email: [email protected]
© United Kingdom Accreditation Service. UKAS copyright exists on all UKAS publications.
LAB 48 Edition 3 Page 37 of 37
Reference documents
ISO/IEC 17025:2017 “General requirements for the competence of testing and calibration laboratories” ILAC-G8:09/2019 “Guidelines on Decision Rules and Statements of Conformity” ISO/IEC Guide 98-3:2008 (JCGM 100) “Guide to the expression of uncertainty in measurement (GUM)” UKAS, M3003 “The Expression of Uncertainty and Confidence in Measurement (Edition 4, October 2019)” ISO/IEC Guide 98-4:2012 (JCGM 106) “Uncertainty of measurement - Part 4: Role of measurement uncertainty in conformity assessment” ISO 10576-1:2003 “Statistical methods – Guidelines for the evaluation of conformity with specified
requirements”
ASME B89.7.4.1-2005 “Measurement Uncertainty and Conformance Testing: Risk Analysis”
ASME B89.7.3.1-2001 “Guidelines for Decision Rules: Considering Measurement Uncertainty in
Determining Conformance to Specifications”
BS EN ISO 14253-1:2017 “Geometrical product specifications (GPS) - Inspection by measurement of
workpieces and measuring equipment Part 1: Decision rules for verifying conformity or nonconformity with
specifications (BS EN ISO 14253-1:2017)”
ISO 5725-1:1994 “Accuracy (trueness and precision) of measurement methods and results - Part 1:
General principles and definitions”