Received 13th September 2015,Accepted 12th October 2015
DOI: 10.1039/c5lc01093d
www.rsc.org/loc
Using confined bacteria as building blocks togenerate fluid flow†
Zhiyong Gao,a He Li,a Xiao Chena and H. P. Zhang*ab
In many technological applications, materials are transported by fluid flow at micro/nanometer scales.
Conventionally, macroscopic apparatuses, such as syringe pumps, are used to drive the flow. This work
explores the possibility of utilizing motile bacteria as microscopic pumps. We used micro-fabricated struc-
tures to confine smooth-swimming bacteria in a prescribed configuration. The flagella of confined bacteria
rotate to collectively generate flow that can transport materials along designed trajectories. Different struc-
tures are combined to realize complex functions, such as collection or dispersion of particles. Experimental
findings are reproduced in numerical simulations. Our method opens new ways to generate transport flow
at the micrometer scale and to drive bio-hybrid devices.
1. Introduction
In a microscopic environment, fluid flow is dominated by vis-cous effects and the governing Stokes equation has a time-reversal symmetry.1–3 This leads to the strange and some-times counter-intuitive physics of low Reynolds numberhydrodynamics. For example, Purcell's “scallop theorem”
states that nonreciprocal motion is required for generation ofdirected flow or motility.4 Hence, many familiar macroscopicprocesses utilizing inertia do not work on small scales andthe unique physical constraints of low Reynolds numberhydrodynamics have led to several technological challenges,such as efficient transportation of fluid and materials througha microfluidic system.5–9
Microorganisms, such as bacteria, are native inhabitantsof the microscopic world. In the evolutionary process, theyhave acquired swimming strategies which successfully over-come the limitations of viscous effects.3,10 For example, awide variety of bacteria swim by rotating helical filaments,called flagella.11,12 Each flagellum is connected to a molecu-lar motor via a flexible hook. The motor is anchored in thebacterial cell wall and driven by protons or sodium ionsflowing from the outside to the inside of the cell. In peritri-chous bacteria, such as Escherichia coli, flagella form a bun-dle that pushes the cell body steadily forward when allmotors turn counterclockwise (as seen by an observer on the
outside of the cell looking down at the hook).11,13 Bacteriacan swim about ten body-length per second with an energyconversion efficiency estimated to be orders of magnitudegreater than that of existing synthetic micromotors.7
Bacteria have been used to drive bio-hybrid devices.8,9
Researchers physically attached bacteria to microscopic cargoand used bacteria as micro-propellers to achieve fastertransportation.14–19 Free swimming bacteria in suspensionswere shown to be able to rotate and translate immersedobjects.20–23 Researchers also tethered swimmers to a station-ary object to generate transport flow. In a pioneering experi-ment, Darnton et al. immobilized motile bacteria on an opensurface to form a densely packed monolayer, called a bacte-rial carpet; the rotating flagella of the tethered bacteria gener-ate a strong flow near the activated surface.14 In the followingstudies, bacterial carpets have been used to pump fluidthrough a microchannel,24 to enhance mixing in microfluidicdevices,25 and to investigate collective dynamics of hydrody-namically coupled cells.26–28
These previous studies have clearly demonstrated the pos-sibility of using immobilized bacteria to drive fluidflow.14,24,25,27,28 In order to engineer the generated flow, onehas to precisely control the position and orientation ofimmobilized bacteria. Blotting14 and flow deposition24
methods previously used to create bacterial carpets, however,cannot achieve such a precise control. Here we solve thisproblem with micro-fabricated structures containingcavities.29–31 The cavity size is comparable to that of a bacte-rial body; each cavity captures a single bacterium with its fla-gella freely rotating in the fluid. Through careful design ofcavities, we can precisely position and orient the bacteria togenerate the desired flow pattern. Experimental results arequantitatively reproduced by numerical calculations using
the regularized Stokeslet method.12,32,33 Our work provides aconvenient and precise method to control motile bacteria intechnological and scientific investigations.
2. Experimental and numericalmethods2.1 Bacteria cultivation
We grew Escherichia coli cells (RP5232) overnight in Luriabroth (Sigma) in a shaking incubator (37 °C and 200 rpm).The saturated culture was then diluted (1 : 50) in tryptonebroth medium and regrown for 4.5 h at 32 °C and 200 rpm.Cells were then collected from the culture media by centrifu-gation at 1000g (3680 rpm) for 5 min at room temperature.The resulting pellet was gently re-suspended by mixing in amotility buffer (10−2 M glucose, 10−4 M EDTA (pH 7.0)).20,22
No salts were added to the motility buffer to avoid particleaggregation and adhesion to the coverslip. With the aboveprocedure, we obtained highly motile bacteria with a meanbody length of 3 μm (cf. Fig. S1†).
2.2 Micro-fabrication and sample preparation
The structures were fabricated with a two-photon micro-fabri-cation system (μFAB3D from Teem Photonics). This systemuses a microscope objective lens (Zeiss Fluar, 100×, numeri-cal aperture 1.3) to focus the pulsed laser (Nd:YAG microchiplaser with a 532 nm wavelength, a 750 ps pulse width, and a40 kHz repetition rate) onto a droplet of the photoresist resinthat is mounted on a Piezo nanopositioning Stage (PI P-563.3CL). We used a biocompatible resin ORMOCOMP(Micro resist technology GmbH) with a photo-initiator (1,3,5-trisIJ2-(9-ethylcabazyl-3)ethylene)benzene). Photo-polymerization occurs and solidifies the resin at the focalpoint, and the Piezo stage scans the resin relative to the focalpoint in a designed 3-dimensional pattern to fabricate thestructures.34 After the scanning was finished, we removed theremaining liquid resin by washing the structure with4-methyl-2-pentanone and acetone respectively for 5 minutes.Our technique can fabricate structures with a sub-micrometer resolution. Fig. 1(a) shows a scanning electronmicrograph (Zeiss Ultra Plus) of the structure fabricated on acover slip.
To prepare the sample, we immersed the structures in amotility buffer containing the bacteria and flow tracers. Thenthe sample was enclosed in a sealed chamber and mountedon a Nikon inverted microscope for imaging.
2.3 Imaging and velocity measurement
The motion of the fluorescent flow tracers (0.49 μm in diame-ter, F8813, Invitrogen) was recorded through a 60× oil objec-tive lens (numerical aperture 1.4) at a rate of 40 frames persecond with a Basler camera (acA2040-90um). For each exper-iment, 10 000 images were obtained and analyzed with a cus-tom Matlab software program that precisely tracks the tracerswith standard particle tracking algorithms. The resulting
tracer velocity vectors were spatially binned into a 1 μmsquare grid and the mean of the vectors in each bin wastaken as a measure of the time-averaged local flow.
We used a defocusing method35 to track the 3D trajecto-ries of the fluorescent tracers. When a fluorescent tracer isaway from the focal plane of the objective, the tracer'sdefocused image appears as a bright ring. The ring radiuschanges with the separation between the tracer and the focalplane. Therefore, we can infer the tracer's 3D position fromthe size and position of the defocused ring.
2.4 Numerical simulations
To complement the experimental results, we carried outnumerical simulations with the regularized Stokesletmethod.12,32,33 Our model for a single confined bacterium isshown in Fig. 2(d). In the model, a helix rotates behind a ver-tical wall and above a coverslip. Geometric parameters forthe helix are chosen to match those of the E. coli flagellum:12
Fig. 1 (a) Scanning electron micrograph of a structure. The thicknessof the top and side walls is 1.4 μm and 0.6 μm, respectively. (b) Phase-contrast image of a bacterium confined in a structure (scale bar: 5μm). The green dots show the bacteria trajectory before being cap-tured. The inset shows the distribution of filling time (see the text) for90 events.
filament radius 0.012 μm. The size of the vertical wall is cho-sen to be that of the yz cross section of the structure. Thehelix is discretized as a string of 424 Stokeslets; the nearestStokeslets are separated by 0.012 μm. The wall is representedby Stokeslets on a square grid with a spacing of 0.1 μm. Fol-lowing ref. 36, we used 0.07 μm and 0.01 μm as the regulari-zation parameters for the Stokeslets on the wall and thehelix, respectively. No-slip boundary condition is required onthe wall, the helix, and the coverslip. An imaging method33 isused to realize the boundary condition on the coverslip. Weaveraged the flow fields over different phases of a rotatingperiod to generate a time-averaged field, which was com-pared with the experimental results. In simulations of multi-ple flagella, we assigned random initial phases to the flagella.Other configurations of the initial phases were tested and wefound that the time-averaged flow doesn't depend on the ini-tial phases.
3. Results3.1 Confinement of a motile bacterium
The structures are fabricated on coverslips and contain cubiccavities of 4.5 × 1.8 × 1.4 μm3 (cf. Fig. 1(a)). When a smooth-swimming E. coli bacterium swims into a cavity by chance, it
will be captured because of its inability to swim back-out ofthe cavity by rotating the flagella bundle in a clockwise direc-tion.30 A typical capture process is shown in Fig. 1(b) andMovie S1.† The structure used to produce Fig. 1(b) is inten-tionally made shorter (3 μm), so part of the cell body is out-side the structure and body motion can be seen clearly inMovie S1,† which demonstrates the vitality of the confinedbacterium.
We used a dilute bacteria suspension with a volume frac-tion less than 0.1%. Bacteria accumulate near the coverslipand swim parallel to the boundary:37–39 both effects increasethe efficiency of filling the structures with bacteria. We mea-sure the time it takes to fill a cavity after the sample is pre-pared and plot the distribution of filling time for 90 captureevents in the insert of Fig. 1(b). Under our experimental con-ditions, the mean filling time is 3 minutes.
3.2 Fluid flow generated by a confined bacterium
We first investigate the fluid flow around a single confinedbacterium. As shown in Fig. 2(a), the cavity has a suitable sizeso that the body of a typical bacterium is inside and the fla-gellar bundle (represented by a single flagellum) rotates out-side to generate fluid flow. The corresponding numerical
Fig. 2 (a) Illustration of a motile bacterium confined in a structure. The yellow arrow shows the direction of flagellar rotation. (b) Fluid flowmeasured on the xy plane at z = 2.1 μm above the coverslip in experiments. Movie S2† shows two dimensional trajectories of fluorescent tracers.(c) A three dimensional tracer trajectory color-coded by the tracer height above the coverslip. Three defocused rings with their fit are shown inthe background. (d) Illustration of the numerical model. The structure and cell body are represented by a no-slip wall (shown in red). (e–f) Flowfields computed on two planes at z = 2.1 μm and x = 2 μm. The color in (b), (e), and (f) represents the velocity magnitude and the arrows denotethe direction of flow. The white dashed lines in (b–c) and (e) mark the right boundary of the structure and the wall, respectively. The projections offlagella on the measurement plane are shown as white solid lines in (e) and (f).
model is shown in Fig. 2(d). To reduce computing costs, wedon't explicitly treat the structure and cell body in simula-tions; their hydrodynamic effects are represented by a verticalwall, which has the same size (3.0 × 2.8 μm2) as the yz crosssection of the structure. The flagellum rotates around its axiswith a frequency of Ω = 165 Hz and the axis is 0.65 μm abovethe bottom surface: h = 0.65 μm. The same values of Ω and hare used in all simulations.
To understand the complex flow around the confined bac-terium, we recall that the rotation of a helical flagellum gen-erates translational fluid flow along the flagellum axis androtational flow around the axis.13,32 In our study, the flagel-lum is close to a solid surface and the fluid flow is heavilydamped near the coverslip (at z = 0), as shown by the com-puted velocity field on the x = 2 μm plane in Fig. 2(f). This
renders the y-velocity component (Vy) negative in most of theregion that is not too close to the flagellum.37,39 Conse-quently, a flow tracer released at the upper-left corner inFig. 2(c) moves in the negative y direction; the tracer is alsoadvected in the x direction by the translational flow of thehelix. This diagonal particle trajectory is consistent with thevelocity field on the z = 2.1 μm plane, as shown inFig. 2(b) and (e). The tracer also exhibits a significant motionin the z direction. As shown in Fig. 2(c), the z coordinate ofthe tracer first decreases then increases as it moves from theupper-left to the bottom-right corner. This is consistent withthe flow field in Fig. 2(f).
As shown in Fig. 2, the flow around a confined bacteriumis complex in the near field. In the far field, the flow is sim-pler and can be understood from the perspective of flow
Fig. 3 (a) Illustration of a linear array of 5 confined bacteria. Bacterial flagella tilt at an angle of α = 40°. The yellow arrows show the direction offlagellar rotation. An electron micrograph of the structure is shown in Fig. S2.† (b) Fluid flow measured on the xy plane at z = 2.1 μm above thecoverslip in experiments. Raw data of tracer motion can be found in Movie S3.† (c) A three dimensional tracer trajectory color-coded by the tracerheight above the coverslip. Four defocused rings with their fit are shown in the background. (d) Illustration of the numerical model. The structureand cell bodies are represented by a no-slip wall (shown in red). (e–f) Flow fields computed on two planes at z = 2.1 μm and x = 2 μm, respectively.The color in (b), (e), and (f) represents the velocity magnitude and the arrows denote the direction of flow. The white dashed lines in (b–c) and (e)mark the right boundary of the structure and the wall, respectively. The projections of flagella on the measurement plane are shown as white solidlines in (e) and (f).
singularities. A rotating flagellum can be represented by aStokeslet and a rotlet.2,13 In free space, the flow generated bythese two singularities has different asymptotic behaviors:VStokeslet ∝ 1/r and Vrotlet ∝ 1/r2, where r is the distance fromthe singularities, and the far-field flow of a rotating flagellumin free space is dominated by the Stokeslet contribution.13,40
However, when the flow singularities are near a no-slipboundary, their hydrodynamic images also contribute to theflow. Blake and Chwang found that, close to a no-slip bound-ary, two singularities generate flow similarly decaying as V ∝1/r2 in the far field (except in a few special orientations),41
therefore their contributions are equally important.
3.3 Fluid flow generated by a linear array of confined bacteria
Fig. 2 clearly demonstrates that a single confined bacteriumgenerates transport flow. We can use confined bacteria asbasic building blocks to generate designed flow patterns. Forexample, Fig. 3(a) shows a linear structure that positions fivebacteria along the y direction and orients them by a tilt angleα = 40°. As seen in experiments (Fig. 3(b)) and simulations(Fig. 3(e)), the rotating flagella collectively generate a “fluidconveyor”, which has a peak speed of about 20 μm s−1 and awidth of about 5 μm in the x-direction. Such a “fluid con-veyor” can be qualitatively understood as the superpositionof the “L” shaped flow pattern of a single bacterium (cf.Fig. 2(b)). The tracer trajectory in Fig. 3(c) supports the pic-ture of a “fluid conveyor”. As we move away from the cover-slip, the flow decays from 20 μm s−1 to a few μm s−1 at aheight of z = 5 μm, as shown in Fig. 3(f).
The transport efficiency of the “fluid conveyor” cruciallydepends on the tilt angle α. To quantify this effect, we fabri-cate structures that are similar to the one in Fig. 3(a) but withdifferent tilt angles. The fluid flow on the xy plane at z = 2.1μm is measured for each structure. We find that the flow pat-tern remains qualitatively the same (cf. Fig. 3(b)) but the flowstrength and spatial extent change with α. Quantitatively, wemeasure the profile of the y-velocity component, VyIJx), in the
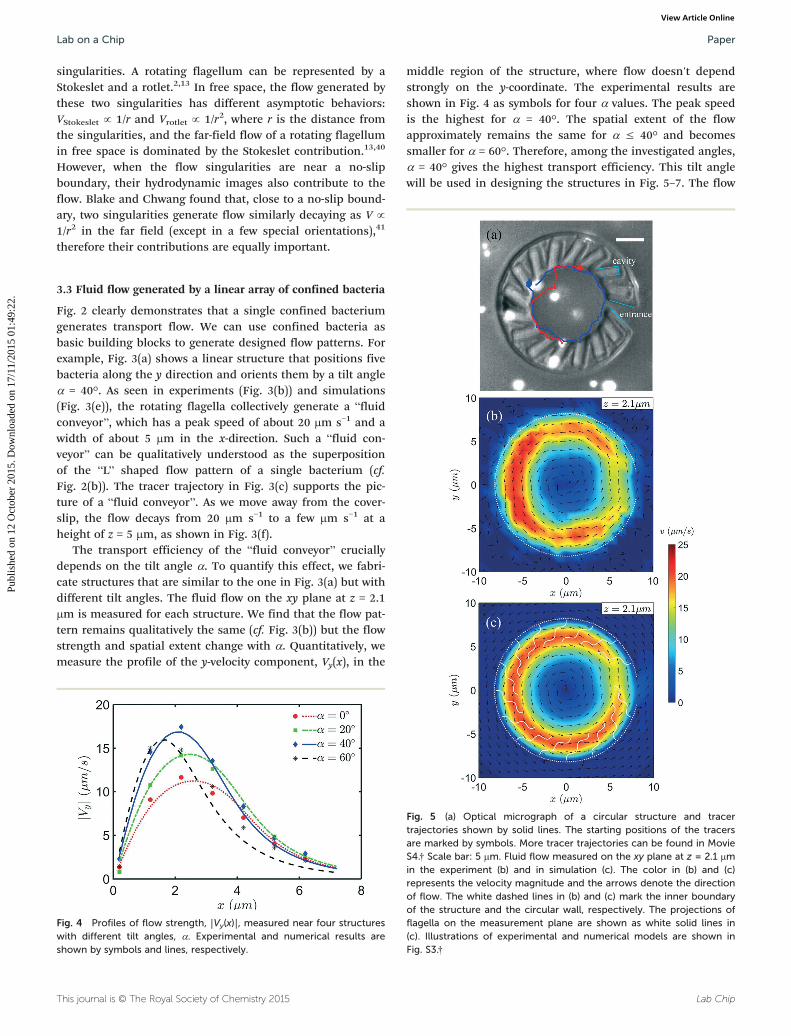
middle region of the structure, where flow doesn't dependstrongly on the y-coordinate. The experimental results areshown in Fig. 4 as symbols for four α values. The peak speedis the highest for α = 40°. The spatial extent of the flowapproximately remains the same for α ≤ 40° and becomessmaller for α = 60°. Therefore, among the investigated angles,α = 40° gives the highest transport efficiency. This tilt anglewill be used in designing the structures in Fig. 5–7. The flow
Fig. 4 Profiles of flow strength, |VyIJx)|, measured near four structureswith different tilt angles, α. Experimental and numerical results areshown by symbols and lines, respectively.
Fig. 5 (a) Optical micrograph of a circular structure and tracertrajectories shown by solid lines. The starting positions of the tracersare marked by symbols. More tracer trajectories can be found in MovieS4.† Scale bar: 5 μm. Fluid flow measured on the xy plane at z = 2.1 μmin the experiment (b) and in simulation (c). The color in (b) and (c)represents the velocity magnitude and the arrows denote the directionof flow. The white dashed lines in (b) and (c) mark the inner boundaryof the structure and the circular wall, respectively. The projections offlagella on the measurement plane are shown as white solid lines in(c). Illustrations of experimental and numerical models are shown inFig. S3.†
profiles obtained from simulations agree with the experimen-tal values in Fig. 4. This shows that our numerical model istrustworthy and that the bacterial flagella bundle can be wellrepresented by a single flagellum in our study.
3.4 Fluid flow generated by a circular array of confinedbacteria
Confined bacteria can be used to generate transport flowwith a complex topology. We arrange 15 cavities around a cir-cle and orient the cavities with a tilt angle α = 40°, withrespect to the local tangent of the circle, as shown in Fig. 5(a)and S3.† After the bacteria fill all cavities, they generate fluidflow in a counter-clockwise direction, as shown by the tracertrajectories in Fig. 5(a) and Movie S4.† The tracers stay in thefocal plane for an extended time; this means that the velocitycomponent in the z direction is small. Quantitative experi-mental and numerical results are shown in Fig. 5(b) and (c),respectively. The flow component parallel to the structuredominates and is responsible for the generation of the circu-lar particle trajectories in Fig. 5(a). The flow strength and
spatial extent are similar to those in the linear case (cf.Fig. 3). The flow is weaker near the entrance at the 3 o'clockposition. The maximal flow speed shown in Fig. 3–5 is about25 μm s−1; this limitation is imposed by the swimming capa-bility of E. coli bacteria. It should be possible to generatefaster flow by using microorganisms with higher swimmingspeeds.10
3.5 Transport of colloidal particles along designedtrajectories
Fig. 4 and 5 show that confined bacteria can generatedirected flow along both linear and curved structures. We testthe robustness of this phenomenon with more structures anduse this phenomenon to transport materials along designedtrajectories. As shown in Fig. 6(a) (Movie S5†), thirty bacteriaare confined in a linear structure and they collectively gener-ate flow that transports silica particles (2 μm in diameter)over 60 μm in 15 seconds. Particle transportation along asquare and a spiral structure is shown in Fig. 6(b) (MovieS6†) and (c) (Movie S7†), respectively.
Our structure-based approach is modular; we can combinedifferent structures to realize complex functions. For exam-ple, confined bacteria can be used to collect particles to adefined location.22 In Fig. 7, we position bacteria to generateflow pointing to a focal point and the flow quickly collectsthe particles to the focus. If we reverse the flow by changingthe cell orientation, we can efficiently disperse materialsfrom a location.
4. Discussion
In our approach, each smooth-swimming bacterium is con-fined in a cavity. This confinement is not permanent butreversible. If a confined bacterium loses motility, it will leavethe cavity through thermal diffusion and a new motile bacte-rium can refill the cavity. This would significantly extend theoperating lifetime and stability of the device. For example,our longest test lasts for four hours and the transport flowremains stable throughout the experiment. In contrast, previ-ous works42,43 permanently attach bacteria to surfaces, there-fore, a non-functioning bacterium cannot be replaced andwill leave a permanent defect in the generated flow pattern.This harms the performance and longevity of the device.Optical tweezers can control bacteria with excellent precisionand flexibility.44–46 However, tweezers can only handle a lim-ited number of cells and it is also hard to completely avoidphoto-damage to bacteria.
Many experiments have been performed on either a singlebacterium12,44,46 or on a collection of many bacteria.47–49
Between these two limits, controlled experimental studies ofa few bacteria are rare.50 Our method can confine multiplebacteria in close proximity and open the door to study thehydrodynamic interactions between their rotating fla-gella.13,46,51 Such experiments may shed light on importantissues, such as hydrodynamic synchronization and formationof bacterial flagella bundles.
Fig. 6 Transport of silica particles (2 μm in diameter) by bacteriaconfined in a linear (a), square (b), and spiral (c) structure. The startingand final positions of the tracers are marked by blue and red symbols,respectively. The capturing cavities are tilted with an angle α = 40°with respect to the local tangent of the structures. Scale bar: 10 μm.
Fig. 7 Targeted transport of silica particles by bacteria confined in 6linear structures. Initially dispersed particles (a) are transported to thecenter region after 13 minutes (b). Scale bar: 10 μm.
In summary, we have used cavities of bacterial size to con-fine smooth-swimming bacteria in prescribed configurations.The rotating flagella of confined bacteria collectively generatetransport flow on the micrometer scale. The generated flowcan be controlled by changing the location and orientation ofthe cavities. Experimental results are reproduced by numeri-cal simulations, demonstrating the reliability of our numeri-cal method. We believe that our approach will be useful bothfor generating new bio-hybrid devices and for studying funda-mental interactions between multiple bacteria.
Acknowledgements
We acknowledge financial support from the NSFC (No.11422427), the Program for Professor of Special Appointmentat Shanghai Institutions of Higher Learning (No.SHDP201301), and the Innovation Program of ShanghaiMunicipal Education Commission (No. 14ZZ030).
References
1 C. Brennen and H. Winet, Annu. Rev. Fluid Mech., 1977, 9,339–398.
2 S. Kim and J. S. Karilla, Microhydrodynamics: Principles andSelected Applications, Butterworth-Heinemann, Boston, MA,1991.
3 E. Lauga and T. R. Powers, Rep. Prog. Phys., 2009, 72,096601.
4 E. M. Purcell, Am. J. Phys., 1977, 45, 3–11.5 T. M. Squires and S. R. Quake, Rev. Mod. Phys., 2005, 77,
977–1026.6 G. M. Whitesides, Nature, 2006, 442, 368–373.7 W. Wang, W. Duan, S. Ahmed, T. E. Mallouk and A. Sen,
Nano Today, 2013, 8, 531–554.8 R. W. Carlsen and M. Sitti, Small, 2014, 10, 3831–3851.9 V. Chan, H. H. Asada and R. Bashir, Lab Chip, 2014, 14,
653–670.10 J. S. Guasto, R. Rusconi and R. Stocker, Annu. Rev. Fluid
Mech., 2012, 44, 373–400.11 H. C. Berg, Phys. Today, 2000, 53, 24–29.12 B. Rodenborn, C. H. Chen, H. L. Swinney, B. Liu and H. P.
Zhang, Proc. Natl. Acad. Sci. U. S. A., 2013, 110, E338–E347.13 N. Watari and R. G. Larson, Biophys. J., 2010, 98, 12–17.14 N. Darnton, L. Turner, K. Breuer and H. C. Berg, Biophys. J.,
2004, 86, 1863–1870.15 S. Martel, C. C. Tremblay, S. Ngakeng and G. Langlois, Appl.
Phys. Lett., 2006, 89, 233904.16 B. Behkam and M. Sitti, Appl. Phys. Lett., 2007, 90, 023902.17 E. Steager, C. B. Kim, J. Patel, S. Bith, C. Naik, L. Reber and
M. J. Kim, Appl. Phys. Lett., 2007, 90, 263901.18 S. J. Park, H. Bae, J. Kim, B. Lim, J. Park and S. Park, Lab
Chip, 2010, 10, 1706–1711.19 R. W. Carlsen, M. R. Edwards, J. Zhuang, C. Pacoret and M.
Sitti, Lab Chip, 2014, 14, 3850–3859.20 R. Di Leonardo, L. Angelani, D. Dell'Arciprete, G. Ruocco, V.
Iebba, S. Schippa, M. P. Conte, F. Mecarini, F. De Angelis
and E. Di Fabrizio, Proc. Natl. Acad. Sci. U. S. A., 2010, 107,9541–9545.
21 A. Sokolov, M. M. Apodaca, B. A. Grzybowski and I. S.Aranson, Proc. Natl. Acad. Sci. U. S. A., 2010, 107, 969–974.
22 N. Koumakis, A. Lepore, C. Maggi and R. Di Leonardo, Nat.Commun., 2013, 4, 2588.
23 A. Kaiser, A. Peshkov, A. Sokolov, B. ten Hagen, H. Lowenand I. S. Aranson, Phys. Rev. Lett., 2014, 112, 158101.
24 M. J. Kim and K. S. Breuer, Small, 2008, 4, 111–118.25 M. J. Kim and K. S. Breuer, Phys. Fluids, 2004, 16, L78–L81.26 N. Uchida and R. Golestanian, Phys. Rev. Lett., 2010, 104,
178103.27 Y. T. Hsiao, J. H. Wang, Y. C. Hsu, C. C. Chiu, C. J. Lo,
C. W. Tsao and W. Y. Woon, Appl. Phys. Lett., 2012, 100,203702.
28 Y. T. Hsiao, J. H. Wang, K. T. Wu, J. J. Tsai, C. H. Chang andW. Y. Woon, Appl. Phys. Lett., 2014, 105, 203702.
29 D. B. Weibel, W. R. DiLuzio and G. M. Whitesides, Nat. Rev.Microbiol., 2007, 5, 209–218.
30 B. Kaehr and J. B. Shear, Lab Chip, 2009, 9, 2632–2637.31 F. J. H. Hol and C. Dekker, Science, 2014, 346, 438–438.32 R. Cortez, L. Fauci and A. Medovikov, Phys. Fluids, 2005, 17,
031504.33 J. Ainley, S. Durkin, R. Embid, P. Boindala and R. Cortez,
J. Comput. Phys., 2008, 227, 4600–4616.34 M. Malinauskas, M. Farsari, A. Piskarskas and S. Juodkazis,
Phys. Rep., 2013, 533, 1–31.35 M. Wu, J. W. Roberts and M. Buckley, Exp. Fluids, 2005, 38,
461–465.36 Y. Hyon, Marcos, T. R. Powers, R. Stocker and H. C. Fu,
J. Fluid Mech., 2012, 705, 58–76.37 E. Lauga, W. R. DiLuzio, G. M. Whitesides and H. A. Stone,
Biophys. J., 2006, 90, 400–412.38 A. P. Berke, L. Turner, H. C. Berg and E. Lauga, Phys. Rev.
Lett., 2008, 101, 038102.39 S. E. Spagnolie and E. Lauga, J. Fluid Mech., 2012, 700,
105–147.40 K. Drescher, J. Dunkel, L. H. Cisneros, S. Ganguly and R. E.
Goldstein, Proc. Natl. Acad. Sci. U. S. A., 2011, 108,10940–10945.
41 J. Blake and A. Chwang, J. Eng. Math., 1974, 8, 23–29.42 J. Kim, Y.-H. Shin, S.-H. Yun, D.-S. Choi, J.-H. Nam, S. R.
Kim, S.-K. Moon, B. H. Chung, J.-H. Lee, J.-H. Kim, K.-Y.Kim, K.-M. Kim and J.-H. Lim, J. Am. Chem. Soc., 2012, 134,16500–16503.
43 M. Woerdemann, F. Horner and C. Denz, Optofluidics,Microfluidics and Nanofluidics, 2014, 2014, 1.
44 S. Chattopadhyay, R. Moldovan, C. Yeung and X. L. Wu,Proc. Natl. Acad. Sci. U. S. A., 2006, 103, 13712–13717.
45 U. Mirsaidov, W. Timp, K. Timp, M. Mir, P. Matsudaira andG. Timp, Phys. Rev. E: Stat., Nonlinear, Soft Matter Phys.,2008, 78, 021910.
46 P. J. Mears, S. Koirala, C. V. Rao, I. Golding and Y. R.Chemla, Elife, 2014, 3, e01916.
47 A. Sokolov, I. S. Aranson, J. O. Kessler and R. E. Goldstein,Phys. Rev. Lett., 2007, 98, 158102.