+ All Categories
Home > Documents > LAb rEpOrT nEuphOnix AE40 LOudSpEAkErS -...

LAb rEpOrT nEuphOnix AE40 LOudSpEAkErS -...

Date post: 10-Apr-2018
Category:
Upload: phamkhue
View: 217 times
Download: 2 times
Share this document with a friend
2
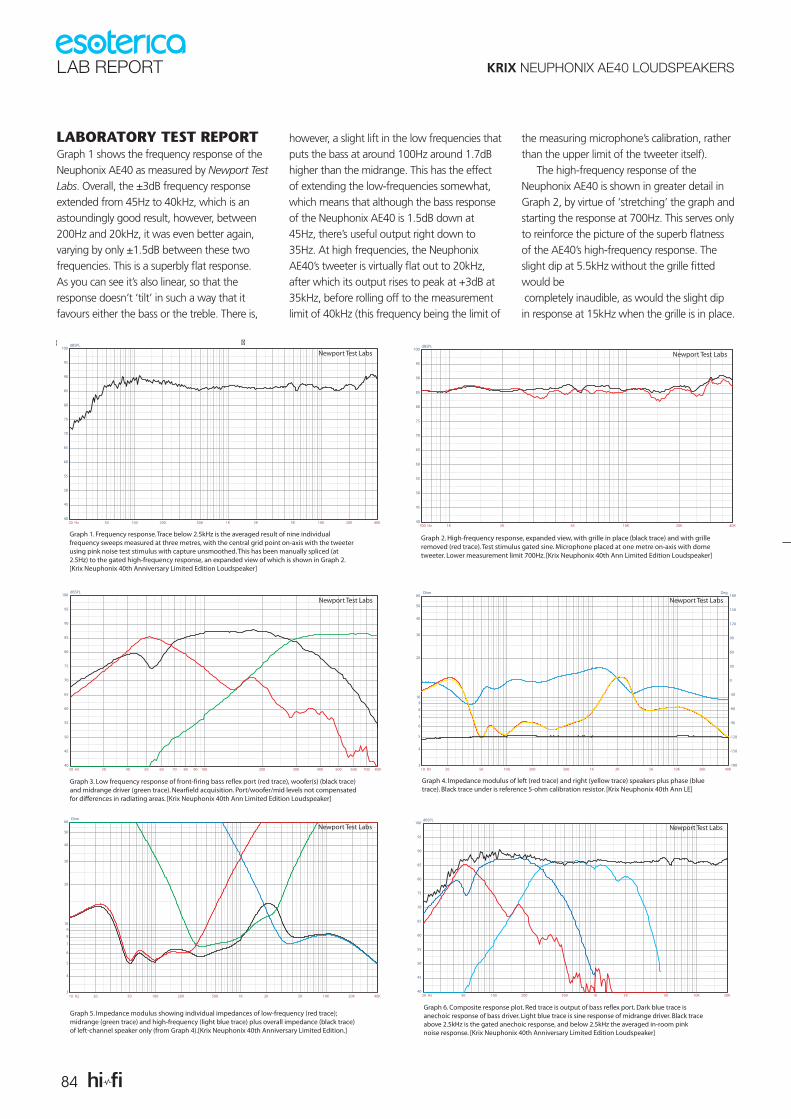
84 LAB REPORT KRIX NEUPHONIX AE40 LOUDSPEAKERS LABORATORY TEST REPORT Graph 1 shows the frequency response of the Neuphonix AE40 as measured by Newport Test Labs. Overall, the ±3dB frequency response extended from 45Hz to 40kHz, which is an astoundingly good result, however, between 200Hz and 20kHz, it was even better again, varying by only ±1.5dB between these two frequencies. This is a superbly flat response. As you can see it’s also linear, so that the response doesn’t ‘tilt’ in such a way that it favours either the bass or the treble. There is, however, a slight lift in the low frequencies that puts the bass at around 100Hz around 1.7dB higher than the midrange. This has the effect of extending the low-frequencies somewhat, which means that although the bass response of the Neuphonix AE40 is 1.5dB down at 45Hz, there’s useful output right down to 35Hz. At high frequencies, the Neuphonix AE40’s tweeter is virtually flat out to 20kHz, after which its output rises to peak at +3dB at 35kHz, before rolling off to the measurement limit of 40kHz (this frequency being the limit of the measuring microphone’s calibration, rather than the upper limit of the tweeter itself). The high-frequency response of the Neuphonix AE40 is shown in greater detail in Graph 2, by virtue of ‘stretching’ the graph and starting the response at 700Hz. This serves only to reinforce the picture of the superb flatness of the AE40’s high-frequency response. The slight dip at 5.5kHz without the grille fitted would be completely inaudible, as would the slight dip in response at 15kHz when the grille is in place. 20 Hz 50 100 200 500 1K 2K 5K 10K 20K dBSPL 40 45 50 55 60 65 70 75 80 85 90 95 100 Newport Test Labs Graph 6. Composite response plot. Red trace is output of bass reflex port. Dark blue trace is anechoic response of bass driver. Light blue trace is sine response of midrange driver. Black trace above 2.5kHz is the gated anechoic response, and below 2.5kHz the averaged in-room pink noise response. [Krix Neuphonix 40th Anniversary Limited Edition Loudspeaker] 10 Hz 20 50 100 200 500 1K 2K 5K 10K 20K 40K Ohm 3 4 5 6 7 8 9 10 20 30 40 50 60 Deg -180 -150 -120 -90 -60 -30 0 30 60 90 120 150 180 Newport Test Labs Graph 4. Impedance modulus of left (red trace) and right (yellow trace) speakers plus phase (blue trace). Black trace under is reference 5-ohm calibration resistor. [Krix Neuphonix 40th Ann LE] 700 Hz 1K 2K 5K 10K 20K 40K dBSPL 40 45 50 55 60 65 70 75 80 85 90 95 100 Newport Test Labs Graph 2. High-frequency response, expanded view, with grille in place (black trace) and with grille removed (red trace). Test stimulus gated sine. Microphone placed at one metre on-axis with dome tweeter. Lower measurement limit 700Hz. [Krix Neuphonix 40th Ann Limited Edition Loudspeaker] 10 Hz 20 50 100 200 500 1K 2K 5K 10K 20K 40K Ohm 3 4 5 6 7 8 9 10 20 30 40 50 60 Graph 5. Impedance modulus showing individual impedances of low-frequency (red trace); midrange (green trace) and high-frequency (light blue trace) plus overall impedance (black trace) of left-channel speaker only (from Graph 4).[Krix Neuphonix 40th Anniversary Limited Edition.] Newport Test Labs 20 Hz 30 40 50 60 70 80 90 100 200 300 400 500 600 700 800 dBSPL 40 45 50 55 60 65 70 75 80 85 90 95 100 Newport Test Labs Graph 3. Low frequency response of front-firing bass reflex port (red trace), woofer(s) (black trace) and midrange driver (green trace). Nearfield acquisition. Port/woofer/mid levels not compensated for differences in radiating areas. [Krix Neuphonix 40th Ann Limited Edition Loudspeaker] 20 Hz 50 100 200 500 1K 2K 5K 10K 20K 40K dBSPL 40 45 50 55 60 65 70 75 80 85 90 95 100 Newport Test Labs Graph 1. Frequency response. Trace below 2.5kHz is the averaged result of nine individual frequency sweeps measured at three metres, with the central grid point on-axis with the tweeter using pink noise test stimulus with capture unsmoothed. This has been manually spliced (at 2.5Hz) to the gated high-frequency response, an expanded view of which is shown in Graph 2. [Krix Neuphonix 40th Anniversary Limited Edition Loudspeaker]
Transcript

84

LAb rEpOrT krix nEuphOnix AE40 LOudSpEAkErS

LaboraTory TesT reporTGraph 1 shows the frequency response of the Neuphonix AE40 as measured by Newport Test Labs. Overall, the ±3dB frequency response extended from 45Hz to 40kHz, which is an astoundingly good result, however, between 200Hz and 20kHz, it was even better again, varying by only ±1.5dB between these two frequencies. This is a superbly flat response. As you can see it’s also linear, so that the response doesn’t ‘tilt’ in such a way that it favours either the bass or the treble. There is,

however, a slight lift in the low frequencies that puts the bass at around 100Hz around 1.7dB higher than the midrange. This has the effect of extending the low-frequencies somewhat, which means that although the bass response of the Neuphonix AE40 is 1.5dB down at 45Hz, there’s useful output right down to 35Hz. At high frequencies, the Neuphonix AE40’s tweeter is virtually flat out to 20kHz, after which its output rises to peak at +3dB at 35kHz, before rolling off to the measurement limit of 40kHz (this frequency being the limit of

the measuring microphone’s calibration, rather than the upper limit of the tweeter itself).

The high-frequency response of the Neuphonix AE40 is shown in greater detail in Graph 2, by virtue of ‘stretching’ the graph and starting the response at 700Hz. This serves only to reinforce the picture of the superb flatness of the AE40’s high-frequency response. The slight dip at 5.5kHz without the grille fitted would be completely inaudible, as would the slight dip in response at 15kHz when the grille is in place.

20 Hz 50 100 200 500 1K 2K 5K 10K 20K

dBSPL

40

45

50

55

60

65

70

75

80

85

90

95

100Newport Test Labs

Graph 6. Composite response plot. Red trace is output of bass reflex port. Dark blue trace is anechoic response of bass driver. Light blue trace is sine response of midrange driver. Black trace above 2.5kHz is the gated anechoic response, and below 2.5kHz the averaged in-room pink noise response. [Krix Neuphonix 40th Anniversary Limited Edition Loudspeaker]

10 Hz 20 50 100 200 500 1K 2K 5K 10K 20K 40K

Ohm

3

4

5

6

7

8

910

20

30

40

50

60 Deg

-180

-150

-120

-90

-60

-30

0

30

60

90

120

150

180Newport Test Labs

Graph 4. Impedance modulus of left (red trace) and right (yellow trace) speakers plus phase (blue trace). Black trace under is reference 5-ohm calibration resistor. [Krix Neuphonix 40th Ann LE]

700 Hz 1K 2K 5K 10K 20K 40K

dBSPL

40

45

50

55

60

65

70

75

80

85

90

95

100Newport Test Labs

Graph 2. High-frequency response, expanded view, with grille in place (black trace) and with grille removed (red trace). Test stimulus gated sine. Microphone placed at one metre on-axis with dome tweeter. Lower measurement limit 700Hz. [Krix Neuphonix 40th Ann Limited Edition Loudspeaker]

10 Hz 20 50 100 200 500 1K 2K 5K 10K 20K 40K

Ohm

3

4

5

6

7

8

910

20

30

40

50

60

Graph 5. Impedance modulus showing individual impedances of low-frequency (red trace); midrange (green trace) and high-frequency (light blue trace) plus overall impedance (black trace) of left-channel speaker only (from Graph 4).[Krix Neuphonix 40th Anniversary Limited Edition.]

Newport Test Labs

20 Hz 30 40 50 60 70 80 90 100 200 300 400 500 600 700 800

dBSPL

40

45

50

55

60

65

70

75

80

85

90

95

100

Newport Test Labs

Graph 3. Low frequency response of front-firing bass reflex port (red trace), woofer(s) (black trace) and midrange driver (green trace). Nearfield acquisition. Port/woofer/mid levels not compensated for differences in radiating areas. [Krix Neuphonix 40th Ann Limited Edition Loudspeaker]

20 Hz 50 100 200 500 1K 2K 5K 10K 20K 40K

dBSPL

40

45

50

55

60

65

70

75

80

85

90

95

100Newport Test Labs

Graph 1. Frequency response. Trace below 2.5kHz is the averaged result of nine individual frequency sweeps measured at three metres, with the central grid point on-axis with the tweeter using pink noise test stimulus with capture unsmoothed. This has been manually spliced (at 2.5Hz) to the gated high-frequency response, an expanded view of which is shown in Graph 2. [Krix Neuphonix 40th Anniversary Limited Edition Loudspeaker]

LAb rEpOrTkrix nEuphOnix AE40 LOudSpEAkErS

As noted underneath the graph, the two traces show the response with the grille in place (red trace) and without it (black trace). There’s no doubt that the Neuphonix AE40’s response is considerably more linear without the grille. At-taching it introduces an overall average reduc-tion in high-frequency output of around 1.5dB between 3kHz and 10kHz and more small suck-outs. I don’t think any of these would be audible, even in a direct A–B comparison, but it you want to be assured of the most accurate response, my advice would be to remove the grilles for serious listening and replace them when the speakers are either being used for casual listening, or not being used at all.

Bass response, measured with a near-field technique that mirrors what would be measured in an anechoic chamber, shows that the port’s output has been deliberately tuned slightly low, to enhance the deep bass, and that the bass drivers’ response is very linear, rolling off only below 70Hz. The midrange driver (green trace) is rolled on at 18dB/octave for what appears to be an acoustic crossover at around 300Hz.

The port’s high-frequency output is well-controlled, with no high-frequency output, be-cause the midrange is in a separate enclosure. There is some unwanted output at around 170Hz, but since the port is backwards-facing, it would not be audible.

Graph 4 shows one reason for the linear-ity of the Krix Neuphonix AE40’s frequency response, because it would appear that there’s quite a bit of level compensation going on in the crossover, presumably to keep the four bass drivers under control, as well as to tame the inherent high-frequency resonance peak of the Scan-Speak tweeter. The result is an imped-ance modulus that drops to 5Ω at around 50Hz and 100Hz but otherwise hovers mostly between around 6–16Ω. The phase angle is extremely well-controlled within an envelope of around ±30°. The left/right speaker matching (indicated by how closely the red and yellow traces overlay each other) is outstandingly good, which is indicative both of driver quality and overall manufacturing QC processes. I’d put the ‘nominal’ impedance of the Neuphonix AE40 at a very amplifier-friendly 6Ω.

I do note, however, that the impedance drops from 8Ω at 15kHz linearly until it’s 5Ω at 40kHz. All things being equal I would have preferred the impedance to be rising above 15kHz.

Graph 5 shows the electrical crossover points of the Neuphonix AE40 occur at 300Hz and 2.2kHz, though because of differing driver sensitivities, the acoustic crossover points are slightly different. You can see from the overall impedance trace that there are no cabinet reso-nances, which is an excellent result.

Newport Test Labs measured the sensitivity of the Neuphonix AE40 as being 87dBSPL at a distance of one metre, using NTL’s standard very stringent test methodology, meaning that the speaker is of average sensitivity, so you won’t need a mega-powerful amplifier. However, to extract the best performance, I’d recommend using an amplifier rated as being able to deliver at least 80-watts per channel into 8Ω.

Excellent design work from the engineers at Krix: the company certainly isn’t resting on its laurels. Steve Holding

85


Recommended