TUNKU ABDUL RAHMAN UNIVERSITY COLLEGE FACULTY OF ENGINEERING AND BUILT ENVIRONMENT DEPARTMENT OF BUILT ENVIRONMENT BUILDING LABORATORY PRACTICAL BTAR2012 STRUCTURAL STUDIES EXPERIMENT 1 : PORTAL FRAME PROGRAMME : BACHELOR OF SCIENCE IN ARCHITECTURE (HONOURS), RAR YEAR 2, SEMESTER 2/2015 STUDENTS NAME : BRIAN WONG SIEW HORNG (15WTR10576) TAN WEI SIANG (14WTR) SAW SINGH JOHN (14WTR) WONG CHI KONG (14WTR) LECTURER-IN-CHARGE : MS NG CHIEW TENG SUBMISSION DATE : 16 TH OCTOBER 2015
Transcript
TUNKU ABDUL RAHMAN UNIVERSITY COLLEGE
FACULTY OF ENGINEERING AND BUILT ENVIRONMENT
DEPARTMENT OF BUILT ENVIRONMENT
BUILDING LABORATORY PRACTICAL
BTAR2012 STRUCTURAL STUDIES
EXPERIMENT 1 : PORTAL FRAME
PROGRAMME : BACHELOR OF SCIENCE IN ARCHITECTURE
(HONOURS), RAR YEAR 2, SEMESTER 2/2015
STUDENTS NAME : BRIAN WONG SIEW HORNG (15WTR10576)
TAN WEI SIANG (14WTR)
SAW SINGH JOHN (14WTR)
WONG CHI KONG (14WTR)
LECTURER-IN-CHARGE : MS NG CHIEW TENG
SUBMISSION DATE : 16TH OCTOBER 2015
1.0 TABLE OF CONTENT
PAGE
1.0 TABLE OF CONTENT 1
2.0 EXPERIMENT REPORT
2.1 TITLE OF LABORATORY EXPERIMENT 2
2.2 OBJECTIVES OF THE EXPERIMENT 2
2.3 EQUIPMENTS AND MATERIALS 2-3
2.5 EXPERIMENT PROCEDURE 3-4
2.6 DATA COLLECTION 5
2.7 STUDENT NAME: BRIAN WONG SIEW HORNG
2.71 BACKGROUND INFORMATION
2.72 RESULTS AND CALCULATIONS
2.73 DISCUSSION
2.74 CONCLUSION
2.75 BIBLIOGRAPH/REFERENCES
2.8 STUDENT NAME: TAN WEI SIANG
2.81 BACKGROUND INFORMATION
2.82 RESULTS AND CALCULATIONS
2.83 DISCUSSION
2.84 CONCLUSION
2.85 BIBLIOGRAPH/REFERENCES
2.9 STUDENT NAME: SAW SINGH JOHN
2.91 BACKGROUND INFORMATION
2.92 RESULTS AND CALCULATIONS
2.93 DISCUSSION
2.94 CONCLUSION
2.95 BIBLIOGRAPH/REFERENCES
2.10 STUDENT NAME: WONG CHI KONG
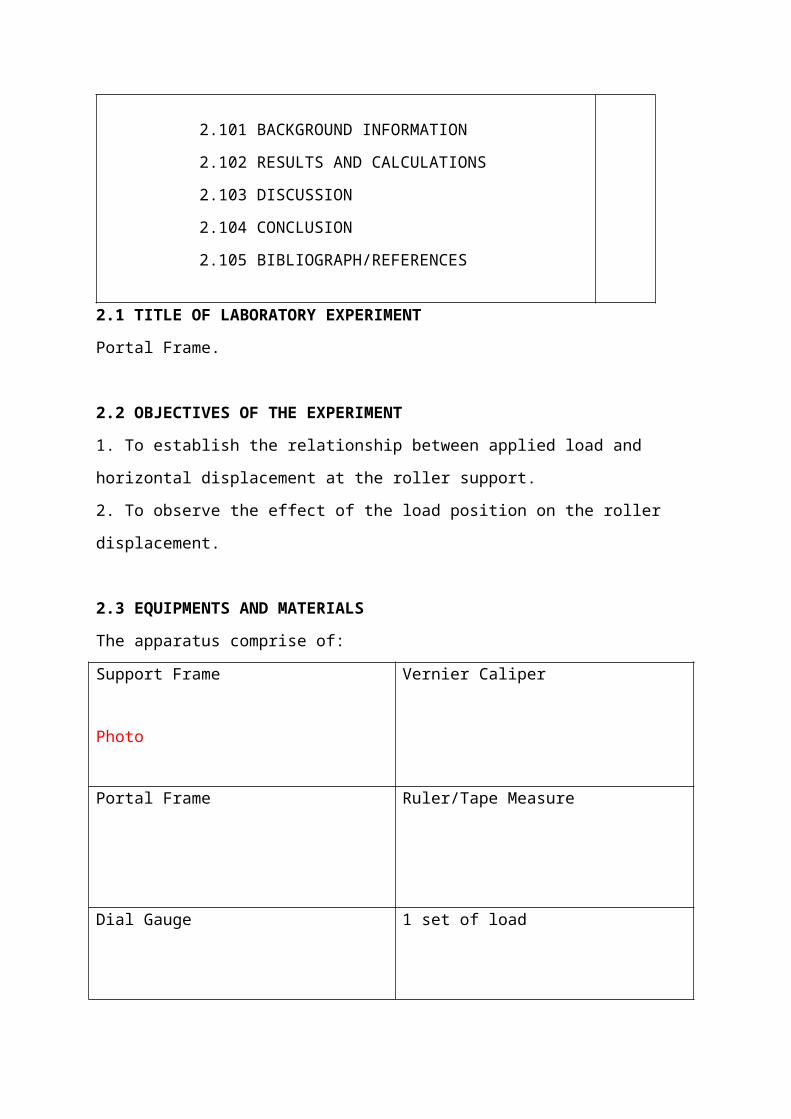
2.101 BACKGROUND INFORMATION
2.102 RESULTS AND CALCULATIONS
2.103 DISCUSSION
2.104 CONCLUSION
2.105 BIBLIOGRAPH/REFERENCES
6-7
8-9
10-11
12-13
14-18
2.1 TITLE OF LABORATORY EXPERIMENT
Portal Frame.
2.2 OBJECTIVES OF THE EXPERIMENT
1. To establish the relationship between applied load and horizontal displacement at the roller
support.
2. To observe the effect of the load position on the roller displacement.
2.3 EQUIPMENTS AND MATERIALS
The apparatus comprise of:
Support Frame
Photo
Vernier Caliper
Portal Frame Ruler/Tape Measure
Dial Gauge 1 set of load
Theory:
The equations for the horizontal displacement at the roller support of a portal frame with one
pinned support and one roller support are given below:
SCAN Brief
2.5 EXPERIMENT PROCEDURE
1. Remove the pinned attached to the load cell so that the roller is free to move.
2. Place a load hanger at the location where the load is to be applied, i.e. distance ‘a’ which is
equal to half of length L3.
3. Set the dial gauge reading to zero.
4. Place a load on the load hanger (10N).
5. Record the dial gauge reading. This represents the horizontal displacement at the roller
support.
6. Increase the load on the load hanger and record the dial gauge reading.
7. Repeat step 6 for another 4 equal load increments of 10N up to a maximum total load of
50N on the load hanger.
8. Tabulate your results.
9. Repeat the above procedure from step 1 to 8 for the value of ‘a’ equals 100mm and
300mm.
2.6 DATA COLLECTION
Height of the portal frame, L1 = 600mm
Width of portal frame, L3 = 400mm
Width of member = mm
Thickness of member = mm
Second moment of area, I = mm
Dial gauge reading 1 division = mm
Material for the portal frame = Steel
Table 1
Applied Load (N) Division, a (mm)Roller Displacement (mm)
Experimental Theoretical
10 100 29
20 100 51
30 100 92
40 100 121
50 100 181
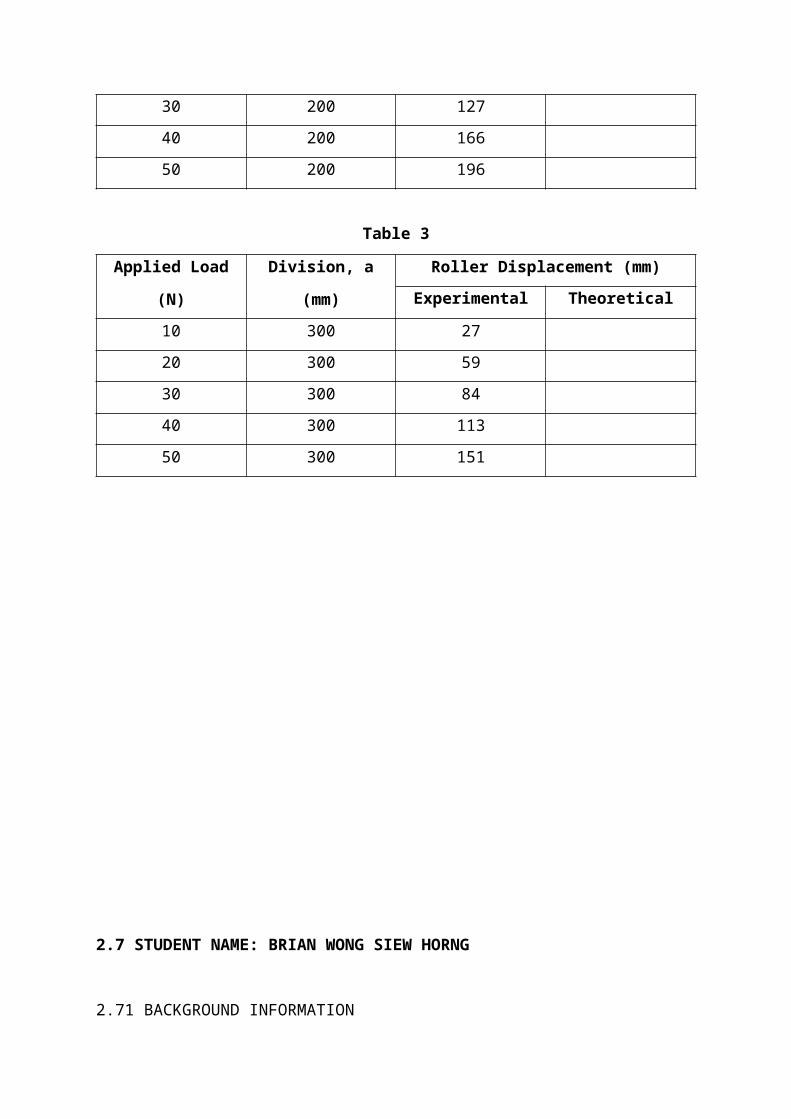
Table 2
Applied Load (N) Division, a (mm)Roller Displacement (mm)
Experimental Theoretical
10 200 32
20 200 77
30 200 127
40 200 166
50 200 196
Table 3
Applied Load (N) Division, a (mm)Roller Displacement (mm)
Experimental Theoretical
10 300 27
20 300 59
30 300 84
40 300 113
50 300 151
2.7 STUDENT NAME: BRIAN WONG SIEW HORNG
2.71 BACKGROUND INFORMATION
2.72 RESULTS AND CALCULATIONS
1. Draw the shape of the portal frame under test and give the important dimensions.
Indicate the position where the frame is loaded.
2. Calculate the stiffness (i.e. the load per unit deflection, W / δ) of the frame at the
point of loading.
3. Using the data in the Table above, draw the graph of load verses displacement at
the roller support. Draw the best fit curve through the plotted points.
4. From the graph determine the stiffness of the frame at the point of loading.
5. Plot the graph of load position against displacement.
2.73 DISCUSSION
1. Describe briefly the effect of load position on the roller displacement.
2. Comment on the accuracy of the experimental results.
3. List the probable factors that affect the accuracy of the results and steps to be
taken to overcome it.
2.74 ONCLUSION
1. From the result of this experiment, deduce the relationship between load and
displacement at the roller.
2.75 BIBLIOGRAPH/REFERENCES
2.8 STUDENT NAME: TAN WEI SIANG
2.81 BACKGROUND INFORMATION
2.82 RESULTS AND CALCULATIONS
1. Draw the shape of the portal frame under test and give the important dimensions.
Indicate the position where the frame is loaded.
2. Calculate the stiffness (i.e. the load per unit deflection, W / δ) of the frame at the
point of loading.
3. Using the data in the Table above, draw the graph of load verses displacement at
the roller support. Draw the best fit curve through the plotted points.
4. From the graph determine the stiffness of the frame at the point of loading.
5. Plot the graph of load position against displacement.
2.83 DISCUSSION
1. Describe briefly the effect of load position on the roller displacement.
2. Comment on the accuracy of the experimental results.
3. List the probable factors that affect the accuracy of the results and steps to be
taken to overcome it.
2.84 CONCLUSION
1. From the result of this experiment, deduce the relationship between load and
displacement at the roller.
2.85 BIBLIOGRAPH/REFERENCES
2.9 STUDENT NAME: SAW SINGH JOHN
2.91 BACKGROUND INFORMATION
2.92 RESULTS AND CALCULATIONS
1. Draw the shape of the portal frame under test and give the important dimensions.
Indicate the position where the frame is loaded.
2. Calculate the stiffness (i.e. the load per unit deflection, W / δ) of the frame at the
point of loading.
3. Using the data in the Table above, draw the graph of load verses displacement at
the roller support. Draw the best fit curve through the plotted points.
4. From the graph determine the stiffness of the frame at the point of loading.
5. Plot the graph of load position against displacement.
2.93 DISCUSSION
1. Describe briefly the effect of load position on the roller displacement.
2. Comment on the accuracy of the experimental results.
3. List the probable factors that affect the accuracy of the results and steps to be
taken to overcome it.
2.94 CONCLUSION
1. From the result of this experiment, deduce the relationship between load and
displacement at the roller.
2.95 BIBLIOGRAPH/REFERENCES
2.10 STUDENT NAME: WONG CHI KONG
2.101 BACKGROUND INFORMATION
2.102 RESULTS AND CALCULATIONS
1. Draw the shape of the portal frame under test and give the important dimensions.
Indicate the position where the frame is loaded.
2. Calculate the stiffness (i.e. the load per unit deflection, W / δ) of the frame at the
point of loading.
3. Using the data in the Table above, draw the graph of load verses displacement at
the roller support. Draw the best fit curve through the plotted points.
4. From the graph determine the stiffness of the frame at the point of loading.
5. Plot the graph of load position against displacement.
2.103 DISCUSSION
1. Describe briefly the effect of load position on the roller displacement.
2. Comment on the accuracy of the experimental results.
3. List the probable factors that affect the accuracy of the results and steps to be
taken to overcome it.
2.104 CONCLUSION
1. From the result of this experiment, deduce the relationship between load and