14
LAB409 Experiment#1 Construction of Bacterial Growth Curve 08.10.2009
| Date post: | 31-Dec-2015 |
| Category: |
Documents |
| Upload: | ella-mccormick |
| View: | 219 times |
| Download: | 2 times |

LAB409Experiment#1
Construction of
Bacterial Growth Curve
08.10.2009

Bacterial Structure
2-6 uM
Genus: Escherichia Species: coli
Strain: DH5a or BL21 E. coli DH5a / BL21
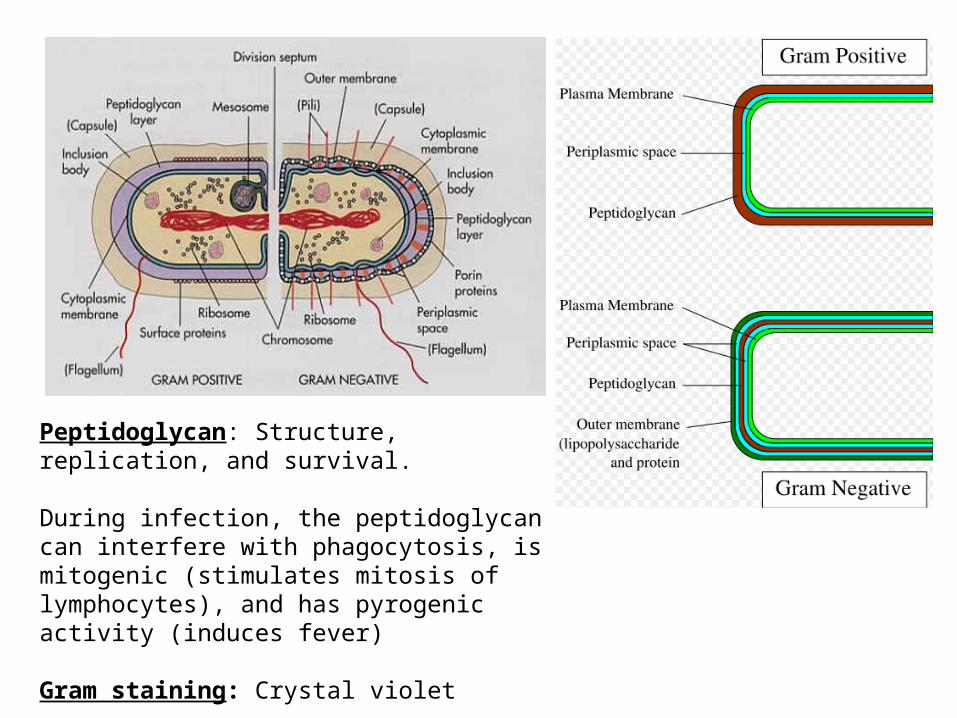
Peptidoglycan: Structure, replication, and survival.
During infection, the peptidoglycan can interfere with phagocytosis, is mitogenic (stimulates mitosis of lymphocytes), and has pyrogenic activity (induces fever)
Gram staining: Crystal violet

• Bacteria grow to a fixed size and then reproduce through binary fission, a form of asexual reproduction.
• Under optimal conditions, in a closed system, bacteria can grow and divide extremely rapidly, and bacterial populations can double as quickly as every 15-60 minutes.
• When the culture medium is depleted of nutrients and metabolic wastes are not removed, the growth stops.
Bacterial Growth

Closed System
The cultures so far discussed for growth of bacterial populations are called batch cultures. Since the nutrients are not renewed, exponential growth is limited to a few generations.
Open System (Continuous Culture - Chemostat)
Bacterial cultures can be maintained in a state of exponential growth over long periods of time using a system of continuous culture
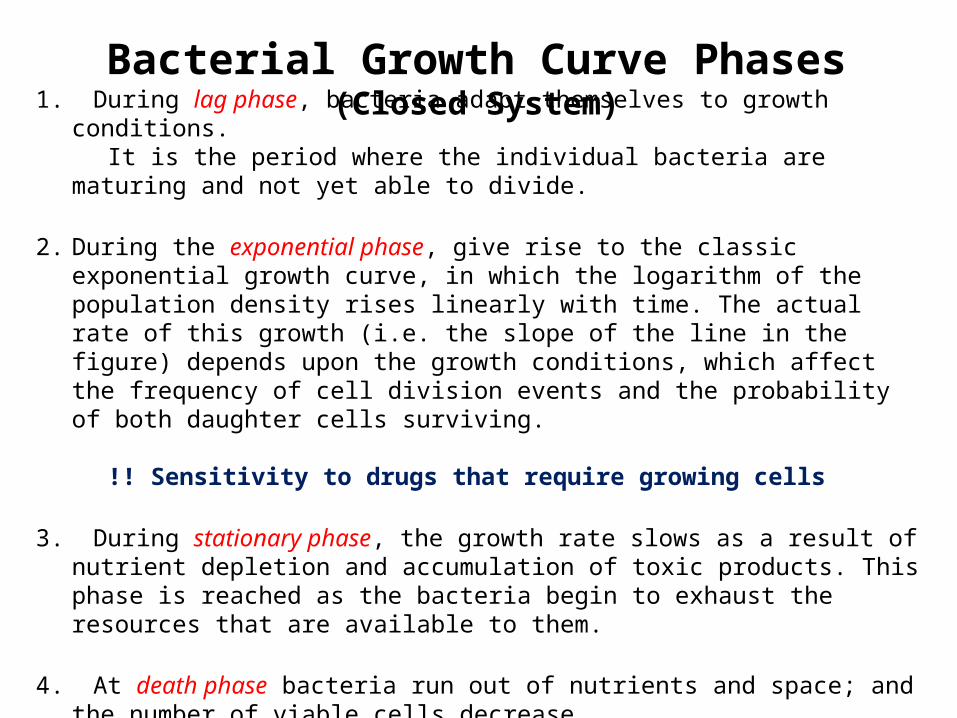
1. During lag phase, bacteria adapt themselves to growth conditions. It is the period where the individual bacteria are maturing and not yet able to
divide.
2. During the exponential phase, give rise to the classic exponential growth curve, in which the logarithm of the population density rises linearly with time. The actual rate of this growth (i.e. the slope of the line in the figure) depends upon the growth conditions, which affect the frequency of cell division events and the probability of both daughter cells surviving.
!! Sensitivity to drugs that require growing cells
3. During stationary phase, the growth rate slows as a result of nutrient depletion and accumulation of toxic products. This phase is reached as the bacteria begin to exhaust the resources that are available to them.
4. At death phase bacteria run out of nutrients and space; and the number of viable cells decrease.
Bacterial Growth Curve Phases(Closed System)

Three properties of bacterial cell culture
1. Phase of growth2. Growth rate (generation time)3.Cell concentration
Standart Curve!

Calculation of Generation Time
If we start with one cell, when it divides, there are 2 cells in the first generation, 4 cells in the second generation, 8 cells in the third generation, and so on. (2n)
The generation time is the time interval required for the cells (or population) to divide. (double in number)
Methods for Measurement of Bacterial Growth
A. Methods for Measurement of the Cell Mass
1. Direct physical measurement of dry weight, wet weight, or volume of cells after centrifugation.
2. Direct chemical measurement of some chemical component of the cells such as total N, total protein, or total DNA content.
3. Indirect measurement of chemical activity such as rate of O2 production or consumption, CO2 production or consumption.
4. Turbidity measurements employ a variety of instruments to determine the amount of light scattered by a suspension of cells. Particulate objects such as bacteria scatter light in proportion to their numbers. The turbidity or optical density of a suspension of cells is directly related to cell mass or cell number, after construction and calibration of a standard curve. The method is simple and nondestructive, but the sensitivity is limited to about 107 cells per ml for most bacteria.

< 107 cells/ml No turbidity
~ 107-108 cells/ml Slight turbidity
~ 108-109 cells/ml High turbidity
> 109 cells/ml Very high turbidity
OD600 Correct up to value 2,00

B. Methods for Measurement of Cell Numbers
Measuring techniques involve direct counts, visually or instrumentally, and indirect viable cell counts.
1. Direct microscopic counts are possible using special slides known as counting chambers. Dead cells cannot be distinguished from living ones. Only dense suspensions can be counted (>107 cells per ml), but samples can be concentrated by centrifugation or filtration to increase sensitivity.
2. Indirect viable cell counts, also called plate counts, involve plating out (spreading) a sample of a culture on a nutrient agar surface.
The sample or cell suspension can be diluted in a nontoxic diluent (e.g. water
or LB) before plating. If plated on a suitable medium, each viable unit grows and forms a colony. Each colony that can be counted is called a colony forming unit (cfu) and the number of cfu's is related to the viable number of bacteria in the sample.

Luria broth (LB) medium (liquid)Bacto-Tryptone
10 gram (g)
Bacto-yeast extract
5 gram (g)
NaCl 10 gram (g)
ddH2O to 1 litre (l)
Note: adjust pH to 7.0 and autoclave to sterilize
Solid Agar LB MediumBacto-Tryptone
10 gram (g)
Bacto-yeast extract
5 gram (g)
NaCl 10 gram (g)
Agar 18 gram (g)
ddH2O to 1 litre (l)
Note: adjust pH to 7.0 and autoclave to sterilize
Bacterial Growth Medium

Prapare the following culture flasks:Bench 1: 96 ml fresh liquid LB + 1/25 o/n E.coli DH5α (4 ml)Bench 2: 96 ml fresh liquid LB + 1/25 o/n E.coli JM109 (4 ml)Bench 3: 96 ml fresh liquid LB + 1/25 o/n E.coli M15 (4 ml)
1. Take 1ml from theflask and put into a plastic cuvette
Measure bacterial turbidity OD600 at 0, 30, 60, 90, 120, 150, 180, 210 min
2. Plating (serial dilutions and spreading on the plate) Plate at 0, 30, 60, 90, 120, 150, 180, 210 min Take 100 ul from the culture and add it to 900 ul LB-broth and continue with necessary dilutions and plating
Graph1: Log10OD600 vs timeGraph2: Log10Viable cell# vs time (or on semilog paper)Graph3: OD600 vs viable cell# (Discuss about the shape of the curve!)
Calculate generation time from Graph2 and check literature for E.coli generation time and discuss the results!
Procedure

Quiz #1
1. Which two ways are we using to measure the bacterial growth?
2. When is liquid, when is solid medium necessary?


