Label free cell-tracking and division detection based on 2D time-lapse images for lineage analysis of early embryo development Marcelo Cicconet a,1 , Michelle Gutwein a , Kristin C. Gunsalus a , Davi Geiger b Q1 Q5 a Center for Genomics and Systems Biology, New York University, United States Q6 b Courant Institute of Mathematical Sciences, New York University, United States article info Article history: Received 15 November 2013 Accepted 15 April 2014 Keywords: Tracking Cell counting Event detection Dynamic programming Time series Embryo development Database abstract In this paper we report a database and a series of techniques related to the problem of tracking cells, and detecting their divisions, in time-lapse movies of mammalian embryos. Our contributions are (1) a method for counting embryos in a well, and cropping each individual embryo across frames, to create individual movies for cell tracking; (2) a semi-automated method for cell tracking that works up to the 8-cell stage, along with a software implementation available to the public (this software was used to build the reported database); (3) an algorithm for automatic tracking up to the 4-cell stage, based on histograms of mirror symmetry coefficients captured using wavelets; (4) a cell-tracking database containing 100 annotated examples of mammalian embryos up to the 8-cell stage; and (5) statistical analysis of various timing distributions obtained from those examples. & 2014 Elsevier Ltd. All rights reserved. 1. Introduction In recent years, a number of studies related to time-lapse imaging of early embryos have been published ([20,12,18,25,19, 16,6,5,24,8]). Q7 For human in vitro fertilized (IVF) embryos, certain measure- ments relating to cell division timing have been shown to correlate with embryonic viability in a clinical setting ([25,16,24,8]). The relevance of cell cycle timing statistics stems from the fact that embryonic development depends on the proper coordination of many cellular events in space and time. In model organisms, the contribution of different genes to early developmental events can be studied by silencing gene activity using RNA interference (RNAi) and analyzing any resulting changes in cellular behavior (including cell cycle timing) in early embryos (e.g. [23]). These applications motivated us to study the problem of cell tracking and division detection in time-lapse images of early mouse embryos. The input is a series of images of a well contain- ing about ten embryos, from the first cell until after the blastocyst cavitation phase. In this paper, we report algorithms aiming to 1. detect, in the first frame, the locations of the embryos, track each embryo for the duration of the movie, and create cropped movies displaying one particular embryo in the center of the frames; and 2. for each embryo, track individual cells, and detect when they divide (up to the 8-cell stage 2 ). It is possible to capture timing information without tracking cells. In [16], for instance, the sum of absolute differences between pixels for consecutive frames is used to detect cell division events. This approach allows the duration of first and second generation cells to be evaluated, under the assumption that all 2nd-generation cells divide before any 3rd-generation cell does. However, evaluating the timing of 3rd generation cells requires knowledge of which 2nd-generation cell was their progenitor. 3 Thus, we are interested in building a lineage tree of cells (Fig. 1), which requires cell tracking in addition to detection of cell division times. As a result, we can measure individual cell duration times as well as gather information about the synchronicity of divisions for cells of the same generation. 1 2 3 4 5 6 7 8 9 10 11 12 13 14 15 16 17 18 19 20 21 22 23 24 25 26 27 28 29 30 31 32 33 34 35 36 37 38 39 40 41 42 43 44 45 46 47 48 49 50 51 52 53 54 55 56 57 58 59 60 61 62 63 64 65 66 67 68 69 70 71 72 73 74 75 76 77 78 79 80 81 82 83 84 85 86 87 88 89 90 91 92 93 94 95 96 97 98 99 Contents lists available at ScienceDirect journal homepage: www.elsevier.com/locate/cbm Computers in Biology and Medicine http://dx.doi.org/10.1016/j.compbiomed.2014.04.011 0010-4825/& 2014 Elsevier Ltd. All rights reserved. E-mail address: [email protected](M. Cicconet). 1 Tel.: þ1 212 992 6964. 2 Here, “stage” refers to the number of cells in an embryo at a given time. For instance, an embryo at the 4-cell stage contains precisely four cells. On the other hand, “generation” refers to the depth of a cell in the lineage tree of cells. Thus, a 2nd-generation cell is one of the two daughters produced by the first cell division in the embryo (c00 and c01 in Fig. 1 are 2nd generation cells). 3 Suppose there are four 3rd-generation cells and one of them – let's call it C – divides. To determine the duration of this cell's existence, it is necessary to know when it first appeared, and therefore which 2nd generation cell is the mother of C. This is not possible if the only data available are the timepoints at which divisions occurred in the 2nd generation, because there are two 2nd-generation cells and these may not divide synchronously. Please cite this article as: M. Cicconet, et al., Label free cell-tracking and division detection based on 2D time-lapse images for lineage analysis of early embryo development, Comput. Biol. Med. (2014), http://dx.doi.org/10.1016/j.compbiomed.2014.04.011i Computers in Biology and Medicine ∎ (∎∎∎∎) ∎∎∎–∎∎∎
Transcript
Label free cell-tracking and division detection based on 2D time-lapseimages for lineage analysis of early embryo development
Marcelo Cicconet a,1, Michelle Gutwein a, Kristin C. Gunsalus a, Davi Geiger bQ1
Q5 a Center for Genomics and Systems Biology, New York University, United StatesQ6 b Courant Institute of Mathematical Sciences, New York University, United States
a r t i c l e i n f o
Article history:Received 15 November 2013Accepted 15 April 2014
In this paper we report a database and a series of techniques related to the problem of tracking cells, anddetecting their divisions, in time-lapse movies of mammalian embryos. Our contributions are (1) amethod for counting embryos in a well, and cropping each individual embryo across frames, to createindividual movies for cell tracking; (2) a semi-automated method for cell tracking that works up to the8-cell stage, along with a software implementation available to the public (this software was used tobuild the reported database); (3) an algorithm for automatic tracking up to the 4-cell stage, based onhistograms of mirror symmetry coefficients captured using wavelets; (4) a cell-tracking databasecontaining 100 annotated examples of mammalian embryos up to the 8-cell stage; and (5) statisticalanalysis of various timing distributions obtained from those examples.
& 2014 Elsevier Ltd. All rights reserved.
1. Introduction
In recent years, a number of studies related to time-lapseimaging of early embryos have been published ([20,12,18,25,19,16,6,5,24,8]).Q7
For human in vitro fertilized (IVF) embryos, certain measure-ments relating to cell division timing have been shown to correlatewith embryonic viability in a clinical setting ([25,16,24,8]). Therelevance of cell cycle timing statistics stems from the fact thatembryonic development depends on the proper coordination ofmany cellular events in space and time. In model organisms, thecontribution of different genes to early developmental events canbe studied by silencing gene activity using RNA interference(RNAi) and analyzing any resulting changes in cellular behavior(including cell cycle timing) in early embryos (e.g. [23]).
These applications motivated us to study the problem of celltracking and division detection in time-lapse images of earlymouse embryos. The input is a series of images of a well contain-ing about ten embryos, from the first cell until after the blastocystcavitation phase. In this paper, we report algorithms aiming to
1. detect, in the first frame, the locations of the embryos, trackeach embryo for the duration of the movie, and create cropped
movies displaying one particular embryo in the center of theframes; and
2. for each embryo, track individual cells, and detect when theydivide (up to the 8-cell stage2).
It is possible to capture timing informationwithout tracking cells.In [16], for instance, the sum of absolute differences between pixelsfor consecutive frames is used to detect cell division events. Thisapproach allows the duration of first and second generation cells tobe evaluated, under the assumption that all 2nd-generation cellsdivide before any 3rd-generation cell does. However, evaluatingthe timing of 3rd generation cells requires knowledge of which2nd-generation cell was their progenitor.3 Thus, we are interested inbuilding a lineage tree of cells (Fig. 1), which requires cell tracking inaddition to detection of cell division times. As a result, we canmeasure individual cell duration times as well as gather informationabout the synchronicity of divisions for cells of the same generation.
2 Here, “stage” refers to the number of cells in an embryo at a given time. Forinstance, an embryo at the 4-cell stage contains precisely four cells. On the otherhand, “generation” refers to the depth of a cell in the lineage tree of cells. Thus, a2nd-generation cell is one of the two daughters produced by the first cell divisionin the embryo (c00 and c01 in Fig. 1 are 2nd generation cells).
3 Suppose there are four 3rd-generation cells and one of them – let's call it C –
divides. To determine the duration of this cell's existence, it is necessary to knowwhen it first appeared, and therefore which 2nd generation cell is the mother of C.This is not possible if the only data available are the timepoints at which divisionsoccurred in the 2nd generation, because there are two 2nd-generation cells andthese may not divide synchronously.
Please cite this article as: M. Cicconet, et al., Label free cell-tracking and division detection based on 2D time-lapse images for lineageanalysis of early embryo development, Comput. Biol. Med. (2014), http://dx.doi.org/10.1016/j.compbiomed.2014.04.011i
Computers in Biology and Medicine ∎ (∎∎∎∎) ∎∎∎–∎∎∎
In this spirit, our approach resembles more that of [25], in whichcell tracking is considered. Our method differs in two main direc-tions. First, we do not use a brute force approach for the automatedtracker.4 Rather, we analyze cell division based on circularityinformation, using histograms of centers that are captured using abank of Morlet wavelets [3]. Second, our semi-automated trackerworks for one additional generation, allowing timing analysis up tothe 8-cell stage.
Our contributions are
1. a method for counting embryos in a well, and cropping eachindividual embryo across frames, to create individual moviesfor cell tracking – Section 3.1;
2. a semi-automated method for cell tracking that works up to the8-cell stage, along with a software implementation available tothe public – Section 3.2;
3. an algorithm for automatic tracking up to the 4-cell stage,based on histograms of mirror symmetry coefficients capturedusing wavelets – Section 3.3;
4. a cell-tracking database containing 100 annotated examples ofmouse embryos up to the 8-cell stage, to be publicly availablefor other researchers – Section 4;
5. statistical analysis of various timing distributions obtainedfrom those examples – Section 5.
Regarding item 5 above, more specifically we provide (1) sta-tistics of cell duration for 1st-, 2nd- and 3rd-generation cells;(2) statistics of synchronicity of division for 2nd- and 3rd- genera-tion cells; (3) statistics of cell radii per generation, and totalvolume of the embryo, assuming the cells are spheres of themeasured radii. In summary, our measurements show that formouse embryos, under standard laboratory conditions:
1. 1st-generation cells divide about 1 h:38 min after pronuclearenvelope breakdown5;
2. The duration of 2nd-generation cells is about 19 h:29 min;3. The duration of 3rd-generation cells is about 11 h:26 min;
4. 2nd-generation sibling cells divide about 42 min apart in time,and 3rd-generation siblings about 35 min apart;
5. The radii of 1st-, 2nd-, and 3rd-generation cells are about36:09 μm, 27:41 μm, and 21:14 μm, respectively;
6. There is an apparent reduction in the total volume of cells up tothe 8-cell stage: in the 2nd generation it is 88% that of the 1stgeneration, and total volume is 92% in the 3rd generationrelative to the 2nd generation.
The last observation was surprising, since intuitively weexpected total cell volume to be conserved in each generation.This apparent reduction in volume most likely arises from changesin osmotic balance during cell culture (since cells adjust theirvolume in response to the tonicity of their environment), but couldin part reflect the depletion of stored maternal products, which aremetabolized throughout embryogenesis both to produce energyfor cellular processes (e.g. cell division) and to synthesize newcellular components (e.g. membrane and chromatin).
Although our methods relate to a specific problem in biology,the technique we introduce for event detection in a sequence offrames (Section 3.3) is of general interest in Computer Vision. Thealgorithm consists of monitoring the output of a shape descriptor(in our case, a descriptor of circularity), looking for points inthe time-series where the evidence for the existence of thatshape reduces drastically. This idea can be used in other trackingscenarios to infer time points at which a target object disappearsfrom the field of view. In our case the target object is a cell, but itcould in principle be any shape (e.g., face, car, and hand), as long asits descriptor is relatively invariant between successive frames.6
Furthermore, by making our cell-tracking database available,we not only facilitate reproducibility, but we also contribute toother researchers working on techniques such as tracking andshape analysis. We are already using the database ourselves to testnovel methods in basic Computer Vision problems such as circleand ellipse detection [7].
1.1. On related research
While the literature on cell tracking for mammalian embryos isrelatively small, a large body of publications is available for celltracking in general, dealing with model organisms such as zebra-fish, Drosophila, and C. elegans (e.g., [1,11,15,4,17,2,13]).
Many of these techniques require “labeling” cells (that is,marking them with dyes or fluorophores) and/or reconstructing3D geometry using stacks of images in different focal planes(z-stacks). The methods discussed in this paper are “label-free”and are designed for images that are grayscale and bi-dimensional.
In terms of algorithms, the main difference between this paperand our previous work [6] is in how we handle cell division.Previously, we looked at pixel variances at the image and celllevels, and we computed likelihoods of cell presence from theaccumulator space of a wavelet-based circular Hough transform[6]. In Section 3.2 we report a strategy in which human interactiondetermines the frames of cell division with 100 percent accuracy.In Section 3.3 we introduce an improved automatic method fordivision detection, based on mirror symmetry between pairs ofpixels with tangents.
Technically, the methods of this paper aim at the same problemand similar input data as discussed in [25,16]. [25] also performcell tracking by looking at cell boundaries, but use particle filters
Fig. 1. Our main goal is to capture spatio-temporal information related to thelineage tree of each embryo, rather than just the times when a cell division eventoccurs. This allows gathering statistics of cell duration for different generations ofcells, as well as measuring synchronicity of cell divisions for cells that are “siblings.”
4 The method in [25] is a particle filter, which can be considered “brute force”since at every time point all local parameter variations are treated as validpossibilities and are compared to the input data for validation. Their model alsoincorporates the testing of the cell-division hypothesis for every cell in every frame.
5 Upon fertilization, the maternal and paternal chromosomes are contained inseparate pronuclear compartments surrounded by membranes, which must bedisassembled prior to the first mitotic division in the zygote to enable mixing oftheir genetic material during all subsequent divisions in the developing embryo.
6 Many event detection techniques in Computer Vision fall in the class ofbackground subtraction algorithms ([21]), which are not usually designed to workat the local level of individual objects. To the best of our knowledge, our method forevent detection at the level of a moving object is novel, but we do not discuss eventdetection in detail here, as the focus of the paper is on the Biology application.
M. Cicconet et al. / Computers in Biology and Medicine ∎ (∎∎∎∎) ∎∎∎–∎∎∎2
Please cite this article as: M. Cicconet, et al., Label free cell-tracking and division detection based on 2D time-lapse images for lineageanalysis of early embryo development, Comput. Biol. Med. (2014), http://dx.doi.org/10.1016/j.compbiomed.2014.04.011i
and model cells as ellipses, whereas we use Dynamic Program-ming and model cells as circles. Also, in [25] division detection isembodied in the particle filter, instead of being an independentmodule. [16] do not perform cell tracking, and division detectionhappens globally (by looking at the entire frame), not at theindividual level of the cells.
2. Materials and methods
Mouse embryos were collected from 4 to 6 week old super-ovulated CB6F1 female mice (BALB/c x C57BL/6; Charles River,Wilmington, MA). For RNAi, zygotes at the pronuclear stage (i.e.prior to fusion of the paternal and maternal genetic material inthe first cell cycle) were injected with 400–700 bp long double-stranded RNA corresponding to target gene sequences. Control(untreated or mock-injected) and RNAi-treated zygotes werecultured in a constant environment of 37 1C, 5% CO2, and 95%humidity for up to 120 h (5 days), during which time images werecaptured every 420 s (at 7 min intervals). Under these conditions,control embryos consistently achieved 495% development to theblastocyst stage.
Time-lapse recordings were collected using an Eclipse TIinverted microscope (Nikon Instruments, Inc., NY) with Hoffmanmodulation optics, a heated stage-top incubator (Tokai Hit Co.,Ltd., Japan) with an independent air circulation and heating Air-Therm ATX system (WPI, Inc., FL) mounted on an XYZ motorizedstage (Nikon), and NIS Elements imaging software (Nikon) runningon a Dell Precision Workstation T7400.
3. Computational analysis
3.1. Cropping
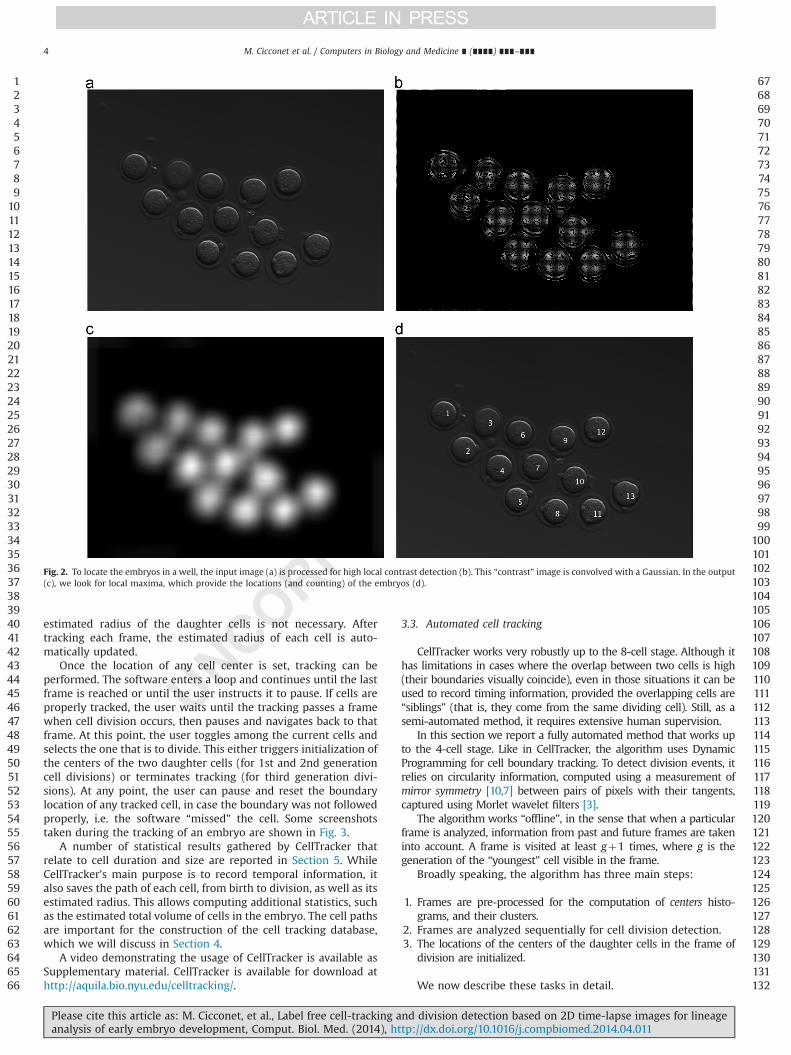
The input images, of size 2784 by 2080 pixels, are as shown inFig. 2(a). As we want to analyze each embryo individually, a croppingstep is necessary. The first phase of processing consists of automati-cally locating the centers of the embryos in the first frame of the time-lapse sequence. This is sometimes referred to as a “segmentation”problem in the literature. There are many possible solution techniquesfor segmenting a circular shape (every embryo is a singular, nearlycircular cell, in the first frame), based on level sets ([14]), sliding-bandfilters ([22]), Hough transforms ([6]), mirror symmetry coefficients([7]), and a number of other methods. Since wewant not only to locateembryos in the first frame, but also to track them (that is, their cells asa whole) for the (almost) entire video, we opted for a method basedon texture rather than shape.
There are three steps. First we generate a “texture” image,which we shall call K (Fig. 2 (b)), of the same size as the inputimage I. The value Ki;j in each pixel of location (i,j) in K is definedby looking at a neighborhood 2�2 of (i,j) (which we call Wi;j). Inthe second step, we convolve K with a Gaussian, producing K ,which highlights clusters of areas of high contrast in K (Fig. 2 (c)).Finally, we search for local maxima in K , which correspond to thecenters of cells. Details are as follows.
Let I be an input image. We first reduce the size of I (by resizingthe edges to a quarter of the originals). We then process I for localcontrast enhancement with adaptive histogram equalization, pro-ducing I , of size m rows by n columns. Let J, of size m� n, bedefined as
J2ði�1Þþ1;2ðj�1Þþ1 ¼max Wi;j�min Wi;j
for i¼ 1;…;m=2, j¼ 1;…;n=2, and J: ¼ 0 otherwise, where
Wi;j ¼ I2ði�1Þþ1⋯2ði�1Þþ2;2ðj�1Þþ1⋯2ðj�1Þþ2
are 2�2 block matrices.7 Define Km�n, such that
Ki;j ¼ 1 if Ji;j4 110maxJ;
Ki;j ¼ 0 otherwise;
for i¼ 1;…;m, j¼ 1;…;n.K indicates pixels where the contrast in I is high (an example
is shown in Fig. 2(b)). Convolving K with a Gaussian filter (ofstandard deviation s¼ 20), we obtain K – as seen in Fig. 2(c) – inwhich the local maxima are located approximately around thecenters of the embryo cells. Finding these allows counting andlabeling of the embryos (Fig. 2(d)).
Afterwards, each embryo is tracked along the remainingframes. Supposing K t is the matrix K as defined above for framet, the location of an embryo at frame t is determined by looking fora local maximum in K t nearby its location in frame t�1. Anindividualized movie of each embryo is then generated by crop-ping a region of interest around the tracked path for it, in theimages of full resolution (as in I defined above).
The size of each cropped embryo frame is about 480 by 480pixels, and the first cells have radii of approximately 110 pixels.Some examples are shown in the screenshots of Fig. 3.
3.2. Semi-automated cell tracking
There are two main challenges in studying the developmentaltrajectory of early embryos: (1) tracking cells and (2) detecting thetimes of division for individual cells. Both problems increase incomplexity as time advances and the number of cells increases,but the second problem is significantly more difficult (in partbecause it requires the solution of the first). Any method thatdetects divisions independent of tracking would not permit dis-covering which cell is dividing, and therefore would not allowbuilding the timing-tree of Fig. 1 beyond the 4-cell stage.
We developed a semi-automated method that circumvents theproblem of division detection by handing it to the user, while thesystem performs only cell tracking. The user can also correct thetrajectory of a particular cell when the tracking algorithm missesit. The software, called CellTracker, allows the “scoring” of anembryo in about 2 min for a trained user. An average embryo'svideo contains about 350 frames. Some screenshots are shown inFig. 3. Fig. 4 provides a larger version for GUI readability.
Before getting into the user–interaction aspects of the tool, webriefly describe how cell tracking is performed.
The idea is to track the boundary of the cell, which is nearlycircular, using Dynamic Programming. This approach was intro-duced in [9] and used for cell tracking in our previous work [6].Roughly speaking, a “tubular neighborhood” around the boundaryof the circle estimated to fit the current cell is mapped into arectangle, and the path of minimal cost from left to right in suchrectangle is searched for. Fig. 5 illustrates this.
CellTracker works on folders containing frames in the tiff or pngimage formats. It can track cells up to the third generation and hasbuttons to register the frames when embryo compaction startsand ends, as well as the frame when blastocyst cavitation starts(compaction and cavitation are important events in early embryodevelopment).
In the first frame, the user sets the approximate location of thecenter of the first cell. The software uses fixed parameters forthe estimated radii of cells in the first three generations; thus, forthe initial cell and all subsequent division events, setting the
7 The image J represents the ranges of local contrast in I . Wi;j is theneighborhood where local contrast is computed for pixel (i,j).
M. Cicconet et al. / Computers in Biology and Medicine ∎ (∎∎∎∎) ∎∎∎–∎∎∎ 3
Please cite this article as: M. Cicconet, et al., Label free cell-tracking and division detection based on 2D time-lapse images for lineageanalysis of early embryo development, Comput. Biol. Med. (2014), http://dx.doi.org/10.1016/j.compbiomed.2014.04.011i
estimated radius of the daughter cells is not necessary. Aftertracking each frame, the estimated radius of each cell is auto-matically updated.
Once the location of any cell center is set, tracking can beperformed. The software enters a loop and continues until the lastframe is reached or until the user instructs it to pause. If cells areproperly tracked, the user waits until the tracking passes a framewhen cell division occurs, then pauses and navigates back to thatframe. At this point, the user toggles among the current cells andselects the one that is to divide. This either triggers initialization ofthe centers of the two daughter cells (for 1st and 2nd generationcell divisions) or terminates tracking (for third generation divi-sions). At any point, the user can pause and reset the boundarylocation of any tracked cell, in case the boundary was not followedproperly, i.e. the software “missed” the cell. Some screenshotstaken during the tracking of an embryo are shown in Fig. 3.
A number of statistical results gathered by CellTracker thatrelate to cell duration and size are reported in Section 5. WhileCellTracker's main purpose is to record temporal information, italso saves the path of each cell, from birth to division, as well as itsestimated radius. This allows computing additional statistics, suchas the estimated total volume of cells in the embryo. The cell pathsare important for the construction of the cell tracking database,which we will discuss in Section 4.
A video demonstrating the usage of CellTracker is available asSupplementary material. CellTracker is available for download athttp://aquila.bio.nyu.edu/celltracking/.
3.3. Automated cell tracking
CellTracker works very robustly up to the 8-cell stage. Although ithas limitations in cases where the overlap between two cells is high(their boundaries visually coincide), even in those situations it can beused to record timing information, provided the overlapping cells are“siblings” (that is, they come from the same dividing cell). Still, as asemi-automated method, it requires extensive human supervision.
In this section we report a fully automated method that works upto the 4-cell stage. Like in CellTracker, the algorithm uses DynamicProgramming for cell boundary tracking. To detect division events, itrelies on circularity information, computed using a measurement ofmirror symmetry [10,7] between pairs of pixels with their tangents,captured using Morlet wavelet filters [3].
The algorithm works “offline”, in the sense that when a particularframe is analyzed, information from past and future frames are takeninto account. A frame is visited at least gþ1 times, where g is thegeneration of the “youngest” cell visible in the frame.
Broadly speaking, the algorithm has three main steps:
1. Frames are pre-processed for the computation of centers histo-grams, and their clusters.
2. Frames are analyzed sequentially for cell division detection.3. The locations of the centers of the daughter cells in the frame of
Fig. 2. To locate the embryos in a well, the input image (a) is processed for high local contrast detection (b). This “contrast” image is convolved with a Gaussian. In the output(c), we look for local maxima, which provide the locations (and counting) of the embryos (d).
M. Cicconet et al. / Computers in Biology and Medicine ∎ (∎∎∎∎) ∎∎∎–∎∎∎4
Please cite this article as: M. Cicconet, et al., Label free cell-tracking and division detection based on 2D time-lapse images for lineageanalysis of early embryo development, Comput. Biol. Med. (2014), http://dx.doi.org/10.1016/j.compbiomed.2014.04.011i
3.3.1. Centers histogramWe model cells as nearly circular shapes. This provides a simpler
implementation in comparison to more accurate models – wherecells are ellipsoids, for instance. Still, our method is robust todeviations from circularity.
Our division detection algorithm and the initial locations of thedaughter cells – in the frame right after a division is detected – arebased on what we call the centers histogram.
Let Im�n be an image (corresponding to a particular frame of thecropped embryo), and J its gradient:
Jði; jÞ ¼ ‖∇Iði; jÞ‖; 8 i¼ 1;…;m; j¼ 1;…;n
Using a bank of Morlet wavelet filters, we capture a list of pairs(point,slope) from J, that is, a list of points with associated tangents(modulus π, for we are only interested in the slope, not thedirection). We name this list as
L¼ fðpðtÞ; aðtÞÞ; t ¼ 1;…; Tg; ð1Þ
where, for each t, p(t) is a point of high maximum waveletresponse, and a(t) is the angle of the wavelet of maximumresponse at that point.
For simplicity, let us call every pair ðpðtÞ; aðtÞÞ a rod,8 repre-sented as ρðtÞ. Next, we go over every pair ρðt1Þ;ρðt2Þ in L and testthem for mirror symmetry. The concept of mirror symmetry isdefined with details in [7] – intuitively, two rods ρðt1Þ and ρðt2Þ aremirror symmetric if the “reflection” of ρðt1Þ by a mirror set at thebisector of the line connecting pðt1Þ and pðt2Þ coincides with ρðt2Þ.
Fig. 3. Some screenshots of CellTracker in different phases. (a) Tracking the first cell. (b) Setting the initial points of second generation cells right after the first cell divides.(c) Highlighting which 2nd-generation cell is to divide. (d) Tracking three 3rd-generation cells.
Fig. 4. CellTracker screenshot (larger version of Fig. 3(c)).
8 Thanks, Tom LaGatta, for suggesting the nomenclature.
M. Cicconet et al. / Computers in Biology and Medicine ∎ (∎∎∎∎) ∎∎∎–∎∎∎ 5
Please cite this article as: M. Cicconet, et al., Label free cell-tracking and division detection based on 2D time-lapse images for lineageanalysis of early embryo development, Comput. Biol. Med. (2014), http://dx.doi.org/10.1016/j.compbiomed.2014.04.011i
It turns out that, if two rods ρðt1Þ and ρðt2Þ are mirrorsymmetric, then they uniquely define a circle, with center ct1 ;t2and radius rt1 ;t2 , whose boundary crosses pðt1Þ and pðt2Þ, withtangents parallel to aðt1Þ and aðt2Þ, respectively. Fig. 6(a) illustratesa circle defined by a pair of mirror-symmetric rods.
Let
C ¼ fðck; rkÞ; k¼ 1;…;Kg ð2Þbe the set of pairs (center,radius) defined by mirror-symmetricrods in L. Let rg1 ; rg2 , and rg3 be the estimated radii for cells ofgenerations 1, 2, and 3, respectively, and w a “window” parameter(we use w¼5). We define the centers histogram Hm�n�3 as follows:
Hði; j;hÞ ¼ fkAf1;…;Kg : ck ¼ ði; jÞ; rgh �wrrkrrgh þwÞg; ð3Þfor ck and rk as defined in Eq. (2), # the “number of elements”operator, and h¼ 1;2;3.
For the next phase of the algorithm, we will also need a set of“local maxima” in every dimension of H: (at most) 1 local max-imum for H(.,.,1), (at most) 2 for H(.,.,2), and (at most) 4 for H(.,.,3).The rationale is this: H(.,.,1) accumulates the evidence that there isa circle of radius rg1 in the image; thus, in frames corresponding tothe first cell, we expect H(.,.,1) to have a clear cluster around thecenter of the cell; when the first cell divides, H(.,.,2) – whichaccumulates evidence for circles of radius rg2 – is expected to have(two) clusters around the centers of the two daughter cells; andso forth.
We quoted the term local maxima in the previous paragraphbecause H(.,.,h) is not smooth, and therefore presents many localmaxima around the corresponding cell centers. To cope with this,we convolve H(.,.,h) with a Gaussian kernel (of s¼ 5), producingHð:; :;hÞ, and locate the local maxima in Hð:; :;hÞ instead. We define
Mh ¼ fðx; yÞ : ðx; yÞ one of the nh largest local maxima in Hð:; :;hÞg;ð4Þ
where nh ¼ 1;2;4 for h¼ 1;2;3, respectively.
3.3.2. Division detectionOur division detection method is based on the number of votes
for a circle of a particular radius in a neighborhood of theestimated center of that circle, such center given by the trackingmodule.
Let f1 and f2 be frame indices for which cells of generations 1 and2 are expected to have divided already. That is: it is known thatthe first cell usually divides around frame 50, so we chose f 1450 (inour implementation we set f 1 ¼ 100). Second generation cells areexpected to divide around frame 220, so we define f 2 ¼ 300. (f1 andf2 should be such that, taking the variances of division times intoaccount, the first generation cells are expected to divide in framesbefore f1, and second generation cells before f2.9
The tracking method then scans the frames 3 times, as depictedin Fig. 7. The first scan extends from frame 1 to frame f1, aiming totrack the trajectory of the first cell and detect the frame t1 of thefirst cell division. The second scan extends from frame t1þ1 toframe f2; it aims to track the trajectories of the two 2nd-generationcells and to detect frames t2 and t3, corresponding to the secondand third divisions, respectively. While this is sufficient to obtaindivision times up to the 4-cell stage, we perform a third scan,extending from frame t2þ1 to frame f2, in order to verify if the 3rdgeneration cells are tracked properly (the second scan only tracks2nd generation cells).
We now explain how the events curve for the detection of thefirst division is computed. The procedure for the other divisions issimilar.
During the first run, we compute a path of centers
Fig. 5. For each frame, there is an initial guess for the circle that better approximates the boundary of each cell. Following this circle around, a band of the original image istaken (a) and its gradient mapped to a rectangular image (b). The yellow line in (c) shows the solution by Dynamic Programming that fits the boundary. (For interpretation ofthe references to color in this figure caption, the reader is referred to the web version of this paper.)Q3
9 These parameters do set a prior on division times, which could influence theability to detect divisions in perturbed embryos. However, they can be chosen tostatistically minimize those cases. Furthermore, a pre-processing step could bedeveloped to computationally infer a prior on f1 and f2.
M. Cicconet et al. / Computers in Biology and Medicine ∎ (∎∎∎∎) ∎∎∎–∎∎∎6
Please cite this article as: M. Cicconet, et al., Label free cell-tracking and division detection based on 2D time-lapse images for lineageanalysis of early embryo development, Comput. Biol. Med. (2014), http://dx.doi.org/10.1016/j.compbiomed.2014.04.011i
given by the boundary-tracking module. In this run the tracking isperformed with settings for a 1st-generation cell, and they are notchanged when the cell divides. What happens in terms of boundarytracking is that the method tends to fit either one of the daughtercells or a blob of cells after division. Regardless, what is important isthat, in a few frames after division, P follows an estimated trajectoryfor the center of the cell as if it had not divided.
Now, for a frame of index t, let St be the square block of edge rg1=2,centered at ct, in the histogram Hð:; :;1Þ for that frame. (rg1 , we recall, isthe estimated radius of a 1st-generation cell.) We define the eventscurve E¼ fe1;…; ef 1 g for first division detection by setting
et ¼ ∑rg1 =2
i;j ¼ 1Sti;j ; 8 t ¼ 1;…; f 1: ð6Þ
That is, et is the sum of the elements in St. We also refer to E as the“likelihood” curve – as in Fig. 9 – since it corresponds to the likelihoodof a circle of a particular radius being in each frame. Fig. 8 showscropped examples of Hð:; :;1Þ and Hð:; :;2Þ around the frame centers, forframes around cell divisions. Fig. 9 shows some examples of eventscurves.
The events curve is, ideally, a two-step piecewise constantfunction, and detecting the division frame amounts precisely tofinding the point where such a function changes values. (While weare only interested in the division point, below we also include thecomputation of the piecewise function, to clarify the intuitionbehind the method.)
The frame of division is the global minimum of a cost functionfαðtÞ; t ¼ 1;…; f 1g, computed as follows. For each t ¼ 2;…; f 1, splitthe set E in two segments, E�
t ¼ fe1;…; et�1g and Eþt ¼ fet ;…; ef 1 g,
and define αðtÞ ¼ varianceðE� ÞþvarianceðEþ Þ. For completeness,define αð1Þ ¼ αð2Þ. The frame of division will be t ¼ arg min αðtÞ,
and the two-step piecewise constant function ϕ that best fits E is
ϕðtÞ ¼meanðE�t Þ for t ¼ 1;…; j�1; and ð7Þ
ϕðtÞ ¼meanðEþt Þ for t ¼ j;…;n: ð8Þ
Fig. 9 shows some examples of events (likelihood) curves andcorresponding cost (variance) functions, scaled to fit in the samefield of view.
3.3.3. Initializing daughter cell locationsHere we make use of the local maxima stored in Mh (Eq. (4)). To
initialize the positions of the two cells after the 1st-generation celldivides, we look at the points in the setsM2 corresponding to n framesfollowing the frame of division (including the frame of division). Ingeneral, the two daughter cells do not move too much in their initialframes. Therefore, if n is sufficiently small, the aggregate set of localmaxima from the n sets M2 just mentioned should have two well-localized clusters, close to the approximate center of the mother cellbefore division. The centroids of such clusters – which we computeusing the k-means algorithm – provide the initial positions for thedaughter cells. We use n¼6 in our implementation.
4. Cell-tracking database
We selected 100 Control examples, scored with CellTracker, fora cell-tracking movie database.
The database contains for each video: (1) the uncompressedframes, up to the 10th frame after the appearance of the 8th cell;(2) a text file with the trajectories of all the cells, from appearanceto division (for cells of generations 1–3), where a trajectory is asequence of pairs (center, radius); (3) a movie file showing thetrajectories of the cells – examples of frames are shown in Fig. 10.
We are making these examples available so that other Compu-ter Vision and Image Analysis researchers have access to ground-truth data for the development of cell-tracking and divisiondetection algorithms. The corresponding webpage will keep trackof reported performance results, starting from the ones obtainedwith the techniques described in this paper.
The cell-tracking database is available at http://aquila.bio.nyu.edu/celltracking/.
Fig. 6. Circle detection using mirror symmetry. (a) When rods ðp; tpÞ and ðq; tqÞ are mirror symmetric, they uniquely define a circle with tangents parallel to tp and tq. Thecenters of circles like this provide histograms that are used for cell-division detection. (b) It is not possible to draw a circle fitting rods that are not mirror symmetric, sinceone of the tangents does not match.
Fig. 7. Pipeline of the tracking algorithm. The first run is for detecting the firstdivision time (t1). The division times of second generation cells (t2 and t3) aresearched for in the second run. One additional pass is performed for debugging/visualization purposes.
M. Cicconet et al. / Computers in Biology and Medicine ∎ (∎∎∎∎) ∎∎∎–∎∎∎ 7
Please cite this article as: M. Cicconet, et al., Label free cell-tracking and division detection based on 2D time-lapse images for lineageanalysis of early embryo development, Comput. Biol. Med. (2014), http://dx.doi.org/10.1016/j.compbiomed.2014.04.011i
In this section we report performance results for the cellcounting method described in Section 3.1 and the automatedtracking algorithm of Section 3.3. We also give a few examplesof the types of data analysis that can be conducted based oninformation gathered with CellTracker (Section 3.2).
5.1. Counting embryos
Our method for cropping each embryo's trajectory in the well(to create individual time-lapse movies) performs embryo count-ing in the first step. Since at that point each embryo consists of one
cell only, the algorithm can be evaluated in terms of its perfor-mance for counting cells.
We evaluated the performance of cell counting using 112images similar to the one shown in Fig. 2(a), comprising a totalof 1442 embryos. The recall and precision rates were 0.9979 and0.9993, respectively. For the same dataset, the state-of-the-artmethod described in [22] (code available online) achieves recall of0.9986 and precision of 0.9017.
5.2. Semi-automated tracking
We used CellTracker to score 103 control embryos up to the8-cell stage. 100 of these are available in the tracking database, and
Fig. 8. Sequences of H ð:; :;1Þ and H ð:; :;2Þ (cropped around the frame centers), for frames around cell divisions. Notice how the histograms change considerably whendivisions occur.
Fig. 9. Event detection curves for division detection in first (a) and second (b) generation cells. The point of global minimum in a variance curve provides the point ofdivision.
Fig. 10. Some frames of a video in the cell-tracking database.
M. Cicconet et al. / Computers in Biology and Medicine ∎ (∎∎∎∎) ∎∎∎–∎∎∎8
Please cite this article as: M. Cicconet, et al., Label free cell-tracking and division detection based on 2D time-lapse images for lineageanalysis of early embryo development, Comput. Biol. Med. (2014), http://dx.doi.org/10.1016/j.compbiomed.2014.04.011i
92 (in which pronuclear envelope breakdown was clearly visible)were used for the statistical analysis shown below.
Table 1 and Fig. 11 display some statistics of the analyzed data,in particular data related to the durations and synchronicity ofdivision for cells in different generations. The duration of first-generation cells (t1) was measured from the frame of pronuclearenvelope breakdown. This occurs in all zygotes in preparation forthe first mitotic division and provides a common reference time-point that can be used as a developmental registration mark forcomparisons between time-lapse recordings.
Fig. 12, showing data captured from all 103 control embryos,approaches the question of total volume up to the 8-cell stage.According to the adopted model of cells as spheres with radiiestimated with CellTracker, total volume actually decreases.
User interaction is required primarily to set the frames of divisionsfor every cell, and occasionally to correct the boundary location ofa particular cell when the tracking module misses it. For the resultsreported in Table 1 and Fig. 11, additional manual scoring wasperformed to annotate the frame of pronuclear envelope breakdown.
5.3. Automated tracking
We evaluated the accuracy of the automated tracking algorithmas applied to 100 control embryos at two different thresholds.When accuracy is defined as a difference of up to 3 framesbetween manual and automatic detection, the automated trackingalgorithm achieved an accuracy of 92%, 70%, and 58%, respectively,for detecting 1st, 2nd, and 3rd generation divisions. When accu-racy is defined as a difference of up to 5 frames, accuracy increasesto 95%, 78%, and 63%, respectively.10
In comparison, the sum of absolute pixel-to-pixel differencesfor consecutive frames (as in [16]) finds the first division with 78%accuracy when 3 frames of error flexibility are given, and with 80%accuracy for a 5-frames precision window.
Table 1Medians of timing measurements, in frames and hours:minutes. t1, t2, t3: durations of 1st, 2nd, and 3rd generation cells, respectively.s2: absolute difference, in frames, between times in which sibling cells of 2nd-generation divide (the “s” is for “synchronicity”).s3: analogous of s2 for 3rd-generation cells. All examples go to 8-cell stage. See Fig. 11 for more statistical analysis.Q4
Fig. 11. Box plots of measurements described in Table 1, obtained from a subset of 92 embryos in the cell tracking database (those embryos for which pronuclear envelopebreakdown was clearly visible). To convert the vertical axis in clock time, recall that consecutive frames are 7 min apart.
Fig. 12. Analysis of total cell volume by CellTracker. Columns 1, 3, and 5 showestimated median radii for 1st, 2nd, and 3rd generation cells, respectively,assuming conservation of total volume and spherical cells. Columns 2, 4, and6 show box plots of measured radii for 1st, 2nd, and 3rd generation cells,respectively. Using the medians as estimators of radii, the total volume decreasesup to the 8-cell stage, to 88% and 92% that of the previous generation in the 2ndand 3rd generation, respectively. The conservation of volume predicts a radius thatis off by 4.5% for 2nd-generation cells and by 7.6% for 3rd generation cells. Theestimated medians correspond to radii of approximately 27:41 μm for a 2nd-generation cell, and of 21:14 μm for a third generation cell. We normalized the plotso that the median for 1st-generation cells is 36:09 μm (this value is the median ofthe radii of 59 1st-generation cells of distinct non-injected embryos, measuredusing the NIS-Elements imaging software).
10 We notice that while the accuracy of our fully automated method is stillrelatively low for detecting the second and third divisions, the medians of cell durationsare actually good statistical predictors: on the same database of 92 embryos used inTable 1, the median for the duration of 1st-generation cells is 16 frames, and for 2nd-generation cells it is 169 frames—this corresponds to an error of only two frames (inboth cases) from the values determined by manual scoring in Table 1.
M. Cicconet et al. / Computers in Biology and Medicine ∎ (∎∎∎∎) ∎∎∎–∎∎∎ 9
Please cite this article as: M. Cicconet, et al., Label free cell-tracking and division detection based on 2D time-lapse images for lineageanalysis of early embryo development, Comput. Biol. Med. (2014), http://dx.doi.org/10.1016/j.compbiomed.2014.04.011i
Our previous implementation ([6]) performs with 61%, 33%,and 26% of accuracy (in 150 embryos).
Considering the correct finding of all three division times up tothe 3rd division our method performs with 46% accuracy (whentime discrepancy is of less than 3 frames; 55% when discrepancy isof less than 5 frames).
Wong et al. [25] only report partial performance results onsmall datasets. For instance, 14 human embryos from a set of 100were used to evaluate the measurement of time between first andsecond mitoses, and results were compared to manual annota-tions. “Excellent agreement between the two methods” wasobtained, but only in 8 cases (those for which embryos “reachedthe blastocyst stage with good morphology”).
The main limitation of our method is related to noise in theevents curves used for division detection (Fig. 9), which leads tocomputation of the wrong local minima. Less often, a division isnot detected when a cell divides perpendicularly to the focalplane, since such events provide no evidence of change in thecenters histogram.
5.4. On computation time
Counting embryos on the first frame takes about 0.35 s. Theautomatic cell-tracking algorithm up to the 4-cell stage runs inabout 4 min per embryo. These methods were implemented inMatlab R2011b (64-bit).
Tracking happens in a real-time fashion (there is no perceivedwaiting-time between frames). The software was implemented inObjective-C, using Xcode (thus, it runs natively on Apple Macintoshcomputers only).
All experiments were performed on an iMac with 2.8 HGz IntelCore i7 processor and 16 GB RAM, running Mac OS 10.8 or 10.9.
6. Conclusion
In this work we described two methods for cell tracking anddivision detection in time-lapse videos of mouse embryos. Thesemi-automated method (available as a software implementationcalled CellTracker) works up to the 8-cell stage and relies on userinteraction for cell division. The automatic tracking algorithm goesup to the 4-cell stage. Its division detection module is based onhistograms of mirror symmetry coefficients, which provide evi-dence for the existence of cells of particular radii in each frame.
We also release with this paper a cell-tracking database,containing 100 annotated examples of mouse embryos up to the8-cell stage. The database was built using CellTracker, and thusrepresents an accurate “gold standard” reference dataset accordingto careful manual annotation that provides a benchmark forthe development and assessment of Computer Vision methods inareas such as tracking and shape analysis.
Both the software and the database are available at http://aquila.bio.nyu.edu/celltracking/.
We hope CellTracker will be used by IVF (in vitro Fertilization)researchers to improve the understanding of how the divisiontimes and shape features of a human embryo correlate with itsdevelopmental competence for uterine re-implantation.
Conflict of interest statement
None declared.
Appendix A. Supplementary material
Supplementary data associated with this article can be foundin the online version at http://dx.doi.org/10.1016/j.compbiomed.2014.04.011.
References
[1] Z. Bao, J. Murray, T. Boyle, S. Ooi, M. Sandel, W. RH, Automated cell lineagetracing in Caenorhabditis elegans, Proc. Natl. Acad. Sci. U.S.A. 103 (2006)2707–2712.
[2] Y. Bellaiche, F. Bosveld, F. Graner, K. Mikula, M. Remesikova, M. Smisek. Newrobust algorithm for tracking cells in videos of Drosophila morphogenesisbased on finding an ideal path in segmented spatio-temporal cellularstructures, in: Conference Proceedings of IEEE Engineering in Medicine andBiology Society, 2012, Article number: 6609.
[3] J. Bruna, S. Mallat, Invariant Scattering Convolution Networks, 2012. CoRR abs/1203.1513.
[4] C. Castro-Gonzlez, M. Luengo-Oroz, L. Douloquin, T. Savy, C. Melani,S. Desnoulez, M. Ledesma-Carbayo, P. Bourgine, N. Peyrieras, A. Santos,Towards a digital model of zebrafish embryogenesis. integration of celltracking and gene expression quantification, in: 2010 Annual InternationalConference of the IEEE, Engineering in Medicine and Biology Society (EMBC),2010, pp. 5520–5523.
[5] S. Chavez, K. Loewke, J. Han, F. Moussavi, P. Colls, S. Munne, B. Behr, R. ReijoPera. Dynamic blastomere behaviour reflects human embryo ploidy by thefour-cell stage, Nat. Commun (2012) Article number: 1251.
[6] M. Cicconet, D. Geiger, K. Gunsalus, Wavelet-based circular hough transformand its application in embryo developmental analysis, in: 8th InternationalConference on Computer Vision Theory and Applications, Barcelona, Spain,2013.
[7] M. Cicconet, D. Geiger, K. Gunsalus, M. Werman, Mirror symmetry histogramsfor capturing geometric properties in images, in: Computer Vision and PatternRecognition, Columbus, Ohio, 2014, in press. Q2
[8] J. Conaghan, A. Chen, S. Willman, K. Ivani, P. Chenette, R. Boostanfar, V. Baker,G. Adamson, M. Abusief, M. Gvakharia, K. Loewke, S. Shen, Improving embryoselection using a computer-automated time-lapse image analysis test plus day3 morphology: results from a prospective multicenter trial, Fertil. Steril. 2(2013) 412–419.
[9] D. Geiger, A. Gupta, L. Costa, J. Vlontzos, Dynamic programming for detecting,tracking, and matching deformable contours, IEEE Trans. Pattern Anal. Mach.Intell. 17 (1995) 294–302.
[10] D. Geiger, T.L. Liu, R. Kohn, Representation and self-similarity of shapes, IEEETrans. Pattern Anal. Mach. Intell. 25 (2003) 86–99.
[11] S. Hamahashi, H. Kitano, S. Onami, A system for measuring cell divisionpatterns of early Caenorhabditis elegans embryos by using image processingand object tracking, Syst. Comput. Jpn. 38 (2007) 12–24.
[12] T. Hardarson, C. Lfman, G. Coull, A. Sjgren, L. Hamberger, R. Edwards,Internalization of cellular fragments in a human embryo: time-lapse record-ings, Reprod. Biomed. Online 5 (2002) 36–38.
[13] S. Kang, C. Giurumescu, A. Chisholm, P. Cosman, Automated nuclei tracking inC. elegans based on spherical model fitting with multiple target tracking, in:2012 IEEE Southwest Symposium on Image Analysis and Interpretation(SSIAI), 2012, pp. 17–20.
[14] C. Li, C. Xu, C. Gui, M.D. Fox, Distance regularized level set evolution and itsapplication to image segmentation, IEEE Trans. Image Process. 19 (2010)3243–3254.
[15] C. Melani, N. Peyrieras, K. Mikula, C. Zanella, M. Campana, B. Rizzi, F. Veronesi,A. Sarti, B. Lombardot, P. Bourgine, Cells tracking in a live zebrafish embryo, in:29th Annual International Conference of the IEEE Engineering in Medicine andBiology Society, 2007, pp. 1631–1634.
[16] M. Meseguer, J. Herrero, A. Tejera, K. Hilligsoe, N. Ramsing, J. Remohi, The useof morphokinetics as a predictor of embryo implantation, Hum. Reprod. 26(2011) 2658–2671.
[17] R. Mikut, T. Dickmeis, W. Driever, P. Geurts, F. Hamprecht, B.X. Kausler,M.J. Ledesma-Carbayo, R. Marée, K. Mikula, P. Pantazis, O. Ronneberger,A. Santos, R. Stotzka, U. Strähle, N. Peyriéras, Automated processing ofzebrafish imaging data – a survey, Zebrafish 10 (2013) 401–421.
[18] Y. Mio, K. Maeda, Time-lapse cinematography of dynamic changes occurringduring in vitro development of human embryos, Am. J. Obstet. Gynecol.(2008).
[19] T. Nakahara, A. Iwase, M. Goto, T. Harata, M. Suzuki, M. Ienaga, H. Kobayashi,S. Takikawa, S. Manabe, F. Kikkawa, H. Ando, Evaluation of the safety of time-lapse observations for human embryos, J. Assist. Reprod. Genet. 27 (2010)93–96.
[20] D. Payne, S.P. Flaherty, M.F. Barry, C.D. Matthews, Preliminary observations onpolar body extrusion and pronuclear formation in human oocytes using time-lapse video cinematography, Hum. Reprod. 12 (1997) 532–541.
[21] M. Piccardi, Background subtraction techniques: a review, in: 2004 IEEEInternational Conference on Systems, Man and Cybernetics, vol. 4, 2004,pp. 3099–3104.
M. Cicconet et al. / Computers in Biology and Medicine ∎ (∎∎∎∎) ∎∎∎–∎∎∎10
Please cite this article as: M. Cicconet, et al., Label free cell-tracking and division detection based on 2D time-lapse images for lineageanalysis of early embryo development, Comput. Biol. Med. (2014), http://dx.doi.org/10.1016/j.compbiomed.2014.04.011i
[22] P. Quelhas, M. Marcuzzo, A.M. Mendonca, A.C. Campilho, Cell nuclei andcytoplasm joint segmentation using the sliding band filter, IEEE Trans. Med.Imaging 29 (2010) 1463–1473.
[23] B. Sonnichsen, L. Koski, A.Walsh, P. Marschall, B. Neumann, M. Brehm, A. Alleaume,J. Artelt, P. Bettencourt, E. Cassin, M. Hewitson, C. Holz, M. Khan, S. Lazik, C. Martin,B. Nitzsche, M. Ruer, J. Stamford, M. Winzi, R. Heinkel, M. Roder, J. Finell,H. Hantsch, S. Jones, M. Jones, F. Piano, K. Gunsalus, K. Oegema, P. Gonczy,A. Coulson, A. Hyman, C. Echeverri, Full-genome RNAi profiling of early embry-ogenesis in Caenorhabditis elegans, Nature 434 (2005) 462–469.
[24] C. Wong, A. Chen, B. Behr, S. Shen, Time-lapse microscopy and image analysisin basic and clinical embryo development research, Reprod. Biomed. Online 2(2013) 120–129.
[25] C.C. Wong, K.E. Loewke, N.L. Bossert, B. Behr, C.J.D. Jonge, T.M. Baer, R.A.R. Pera,Non-invasive imaging of human embryos before embryonic genome activa-tion predicts development to the blastocyst stage, Nat. Biotechnol. 28 (2010)1115–1121.
123456789
1011121314151617
M. Cicconet et al. / Computers in Biology and Medicine ∎ (∎∎∎∎) ∎∎∎–∎∎∎ 11
Please cite this article as: M. Cicconet, et al., Label free cell-tracking and division detection based on 2D time-lapse images for lineageanalysis of early embryo development, Comput. Biol. Med. (2014), http://dx.doi.org/10.1016/j.compbiomed.2014.04.011i