This Quick Start Guide explains the basics of using the Domino’s® Pulse Labor Management application. It contains the following sections:
Who Should Read This Guide?How is this Labor Management Application Different?The Forecast ModuleThe Schedule ModuleLabor Management ConfigurationFrequently-asked Questions
Who Should Read This Guide?
General Managers who want to quickly become familiar with the new Labor Management application. This guide assumes that you have general knowledge of labor management, including: actual, scheduled, and ideal labor, as well as experience using the Domino’s Pulse system. Note that the various software settings used in this guide are for example purposes only; your store settings may be different.
How is This Labor Management Application Different?
Some Domino’s Pulse stores already have a Scheduler application. The new Domino’s Pulse Labor Management application includes these features:
A new Forecast screen that displays the forecast by sales countsor order amounts, divided by day part and order type. You canview a historical week side-by-side to the forecast. The systemcan suggest a forecast based on the last eight weeks of history,heavily weighted toward the most recent week.A new Schedule screen with easy-to-use drag and dropscheduling, a graphical waste/need display, the ability to copy aprevious schedule, and the ability to send a schedule tosupervisors on a weekly basis.New reports: Forecast vs. Actual, Daily Variance, Week At AGlance.
This section introduces the Forecast Module, and contains the following sections:
What’s a Forecast?Getting to Know the Forecast ScreenHow to Create Your ForecastAdjusting Your ForecastThe Forecast vs. Actual Report
What’s a Forecast?
A forecast is merely a prediction – based on both historic sales data and input from you – of what the next week’s sales will likely be. The Forecast module uses recent sales data to predict next week’s sales. The manager can make adjustments to the prediction based on what he knows about special events that might affect the next week’s sales. This predicted sales information is then passed on to the Schedule module, which uses it to suggest staffing levels for the store (figure 2).
Figure 2 The Forecaster and Scheduler Work Together to Predict Staffing Levels
The Forecast screen can be set to display both the historical sales information and the forecast prediction side-by-side for easy analysis and adjustments. The information that appears on the Forecast screen is explained in the next section.
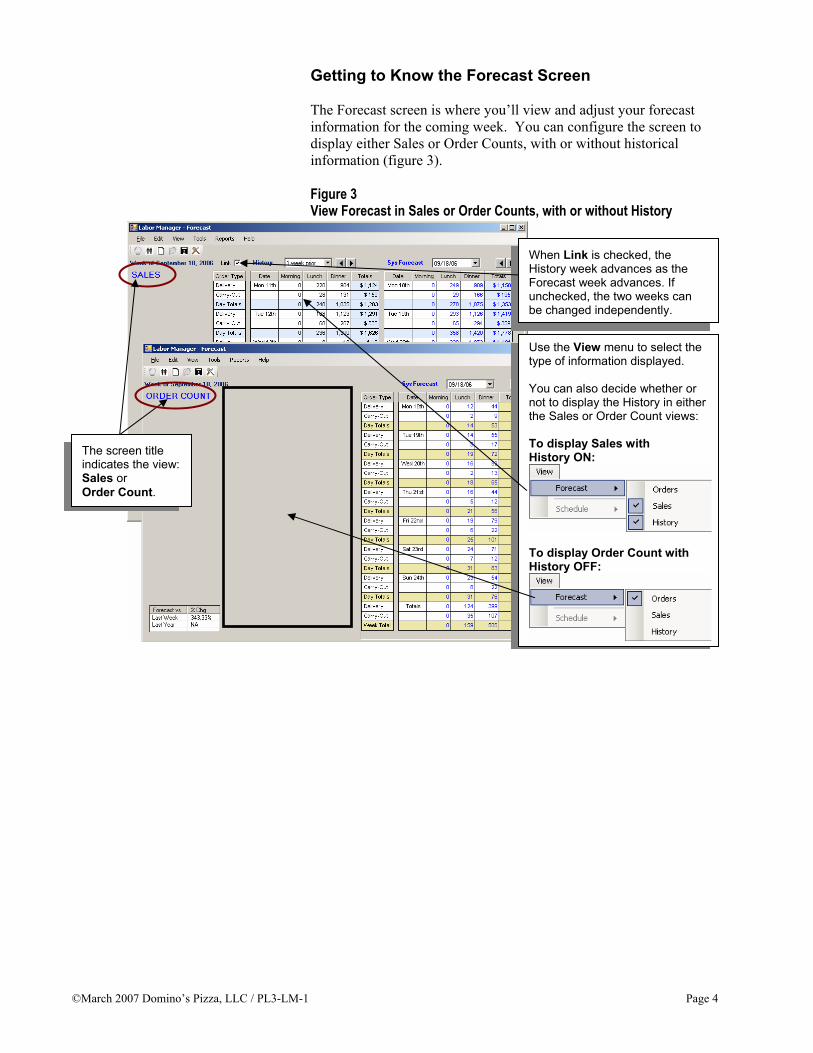
The Forecast screen is where you’ll view and adjust your forecast information for the coming week. You can configure the screen to display either Sales or Order Counts, with or without historical information (figure 3).
Figure 3 View Forecast in Sales or Order Counts, with or without History
The screen title indicates the view: Sales or Order Count.
Use the View menu to select the type of information displayed.
You can also decide whether or not to display the History in either the Sales or Order Count views:
To display Sales with History ON:
To display Order Count with History OFF:
When Link is checked, the History week advances as the Forecast week advances. If unchecked, the two weeks can be changed independently.
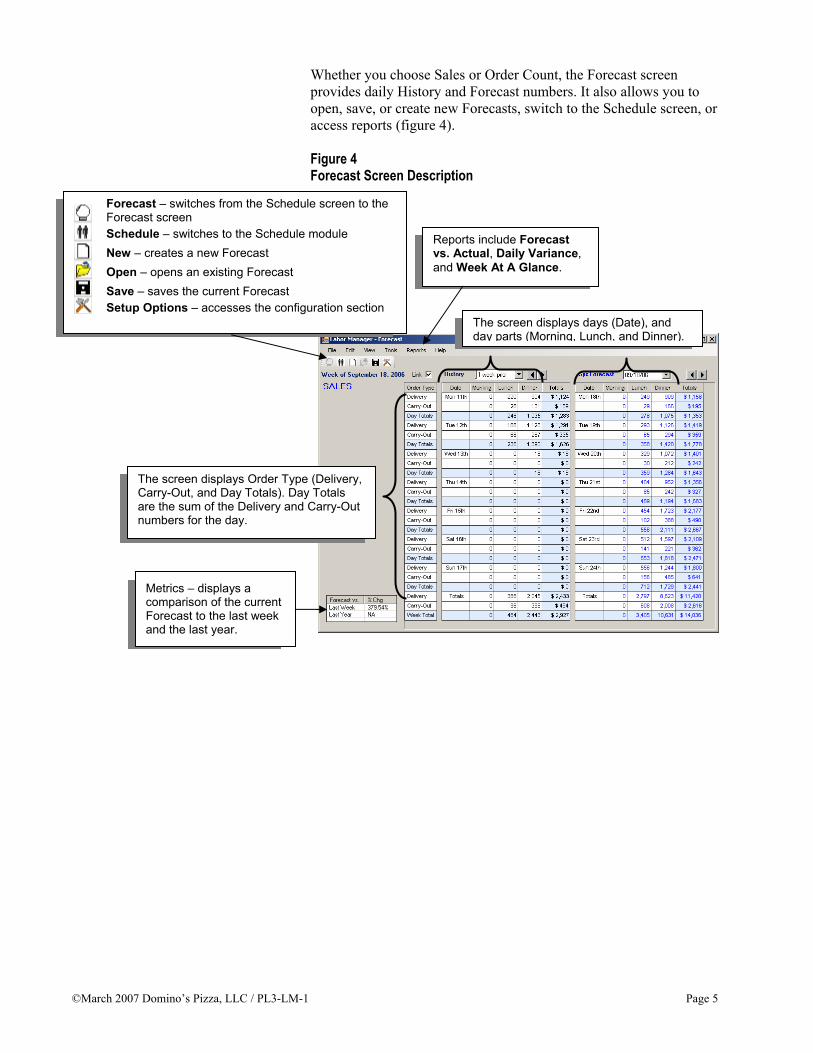
Whether you choose Sales or Order Count, the Forecast screen provides daily History and Forecast numbers. It also allows you to open, save, or create new Forecasts, switch to the Schedule screen, or access reports (figure 4).
Figure 4 Forecast Screen Description
Reports include Forecast vs. Actual, Daily Variance, and Week At A Glance.
Metrics – displays a comparison of the current Forecast to the last week and the last year.
Forecast – switches from the Schedule screen to the Forecast screen Schedule – switches to the Schedule module New – creates a new Forecast Open – opens an existing Forecast Save – saves the current Forecast Setup Options – accesses the configuration section
The screen displays Order Type (Delivery, Carry-Out, and Day Totals). Day Totals are the sum of the Delivery and Carry-Out numbers for the day.
The screen displays days (Date), and day parts (Morning, Lunch, and Dinner).
5. To change the forecast week, select the date drop-arrow next toSys Forecast and choose the week to forecast. The applicationloads the data.
6. To change the History period, select the History drop-arrow andchoose the range:
7. Click Save to save the forecast or click New to start over.
At times you may need to make adjustments to a forecast. See the next section for details.
Adjusting Your Forecast
You may want to periodically adjust your forecast based on unusual events such as weather, special events, product promotions, media schedules, holidays, etc. You can make an adjustment to the forecast by changing the numbers for Delivery, Carry-Out, Day Totals, Morning, Lunch, or Dinner (figure 5).
Figure 5 Adjust Your Forecast by Editing the Fields
Important: If you adjust the Day Totals, the system automatically splits the sales. If you know where sales will be affected, you should make adjustments directly to the Delivery or Carry-Out number for
Select the number you need to change and then type your own number in its place.
When you make a manual change to data in the forecast, the number that you changed becomes bold, and the title Sys Forecast changes to Mgr Forecast and is highlighted in blue (figure 6).
Figure 6 Changes to the Forecast are Shown in Bold
If you change Sales, the Forecast changes Order Count totals proportional to the increase or decrease. If you change Order Count totals, the Forecast changes Sales proportional to the increase or decrease.
You can override your changes and return to the System Forecast by clicking Edit and then Revert to System Forecast (figure 7).
Figure 7 Navigation to Revert to System Forecast
You can adjust your forecast by changing your Sales or Order Count numbers, or by selecting a different historical week. To adjust your forecast: 1. Open the Labor Management application and select the Forecast
button. The forecast for the week appears. 2. Select View > Forecast > Sales or View > Forecast > Orders to
view the desired numbers.3. Select the forecast to edit:
Sys Forecast becomes Mgr Forecast
The Forecast re-calculates the corresponding numbers.The number that you changed becomes bold.
4. On the Forecast screen, select the number that you want tochange by clicking it. Type your change and then press Enter orselect another number.
5. Select Save to save the forecast or select New to startover. Note: if you choose New, you revert to the SystemForecast for the week and lose your changes.
The Forecast vs. Actual Report
The Forecast vs. Actual report is a training tool for Supervisors to use with Store Managers to determine whether the system forecast or the manager forecast is closer to actual sales. The report shows which forecast is more accurate, and allows for focus on areas of improvement. To access it, go to Reports>Forecast vs. Actual, select the date (figure 8), and then the report appears (figure 9).
Figure 8 Select A Date for the Forecast vs. Actual Report
Use the arrow buttons to move the forecast date forward or back seven days.
Select the drop-arrow to display a calendar, and then use the calendar to select the forecast week.
Select the drop-arrow to display the calendar, and then use the calendar to select the date for the report.
This section introduces the Schedule Module, and contains the following sections: Getting to Know the Schedule Screen Schedule Screen Options How to Create a Schedule How to Make Adjustments to Your Schedule How to Send Your Schedule How to Publish Your Schedule The Week At A Glance Report The Daily Variance Report
Getting to Know the Schedule Screen
The Schedule screen is where you’ll schedule your Team Members for the week, based on your Forecast. Figure 10 shows what the screen looks like before a schedule is created. Figure 10 The Schedule Screen Before a Schedule is Drawn
The “Week of…” tab displays scheduling problems for the week, such as “Driver not scheduled for closing shift, or “Hourly employee scheduled over 8 hours.” This tab is also used to send and publish the Schedule.
Daily schedules appear on these tabs.
Create your schedule here.
Team Members are listed alphabetically, grouped by Managers (at the top - red), then Insiders (blue), and then Delivery Experts (green). Scheduled hours for the day and week appear next to their names. We’ll discuss how to change these colors later in this section.
The Labor Metrics section displays scheduled and ideal hours for the day and week. These numbers are shown for Delivery Experts and for Insiders (managers and insiders).
Store Hours appear here.
The horizontal line that separates the WASTE display from the NEED display represents ideal labor.
Before you start scheduling, no waste is shown – only need.
The Waste/Need section provides a visual representation of your labor “waste” and “need.” This area is actually a grid, divided into time periods. For example, if your Schedule screen is set to display in 15-minute increments, then the Waste/Need grid is also divided into 15-minute increments.
WASTENEED
One 15-minute increment of WasteTwo 15-minute increments of Need
When you begin scheduling, the screen begins to look like the
example in figure 11. Figure 11 The Schedule Screen With a Schedule Displayed
Schedule Screen Options You can change the appearance of the Schedule screen to suit your needs. You can change the Team Member list (names and colors), the time increments on the Schedule grid, metrics, and Waste/Need details. This section explains how to make those changes.
If your store has more Team Members than will fit on the Schedule screen, you can use filters to limit which Team Members are visible. It will be easier to draw your schedule if the Team Member list is smaller or divided into groups. To filter the Team Member list, from the Schedule screen, select View > Schedule, and the list of available
Create shifts for each Team Member by clicking and dragging on the grid.
As you create the schedule above, the Waste/Need markers appear and disappear to reflect your scheduling requirements.
Move your mouse over a shift to see details of that shift:
Move your mouse over the end of a shift to see the exact ending time (or mouse over the beginning of the shift to see the exact beginning time):
Move your mouse over a time in the Waste/Need section too see a description of how far your schedule is from ideal at this time:
Team Member lists appears. You can only select one of the lists, and as soon as it is selected the Schedule screen changes to display only the selected group of Team Members. The following table defines each of the available Team Member lists:
If you set: Then the Schedule screen displays:
Show All Available Team Members any Team Members who are available to be scheduled for the selected day.
Show All Scheduled Team Members only the Team Members who are already scheduled for the selected day.
Show Managers Only only the Managers, whether they have been scheduled for the selected day or not.
Show Delivery Experts Only only the Delivery Experts, whether they have been scheduled for the selected day or not.
Show Insiders Only only the Insiders, whether they have been scheduled for the selected day or not.
Show Managers and Insiders all Managers and Insiders, whether they have been scheduled for the selected day or not.
Show Managers and Delivery Experts all Managers and Delivery Experts, whether they have been scheduled for the selected day or not.
Show All Team Members
all Team Members in the computer, regardless of their status. This means that hired, terminated, on leave, etc., Team Members will appear in the list, although terminated Team Members will have a line through their name. The Schedule will not allow you to draw a schedule for terminated Team Members.
For additional filtering, you can use the Setup Options screen to select which positions appear on the Schedule screen.
To Change Team Member Colors, Time Increments, Metrics, or Waste/Need Details: From the Schedule screen, select the Setup Options button . Select the Schedule tab and then the General tab. Options to change the Schedule screen’s appearance are on the General tab (figure 12):
Select Colors for each of the positions shown. Your selections appear next to the Team Member’s name and on the Schedule grid to represent the Team Member’s shift. Select Default Colors to erase your choices and return to system colors.
Set Schedule in increments to choose from 15-minute, 30-minute, and one hour increments for the Schedule screen. When you schedule a Team Member, the shift times and the store hours ruler at the top of the screen follow these increments as well. If you use 15 minute increments, a Team Member could have a 6 hour, 15 minute shift. If you use hour increments, they could only have shifts starting and ending on the hour: 10:00am to 4:00pm but not 10:30am to 4:30pm and not 10:30am to 4:15pm. 15 minute increments:
One hour increments:
Breaks and Meals are not currently scheduled in Pulse Labor Manager, so these selections are not active.
Select the Set Minimum Staffing button to add to your labor “need” in addition to what the Forecast suggests.
Check the Show Forecast Details in Waste/Need box to increase the amount of information shown in the Waste/Need section. The information appears when you pass your mouse over the section. Box unchecked:
7. Using the store hours at the top of the screen and the Waste/Need markers at the bottom of the screen as guides, draw your schedule:
8. Select the Save button. 9. Select the Week of tab to view any problems with the schedule
(figure 13). The Schedule has certain rules, such as: there must be a driver scheduled for the opening shift. These rules are called Business Rule Violations and they appear in the left column, with a Detail about each violation in the right column.
The red vertical gridline helps you line up with the timeline at the top of the screen.
As you drag to create the Team Member’s shift, the Waste/Need markers move so that you can see the effect on your ideal labor. In this example, if we extend Jerome Darr’s shift by dragging to the right 45 more minutes, these need markers would disappear to indicate a schedule closer to ideal. Your goal is to minimize the Waste/Need markers by adjusting Team Member shifts.
For each Team Member, select the start time for the shift, then drag to the end time. You can also start with the end time and drag backwards.
Before you can publish your Schedule, you must adjust your Schedule to resolve any Business Rule Violations that appear, and then Send or Publish the Schedule. You’ll learn how in the following sections.
How to Make Adjustments
Whether it’s because of errors or personnel changes, you may need to adjust your schedule sometimes. You can make adjustments as long as a schedule has not been Published. Just find the day and Team Member that you want to adjust, then drag their shift to the desired length. To take a Team Member off of the day’s schedule, drag to shrink their shift until it disappears.
You can also make adjustments by right-clicking a shift on the schedule grid. Options include changing positions for the shift, removing the shift from the schedule, and removing the Team Member from the day’s schedule.
How to Send a Schedule To send a schedule: 1. From the Schedule module, select the Week of tab.2. Select Send. A PDF copy of the Week At A Glance report is sent
to all recipients that you have set up. You can Send a scheduleany time, whether it has been published or not.
For more information about setting up e-mail recipients, see the Labor Management Configuration section of this Guide (the Email Setup tab in the table on page 24).
To Publish a Schedule: 1. From the Schedule module, select the Week of tab.2. Review and correct any errors (Business Rule Violations) that
appear.3. For any Business Rule Violations that you choose not to correct,
check the box next to them to acknowledge that you are aware ofthe problem. The Publish button is not enabled until allcheckboxes are checked.
4. Select Publish. This locks the schedule and sends a PDF copy ofthe Week At A Glance report to all recipients that you have setup. For more information about setting up e-mail recipients, seethe Labor Management Configuration section of this Guide (theEmail Setup tab in the table on page 24).
Important: Once a schedule has been published, it is locked and cannot be changed.
The Week At A Glance Report
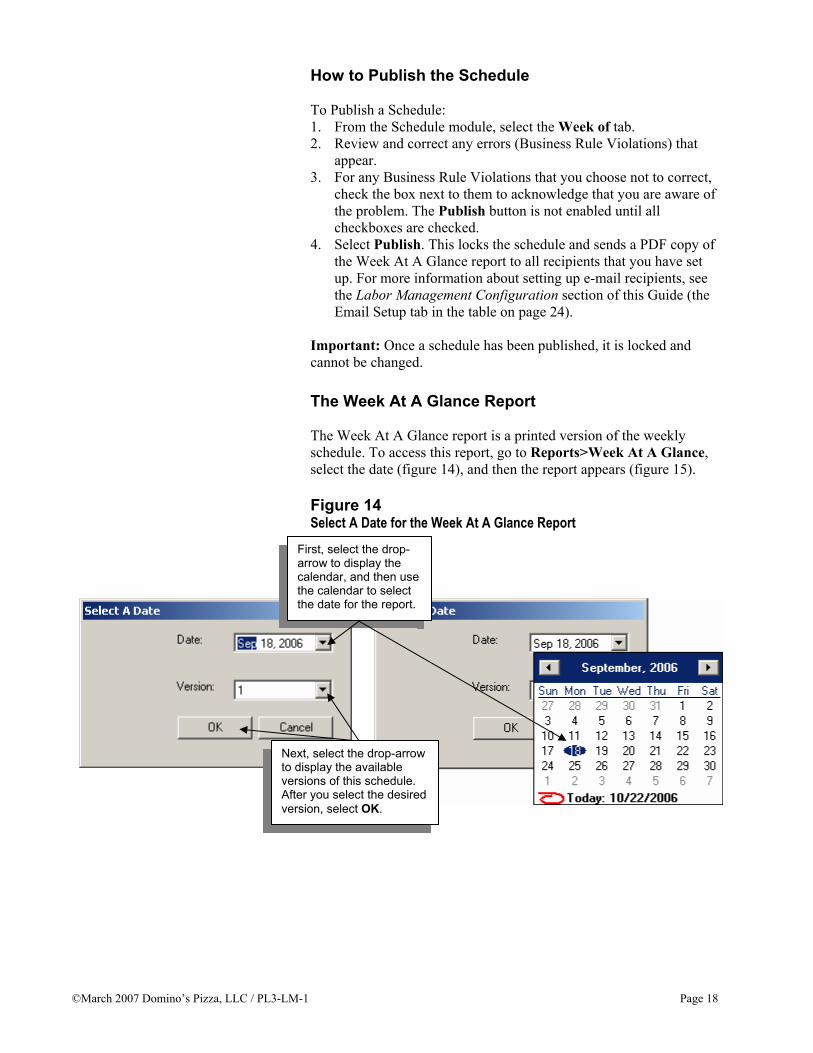
The Week At A Glance report is a printed version of the weekly schedule. To access this report, go to Reports>Week At A Glance, select the date (figure 14), and then the report appears (figure 15).
Figure 14 Select A Date for the Week At A Glance Report
First, select the drop-arrow to display the calendar, and then use the calendar to select the date for the report.
Next, select the drop-arrow to display the available versions of this schedule. After you select the desired version, select OK.
The Week At A Glance report also provides the Forecast Sales for each day part (Morning, Lunch, and Dinner) for each day (figure 16), as well as a Business Rule Review (figure 17).
Figure 16 The Week At A Glance Report, page 2
Team Members are grouped by Managers, Insiders, and Delivery Experts, like on the Schedule screen.
Each column shows a day’s schedule.
At the bottom of each group are the Hours Needed (based on your Forecast) and the Hours Scheduled (based on your Schedule).
Each column shows a day’s Forecast Sales divided into day parts.
Day parts
The last column shows the Total Hours for the week for each Team Member.
The last column shows the Total Forecast Sales for the week for each day part.
The Daily Variance Report The Daily Variance report provides comparisons of actual versus ideal sales and labor by the hour. It also includes information from the Service Times report and provides a graphical depiction of scheduled vs. actual shifts for each Team Member. To access this report, go to Reports>Daily Variance, select the date (figure 18), and then the report appears (figure 19).
Figure 18 Select A Date for the Daily Variance Report
The Business Rule Review displays the Business Rule Violations (first line)and Details (second line) from the “Week Of” tab in Schedule.
First, select the drop-arrow to display the calendar, and then use the calendar to select the date for the report.
Next, select the drop-arrow to display the available versions of this schedule. After you select the desired version, select OK.
Each column represents an hour of the day. Forecast vs.
Actual Sales
Forecast vs. Actual Order Counts
Insider Hours
Delivery Order Counts and Delivery Expert Hours
Service Times Report numbers
Scheduled vs. Actual Team Member hours
Team Member shifts – the top (gray) line is Scheduled and the bottom (green) line is Actual. Starting and ending times appear to the side of the lines. If the Scheduled and Actual time for a shift do not match, the Actual time is shown in red. If you do not use a color printer, these will appear as shades of gray on the printed report and in color on screen.
This section discusses the configuration options in the Domino’s Pulse Labor Management application. It contains the following sections: Access to Labor Management Setup Options for Labor Management
Access to Labor Management Access to this application is determined by your Domino's Pulse security access privileges. You can allow access for Team Members as you would with any other part of Domino’s Pulse (figure 20):
Labor Management combines Setup Options for Schedule, Forecast, and Reports in one Setup Options screen. Each module has its own tab, and is divided into several more setup tabs. This section gives a brief overview of each tab.
To Open the Setup Options: Open the Setup Options screen by selecting the Setup Options button from either the Schedule screen or the Forecast screen. When the screen appears, you can select the tab for Schedule, Forecast, or Reports. Under each of those tabs are the various setup options for each module. The Schedule tab includes tabs for General, Email Setup, Auto-Publish, Store Prep Time, and Cleanup Time (figure 21).
The following table defines each tab on the Schedule Setup Options
screen:
Tab: Description:
General Sets display options for the Schedule screen, including time increments, positions to schedule, and colors. For additional details about this tab, see the Schedule section of this Guide.
Email Setup Sets the e-mail addresses that will receive the Schedule when it is sent or published.
Auto-Publish Sets automatic “Send” and “Publish” days for the Schedule.
Store Prep Time
Sets the ideal Store Prep Time per day, per position. These numbers are used to suggest the ideal schedule.
Cleanup Time
Sets the ideal Cleanup Time per day, per position. These numbers are used to suggest the ideal schedule.
The Forecast tab includes tabs for Forecast Parameters, Insider Minutes, Default Values, Color Settings, and Display Items (figure 22).
Figure 22 The Forecast Setup Options Tab
The following table defines each tab on the Forecast Setup Options screen:
Sets the importance of recent weeks’ history for the Forecast. Also sets how many days in the future to forecast, and defines “large orders” to be excluded from the Forecast.
Insider Minutes
Sets the amount of time associated with each order type and order source. These numbers are used to suggest the ideal schedule.
Default Values Sets values for initial Forecasts (when no history is available for the Forecast).
Color Settings Sets the colors for the Forecast screen.
Display Items Sets which day parts and order types display on the Forecast screen.
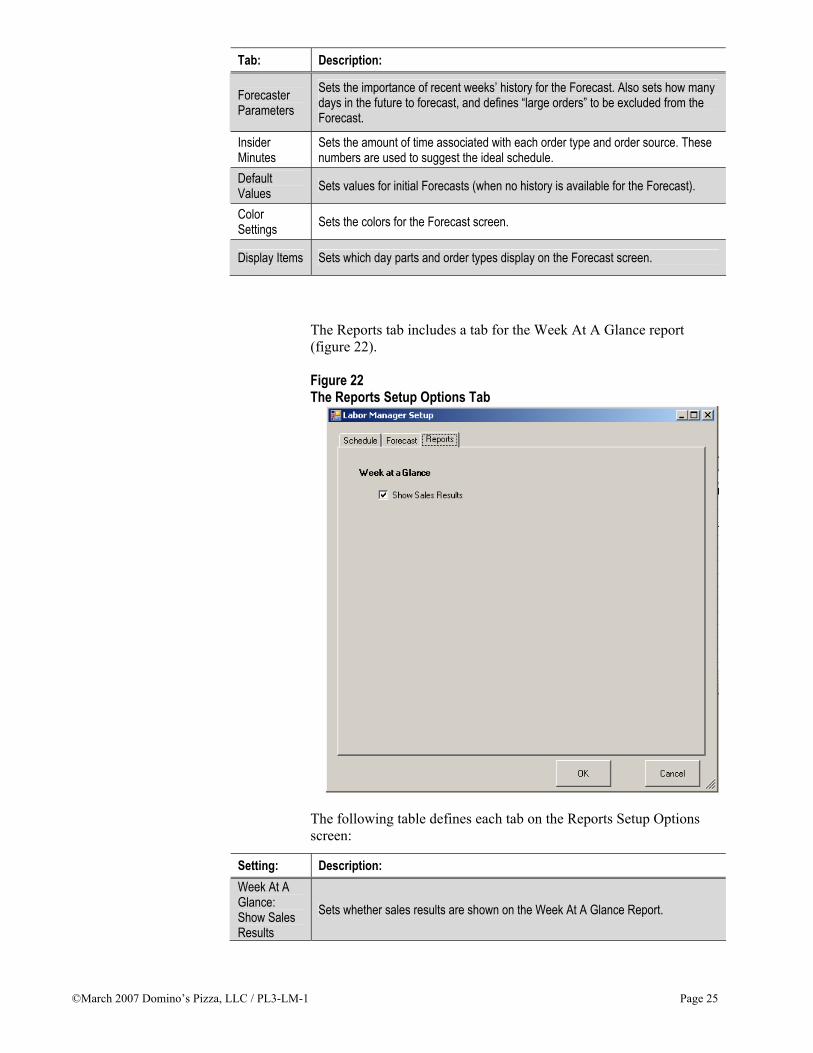
The Reports tab includes a tab for the Week At A Glance report (figure 22).
Figure 22 The Reports Setup Options Tab
The following table defines each tab on the Reports Setup Options screen:
Setting: Description: Week At A Glance: Show Sales Results
Sets whether sales results are shown on the Week At A Glance Report.
Frequently-asked Questions This section provides answers to common Labor Management
questions. Forecast How often should I adjust my Forecast? Each store is different, but in most cases you should accept the system forecast unless you have an event that could cause a 10% increase or decrease in your business. Why does the Forecast exclude large orders before suggesting a forecast? The event that generates the large order might not happen every week, or at the same time the next week. You can define the number
of items that characterize a “large order” in the Setup Options section of Labor Management. How does the Forecast use my previous sales to create a forecast? In creating a forecast, the Forecast system looks at the last eight weeks of sales data, and gives additional weight to the most recent week. The resulting mix of 75% weight for the most recent week and 25% weight to the previous seven weeks gives more consideration to recent sales trends. Each week, the Forecast system adjusts and compares those percentages in search of a more accurate mix of historical data. For the next week’s forecast, the system uses the weight that most closely matches the actual sales from the previous week:
Default Weight
Weight Up 5%
Weight Down 5%
Most Recent Week 75% 80% 70%
Seven Previous Weeks 25% 20% 30%
Should I change the Forecast by day-part or total day? It depends on the promotion, but most promotions affect an entire day so you should change the entire day. Schedule In the Metrics section, why isn’t there an entry for daily Fixed Labor? Daily fixed labor is the manager’s salary, and therefore is hidden. I like to schedule my team based on previously-worked schedules; how do I do that using the new Labor Management tool? See the section titled, How to Create a Schedule in this Guide. Use those instructions to create a new schedule, select the date of the previously-worked schedule, select Time Clock, and then select OK.
Why do I always have small areas of 'need' left on my schedule?
The Need shown on your Schedule grid is based on forecasted orders/sales and the corresponding staffing (labor) needed to handle the orders/sales volume. Since the application does not average out spikes of orders or sales for any particular 15 minute bucket you will sometimes see spikes of Need. As a manager, you should make a business decision on how to address the Need; either by scheduling someone to cover the Need spike or by ignoring the temporary Need. The decision you make should be made within the context of serving your customers while also managing your store's labor target.