Laboratory and Quality Assurance Protocols for the Analysis of Herbicides in Ground Water from the Management Systems Evaluation Area, Princeton, Minnesota By Steven J. Larson, Paul D. Capel, and Anthony G. VanderLoop U.S. Geological Survey Water-Resources Investigations Report 95-4178 Mounds View, Minnesota 1996
Transcript
Laboratory and Quality Assurance Protocols for the Analysis of Herbicides in Ground Water from the Management Systems Evaluation Area, Princeton, Minnesota
By Steven J. Larson, Paul D. Capel, and Anthony G. VanderLoop
U.S. Geological SurveyWater-Resources Investigations Report 95-4178
Mounds View, Minnesota 1996
U.S. DEPARTMENT OF THE INTERIOR
BRUCE BABBITT, Secretary
U.S. GEOLOGICAL SURVEY
Gordon P. Eaton, Director
For additional information write to: Copies of this report can be purchased from:
U.S. Geological SurveyEarth Science Information Center
District Chief Open-File Reports SectionU.S. Geological Survey Box 25286, MS 5172280 Woodale Drive Denver Federal CenterMounds View, MN 55112 Denver, CO 80225
A. Cleaning procedures.................................................................................................................................... 11. Glassware and other utensils .............................................................................................................. 22. Sodium sulfate and glass wool........................................................................................................... 2
B. Preparation of standard solutions................................................................................................................ 21. Surrogate solutions............................................................................................................................. 2
a. Surrogate stock solution.............................................................................................................. 3b. Surrogate spiking solution........................................................................................................... 3
2. Internal standard solution................................................................................................................... 33. Calibration standard solutions ............................................................................................................ 3
a. Pesticide stock solution................................................................................................................ 3b. Calibration standards................................................................................................................... 4
4. Recovery study solutions.................................................................................................................... 45. Field-spiking solutions........................................................................................................................ 5
C. Isolation of analytes from water by solid-phase extraction........................................................................ 51. Sample records.................................................................................................................................... 52. Solid-phase extraction of water samples ............................................................................................ 6
a. Solid-phase extraction records..................................................................................................... 6b. Preparation of the laboratory....................................................................................................... 6c. Preparation of SPE columns........................................................................................................ 6d. Preparation of water samples....................................................................................................... 6e. Addition of surrogate compounds ............................................................................................... 7f. Solid-phase extraction of water samples...................................................................................... 8g. Removal of residual water from SPE columns............................................................................ 8
D. Elution of target analytes and surrogate compounds from the SPE column.............................................. 81. Preparation of sodium sulfate columns............................................................................................... 82. Elution from the SPE column............................................................................................................. 8
E. Transfer of the sample extract for GC/MSD analysis................................................................................. 91. Reduction of sample extract volume.................................................................................................. 102. Transfer of sample extract.................................................................................................................. 103. Addition of internal standard solution................................................................................................ 10
F. Analysis by GC/MSD ................................................................................................................................. 111. Overview............................................................................................................................................. 112. Accessing the ChemStation software................................................................................................. 123. Tuning the MSD................................................................................................................................. 124. Setting up and running samples.......................................................................................................... 12
G. Data analysis and quantification of analyte concentrations ....................................................................... 141. Evaluation of output data.................................................................................................................... 142. Quantification of analyte concentrations............................................................................................ 16
a. Theory of the quantification........................................................................................................ 16b. Setup of quantification spreadsheet............................................................................................. 16
3. Entering results into the MSEA database............................................................................................ 17ffl. Quality assurance protocol.............................................................................................................................. 17IV. References....................................................................................................................................................... 18
111
Illustrations
Figure 1. Laboratory setup for isolation of target analytes and surrogate compounds fromwater samples by solid-phase extraction.......................................................................................... 7
2. Laboratory setup for elution of solid-phase extraction columns...................................................... 9
Tables
Table 1. Instrumental parameters used for analysis by gas chromatography and mass- selective detection ............................................................................................................................ 12
2. Mass-to-charge ratios and relative percent abundance of quantification and confirmation ions of target analytes, surrogate compounds, and internal standard compounds, and reporting limits for target analytes........................................................................ 13
Use of trade names in this report is for identification purposes only and does not constitute endorsement
by the U.S. Geological Survey.
Laboratory and Quality Assurance Protocols for the Analysis of Herbicides in Ground Water from the Management Systems Evaluation Area,
Princeton, Minnesota
By Steven J. Larson, Paul D. Capel, and Anthony G. VanderLoop
Abstract
Laboratory and quality assurance procedures for the analysis of ground-water samples for herbicides at the Management Systems Evaluation Area near Princeton, Minnesota are described. The target herbicides include atrazine, de-ethylatrazine, de-isopropylatrazine, metribuzin, alachlor, 2,6-diethylaniline, and metolachlor. The analytical techniques used are solid-phase extraction, and analysis by gas chromatography with mass-selective detection. Descriptions of cleaning procedures, preparation of standard solutions, isolation of analytes from water, sample transfer methods, instrumental analysis, and data analysis are included.
I. Introduction
The Management Systems Evaluation Area (MSEA) program is part of a multiscale, interagency initiative to evaluate the effects of agricultural management systems on water quality. The program resulted from the integration of the U.S. Department of Agriculture (USDA) Research Plan for Water Quality and the U.S. Geological Survey (USGS) Mid-Continent Herbicide Initiative, and is part of the 1990 President's Water Quality Initiative.
The USGS, Agricultural Research Service (ARS), Cooperative State Research Service (CSRS) of the USDA, and U.S. Environmental Protection Agency (USEPA) are collaborating on research at scales ranging from laboratories to small watersheds. The objectives are to: (1) measure the effect of prevailing and modified farming systems on ground- and surface-water quality; (2) understand the processes and factors affecting the fate of selected agricultural chemicals; (3) assess the projected benefits to water quality of implementing modified farming systems; (4) evaluate the socioeconomic effects of using alternative farming management systems; and (5) transfer appropriate technology for use on the land (Delin and others, 1992).
The Minnesota MSEA is located near the town of Princeton, about 60 miles northwest of Minneapolis and St. Paul. The Princeton site is located in the Anoka Sand Plain, and the specific research objective at this site is to compare the effects of a modified farming system and the prevailing farming system on ground- water quality. The modified fanning system involves irrigated ridge-tillage in a corn/soybean rotation. The prevailing farming system in the Anoka Sand Plain involves irrigated conventional tillage in continuous corn.
This report describes the procedures used for tl ° analysis of herbicides in ground-water samples from the Princeton MSEA site. Section n contains all procedures used from the time of receipt of the sample to the reporting of herbicide concentrations. Section El contains the quality assurance procedures used frr assessing the accuracy and precision of the reported results.
II. Laboratory protocolThe analysis for herbicides in ground-water samples
from the Minnesota MSEA site involves several separate steps. Herbicides are first removed (extracted) from the water samples by solid-phase extraction (SPE). The herbicides retained in the SPE columns are then removed (eluted) and concentrated into a small volume of organic solvent (the sample extract). The samp^ extract is transferred to a vial and an aliquot of the extract is injected into a gas chromatograph (GC), where any herbicides present are separated from each other. The compounds separated in the GC enter a mass selective detector (MSD), which confirms the identity and quantitatively measures the amount of each compound present. The data generated by the MSD are then used to calculate the concentrations of each of the target compounds in the original ground-water sample. These steps, and their associated laboratory proceiures, are described in detail in the following sections. "Tie sections are arranged in the order that the steps are performed when preparing for and taking a set of samples through the entire analytical procedure.
A. Cleaning proceduresAdherence to the cleaning procedures described
below is essential, because the analysis procedure described in the following sections allows the detection of pesticides in the nanogram-per-liter range. At this level, any contamination introduced during the
procedure can result in loss of accuracy and precision. In general, anything which may contact the sample at any point in the procedure should be regarded as a potential source of contamination. This includes all reagents, glassware, utensils, and work surfaces. Solvents used in all parts of the procedure must be certified as suitable for pesticide residue analysis.
I. Glassware and other utensilsWash glassware with laboratory soap and water by
brushing the inside walls of the glassware with a small brush. If the shape or size of the item does not allow for brushing, then partially fill it with soapy water and shake vigorously. For small items such as a pipette, use a Teflon squeeze bottle to force soapy water through it. Rinse all items thoroughly with tap water. Make sure that all inside parts of the item are rinsed. For small items such as a pipette, use a Teflon squeeze bottle to force tap water through the item until all soap is gone.
Use "organic-free" deionized water, such as that produced with a Milli-Q Water System (Millipore Corporation), as a final rinse to flush all internal surfaces of the glassware. Make sure all internal surfaces are rinsed by rolling the Milli-Q water around inside the glassware. When using the squeeze bottle, place the tip as close to the top of the lip of the container as possible and allow the water to run down the sides. Allow the glassware to dry on a stainless steel drying rack, preferably in an inverted position.
After washing with soap and water and rinsing with Milli-Q water, volumetric flasks, volumetric pipettes, and metal items such as forceps and spatulas are also solvent rinsed. All solvent rinsing should be done in a fume hood. First, using a Teflon squeeze bottle, rinse all surfaces which might come into contact with the sample with methanol or acetone. This will remove any residual water. Use the same technique as described above for the Milli-Q water rinse. Repeat the rinse with hexane, and finally diethyl ether. Dispose of the used solvents in a waste container marked "non-chlorinated solvent waste". Allow the cleaned items to air dry in the hood until diethyl ether vapors have dissipated. Place the items in an oven at 110 degrees Celsius (°C) for a minimum of 2-3 hours. Take appropriate precautions to prevent contact of the cleaned items with the sides of the oven. Tightly cover all openings of glassware and any parts of utensils that may come in contact with water samples with aluminum foil.
Vial inserts used in the autosampler vials (SectionII.E.) have a plastic ring, and should not be put in the oven. The vial inserts do not need to be washed with soap and water, but they must be solvent rinsed before use. Use Teflon squeeze bottles to rinse the inside of the
vial inserts, first with methanol, then hexane, ard then diethyl ether. Rinse three times with each solvent. Place the rinsed vial inserts in a beaker, cover loosely with aluminum foil, and allow the diethyl ether vapors to dissipate in a fume hood. Place the beaker in a warm area for several hours (such as on top of an oven) to evaporate any remaining ether. Store the vial irserts in the beaker and tightly cover with aluminum foil.
All other glassware is baked in a temperature- programmable kiln (Paragon DTC 600) to remove organic contaminants. Before baking in the kiln, all items must be washed with soap and water and rinsed with organic-free water, as described above. Glassware baked in the kiln does not need to be solvent rir^ed. The temperature in the kiln is increased from rcom temperature at a rate of 200°C per hour to 550°C, held at 550°C for six hours, and then decreased to room temperature at a rate of 200°C per hour. The controlled increase and decrease in temperature is necessa-y to prevent cracking of the amber bottles used for the water samples. Take appropriate precautions to prevent contact of glassware openings with the sides of the kiln and to prevent material from falling into glassware. After glassware and other utensils are cleaned and dried, remove them from the oven or kiln and allow tHm to cool. Thoroughly cover all openings of glassware with aluminum foil, dull side toward the clean glassware surface.
2. Sodium sulfate and glass woolGranular sodium sulfate and glass wool a~e used
during the elution of compounds from the solid-phase extraction column (Section E.D.). Before use, organic contaminants must be removed from the sodium sulfate and glass wool by baking in the kiln at 550°C f ">r a minimum of six hours. The sodium sulfate or glass wool is placed in clean Pyrex beakers during brking. After baking, store the sodium sulfate in a cove-ed container in an oven at 110°C to keep it anhydrous. The baked glass wool should be stored in a covered jar or beaker.
B. Preparation of standard solutionsAll reagent herbicide and surrogate compounds used
for preparation of standard solutions were "Pestanal" reagents obtained from Crescent Chemical Company. The internal standard compound was obtained from Supelco, Inc.
1. Surrogate solutionsSurrogate compounds are added to each wate~ sample
to measure the accuracy of the analysis procedure. The surrogate compounds are chemicals similar in structure to the compounds being measured in the water samples.
A surrogate stock solution, containing known amounts of terbutylazine and butachlor, is first prepared. The surrogate stock solution is used for preparation of both the surrogate spiking solution and the calibration standard solutions (Section H.B.3.).
a. Surrogate stock solutionAdd about 30 milliliters (mL) of methanol to a 100
mL volumetric flask. Weigh approximately 200 milligrams (mg) of terbutylazine in a small plastic weighing boat, and quantitatively transfer it to the 100 mL flask. Record the actual mass of terbutylazine to the nearest 0.1 mg. Use methanol to rinse all residue from the weighing boat into the flask. Rinse down the neck of the flask with methanol after the addition. Repeat the procedure with approximately 200 mg of butachlor. Swirl the flask to help dissolve the compounds. Fill the flask to the 100 mL mark with methanol, making sure the contents are at room temperature. Stopper the flask, mix well, and transfer to 125 mL amber bottles. Label the bottles with "surrogate stock solution" and the date of preparation. Cap the bottles tightly with Teflon-lined caps (or line the cap with aluminum foil). Store the solution in the freezer when not in use.
b. Surrogate spiking solutionAdd about 300 mL of methanol to a 1 liter (L)
volumetric flask. Add 5 mL of surrogate stock solution (Section H.B.l.a.) to the flask, using a 5 mL volumetric pipet. The surrogate stock solution must be at room temperature before withdrawing the 5 mL. Fill the flask to the 1-L mark with methanol, making sure the contents are at room temperature. Stopper the flask, mix well, and transfer to amber bottles. Label the bottles with "surrogate spiking solution" and the date of preparation. Cap the bottles tightly with Teflon-lined caps (or line the caps with aluminum foil). Store the solution in the freezer when not in use.
A 50 microliter (joL) aliquot of this solution is added to all samples in the extraction step (Section n.C.2.e). The mass of surrogate added to water samples in the 50 joL spike is approximately 500 nanogram (ng). The actual mass added depends on the actual masses of terbutylazine and butachlor used in the preparation of the surrogate stock solution.
2. Internal standard solutionAdd about 300 mL of methanol to a 1-L volumetric
flask. Weigh approximately 150 mg of 4,4'-dibromobiphenyl in a small plastic weighing boat, and quantitatively transfer to the 100 mL flask. Record the actual mass of 4,4'-dibromobiphenyl to the nearest 0.1 mg. Use methanol to rinse all residue from the weighing boat into the flask. Rinse down the neck of
the flask with methanol after the addition. Swirl the flask to help dissolve the compound. Fill the flasl to the 1-L mark with methanol, making sure the content are at room temperature. Stopper the flask, mix well, and transfer to amber bottles. Label the bottles with "internal standard solution" and the date of preparation. Cap the bottles tightly with Teflon-l :ned caps (or line the caps with aluminum foil). Store the solution in the freezer when not in use.
This solution is used for adding an internal standard to the sample vials just before injection on the ga^ chromatograph (Section HE.3). Adding 3 joL of this solution to each sample vial adds approximately 450 ng of 4,4'-dibromobiphenyl to the sample extract. The actual amount added depends on the exact amoun* of the compound weighed out in the preparation of the solution.
3. Calibration standard solutionsCalibration standards are included with each group of
samples analyzed on the gas chromatograph/mas^ selective detector (GC/MSD). These standards contain all of the analyte compounds, surrogate compounds, and the internal standard compound, and are used to quantify the amount of each analyte and surrogate compound in the samples. A stock solution is first prepared, containing all analytes and surrogate compounds. Three calibration standard solutions- are prepared from the stock solution, each containing a different concentration of the analytes and surrogate compounds.
a. Pesticide stock solutionAdd about 300 mL of methanol to a 1-L volumetric
flask. Weigh approximately 50 mg of each of the following compounds in a small plastic weighing boat and quantitatively transfer to the 1-L volumetric flask:
alachlor
atrazine
de-ethylatrazine
2,6-diethylaniline
de-isopropylatrazine
metolachlor
metribuzin
Record the actual mass of each compound added to the nearest 0.1 mg. Use methanol to rinse all res: due from the weighing boat into the flask. Rinse down the neck of the 1-L volumetric flask with methanol after each compound is added. Surrogate compounds (terbutylazine and butachlor) are added from the
surrogate stock solution (Section HB.l.a.). Add 25 mL of the surrogate stock solution to the 1-L flask, using a volumetric pipet. The surrogate stock solution must be at room temperature before withdrawing the 25 mL. Rinse the neck of the flask with methanol after adding the surrogate solution. When all compounds, including surrogates, have been added, swirl the flask to help dissolve the added compounds. Fill the flask to the 1-L mark with methanol, making sure that the contents are at room temperature. If some compounds are still undissolved, it may be necessary to add a magnetic stirring bar (after filling the flask to volume), and stir the contents for several hours. When completely dissolved, stopper the flask, mix well, and transfer to amber bottles. Label the bottles with "pesticide stock solution" and the date of preparation. Cap the bottles tightly with Teflon-lined caps (or line the caps with aluminum foil). Store the solution in the freezer when not in use.
b. Calibration standards
Standard 1 Add about 60 mL of methanol to a 200- mL volumetric flask. Add 1 mL of the pesticide stock solution to the flask, using a volumetric pipet. Rinse the neck of the flask with methanol. To the same flask, add 2 mL of the internal standard solution, using a volumetric pipet. Rinse the neck of the flask with methanol. To the same flask, add 50 |iL of surrogate stock solution, using a 50 |iL syringe. (This additional amount of surrogate solution is added so that the amount of the surrogate compounds in the standards are similar to the amount spiked into the samples.) Fill the flask to the 200 mL mark with methanol, making sure that the contents are at room temperature. Stopper the flask, mix well, and transfer to amber bottles. Cap the bottles tightly with Teflon-lined caps (or line the caps with aluminum foil). Store the solution in the freezer when not in use.
Standard 2 Add about 30 mL of methanol to a 100- mL volumetric flask. Following the same procedures as for Standard 1, add 1 mL of pesticide stock solution, 1 mL of internal standard solution, and 50 |iL of surrogate stock solution. Fill the flask to the 100-mL mark with methanol, making sure that the contents are at room temperature. Stopper the flask, mix well, and transfer to amber bottles. Cap the bottles tightly with Teflon-lined caps (or line the caps with aluminum foil). Store the solution in the freezer when not in use.
Standard 3 Add about 30 mL of methanol to a 100- mL volumetric flask. Following the same procedures as for Standard 1, add 2 mL of pesticide stock solution, 1 mL of internal standard solution, and 100 |iL of surrogate stock solution. Fill the flask to the 100-mL mark with methanol, making sure that the contents are at
room temperature. Stopper the flask, mix well, and transfer to amber bottles. Cap the bottles tight!;' with Teflon-lined caps (or line the caps with aluminum foil). Store the solution in the freezer when not in use.
When prepared as described, the concentrations in the standards are approximately:
Standard 1 Standard 2 Standard 3Herbicides 0.25 ng/[iL 0.50ng/[iL l.Ong/uL
Surrogates .30ng/uL .60ng/[iL 1.20ng/uL
Internal standard 1.5ng/(xL 1.5ng/L 1.5ng/uL
Actual concentrations depend on the exact rrass of each compound added in the preparation of the stock solutions.
4. Recovery study solutions
In association with each sampling cycle, a recovery study is conducted in which solutions containing known amounts of the analytes and surrogates are processed through the entire analysis procedure exactly a? if they were actual samples. The results from the recovery studies give an indication of the accuracy and precision of the procedures used in the laboratory. For erch recovery study, two solutions containing different concentrations of the analytes and surrogates are analyzed in triplicate. The solutions are prepared as follows:
Make a dilution of the pesticide stock solution by pipetting 2 mL of the stock solution into a 250-mL volumetric flask. The pesticide stock solution must be at room temperature before withdrawing the 2 mL. Fill the flask to the 250-mL mark with methanol. Stopper the flask, mix well, and transfer to an amber bottle. Cap the bottle with a Teflon-lined cap (or line the c?n with aluminum foil), and label the bottle as "diluted pesticide stock solution - 2 mL into 250 mL". On the lal ?1, note the date prepared, and the date the stock solution was prepared. Store the solution in the freezer when not in use.
Weigh approximately 2,000 grams (g) of organic-free water into each of two 4-L amber bottles. Record the actual weight of water added to each bottle to the nearest 0.1 g. Label the bottles "Solution A" and "Solution B", and include the date prepared. Put a large magnetic stirring bar in each bottle, and place each bottle on a magnetic stirring device. While the solution is stirring, use a volumetric pipet to transfer 1 mL of the diluted pesticide stock solution (at room temperature) to the water in the "Solution A" bottle. Direct the stream from the pipet into the vortex formed by the stir bar. Touch the tip of the pipet to the inside surface of the bottle or the surface of the water when the transfer is
complete. Cap the 4 L bottle with a Teflon-lined cap (or line the cap with aluminum foil), and shake the bottle vigorously to completely mix the solution. Using the same procedure, pipet 4 mL of the diluted pesticide stock solution into the water in the "Solution B" bottle. Store the bottles at 4°C until ready to use. The concentration of each of the herbicides and surrogate compounds is approximately 200 ng/L in "Solution A", and 800 ng/L in "Solution B". The actual concentrations depend on the exact mass of each compound added in the preparation of the pesticide stock solution. Solutions A and B should be newly prepared from the diluted pesticide stock solution for each recovery study.
5. Field spiking solutionsEach sampling cycle, several samples are spiked in
the field with solutions containing known amounts of the analytes and surrogates (see Section HI). Two concentration levels are used for field spiking of water samples. The solutions are prepared as follows:
Using a volumetric pipet, transfer 2 mL of the pesticide stock solution (Section II.B.3.a) (at room temperature) to a 100-mL volumetric flask. Fill the flask to the 100-mL mark with methanol. Stopper the flask, mix well, and transfer to two amber bottles. Cap the bottles tightly with Teflon-lined caps (or line the caps with aluminum foil). Label the bottles as "MSEA Field Spiking Solution - Low". Using a 4-mL volumetric pipet, transfer 4 mL of pesticide stock solution to a second 100-mL volumetric flask. Fill the flask to the 100-mL mark with methanol. Stopper the flask, mix well, and transfer to amber bottles. Cap the bottles tightly with Teflon-lined caps (or line the caps with aluminum foil). Label the bottles as "MSEA Field Spiking Solution - High". On the labels, note the date prepared, and the date the pesticide stock solution was prepared. Store the solutions in the freezer when not in use. Keep one bottle of each solution in the freezer, and use another bottle of each solution for the field spiking. In the field-spiking procedure, 50 (J.L of one of the solutions is added to a water sample. For a 1-L water sample, the resulting concentration of each of the herbicides and surrogate compounds is approximately 50 ng/L for samples spiked with the "Low" solution, and 100 ng/L for samples spiked with the "High" solution. The actual concentrations depend on the exact mass of each compound added in the preparation of the pesticide stock solution.
C. Isolation of analytes from water by solid-phase extraction
Solid-phase extraction (SPE) is an analytical technique in which organic chemicals are extracted from
a water sample into a SPE column. In this section, the necessary record-keeping procedures are described. The procedures used to extract the analytes and surrogates from water samples are then described. Finally, the preparation of the SPE columns for the subsequent elution of the analytes and surrogates from the SPE columns into a small volume of organic so1 vent (Section HD.) is described.
1. Sample records
Before beginning the analysis of water samples, it is important to keep an accurate record of samples received in the laboratory. All water samples received are assigned a unique laboratory identification nurrber (laboratory ID number) which is recorded in a log book (the sample log book). Four laboratory blanks are analyzed along with the water samples from each sampling period. The laboratory blanks consist of organic-free water, obtained in the laboratory, and are analyzed as if they were actual samples to measure potential contamination caused by laboratory procedures. As samples are recorded and assigned laboratory ID numbers, a laboratory ID number should be reserved for a laboratory blank every 30-40 samples, so that they are analyzed periodically throughout tH sampling period. All other quality-assurance samp1<s s, including field blanks, field spikes, and recovery study samples, are also assigned a laboratory ID number. Write the laboratory ID number on the label of the sample bottle with a water resistant marker. The following information must also be recorded in the sample log book for each sample:
1) date received in the laboratory
2) field identification code (identification code written on sample bottle label when sample ir collected)
3) date of sample collection
4) time of sample collection (if noted on label)
Items 2 through 4 should already have been written on the label when the sample was collected. For quality-assurance samples, all pertinent information should be recorded in the sample log book at the time the sample is recorded. This includes the identity of the sample (field spike, laboratory blank, field blank, o~ recovery study sample), the date prepared (for recovery study samples), and where data showing how the sample was prepared (for field spikes and recovery study samples) are located. After recording the samples, store them at 4°C until solid-phase extraction.
2. Solid-phase extraction of water samples
a. Solid-phase extraction recordsInformation pertinent to the extraction of the samples
is recorded in a second log book (solid-phase extraction log book). The following information must be recorded in the log book for each sample:
1) laboratory ID number
2) field identification code
3) date of solid-phase extraction
4) volume extracted (mL)
5) date of preparation of surrogate spiking solution
6) volume of surrogate spiking solution added
b. Preparation of the laboratoryThis procedure is written for the solid-phase
extraction of six water samples simultaneously. For the first part of this procedure, the following materials are needed:
aluminum foil
six 5 -gram octadecyl solid-phase extraction columns (Varian)
methanol
diethyl ether
Teflon squeeze bottle of methanol
Teflon squeeze bottle of organic-free water
surrogate spiking solution (see Section H.B.l.b)
micropipetting device and 50-pL capillary tubes
10-mL or 25-mL graduated cylinder
six ring stands and rings
100-mL beaker
250-mL beaker for waste
analytical balance (able to weigh 1,500 g in 1-g increments)
six glass funnels with ground glass fittings (fig. 1)
vacuum elution apparatus with pressure gauge (Vac- Elut, Varian)
water-resistant marker
container marked "non-chlorinated solvent waste"
centrifuge (IEC Corporation, model HN-SII)
cylinder of compressed carbon dioxide
Place a clean piece of aluminum foil down on the working surface (dull side up) to help prevent contamination. Before starting the procedure, samples must be recorded in the solid-phase extraction log book. Use a water-resistant marker to label each SPE column with the laboratory ID number of the sample to be extracted. The extractions should be done in a well ventilated area or in a fume hood.
c. Preparation of SPE columnsThe first step in the procedure is to clean the SPE
columns. Place the bottom tips of the SPE columns in the holes on the top of the Vac-Elut vacuum apparatus (fig. 1). Pour about 8 mL of diethyl ether into each SPE column and turn on the vacuum. (Caution: Diethyl ether is extremely flammable, volatile, and acts as air anesthetic. Avoid breathing fumes and work with adequate ventilation.) A collection flask should be connected between the extraction apparatus and the vacuum source for collection of the solvents used in the cleaning step. After the diethyl ether has passed through the SPE column. Add about 8 mL of methanol to each column. Allow the methanol to pass through the SPE column. Add about 12 mL of organic-free water to each SPE column and allow it to pass through the column until the water level is about 1 cm above the SPE packing material. This water must remain in tl ~ SPE column to keep the packing wet. Break the vacuum to prevent the remaining water from being pulled through the SPE column. Dispose of the water/solvent mixture in the collection flask in a container marked "non- chlorinated solvent waste".
d. Preparation of water samplesFunnels for holding the water sample during the
extraction step were custom made. The funnels are made of heavy-duty Pyrex glass to prevent breakage and to allow them to be baked in the kiln. They am approximately 25 cm long, and the top opening is approximately 13 cm in diameter. The narrow end is a standard 24/40 ground-glass fitting, which fits tightly into the top of the SPE column (fig. 1). Place a glass funnel on each ring stand and tightly connect the ground-glass opening of the glass funnel to the top opening of the SPE column. Adjust the ring stand so that it will hold the funnel in place.
Remove the cap from the sample bottle, pla~e the bottle on the analytical balance, and record the initial weight to the nearest 0.1 gram. Pour approximately 350 mL into the funnel and re-weigh the bottle. Record the final weight. The difference between the two weights, in grams, is used as the volume of water extracted, in milliliters. Record both weights on the left-hard page of the solid-phase extraction log book on the sarre line as
Glass funnel
Ring stand
24/40 Ground-glass joint
Solid-phase extraction column
Vacuum device (Vac-Elut)
To vacuum
Figure 1. Laboratory setup for isolation of target analytes and surrogate compounds from water samples by solid-phase extraction (SPE).
the laboratory ID number for the sample. The volume extracted should not exceed 380 mL. If the volume of water is too large, a portion of one or more of the target compounds may pass through the column without being retained (breakthrough). Smaller volumes can be used if the total sample volume is less than 350 mL, but the method-detection limits for the analytes will be higher.
e. Addition of surrogate compounds
To determine the accuracy of the entire analytical procedure, compounds similar to the target analytes (surrogates) are added to the water in the funnel and taken through the procedure. Directions for preparing the surrogate spiking solution are given in Section II.B.l.b. Add 50 jiL of the surrogate spiking solution to the water in the funnel as follows:
1) Remove the surrogate spiking solution from the freezer and allow it to warm to room temperature.
2) Rinse the glass capillary tube of the micropipet with methanol by pressing the plunger down and drawing 50 JiL of methanol up from a 100 mL beaker. Inject the methanol into a waste beaker. Repeat this procedure three times.
3) While holding the micropipet plunger down, rinse the outside of the tip with methanol using the squeeze bottle. Allow the methanol to evaporate from the tip.
4) Draw up 50 JO.L of surrogate spiking solution from the surrogate spiking solution bottle, submerge the tip of the capillary tube just below the surface of the water in the funnel, and inject. Keep the
plunger held down until the glass capillary tube is withdrawn from the water.
5) Repeat steps 2 through 4 for the other samples.
6) Clean the micropipet as in steps 2 and 3 before storing.
7) Cap the surrogate bottle and return to the freezer.
f. Solid-phase extraction of water samplesTurn on the vacuum and adjust it so that the water
flows through the SPE column at a rate of about 10 mL per minute. This corresponds to a gauge pressure of about 14 inches of mercury on the vacuum gauge attached to the Vac-Elut device. After all of the water has passed through the SPE column, continue to draw a vacuum through the SPE column for about ten minutes. Wrap the SPE columns in aluminum foil and store at 4°C, unless the next step in the procedure is to be done immediately.
g. Removal of residual water from SPE columnsA centrifuge is used to remove most of the residual
water from the SPE columns. Place the SPE columns in opposite centrifuge tubes and centrifuge for 30 minutes at 5,000 revolutions per minute. An even number of samples must be centrifuged at one time. Set the timer, speed, and power switch on. Make sure the brake is on automatic and close the centrifuge cover securely. After the centrifugation step, purified carbon dioxide (CO2) gas is blown through each SPE column for two hours to complete the removal of water. The carbon dioxide is blown through six columns at one time by means of a manifold. The pressure gauge on the carbon dioxide cylinder is set at about 30 psi, so that the pressure is approximately 5 psi for each tube. After this final water removal step, the SPE columns are wrapped with aluminum foil and stored at 4°C until the elution step (Section II.D.2).
D. Elution of target analytes and surrogate compounds from the SPE column
The target analytes and surrogate compounds are eluted from the SPE columns with diethyl ether. The eluate first passes through a glass column containing a layer of sodium sulfate to remove any remaining water and then into glass centrifuge tubes. The conical shape of the bottom of the centrifuge tubes allows the volume to be reduced to approximately 200 |iL later in the procedure. The equipment setup is shown in Figure 2.
1. Preparation of sodium sulfate columnsGlass columns for elution of the analytes from the
SPE columns were custom made. The columns were constructed from heavy-duty Pyrex glass, to prevent
breakage and to allow them to be baked in the kiln. The approximate dimensions are: 13 millimeters (mm) inner diameter, 16 mm outer diameter, and 25 cm length. The tube narrows to a point at one end, and the inner diameter of the outlet is approximately 2 mm. The top of the column is slightly flared to allow the column to be held in a holder. The following items are needed for preparing the columns:
glass columns (up to 12)
forceps
granular anhydrous sodium sulfate
glass wool
glass or metal packing rod
spatula
latex gloves
aluminum foil
When adding the sodium sulfate to the glass columns, first place a piece of aluminum foil on the counter top to provide a clean working surface. Wearing latex gloves to protect hands from the glass wool, use the forceps to pull off a piece of glass wool. As much as possible, avoid touching the glass wool with the gloves. Use the packing rod to pack the glass wool plug against the narrow opening at the bottom of the glass column. Use enough glass wool to ensure that it sufficiently plugs the opening. Use the spatula to place a layer of sodium sulfate approximately 3 cm thick above the glass wool plug.
2. Elution from the SPE columnAnalytes can be eluted from up to 12 SPE columns
simultaneously by using a custom-made SPE column holder (fig. 2). The holder is constructed of wood, with 12 sets of 3 holes for holding the SPE column, the glass column, and the glass centrifuge tube. The following items are needed for elution:
holder for SPE columns, glass columns, and centrifuge tubes
up to 12 SPE columns, centrifuged, and dried with carbon dioxide
diethyl ether
air-pressure hose with rubber stopper attached at one end
compressed air, nitrogen, or carbon dioxide
up to 12 metal caps
up to 12 glass columns containing sodium sulfate
up to 12 glass centrifuge tubes (50 mL), with caps
Wooden frame
Solid-phase extraction (SPE) column
C-18 packing material
Glass column
Sodium sulfate
Glass wool plug Centrifuge tube
Figure 2. Laboratory setup for elution of the solid-phase extraction (SPE) columns (the setup for elution of one SPE column is shown).
100 mL beaker
water-resistant marker
labeling tape
aluminum foil
Place the glass columns in the middle holes of the holder. Place the SPE columns to be eluted in the holes at the top of the holder, so that the outlet of each SPE column is centered in the upper end of the glass column below it. For each SPE column to be eluted, label a glass centrifuge tube with the laboratory ID number written on the SPE column to be eluted (use labeling tape). Place the centrifuge tubes in the holes at the bottom of the holder, so that the outlet of the glass column is centered over the top of the centrifuge tube.
After all of the glassware is in place and correctly labeled, use the 100-mL beaker to fill each SPE column to the top with diethyl ether (about 15 mL). Place metal caps over the top of each SPE column to minimize evaporation of the ether. Allow the ether to drip through the SPE and glass columns into the centrifuge tube. When the liquid above the SPE packing is gone, add 10
more mL of diethyl ether to the SPE column. This will replace all of the diethyl ether in the SPE packing and sodium sulfate. Again, allow the ether to drip through. When the liquid above the SPE packing is gone, use the air-pressure hose to force diethyl ether trapped in the SPE packing into the sodium sulfate column. Connect the end without a stopper to a source of compressed air or other pure gas. Open the valve so that the flow rate is just sufficient to be felt on the fingertips at the outlet. Place the rubber stopper over the top of the SPE column to gently force the solvent through. The SPE column is discarded when elution is complete. Cover the glass centrifuge tubes containing the sample extract with aluminum foil, cap the tube, and store at 4°C until ready for transfer of the extract to vials for the GC/MSD analysis.
E. Transfer of the sample extract for GC/MSD analysis
This step involves evaporating solvent from the centrifuge tube containing the sample extract to reduce the volume from approximately 20 mL to approximately 200 (oL, quantitatively transferring the sample extract to
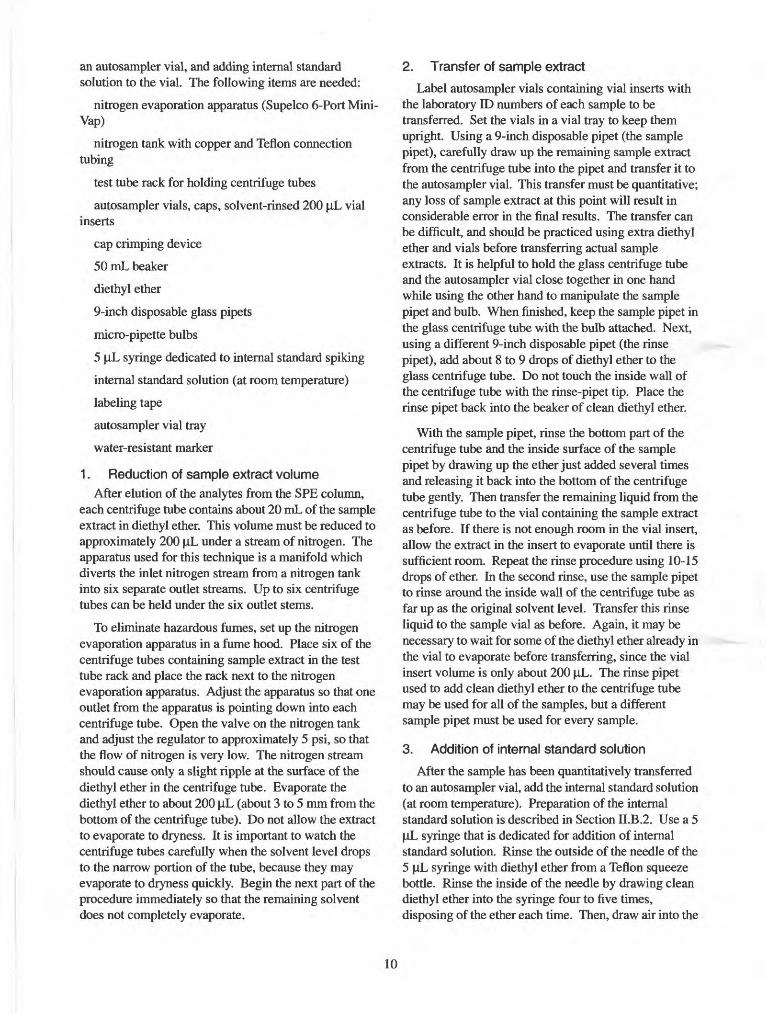
an autosampler vial, and adding internal standard solution to the vial. The following items are needed:
nitrogen tank with copper and Teflon connection tubing
test tube rack for holding centrifuge tubes
autosampler vials, caps, solvent-rinsed 200 (iL vial inserts
cap crimping device
50 mL beaker
diethyl ether
9-inch disposable glass pipets
micro-pipette bulbs
5 |LiL syringe dedicated to internal standard spiking
internal standard solution (at room temperature)
labeling tape
autosampler vial tray
water-resistant marker
1. Reduction of sample extract volumeAfter elution of the analytes from the SPE column,
each centrifuge tube contains about 20 mL of the sample extract in diethyl ether. This volume must be reduced to approximately 200 (iL under a stream of nitrogen. The apparatus used for this technique is a manifold which diverts the inlet nitrogen stream from a nitrogen tank into six separate outlet streams. Up to six centrifuge tubes can be held under the six outlet stems.
To eliminate hazardous fumes, set up the nitrogen evaporation apparatus in a fume hood. Place six of the centrifuge tubes containing sample extract in the test tube rack and place the rack next to the nitrogen evaporation apparatus. Adjust the apparatus so that one outlet from the apparatus is pointing down into each centrifuge tube. Open the valve on the nitrogen tank and adjust the regulator to approximately 5 psi, so that the flow of nitrogen is very low. The nitrogen stream should cause only a slight ripple at the surface of the diethyl ether in the centrifuge tube. Evaporate the diethyl ether to about 200 (iL (about 3 to 5 mm from the bottom of the centrifuge tube). Do not allow the extract to evaporate to dryness. It is important to watch the centrifuge tubes carefully when the solvent level drops to the narrow portion of the tube, because they may evaporate to dryness quickly. Begin the next part of the procedure immediately so that the remaining solvent does not completely evaporate.
2. Transfer of sample extract
Label autosampler vials containing vial inserts with the laboratory ID numbers of each sample to be transferred. Set the vials in a vial tray to keep them upright. Using a 9-inch disposable pipet (the sample pipet), carefully draw up the remaining sample extract from the centrifuge tube into the pipet and transfer it to the autosampler vial. This transfer must be quantitative; any loss of sample extract at this point will result in considerable error in the final results. The transfer can be difficult, and should be practiced using extra diethyl ether and vials before transferring actual sample extracts. It is helpful to hold the glass centrifuge tube and the autosampler vial close together in one hand while using the other hand to manipulate the sample pipet and bulb. When finished, keep the sample pipet in the glass centrifuge tube with the bulb attached. Next, using a different 9-inch disposable pipet (the rinse pipet), add about 8 to 9 drops of diethyl ether to the glass centrifuge tube. Do not touch the inside wall of the centrifuge tube with the rinse-pipet tip. Place the rinse pipet back into the beaker of clean diethyl ether.
With the sample pipet, rinse the bottom part of the centrifuge tube and the inside surface of the sample pipet by drawing up the ether just added several times and releasing it back into the bottom of the centrifuge tube gently. Then transfer the remaining liquid from the centrifuge tube to the vial containing the sample extract as before. If there is not enough room in the vial insert, allow the extract in the insert to evaporate until there is sufficient room. Repeat the rinse procedure using 10-15 drops of ether. In the second rinse, use the sample pipet to rinse around the inside wall of the centrifuge tube as far up as the original solvent level. Transfer this rinse liquid to the sample vial as before. Again, it may be necessary to wait for some of the diethyl ether already in the vial to evaporate before transferring, since the vial insert volume is only about 200 (iL. The rinse pipet used to add clean diethyl ether to the centrifuge tube may be used for all of the samples, but a different sample pipet must be used for every sample.
3. Addition of internal standard solution
After the sample has been quantitatively transferred to an autosampler vial, add the internal standard solution (at room temperature). Preparation of the internal standard solution is described in Section II.B.2. Use a 5 |LiL syringe that is dedicated for addition of internal standard solution. Rinse the outside of the needle of the 5 |LiL syringe with diethyl ether from a Teflon squeeze bottle. Rinse the inside of the needle by drawing clean diethyl ether into the syringe four to five times, disposing of the ether each time. Then, draw air into the
10
syringe repeatedly until all ether has evaporated from inside the syringe barrel. Draw internal standard solution into the syringe and move the plunger up and down several times with the needle tip still immersed in the solution. This will expel any air bubbles from the syringe barrel. Draw up 3.0 [iL of internal standard solution and inject it into the sample vial. Hold the tip of the syringe just under the level of the liquid in the vial insert while injecting. Withdraw the needle from the vial with the plunger held down to avoid withdrawing any liquid from the vial insert. For each sample vial, repeat the syringe needle rinsing procedure before adding the internal standard solution. When internal standard solution has been added to all samples being prepared, return the internal standard solution to the freezer.
To increase the sensitivity of the analysis, allow the solvent in the sample vial to evaporate to a point where the insert is about two-thirds full before capping. Vial caps are used as received from the supplier, without being cleaned in the laboratory. Cap the autosampler vial using the crimping device. After capping, check to see that the seal is tight by manually trying to turn the cap. Check to see that the label on each vial is legible.
Store all samples in a vial tray in the freezer until the GC/MSD analysis.
F. Analysis by GC/MSD
1. OverviewThe analytes, internal standards, and surrogate
compounds in the sample vial are separated using gas chromatography (GC). Individual compounds are then identified and quantified using a mass-selective detector (MSD). The instrumental system described in this section includes an HP (Hewlett-Packard) 5890 Series II Gas Chromatograph equipped with an HP 7673 autosampler and an HP 5971A Mass Selective Detector. The system is controlled with the HP G1034B GC/MSD (ChemStation) software package running on an HP Vectra 486/33 computer. A complete description of the setup, operation, and maintenance of these instruments is beyond the scope of this report. Important information is contained in the documentation provided with the instruments (Hewlett-Packard, 1989, 1990a,b,c). Only information pertinent to the method used for analysis of herbicides in the MSEA samples is presented here. A brief general description of the processes involved in the chromatographic separation and mass selective detection of the compounds of interest is given below.
The GC basically consists of a capillary gas- chromatographic column and an oven. When a sample
is injected into the GC, it is forced into the GC col imn by a carrier gas (helium). The inside of the colum'1 is coated with a material for which certain organic compounds have a greater affinity than others. Th? affinity of a specific compound for this material is determined by the chemical structure of the compound. The differential affinity of compounds for the column material results in a separation of compounds as they pass through the column. The oven temperature can be controlled through the ChemStation software to achieve the required separation.
As compounds exit from the end of the GC colrrnn, they enter the MSD. The MSD primarily consists of an ionization chamber, a magnetic field, and an electron multiplier detector. Molecules entering the ionization chamber are broken into fragments and ionized. The ions pass through the magnetic field, where they can be separated according to their mass-to-charge ratio. The ionized fragments are directed to the electron mult :olier detector, where the abundance of fragments of different masses are measured. The pattern of fragments fo*med in the MSD is unique for each compound, and can be used for identification. Thus, the MSD can be used to determine both the identity and the amounts of compounds exiting the GC column.
A number of operating parameters for the GC and MSD determine the sensitivity and resolution of the analysis. These are determined in the initial setup of the method used for the analysis. A complete description of the procedure used to develop the method is beyond the scope of this report. Method development is discussed in detail in the operating manuals for the GC and MSD (Hewlett-Packard, 1990a,b,c). GC and MSD operating conditions used in the analysis for herbicides in water samples from the Princeton MSEA are shown in Table 1. For this analysis, the MSD is operated in the seb-cted ion monitoring (SIM) mode. In the SIM mode, the chromatographic run is divided into time intervals during which only ions of specific masses are monitored by the MSD. Each time interval includes the chromatographic retention time of a specific compound or compounds. Two to three ion masses are monitored for each analyte or surrogate compound. For each compound, the ion mass with the greatest abundance (the quantification ion) is used to determine the arrount of the compound present in the sample. One to two additional ions (confirmation ions) are monitored for each compound (except for internal standards) to confirm the identity of the compound. The chromatographic retention times and the quantification and confirmation ions of the analytes, surrogate compounds, and internal standards in the MSEA method
11
Table 1. Instrumental parameters used for analysis by gas chromatography and mass-selective detection (GC/MSD).
Column: Phase: Length:Internal diameter: Film thickness:
DB-5 (J&W, Inc.)30 meters0.25 millimeters0.25 microgramsAutosampler (HP 7673)Splitless2 microliters270°CHelium0.9 milliliters per minute0.75 minutes100°C5 minutes6°C per minute280°C35 minutesMass selective detector35 to 40 millitorrAutotune based on perfluorotributylamine (PTFBA)Approximately 190°CSelective ion monitoring
are shown in Table 2. These are determined in the initial setup of the GC/MSD method, using the ChemStation software. In the following sections, the step-by-step procedures for analyzing samples by GC/MSD are described.
2. Accessing the ChemStation softwareThe HP ChemStation software operates within the
Windows operating system. Type "WIN" after the DOS prompt that appears upon turning on the computer. Then double click on the "Windows Applications" icon with the mouse and from there double click on the "GC/MSD" icon.
3. Tuning the MSDThe MSD should be tuned before each set of samples.
In the tuning procedure, a chemical is automatically released within the MSD, and the resulting mass spectrum is evaluated by the software. Adjustments are automatically made in various internal settings to improve peak shape, calibrate the mass axis, and increase sensitivity. To tune the MSD, choose "Standard Autotune" from the 'Tune MS" menu. When the tune is completed, a report is printed showing the results. The report should be examined, and the results
compared with values given in the MSD manual. If the results of the tune do not meet the requirements stated in the manual, adjustments or cleaning may be necessary. Consult the manual if this occurs. Keep the printed tune reports in a file in chronological order so that trends in MSD performance can be monitored.
4. Setting up and running samples
There are several things to check before running a set of samples. Make certain that there is sufficient disk space on the computer to store all of the data fibs that will be generated during the run. Each injection generates a data file which takes approximately 0.21 megabytes of disk space. A typical run of 20 samples, 9 standards, and 3 hexane rinses needs approximately 6.4 megabytes of disk space. The septum on the GC injection port should be changed if more than 200 injections have occurred since the last change. This prevents a small hole from developing in the septum due to too many punctures from the syringe needle. Fill the two solvent vials on the autosampler with fresh hexane to ensure that the syringe needle will be cleaned
12
Table 2. Mass-to-charge ratios and relative percent abundance of quantification and confirmation ions oftarget analytes, surrogate compounds, and internal standard compounds, and reporting limits for target
analytes (Compounds are arranged in order of their elution from the gas-chromatographic column.), micrograms per liter; --, not applicable]
Compound2,6-diethyl aniline
de-isopropylatrazine
de-ethylatrazine
atrazine
terbutylazine
metribuzin
alachlor
metolachlor
4,4'-dibromobiphenyl
butachlor
Typetarget
analyte
targetanalytetarget
analytetarget
analyte
surrogatecompound
targetanalyte
targetanalyte
targetanalyteinternalstandardsurrogate
compound
Ion mass-to- charge ratios
134*
119149
173*
158172*
187200*
215173
214*
173198*
199144
160*
188237
162*
238312*
160*
188
Relative percent Reporting linf* abundance (WJ/L)
100 0.043717
100 .0886
100 .0628
100 .045728
10033
100 .062715
100 .049728
100 .0425-
10063
* Quantification ion
adequately between injections. The printer should be turned on, and have enough paper for printing results for all injections.
To analyze samples using the autosampler, a sequence file must be created. The sequence file determines the order in which vials are injected, the number of injections per vial, and assigns a name or label to each injection. Calibration standards containing known amounts of the analytes, surrogates, and internal standard are run with every group of samples. Three separate calibration standards are used, each containing different concentrations of the analytes and surrogates. Directions for preparing the calibration standards are given in Section II.B.3. The three calibration standards are run before and after each group of 10 samples. Pure
hexane is injected at the beginning of each run, as well as between standards and samples. A typical order for the sequence is:
vial 1 - hexane
vial 2 - calibration standard 1 (lowest concentration)
vial 3 - calibration standard 2
vial 4 - calibration standard 3 (highest concentration)
vial 5 - hexane
vials 6-15 - samples
vial 16 - calibration standard 1
vial 17 - calibration standard 2
vial 18 - calibration standard 3
13
vial 19 - hexane
vial 20-29 - samples
vial 30 - calibration standard 1
vial 31 - calibration standard 2
vial 32 - calibration standard 3
Using the ChemStation software, the sequence is set up as follows:
1) Choose "Load" from the "Sequence" menu. Click on the sequence name used for MSEA samples (MSEA.S).
2) Choose "Edit Sample Log Table" from the "Sequence" menu.
3) Fill in the table which appears on the screen as follows:
Type Type "s" for sample. All injections are regarded as samples in the MSEA method, including standards and hexane rinse vials.
Vial Type in the number of the position on the autosampler tray containing the vial to be injected. The positions are numbered from 1 to 100. The sequence will usually start with position 1.
Inj Type in the number of times the vial is to be injected (normally one time).
Method Type in the name of the method to be used (MSEA.M).
Sample Name Type in an identifying name for the injection. For samples, type in the laboratory ID number.
4) When all samples, standards, and hexane rinses have been put into the sequence, click on "OK". Choose "Run" from the "Sequence" menu. Type in the appropriate information in the table which appears (date, operator, and any comments). Type in a directory path where the data file from each injection will be stored. To help in record keeping, the file name should be the date of the run. For example, C:\DATA\021095 specifies that the data files will be stored on the "C" drive, in a directory called "DATA", in sub-directory "021095". This would be the path for a run started on February 10, 1995. If more than one run is started in one day, type a letter after the directory name to differentiate between runs (i.e., 021095a). The directory path must be renamed each tune a sequence is started, or the data from the previous run will be over-written. When done, click on "OK".
5) Choose "Save" from the "Sequence" menu. Click on "OK" to save the sequence as "Sequence.s". This will overwrite the previous "Sequences" file.
6) Choose "Print" from the "Sequence" menu. A printed copy of the sequence should be kept with the printed copies of results from the samp'e run.
7) Place all vials containing samples, standards, and hexane into the correct positions in the autosampler tray. Use the printed copy of the sequence file to make sure that all vials are in the correct position.
8) Choose "Run" from the "Sequence" menu. Click on "Run sequence" to start the run.
9) Keep a record of all GC/MSD analyses in a log book. Enter pertinent information for eacl run of samples, including the date of the run, the total number of injections, sample types, data file directory, and whether or not the septum was changed. This same log book should be used to keep a record of all maintenance done on the GC or MSD.
10) When the sample run is completed, remove all vials from the autosampler tray. Uncap hexane vials and dispose of the remaining liquid in the "non-chlorinated solvent waste" bottle. Uncap standard vials and dispose of the remaining liquid in the "chlorinated solvent waste" bottle. Look through the printed results from the run to evaluate whether any of the samples need to be rerun. The criteria for whether a sample should be rerun is discussed in Section E.G. 1. Uncap any samples which need to be rerun, add diethyl ether if needed, put on a new cap, and return to the freezer until they are rerun. Uncap samples which do not need to be rerun, add a few drops of isoprcnyl alcohol, and put on a new cap. Isopropyl ^cohol is less volatile than diethyl ether, and help? prevent the sample from going dry during long- term storage. Store the completed sampler in numerical order (by laboratory ID number) in plastic "Vialtainers" (Alltech Corporation) in a freezer at-10°C.
G. Data analysis and quantification of anaMe concentrations
1. Evaluation of output dataThe output sent to the printer by the ChemStaHon
software consists of abundance-versus-time plot? for the ion masses monitored for each compound, and a tabulation of the area counts for all integrated peaks (Area Percent Report). The abundance-versus-time
14
plots for each compound must be examined to see that the peak for the quantification ion was integrated correctly. The area counts tabulated in the Area Percent Report are used for the quantification of the concentrations of analytes and surrogates in the sample (Section H.G.2.). The plots and the tabulated area counts must be examined to ensure that peaks are assigned to compounds correctly.
Identification of peaks in the plots for the calibration standards is fairly straightforward. Peaks for the confirmation ions must be present at the same retention time as the peak for the quantification ion. The area count for the quantification ion should be higher than area counts for the confirmation ions. For the samples, positive identification of a compound is based on several criteria. The retention time of the peak produced by the compound in the sample must be within ±0.05 minutes of the retention time of the peak for the compound in the calibration standards. As with the calibration standards, peaks for the confirmation ions must be present at the same retention time as the peak for the quantification ion. In addition, the relative abundances of the quantification and confirmation ions in the samples should be similar to the relative abundances in the standards. The relative abundances of these peaks (if integrated) are included in the tabulation of area counts in the output for each injection. As a general rule, the relative abundances of the quantification and confirmation ions in the sample should be within ±20 percent of the relative abundances of the same ions in the standards. Very low levels of a compound may result in a very small peak for the quantification ion. In these cases, the abundance of one or both of the confirmation ions may be so low that no peak is present, since the confirmation ions always have a lower abundance than the quantification ion. In other cases, impurities in the sample may alter the ratio of the quantification and confirmation ions. Some judgement by the analyst is required in these cases as to whether or not the peak is due to the compound of interest.
Area counts in the tabulation will be incorrect or missing if a peak was incorrectly integrated, or not integrated at all. Peaks can be manually integrated using the ChemStation software as follows:
1) Choose "Load" from the "Methods" menu and click on the appropriate method to load it into memory.
2) Choose "Main Panel" from the "Data Analysis" menu.
3) Choose "Load Data File" from the "File" menu and type in the path and file name of the data file for the injection. The file name is printed at the
top of the tabulation in the output from each injection.
4) Choose "Ion Chromatograms" from the "Integrate" menu. Type in a time range of approximately 0.3 minutes shorter and longer than the retention time of the compound of interest. Type in the ions that are monitored for the compound. Click on "OK".
5) Choose "Integrate" from the "Integrate" menu. The computer will then re-integrate the peaks of interest. If the resulting integration is not performed correctly, or if the peak is not integrated at all, choose "Integration Parameters" from the "Integrate" menu. Reduce the initial threshold by one unit and click on "OK". Choose "Integrate" from the "Integrate" menu again to re integrate the peaks. Repeat the parameter adjustment if the integration is still not correc*. For peaks split in half by integration, the initial threshold may have to be increased rather than decreased.
6) Choose "Integration Results" from the Integrate menu to view the areas calculated for the integrated peaks. Manually write the values f :>r the peaks of interest on the Area Percent Report. Click on "Done" to exit the integration results table. Choose "Exit" from the "File" menu to exit "Data Analysis".
Occasionally the printer fails to print part of the output from one or more injections. Incomplete output can be reprinted as follows:
1) Choose "Load" from the "Methods" menu to load the method used to run the sample.
2) Choose "Run" from the "Methods" menu. After the heading "Data File Name" type in the path and data file name for the injection. Under the heading "Method Sections to Run", "Data Analysis" should be checked, and "Data Acquisition" should be left blank.
3) Click on "Run Method". The software will perform the data analysis portion of the methcd and the output will be sent to the printer.
The above procedure cannot be used if the MSEA GC/MSD method is currently being used in a sequence running on the GC/MSD. In this case, the program which generates the report can be run independently as follows:
1) While the GC/MSD is running, a stand-alone copy of "Data Analysis" can be accessed by clicking on the box labeled "New Data Analysis". This box is
15
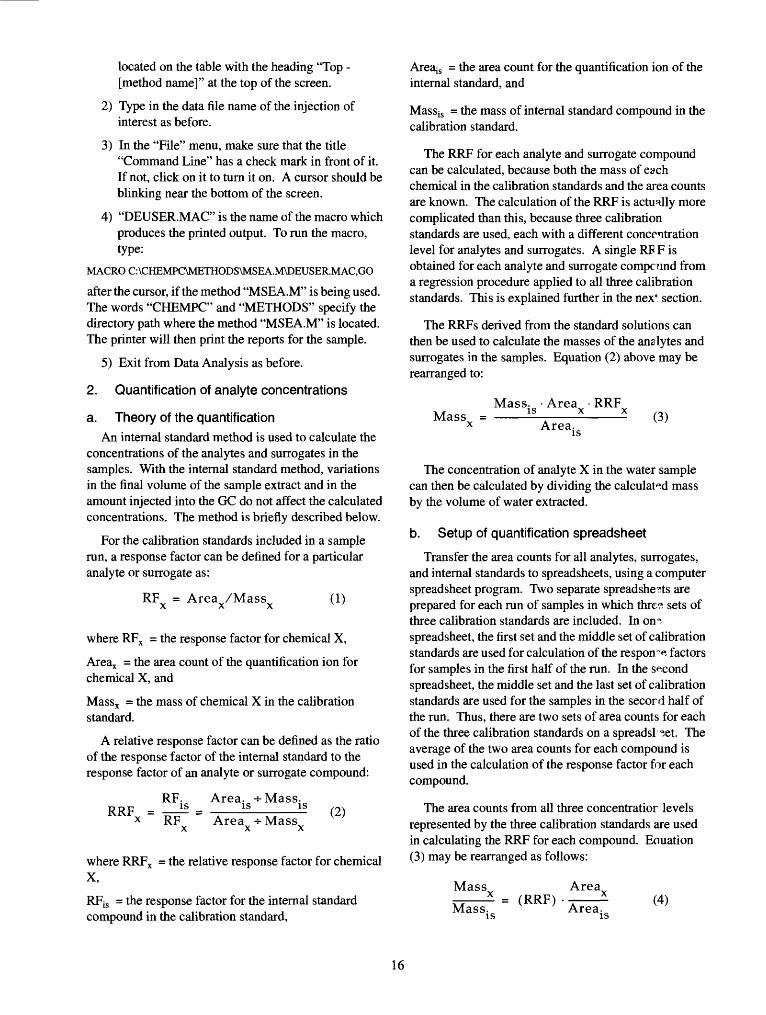
located on the table with the heading 'Top - [method name]" at the top of the screen.
2) Type in the data file name of the injection of interest as before.
3) In the "File" menu, make sure that the title "Command Line" has a check mark in front of it. If not, click on it to turn it on. A cursor should be blinking near the bottom of the screen.
4) "DEUSER.MAC" is the name of the macro which produces the printed output. To run the macro, type:
MACRO C:\CHEMPC\METHODS\MSEA.M\DEUSER.MAC,GO
after the cursor, if the method "MSEA.M" is being used. The words "CHEMPC" and "METHODS" specify the directory path where the method "MSEA.M" is located. The printer will then print the reports for the sample.
5) Exit from Data Analysis as before.
2. Quantification of analyte concentrations
a. Theory of the quantificationAn internal standard method is used to calculate the
concentrations of the analytes and surrogates in the samples. With the internal standard method, variations in the final volume of the sample extract and in the amount injected into the GC do not affect the calculated concentrations. The method is briefly described below.
For the calibration standards included in a sample run, a response factor can be defined for a particular analyte or surrogate as:
RF = Area /MassX XX
(1)
where RFX = the response factor for chemical X,
Areax = the area count of the quantification ion for chemical X, and
Massx = the mass of chemical X in the calibration standard.
A relative response factor can be defined as the ratio of the response factor of the internal standard to the response factor of an analyte or surrogate compound:
RF. RRF* RFIS
Area. -*-Mass. _____is____isArea -5-Mass
(2)
where RRFX = the relative response factor for chemical X,
RFis = the response factor for the internal standard compound in the calibration standard,
AreajS = the area count for the quantification ion of the internal standard, and
Massis = the mass of internal standard compound in the calibration standard.
The RRF for each analyte and surrogate compound can be calculated, because both the mass of each chemical in the calibration standards and the area counts are known. The calculation of the RRF is actually more complicated than this, because three calibration standards are used, each with a different concentration level for analytes and surrogates. A single RE F is obtained for each analyte and surrogate compound from a regression procedure applied to all three calibration standards. This is explained further in the nex* section.
The RRFs derived from the standard solutions can then be used to calculate the masses of the analytes and surrogates in the samples. Equation (2) above may be rearranged to:
Mass. Area RRFMass = A - - (3)
Areais
The concentration of analyte X in the water sample can then be calculated by dividing the calculated mass by the volume of water extracted.
b. Setup of quantification spreadsheet
Transfer the area counts for all analytes, surrogates, and internal standards to spreadsheets, using a computer spreadsheet program. Two separate spreadsheets are prepared for each run of samples in which three sets of three calibration standards are included. In one spreadsheet, the first set and the middle set of calibration standards are used for calculation of the respond factors for samples in the first half of the run. In the second spreadsheet, the middle set and the last set of calibration standards are used for the samples in the secord half of the run. Thus, there are two sets of area counts for each of the three calibration standards on a spreadsheet. The average of the two area counts for each compound is used in the calculation of the response factor for each compound.
The area counts from all three concentratior levels represented by the three calibration standards are used in calculating the RRF for each compound. Eauation (3) may be rearranged as follows:
Mass
Mass.= (RRF)
is
Area
Area,(4)
is
16
In this form, it can be seen that the RRF for a compound is equal to the slope of a plot of the ratio of the masses of the compound and the internal standard, and the ratio of the area counts for the compound and the internal standard. This slope can be calculated using the regression program in the spreadsheet software, with the area ratio as the x-variable and the mass ratio as the y-variable. The known concentrations in the calibration standards are used for the masses, and the corresponding average area counts are known from the calibration standards run with each group of samples. The correlation coefficient (R2) should be calculated as well, and should be between 0.98 and 1.00. Values less than 0.98 for R2 indicate that one or more of the area counts for the calibration standards may be incorrect, or that the injection of one or more of the calibration standards was poor.
Concentrations of each analyte may now be calculated for each of the samples in the run. Equation (3) is used to calculate the masses, and division by the volume of water extracted gives the concentrations. These calculations are done on the same spreadsheet on which the RRF values were calculated. Concentrations of the surrogate compounds are not calculated, since the amount added was constant, regardless of the volume extracted. The percent recovery of the surrogates is calculated for each sample by dividing the masses of terbutylazine and butachlor calculated from equation (3) by the mass of each added to the sample. The mass of each surrogate compound added to the sample is equal to the concentration of each surrogate compound in the surrogate spiking solution (in ng/fiL) times 50fiL.
3. Entering results into the MSEA data baseConcentrations calculated in the quantification
spreadsheet are transferred to a MSEA data base spreadsheet. Most wells in the MSEA study are sampled during four periods per year (April, June, August, and October). All of the samples collected in one sampling period are listed on one spreadsheet.
Enter all herbicide concentrations for each sample collected in the field, as well as for all quality assurance samples. Enter all three results for each replicate sample. For each entry in the spreadsheet, include the laboratory ID number, date and time of sample collection, and the complete field identification code.
Concentrations are entered as micrograms per liter (|ig/L) in a special format for statistical purposes. For each analyte, a "high" and a "low" value are entered. If the concentration obtained from the GC/MSD analysis exceeds the quantitative reporting limit (Table 2), it is entered as both the high value and the low value. If the concentration obtained from the GC/MSD analysis is
less than the quantitative reporting limit, the quantitative reporting limit value is entered as the high value and the measured concentration is entered as the low value. Values less than the quantitative reporting limit are reported to two decimal places, so that the lowest reportable concentration is 0.01 |ig/L. If the concentration obtained from the GC/MSD analysis is less than 0.01 |ig/L, then a zero is entered as the low value. Concentration values less than the quantitative reporting limit, but greater than zero, should be considered as semi-quantitative.
III. Quality assurance protocol
Approximately 20 percent of all samples analyzed are for quality assurance (QA) purposes. These includ?:
1) laboratory blanks organic-free water from tl ?. laboratory. The results from these blanks give an indication of whether samples are being contaminated during the laboratory procedures.
2) field blanks organic-free water put into sample bottles at the MSEA site during the sample collection period. The results from these blanks give an indication of whether samples are contaminated during the sample collection procedures.
3) sample replicates actual water samples analyzed in triplicate. Four 4-L samples are collected each sampling period for this purpose. The results from the triplicate analyses provide an estimate of the precision of the analysis for the target chemicals in the actual environmental matrix.
4) field spikes actual samples to which known amounts of the analytes and surrogate compounds are added in the field during the sample collection period. The samples used for field spikes are portions of th? samples used for replicate samples. The compound^ are added to the water samples using the field spiking solutions (Section n.B.5.). Field spikes with high (approximately 0.1 |ig/L) and low (approximately 0.05 |ig/L) concentrations are prepared by adding 50 |iL of the "high" and 50 [iL of the "low" field-spiking solutions, respectively, to 1-L of water. The field sp;kes are analyzed as if they were actual samples, and the recovery of the added analytes is calculated. The amount of each analyte in the water sample prior to spiking must be taken into account in this calculation. The amounts in the unspiked sample are obtained f ~om the results of the analyses of the unspiked replicate samples. The results from the field spikes give an indication of the accuracy and precision of the procedures used from the time the sample is taken in the field through the final analysis by GC/MSD.
17
5) sample duplicates analyzed by an independent laboratory an aliquot of one of the 4-L samples collected for the replicate samples, analyzed by an independent laboratory. The results are compared with the results for the same sample analyzed by the procedures described in this report to give an indication of the accuracy of the analysis.
Hexane rinses and calibration standards constitute about 30 percent of the injections on the GC/MSD. In addition, the performance of this laboratory and all others used in the various MSB A projects is overseen by an independent consulting firm. Standard solutions containing known concentrations of herbicides are submitted to the laboratory quarterly by the consulting firm and analyzed as if they were actual samples.
All samples, including water samples collected in the field and QA samples, are spiked with surrogates of the target chemicals (Section n.C.2.e.). The recovery of the surrogate compounds in individual samples helps to identify samples which may require re-injection or re- extraction. The surrogate recoveries as a group also indicate the consistency of the procedures used over time. Two surrogate compounds are used. Terbutylazine is used as the surrogate for the triazine herbicides (atrazine and metribuzin), and butachlor is used as the surrogate for the acetanilide herbicides (alachlor and metolachlor). Preparation of the surrogate spiking solution is described in Section n.B.l.b. The surrogate recoveries should be in the range of 75 to 110 percent. Concentrations reported in the MSEA data base spreadsheet are not corrected for surrogate recoveries.
Recovery studies are also conducted, using organic- free water spiked with known amounts of the analytes and surrogates. Two recovery study solutions are prepared in the laboratory (Section n.B.4.). Concentrations of the analytes and surrogates are approximately 0.2 jig/L in solution "A", and 0.8 \igfL in solution "B". Triplicate samples of each solution are analyzed. The results of the recovery study give an indication of the accuracy and precision of the procedures used in the laboratory. A recovery study is done with the samples from each sampling period.
The quality of individual injections on the GC/MSD is also monitored. For each sample, the area count for the internal standard (4,4'-dibromobiphenyl) is checked. If the area count is less than 1,000,000, the injection is considered suspect, and the sample is re-injected. If the area count in the second injection is still low, the sample is re-extracted and taken through the entire analytical procedure. The figure of 1,000,000 was derived empirically from the area counts observed in "normal"
sample injections using the GC/MSD system u~ed in this laboratory.
IV. ReferencesDelin, G.N., Landon, M.K., Anderson, J.L., and Dowdy,
R.H., 1992, Hydrologic research at the Princeton, Minnesota Management Systems Evaluation Area: U.S. Geological Survey Open-File Report 92-107, 2p.