RSC NERAD Young Analyst Competition 2014 Laboratory Handbook 1 North East Regional Heat Schools Analyst Competition 2014 Analysis of Two Fizzy Drinks LABORATORY HANDBOOK Royal Society of Chemistry Analytical Division
Transcript
RSC NERAD Young Analyst Competition 2014 Laboratory Handbook
1
North East Regional Heat
Schools Analyst Competition 2014
Analysis of Two Fizzy Drinks
LABORATORY HANDBOOK Royal Society of Chemistry
Analytical Division
RSC NERAD Young Analyst Competition 2014 Laboratory Handbook
2
Introduction There are many manufactures of fizzy drinks across the world and even more retailers. One of the key activities which will take place before a product is sold is a quality assurance check. In today’s competition you will be carrying out that function. Your role is to check:
1. The acidity level of ‘Sprite’ using an acid base titration method. 2. The iron content of ‘Irn-Bru’ using a spectrophotometric procedure. 3. The presence of a range of organic components using Thin Layer Chromatography on both
products. NOTE: All of these tasks are analytical exercises. Precision and accuracy are of vital importance. Background
In this section, the theory of each analytical method is explained. Enough detail is provided to allow you to understand what you are doing and why you are doing it. Units In this booklet you will encounter different ways of describing concentration. The first is “molarity”. This should be familiar to you and describes the number of moles per cubic decimetre (mol dm-3 or M) of each chemical. You will also use g dm-3 which is the same as g L-1 and mg dm-3 which is the same as mg L-1. All of these units are commonly found on food products. Safety Although the branded products are food items you must remember that you are in a laboratory setting and therefore tasting is not allowed. Laboratory coats and safety spectacles are mandatory. Disposable gloves must be worn when necessary and this will be clearly stated in the lab script. Long hair must be tied back. Titrimetric Determination of the Concentration of Citric Acid in ‘Sprite’ Degassed ‘Sprite’ will be titrated against known concentration sodium hydroxide solution using phenolphthalein indicator to determine the end point.
Spectrophotometric determination of iron (III) in ‘Irn-Bru’
Many molecular species absorb radiation in the UV or visible regions of the electromagnetic spectrum. Solutions containing such molecules may be colourless or coloured, and the amount of light absorbed depends on the concentration of the molecules. It is slightly more complex than that, indeed the
absorbance (A) of any solution is related to three parameters; the molar absorptivity coefficient () of the molecules at the wavelength used, the concentration of the absorbing species (c) and the path length (l) through the solution. This is expressed as Beer’s law (equation 1) and describes the relationship between the measured absorbance and the concentration of the absorbing species.
A = cl (equation 1)
In experiments like the one here, the pathlength is usually fixed at 1 cm. This is simply achieved by using a glass, plastic, or quartz cuvette that has holds a column of liquid exactly 1 cm in thickness. The molar absorptivity coefficient is usually different for each absorbing species present, and has the units of mol-1dm3cm-1. The molar absorptivity coefficient can readily be determined by producing a calibration graph of absorbance versus concentration (measure the absorbance of a series of solutions
of known concentration). Assuming a 1 cm cuvette was used, then the gradient of the line is . Once the calibration graph has been produced, it is relatively simple to determine the concentration of the analyte in a solution where the concentration of the analyte is not known. The absorbance of the
RSC NERAD Young Analyst Competition 2014 Laboratory Handbook
3
solution can be read from the graph and by rearranging equation 1, the concentration can easily be calculated. This exercise relies on the formation of a strongly coloured complex on the addition of thioglycollic acid to Fe (III) or Fe (II) in alkaline solution [E. Lyons, J. Amer. Chem. Soc. 49, 1916 (1927)]. The molar absorption coefficient, ε, of the complex is so high that iron can be detected in concentrations of 0.1 mg dm-3 or less. Here the method of standard additions is employed, to determine the concentration of iron in ‘Irn-Bru’. The method of standard additions ‘spikes’ the sample solution with a known quantity of standard solution. Thin Layer Chromatography for the detection of organic components You will perform a solvent extraction of the two fizzy drinks and then use thin layer chromatography and UV visualisation to determine if citric acid, benzoic acid and caffeine are present. What is required? In your team of three decide who is going to do each analysis; then read the experiment you are going to do. Each experiment has a section explaining the hazards of the chemicals you will be using; you should read this section carefully. Once you are happy with what you are going to do, you should begin the practical work. Pool the results of the three experiments in your ‘neat copy’ of the answer booklet and hand this in together with any graphs. Make sure your names are correctly and clearly spelled as there is nothing worse than a participation certificate with your name spelled incorrectly!
Good luck and enjoy the challenge. There are marking guidelines alongside the tasks to guide you in the depth of answer required. Good communication is very important so make sure your calculations are laid out well.
RSC NERAD Young Analyst Competition 2014 Laboratory Handbook
4
Experiment 1: Titrimetric Determination of the Concentration of Citric Acid in ‘Sprite’ This experiment was devised and trialled by Wyne Neshava (Kenton Academy) and Paige Ralston (Harton Sixth Form) during their Nuffield Bursary Placement at Northumbria University Summer 2012 Safety:
Sodium hydroxide (NaOH) is corrosive
If you get any on your skin wash off with water
Phenolphthalein is flammable
Safety glasses must be worn
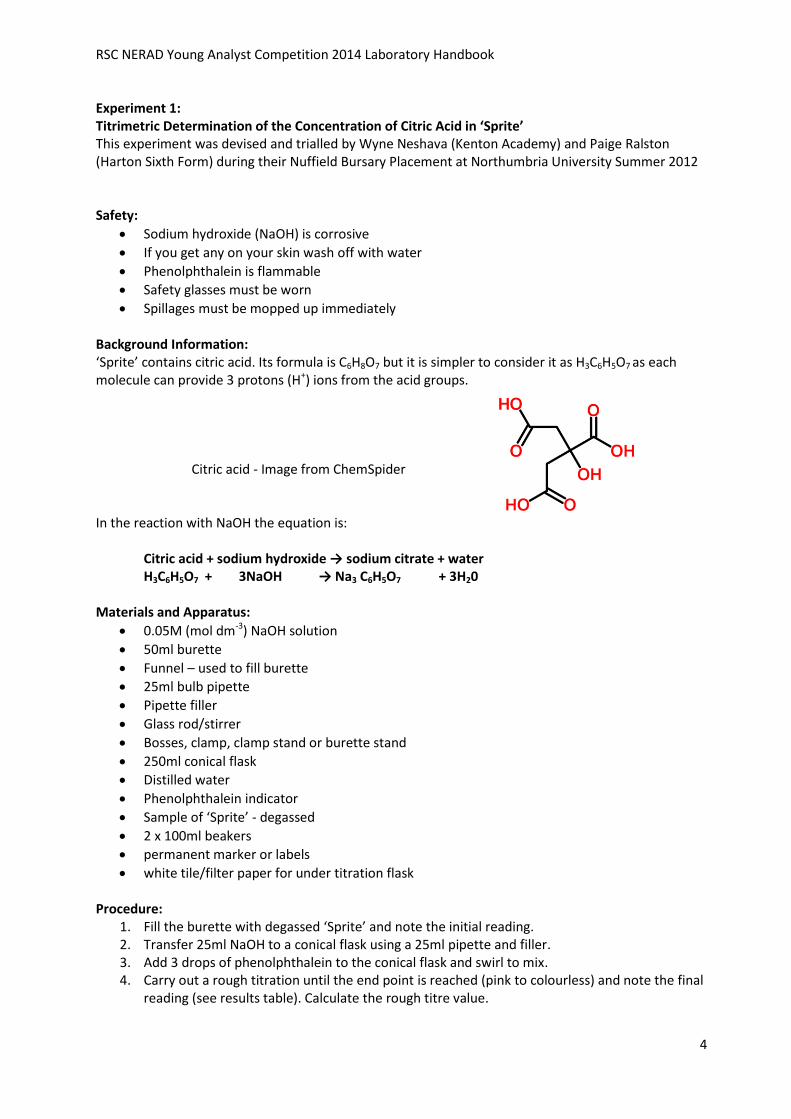
Spillages must be mopped up immediately Background Information: ‘Sprite’ contains citric acid. Its formula is C6H8O7 but it is simpler to consider it as H3C6H5O7 as each molecule can provide 3 protons (H+) ions from the acid groups.
Citric acid - Image from ChemSpider In the reaction with NaOH the equation is: Citric acid + sodium hydroxide → sodium citrate + water H3C6H5O7 + 3NaOH → Na3 C6H5O7 + 3H20 Materials and Apparatus:
0.05M (mol dm-3) NaOH solution
50ml burette
Funnel – used to fill burette
25ml bulb pipette
Pipette filler
Glass rod/stirrer
Bosses, clamp, clamp stand or burette stand
250ml conical flask
Distilled water
Phenolphthalein indicator
Sample of ‘Sprite’ - degassed
2 x 100ml beakers
permanent marker or labels
white tile/filter paper for under titration flask Procedure:
1. Fill the burette with degassed ‘Sprite’ and note the initial reading. 2. Transfer 25ml NaOH to a conical flask using a 25ml pipette and filler. 3. Add 3 drops of phenolphthalein to the conical flask and swirl to mix. 4. Carry out a rough titration until the end point is reached (pink to colourless) and note the final
reading (see results table). Calculate the rough titre value.
RSC NERAD Young Analyst Competition 2014 Laboratory Handbook
5
5. Complete accurate titrations until two sets of concordant (i.e. within 0.10 ml) results are obtained.
6. Calculate the average titre.
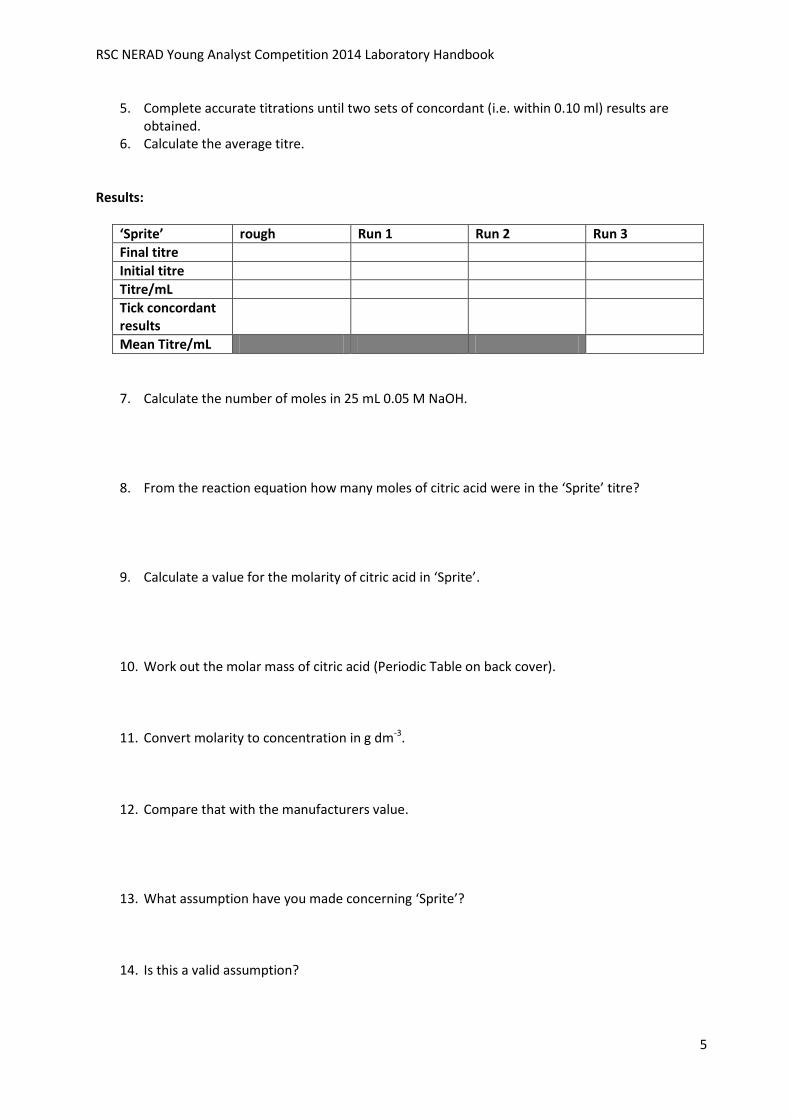
Results:
‘Sprite’ rough Run 1 Run 2 Run 3
Final titre
Initial titre
Titre/mL
Tick concordant results
Mean Titre/mL
7. Calculate the number of moles in 25 mL 0.05 M NaOH.
8. From the reaction equation how many moles of citric acid were in the ‘Sprite’ titre?
9. Calculate a value for the molarity of citric acid in ‘Sprite’.
10. Work out the molar mass of citric acid (Periodic Table on back cover).
11. Convert molarity to concentration in g dm-3.
12. Compare that with the manufacturers value.
13. What assumption have you made concerning ‘Sprite’?
14. Is this a valid assumption?
RSC NERAD Young Analyst Competition 2014 Laboratory Handbook
6
Experiment 2: Spectrophotometric determination of iron (III) content in ‘Irn-Bru’ ‘Irn-Bru’ contains an iron salt which gives the soft drink its distinctive colour. The iron is added as iron (III) ammonium citrate. There is a story that the iron originally came to be present as a result of the bottling plant being close to a blast furnace. The iron dust from the furnace was deposited in the drink, thus ‘improving’ its flavour. That may, however, simply be part of industrial folk lore. Safety: Gloves, safety spectacles and protective clothing should be worn.
3M ammonia solution – corrosive - GLOVES MUST BE WORN – dispensed in a fume cupboard.
25% w/v ammonium citrate solution – irritant.
0.02M thioglycolic acid solution – toxic – GLOVES MUST BE WORN – dispensed in a fume cupboard.
25 mg L-1 Fe 3+ standard solution – irritant to eyes. Equipment Required:
‘Irn-Bru’ degassed – CO2 bubbles would affect the spectrometer reading
Iron (III) standard solution (25 mg dm-3 Fe3+)
3M aqueous ammonia (dispense in a fume cupboard) GLOVES
25% ammonium citrate
Thioglycollic acid (dispense in a fume cupboard) GLOVES
5 x 25 mL volumetric flasks
Pasteur pipette
1, 2, 5 and 10 mL bulb pipettes or a 10 mL graduated pipette
Pipette filler
Access to UV-Vis Spectrometer set at a single wavelength of 530 nm Procedure: 1. Take five 25 mL volumetric flasks, and label them as follows:
A – Blank B – ‘Irn-Bru’ C – 2 cm3 D – 5 cm3 E – 10 cm3 2. Pipette 10 mL of degassed ‘Irn-Bru’ into each flask. 3. Pipette 2 mL iron standard solution into flask C. Pipette 5 mL iron standard solution into flask D. Pipette 10 mL iron standard solution into flask E. 4. Using a Pasteur pipette add 2 drops of 25% ammonium citrate to each flask. 5. Using a 1mL pipette, add 1 mL 3M ammonia to each flask. 6. Make flask A up to volume with distilled/deionised water. Mix thoroughly. 7. Add one drop thioglycolic acid to each of the flasks B to E. You may now return to your lab bench to make up to volume with distilled/deionised water. Mix thoroughly. 8. Leave the flasks for at least 5 minutes for the colour to develop. (Not in flask A – Why?) 9. Zero the spectrometer at 530 nm using a cuvette of the ‘blank’ solution. 10. Measure the absorbance of each of the solutions B-E in that order (ie the lowest
concentration first). Record the values on the proforma. Repeat the measurements so that you can eliminate any anomalies and obtain an average value.
RSC NERAD Young Analyst Competition 2014 Laboratory Handbook
7
Treatment of Results: Use the equation C1V1 = C2V2
Where: C1 is the initial concentration of the iron (III) standard solution (25 mg dm-3 Fe3+) V1 is the volume of standard added C2 is the concentration of the diluted solution V2 is the new volume (25 mL) Rearrange the equation so that C2 can be determined 11. Calculate the concentration of iron (III) standard in mg dm-3 added to each flask. Add these
values to the proforma.
Results: Spectrophotometer Readings
Flask Fe(III)/mg dm-3 added
Reading 1 Reading 2 Average
A (blank)
B
C
D
E
12. Plot a calibration graph by plotting absorbance (y axis) vs concentration (x axis) of iron (III) standard in the solutions. This should yield a straight line graph. It doesn’t go through the origin because of the iron (III) found in the Irn-Bru. 13. Determine the concentration of the degassed ‘Irn-Bru’ iron (III) concentration by extrapolating the line back until it intercepts the concentration axis at – sample concentration. 14. The manufacturer quotes 0.002% Fe3+. How does your value compare? Show your workings.
RSC NERAD Young Analyst Competition 2014 Laboratory Handbook
8
Experiment 3: Thin Layer Chromatography for the detection of organic components Manufacturers add many substances to food products as preservatives and flavourings. You are going to be using Thin Layer Chromatography to check for the presence of three such substances, citric acid (E330), benzoic acid (E210) and caffeine. Background
Chromatography is used to separate mixtures of substances into their components.
A chromatogram consists of a stationary phase (a solid or a liquid supported on a solid) and a
mobile phase (a liquid or a gas). The mobile phase flows through the stationary phase and
carries the components of the mixture with it. Different components travel at different rates.
As the solvent begins to soak up the plate, it first dissolves the compounds in the spot that you
have put on the base line. The compounds present will then tend to get carried up the
chromatography plate as the solvent continues to move upwards.
How fast the compounds get carried up the plate depends on two things:
o How soluble the compound is in the solvent. This will depend on how much attraction
there is between the molecules of the compound and those of the solvent.
o How much the compound sticks to the stationary phase - the silica gel, for example.
This will depend on how much attraction there is between the molecules of the
compound and the silica gel (on the TLC plate).
Safety:
Hydrochloric acid is corrosive.
Dichloromethane is classed as a potential carcinogen so GLOVES MUST BE WORN and the substance handled in a fume cupboard.
Ethyl acetate is flammable. Materials and apparatus:
100 mL separating funnel and stopper
Retort stand with ring or clamp
2 mol dm-3 hydrochloric acid (HCl)
4 mol dm-3 sodium chloride (NaCl)
dichloromethane (DCM)
ethyl acetate – elution solvent
Small containers of caffeine, benzoic acid and citric acid diluted in methanol
40 mL of degassed ‘Irn-Bru’ and ‘Sprite’
50 mL beaker
250 mL beaker plus large watch glass or petri dish to act as lid (chromatography tank)
2 pieces of TLC plate per student
2 x 5 mL measuring cylinders for HCl and NaCl solutions
50 mL measuring cylinder for drinks
25 mL measuring cylinder for ethyl acetate
5 x micro-spotters
Distilled water
UV viewer – short wavelength
RSC NERAD Young Analyst Competition 2014 Laboratory Handbook
9
Procedure: 1. Line the chromatography tank with filter paper (half a sheet 110 mm usually works).
2. Measure 15 mL ethyl acetate in a measuring cylinder and pour into the chromatography tank
soaking the filter paper as you do it. Replace the lid. Allow the tank to stand to saturate the air
with vapour.
3. Place 40 mL of ‘Irn-Bru’ into the separating funnel and add 5 mL of 2 mol L-1 HCl and 5 mL of
4 mol L-1 NaCl solution.
4. Add 2 mL of dichloromethane (in fume cupboard) place the stopper onto the funnel and invert
once.
5. Vent the funnel to relieve the pressure.
6. Repeat the process a few times making sure to relieve the pressure.
7. Place the funnel in the stand and remove the stopper. Allow the layers to separate.
8. Run off the lower layer containing the organic compounds into a beaker, being careful not to
allow any of the remaining aqueous ‘Irn-Bru’ (upper layer )into the beaker.
9. Use a pencil to lightly draw a line 1 cm from the bottom of the TLC plate.
10. Use micro spotters to place evenly spaced dots of caffeine, citric acid, benzoic acid and organic
compounds from ‘Irn-Bru’ dissolved in DCM on the line – apply one drop at a time allowing it
to dry before adding another until 4 drops have been applied to each spot.
11. Place the TLC plate in the chromatography tank so that it stands near vertical and rests against
the filter paper.
12. When the solvent close to the top of the plate remove it and carefully mark the position of the
solvent front with a pencil.
13. Wait until the plate is dry and then examine under ultraviolet light and mark the position of
each spot with a pencil.
14. Remove the plate from the viewer and see if the drink tested has any of the tested solvents in
it by seeing if it has the same marks.
15. Repeat all the above steps for ‘Sprite’
beaker (250 mL)
filter paper soaked in elution solvent
elution solvent
watch glass
TLC plate
RSC NERAD Young Analyst Competition 2014 Laboratory Handbook
10
Calculation of Rf (retention factor):
Measure the distances indicated in the table below and calculate the Rf values for each substance/component
Substance Distance travelled by component (mm)
Distance travelled by solvent (mm)
Rf = Distance travelled by component ÷ Distance travelled by solvent
Caffeine
Citric acid
Benzoic acid
‘Irn-Bru’
‘Sprite’
16. With reference to your results explain which organic components were present in ‘Irn-Bru’
and ‘Sprite’.
17. Why might caffeine be added to drinks?
18. Why is it important medically that these low concentration substances are listed by the
manufacturers?
19. Name 3 foods which naturally contain citric acid.
20. Name 3 other products which contain caffeine.
RSC NERAD Young Analyst Competition 2014 Laboratory Handbook
11
NOTES:
RSC NERAD Young Analyst Competition 2014 Laboratory Handbook