Laboratory Investigation of Geobag Revetment Performance in Rivers Leila Khajenoori 1 , Grant Wright 2, * and Martin Crapper 3 1 School of Engineering, University of Central Lancashire (UCLan), Preston, UK; [email protected]2 Institute for Infrastructure and Environment, Heriot Watt University, Edinburgh, UK 3 Mechanical and Construction Engineering/Faculty of Engineering and Environment, Northumbria University, Newcastle-upon-Tyne, UK; [email protected]* Correspondence: [email protected]Abstract: Geobag (sand-filled geotextile bags) revetments have recently emerged as long-term riverbank protection measures in developing countries; however, their performance is still not well understood. The hydraulic stability of geobag revetments used for riverbank protection has been studied within an extensive laboratory programme to improve our understanding of the complete failure processes of geobag revetments. A 1:10 scale distorted physical model was tested in a labor- atory flume, comparing a range of different construction methods and revetment side slopes, sub- jected to different flow loading. The results indicate that whilst failure mechanisms are highly de- pendent on water depth and revetment slope, the construction method had no noticeable impact. It was thus concluded that the dominating factor is the friction between individual geobags, which itself is dependent on bag longitudinal overlap rather than a specific construction method. Keywords: erosion; failure; geobag; revetment; riverbank 1. Introduction Riverbank erosion is a significant problem in many rivers, including those which flow through low-lying alluvial plains and more upstream locations. Morphologically, riverbank erosion can lead to changes in the characteristics of river channels and flood zones, which in turn can lead to the loss of fertile agricultural land, damage to properties and fluvial infrastructure, as well as danger to human and animal life. To counter such issues, geobag (sand-filled geotextile bags) revetments have recently emerged as long- term riverbank protection measures in developing countries, primarily due to their effec- tiveness, low cost, and ready availability; good examples of their successful implementa- tion include the Yangtze River (Yang et al., 2008) and Changjiang River (Zhu et al., 2004) in China, and the Jamuna and Meghna Rivers in Bangladesh (JMREM, 2006). Notwithstanding the applications noted above, the vast majority of related research has previously focused on geobag performance in coastal situations (Bezuijen et al., 2004; Dassanayake & Oumeraci, 2012a, 2012b; Recio & Oumeraci, 2009a, 2009b; Saathoff et al., 2007), which reflects their relatively widespread use in this environment. Field studies of coastal geobag structures have shown that failure mechanisms can be greatly influenced by wave action. Overtopping, sliding, puncturing, pull-out, and toe scour have been iden- tified as the most common failure modes (Oumeraci et al., 2003; Jackson et al., 2006; Mori et al., 2008); friction, inertia, drag, and lift forces are the main forces which govern these failures (Recio and Oumeraci, 2009b). However, the perpendicular wave action found in coastal scenarios is not significant in fluvial applications, where the flow direction is gen- erally parallel to the riverbank, so the performance and failure mechanisms of geobag re- vetments in rivers are considerably different from that of coastal structures.
Transcript
Laboratory Investigation of Geobag Revetment Performance in
Rivers
Leila Khajenoori 1, Grant Wright 2,* and Martin Crapper 3
1 School of Engineering, University of Central Lancashire (UCLan), Preston, UK; [email protected] 2 Institute for Infrastructure and Environment, Heriot Watt University, Edinburgh, UK 3 Mechanical and Construction Engineering/Faculty of Engineering and Environment, Northumbria
Riverbank erosion is a significant problem in many rivers, including those which
flow through low-lying alluvial plains and more upstream locations. Morphologically, riverbank erosion can lead to changes in the characteristics of river channels and flood zones, which in turn can lead to the loss of fertile agricultural land, damage to properties
and fluvial infrastructure, as well as danger to human and animal life. To counter such issues, geobag (sand-filled geotextile bags) revetments have recently emerged as long-
term riverbank protection measures in developing countries, primarily due to their effec-tiveness, low cost, and ready availability; good examples of their successful implementa-tion include the Yangtze River (Yang et al., 2008) and Changjiang River (Zhu et al., 2004)
in China, and the Jamuna and Meghna Rivers in Bangladesh (JMREM, 2006). Notwithstanding the applications noted above, the vast majority of related research
has previously focused on geobag performance in coastal situations (Bezuijen et al., 2004; Dassanayake & Oumeraci, 2012a, 2012b; Recio & Oumeraci, 2009a, 2009b; Saathoff et al., 2007), which reflects their relatively widespread use in this environment. Field studies of
coastal geobag structures have shown that failure mechanisms can be greatly influenced by wave action. Overtopping, sliding, puncturing, pull-out, and toe scour have been iden-
tified as the most common failure modes (Oumeraci et al., 2003; Jackson et al., 2006; Mori et al., 2008); friction, inertia, drag, and lift forces are the main forces which govern these failures (Recio and Oumeraci, 2009b). However, the perpendicular wave action found in
coastal scenarios is not significant in fluvial applications, where the flow direction is gen-erally parallel to the riverbank, so the performance and failure mechanisms of geobag re-
vetments in rivers are considerably different from that of coastal structures.
One study that has looked at the use of geobags in the fluvial environment was con-ducted as part of the wider Jamuna–Meghna River erosion protection scheme in Bangla-desh (NHC 2006). In terms of failure modes, NHC (2006) reported that inadequate bag
coverage and toe scour were the main reasons for failure due to sliding/slip and slumping. During a field study in 2009, the potential failure mechanisms of geobag revetments in the
Jamuna River were identified as pull-out/dislodgement, sliding, slumping, and physical damage (Akter et al., 2009). NHC (2006) conducted a range of bag-drop and launch tests using a 1:20 scale in a laboratory. The launch tests highlighted that “standard” 126 kg bags
are the optimum, feasible (locally, 126 kg bags are considered the largest geobags safe to handle by two people (Knut Oberhagemann & Hossain, 2011)). bags for revetment stabil-
ity under high flow velocities (up to 4.5 m/s). According to previous experimental work (NHC 2006), manually dropping 126 kg bags into place from the riverbank or dumping pontoons located on the river produces typical revetment side slopes of 1V:2H. However,
it seems reasonable to assume that the existing (pre-revetment) side slope of any riverbank will play a significant role in the final revetment side slope, and that the final revetment
slope may influence the overall stability of a geobag revetment. In the field, different placement methods (e.g., riverbank launching, pontoon launching) can lead to a wide range of different construction bonds (Oberhagemann & Hossain, 2011).
To date, the only laboratory work investigating geobag revetment performance in rivers has been undertaken by Akter et al. (2011), who attempted to investigate the behav-
iour of a geobag revetment numerically and experimentally under different hydrody-namic loads and toe scour conditions. It was found that failure mechanisms of geobag revetment could be initiated through a combination of uplifting, pull-out, and sliding.
In all previous studies, the performance of geobag revetments was investigated with an emphasis on incipient motion during construction/launching (Zhu et al., 2004) and af-
ter revetment construction (Akter, 2011; NHC, 2006), and they did not link the complete processes of failure to underlying hydraulic loading. Notwithstanding recent advances, additional research is still required to better understand the performance of geobag revet-
ments in the fluvial environment. The work presented in this paper aims to experimentally investigate the effect of key
revetment characteristics (construction method and slope) on the performance of geobag revetments on a fixed (non-erodible) bed, which will also provide the necessary data to develop a discrete element model (DEM) capable of numerically simulating complete re-
vetment failure processes.
2. Geobag and Hydrodynamic Forces
According to Recio and Oumeraci (2009b), failure mechanisms progressed with in-
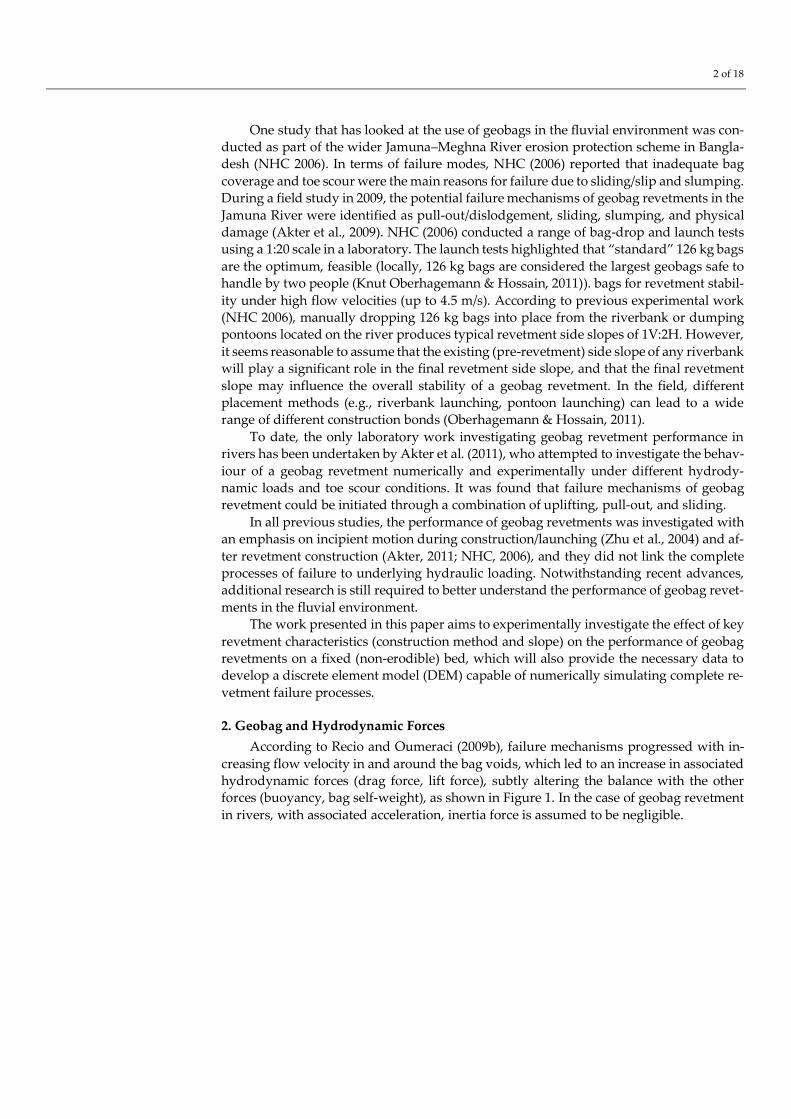
creasing flow velocity in and around the bag voids, which led to an increase in associated hydrodynamic forces (drag force, lift force), subtly altering the balance with the other forces (buoyancy, bag self-weight), as shown in Figure 1. In the case of geobag revetment
in rivers, with associated acceleration, inertia force is assumed to be negligible.
3 of 18
Figure 1. Forces acting on a submerged geobag.
2.1. Mobilising and Resisting Forces on Submerged Geobags
To understand the mechanisms which affect the hydraulic stability of a geobag re-vetment, the balance of forces that are acting on a geobag needs to be considered (Figure 1). The flow on and around a geobag with horizontal velocity U in a steady flow condition
results in three types of forces as explained by Equation (1) to Equation (3) (Recio and Oumeraci, 2009a):
Drag force:
𝐹𝐷 =1
2𝐶𝐷𝜌𝑤𝐴𝑆𝑈
2 (1)
where CD is a drag coefficient which depends on the shape and roughness of the geobags, ρw is the density of water, U is the horizontal flow velocity, and AS is the cross area normal to the flow.
Lift Force:
𝐹𝐿 =1
2𝐶𝐿𝜌𝑤𝐴𝑡𝑈
2 (2)
where CL is the lift coefficient, and At is the projected area of the geobag in the flow direc-tion.
Buoyancy Force:
𝐹𝐴 = 𝜌𝑤𝑔𝑉𝑔𝑒𝑜𝑏𝑎𝑔 (3)
where g is the gravitational acceleration and Vgeobag is the volume of geobag. The resisting forces are essentially due to the weight of the geobag under buoyancy,
thus:
Weight of geobag:
𝐹𝐺 = 𝜌𝑠𝑉𝑔𝑒𝑜𝑏𝑎𝑔𝑔 (4)
where ρs is the density of the dry geobags In addition to illustrating the physical theory behind each failure mode, these equa-
tions have also been incorporated into a DEM to numerically simulate the failure mecha-
nisms in geobag revetment.
3. Materials and Methods
3.1. Overview
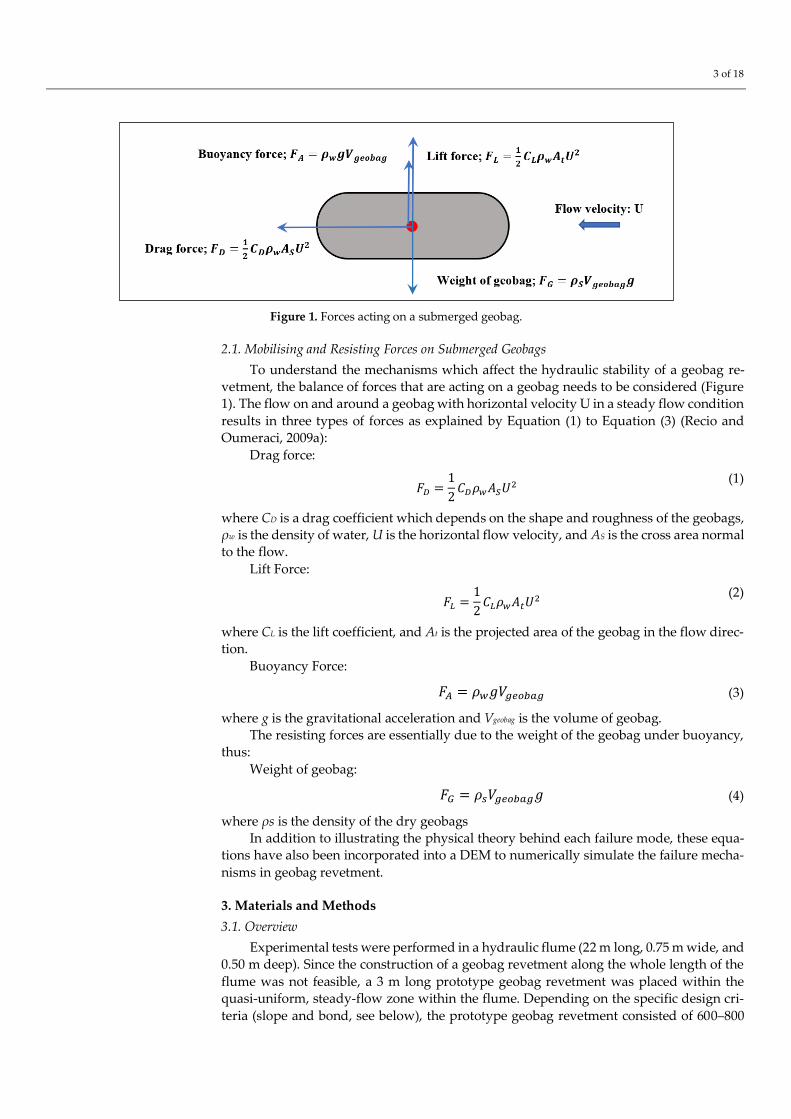
Experimental tests were performed in a hydraulic flume (22 m long, 0.75 m wide, and 0.50 m deep). Since the construction of a geobag revetment along the whole length of the
flume was not feasible, a 3 m long prototype geobag revetment was placed within the quasi-uniform, steady-flow zone within the flume. Depending on the specific design cri-
teria (slope and bond, see below), the prototype geobag revetment consisted of 600–800
4 of 18
geobags (Figure 2). The channel bed slope was set to 5.5 × 10⁻³ (1V:4000H), which replicates that in the Jamuna River, making the present work directly comparable to previous simi-lar laboratory studies (Akter et al., 2013; NHC, 2006).
Figure 2. Experimental setup (located halfway down the flume).
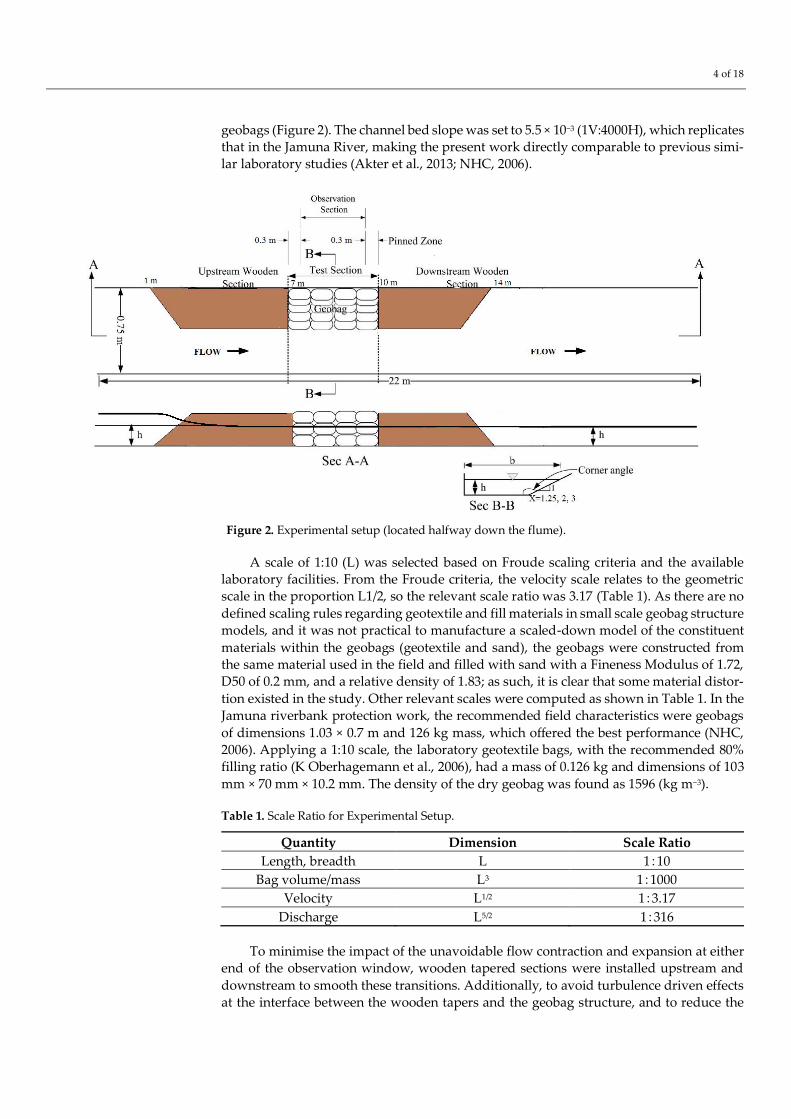
A scale of 1:10 (L) was selected based on Froude scaling criteria and the available laboratory facilities. From the Froude criteria, the velocity scale relates to the geometric scale in the proportion L1/2, so the relevant scale ratio was 3.17 (Table 1). As there are no
defined scaling rules regarding geotextile and fill materials in small scale geobag structure models, and it was not practical to manufacture a scaled-down model of the constituent
materials within the geobags (geotextile and sand), the geobags were constructed from the same material used in the field and filled with sand with a Fineness Modulus of 1.72, D50 of 0.2 mm, and a relative density of 1.83; as such, it is clear that some material distor-
tion existed in the study. Other relevant scales were computed as shown in Table 1. In the Jamuna riverbank protection work, the recommended field characteristics were geobags
of dimensions 1.03 × 0.7 m and 126 kg mass, which offered the best performance (NHC, 2006). Applying a 1:10 scale, the laboratory geotextile bags, with the recommended 80% filling ratio (K Oberhagemann et al., 2006), had a mass of 0.126 kg and dimensions of 103
mm × 70 mm × 10.2 mm. The density of the dry geobag was found as 1596 (kg m−3).
Table 1. Scale Ratio for Experimental Setup.
Quantity Dimension Scale Ratio
Length, breadth L 1:10
Bag volume/mass L3 1:1000
Velocity L1/2 1:3.17
Discharge L5/2 1:316
To minimise the impact of the unavoidable flow contraction and expansion at either end of the observation window, wooden tapered sections were installed upstream and
downstream to smooth these transitions. Additionally, to avoid turbulence driven effects at the interface between the wooden tapers and the geobag structure, and to reduce the
5 of 18
edge effect due to this discontinuity, the surface geobags were pinned for 0.3 m of the test section at either end. Both measures also help better replicate field conditions, where sec-tions of geobags are typically flanked by firmer (soil or rock) conditions.
To observe the performance of the geobag revetment under hydrodynamic loads, and to avoid the impact of toe scouring on the process of failure, the experiments were
conducted under a fixed-bed condition. Experiments ran for approximately seven hours, which was sufficient time for the failure processes to stabilise, i.e., there was no further, significant geobag movement in the revetment structure. From previous studies (Akter et
al., 2013), it was observed that specific failure modes (bag movements) tend to occur in different ranges of water depth (relative to revetment height). Thus, experiments were
typically run under steady conditions with low, medium, and high-water depths (respec-tively 0–49%, 50–60%, and 60–80% of revetment height); to keep flow Froude numbers as constant as possible, and hence enable comparison of all results, water depths for the
steepest side slope configuration were 0–30%, 30–40%, and 40–50% of revetment height. Along with the three side slopes and two construction bonds, this resulted in a total of 18
separate experimental scenarios (Table 2). Before the commencement of each test, the weights of the individual surface geobags
were measured to ensure that all individual experiments were run with relatively dry
bags (moisture content less than 0.5%). At the end of each test, the number of bags that were displaced from the revetment and settled at the end of the flume (washed away ge-
obags) was recorded. To ensure representative results, each test was repeated at least two times, with a third test undertaken if the results from the first two differed significantly.
6 of 18
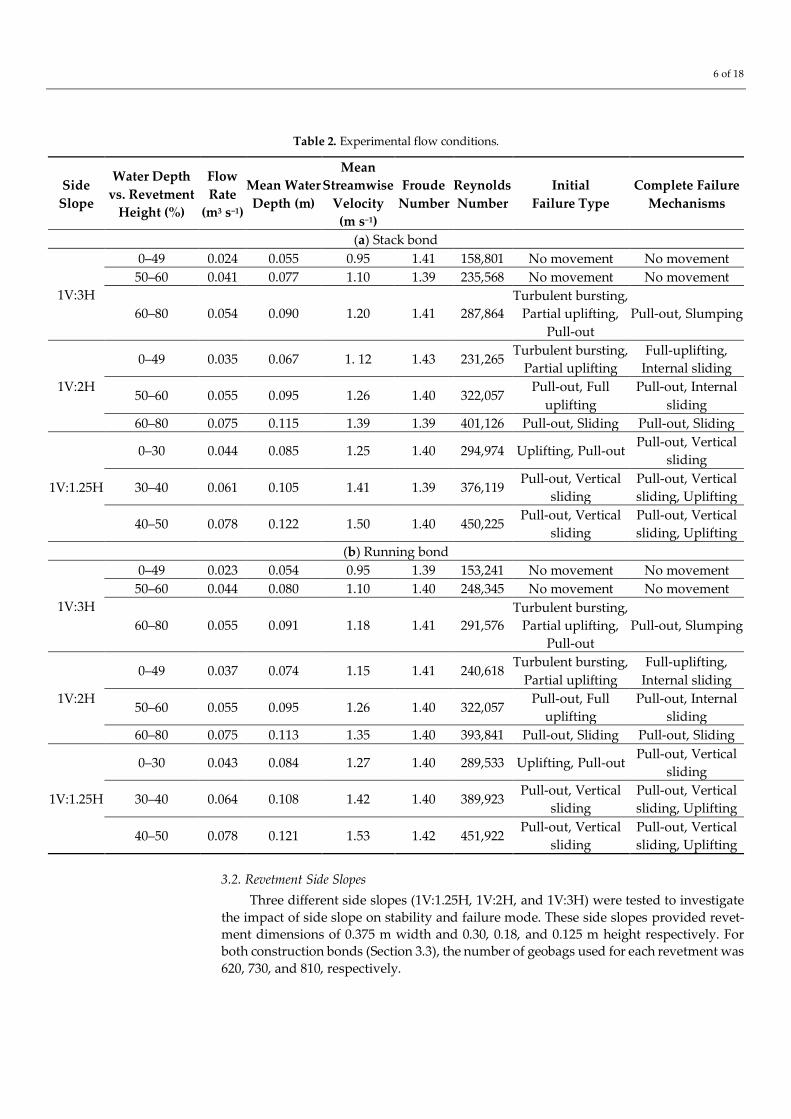
Table 2. Experimental flow conditions.
Side
Slope
Water Depth
vs. Revetment
Height (%)
Flow
Rate
(m3 s−1)
Mean Water
Depth (m)
Mean
Streamwise
Velocity
(m s−1)
Froude
Number
Reynolds
Number
Initial
Failure Type
Complete Failure
Mechanisms
(a) Stack bond
1V:3H
0–49 0.024 0.055 0.95 1.41 158,801 No movement No movement
50–60 0.041 0.077 1.10 1.39 235,568 No movement No movement
Three different side slopes (1V:1.25H, 1V:2H, and 1V:3H) were tested to investigate
the impact of side slope on stability and failure mode. These side slopes provided revet-ment dimensions of 0.375 m width and 0.30, 0.18, and 0.125 m height respectively. For both construction bonds (Section 3.3), the number of geobags used for each revetment was
620, 730, and 810, respectively.
7 of 18
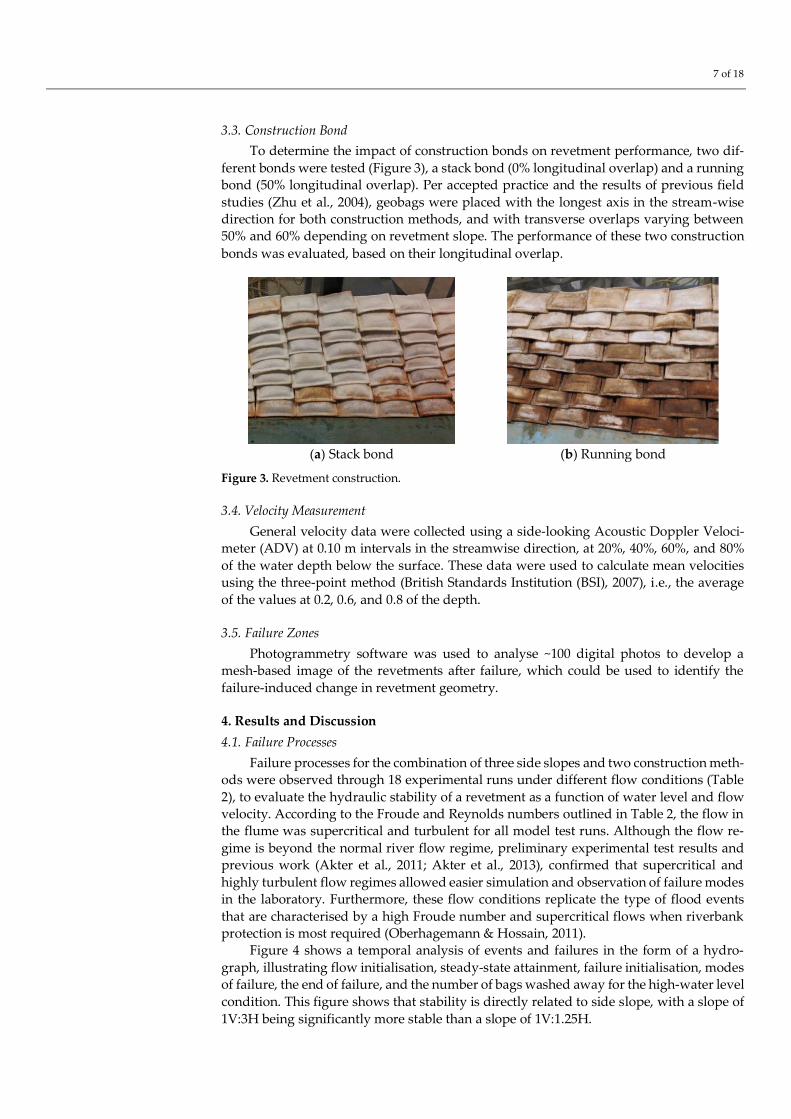
3.3. Construction Bond
To determine the impact of construction bonds on revetment performance, two dif-
ferent bonds were tested (Figure 3), a stack bond (0% longitudinal overlap) and a running bond (50% longitudinal overlap). Per accepted practice and the results of previous field
studies (Zhu et al., 2004), geobags were placed with the longest axis in the stream-wise direction for both construction methods, and with transverse overlaps varying between 50% and 60% depending on revetment slope. The performance of these two construction
bonds was evaluated, based on their longitudinal overlap.
(a) Stack bond
(b) Running bond
Figure 3. Revetment construction.
3.4. Velocity Measurement
General velocity data were collected using a side-looking Acoustic Doppler Veloci-meter (ADV) at 0.10 m intervals in the streamwise direction, at 20%, 40%, 60%, and 80%
of the water depth below the surface. These data were used to calculate mean velocities using the three-point method (British Standards Institution (BSI), 2007), i.e., the average
of the values at 0.2, 0.6, and 0.8 of the depth.
3.5. Failure Zones
Photogrammetry software was used to analyse ~100 digital photos to develop a mesh-based image of the revetments after failure, which could be used to identify the
failure-induced change in revetment geometry.
4. Results and Discussion
4.1. Failure Processes
Failure processes for the combination of three side slopes and two construction meth-ods were observed through 18 experimental runs under different flow conditions (Table
2), to evaluate the hydraulic stability of a revetment as a function of water level and flow velocity. According to the Froude and Reynolds numbers outlined in Table 2, the flow in the flume was supercritical and turbulent for all model test runs. Although the flow re-
gime is beyond the normal river flow regime, preliminary experimental test results and previous work (Akter et al., 2011; Akter et al., 2013), confirmed that supercritical and
highly turbulent flow regimes allowed easier simulation and observation of failure modes in the laboratory. Furthermore, these flow conditions replicate the type of flood events
that are characterised by a high Froude number and supercritical flows when riverbank protection is most required (Oberhagemann & Hossain, 2011).
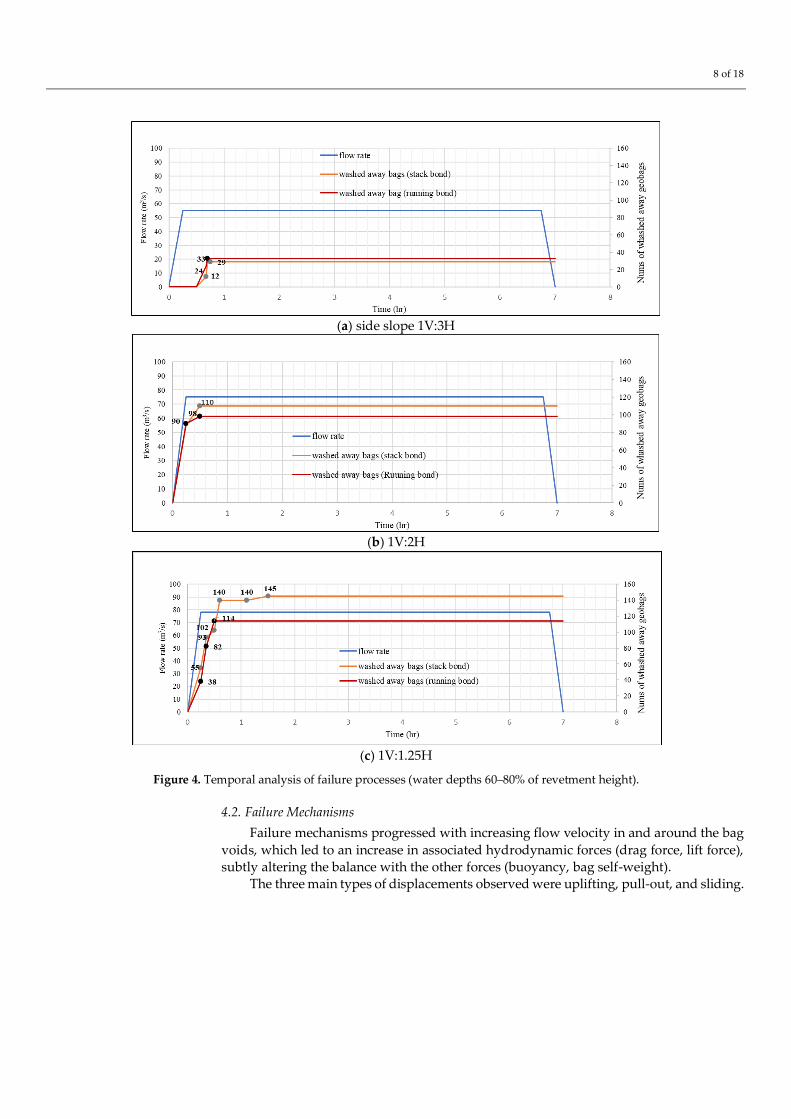
Figure 4 shows a temporal analysis of events and failures in the form of a hydro-
graph, illustrating flow initialisation, steady-state attainment, failure initialisation, modes of failure, the end of failure, and the number of bags washed away for the high-water level
condition. This figure shows that stability is directly related to side slope, with a slope of
1V:3H being significantly more stable than a slope of 1V:1.25H.
8 of 18
(a) side slope 1V:3H
(b) 1V:2H
(c) 1V:1.25H
Figure 4. Temporal analysis of failure processes (water depths 60–80% of revetment height).
4.2. Failure Mechanisms
Failure mechanisms progressed with increasing flow velocity in and around the bag
voids, which led to an increase in associated hydrodynamic forces (drag force, lift force), subtly altering the balance with the other forces (buoyancy, bag self-weight).
The three main types of displacements observed were uplifting, pull-out, and sliding.
9 of 18
4.2.1. Failure due to Uplifting
Generally, uplifting is a rotational displacement of geobags in the upward direction,
and full uplifting occurs when flow-induced loads on geobags are much larger than the resisting force.
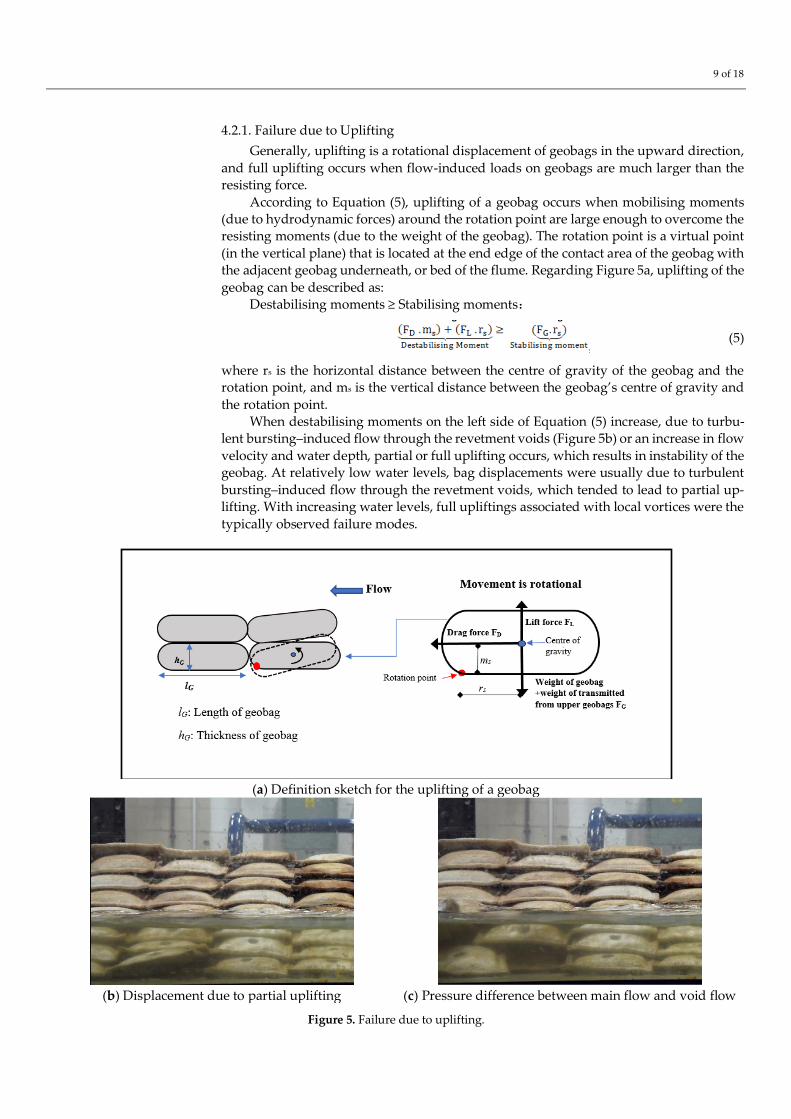
According to Equation (5), uplifting of a geobag occurs when mobilising moments (due to hydrodynamic forces) around the rotation point are large enough to overcome the resisting moments (due to the weight of the geobag). The rotation point is a virtual point
(in the vertical plane) that is located at the end edge of the contact area of the geobag with the adjacent geobag underneath, or bed of the flume. Regarding Figure 5a, uplifting of the
geobag can be described as: Destabilising moments ≥ Stabilising moments:
(5)
where rs is the horizontal distance between the centre of gravity of the geobag and the rotation point, and ms is the vertical distance between the geobag’s centre of gravity and
the rotation point. When destabilising moments on the left side of Equation (5) increase, due to turbu-
lent bursting–induced flow through the revetment voids (Figure 5b) or an increase in flow
velocity and water depth, partial or full uplifting occurs, which results in instability of the geobag. At relatively low water levels, bag displacements were usually due to turbulent
bursting–induced flow through the revetment voids, which tended to lead to partial up-lifting. With increasing water levels, full upliftings associated with local vortices were the
typically observed failure modes.
(a) Definition sketch for the uplifting of a geobag
(b) Displacement due to partial uplifting (c) Pressure difference between main flow and void flow
Figure 5. Failure due to uplifting.
10 of 18
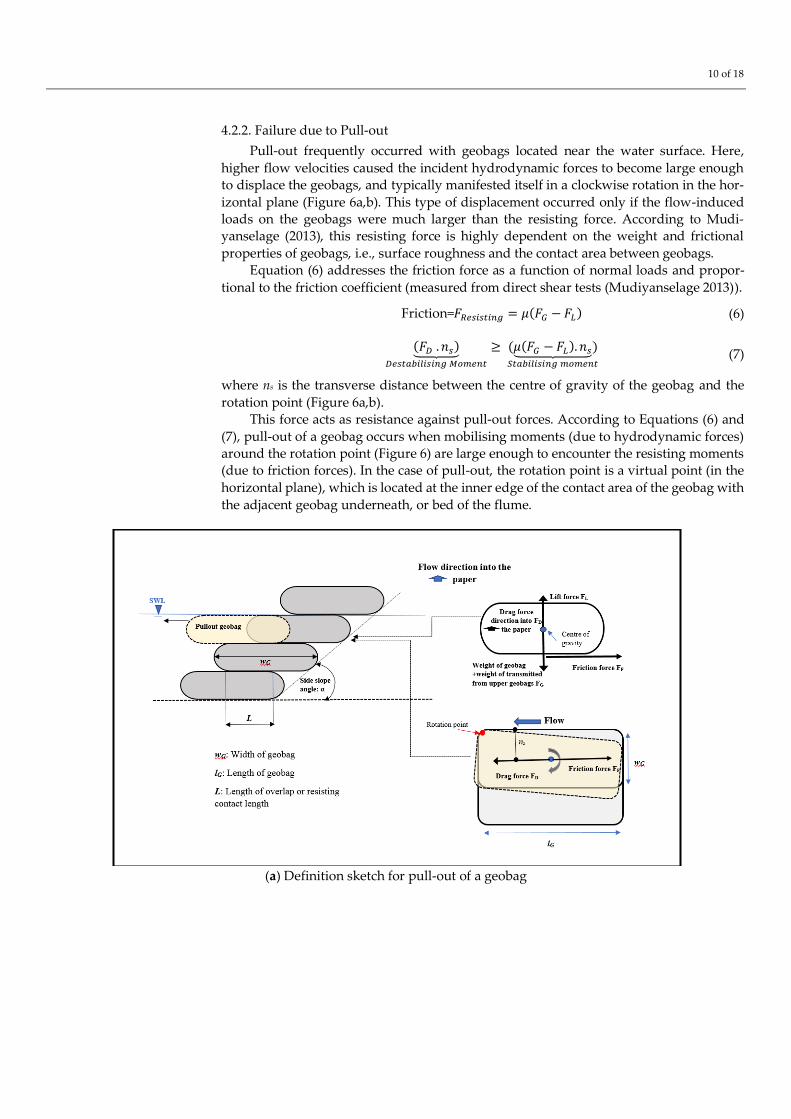
4.2.2. Failure due to Pull-out
Pull-out frequently occurred with geobags located near the water surface. Here,
higher flow velocities caused the incident hydrodynamic forces to become large enough to displace the geobags, and typically manifested itself in a clockwise rotation in the hor-
izontal plane (Figure 6a,b). This type of displacement occurred only if the flow-induced loads on the geobags were much larger than the resisting force. According to Mudi-yanselage (2013), this resisting force is highly dependent on the weight and frictional
properties of geobags, i.e., surface roughness and the contact area between geobags. Equation (6) addresses the friction force as a function of normal loads and propor-
tional to the friction coefficient (measured from direct shear tests (Mudiyanselage 2013)).
Friction=𝐹𝑅𝑒𝑠𝑖𝑠𝑡𝑖𝑛𝑔 = 𝜇(𝐹𝐺 − 𝐹𝐿) (6)
(𝐹𝐷 . 𝑛𝑠)⏟ 𝐷𝑒𝑠𝑡𝑎𝑏𝑖𝑙𝑖𝑠𝑖𝑛𝑔 𝑀𝑜𝑚𝑒𝑛𝑡
≥ (𝜇(𝐹𝐺 − 𝐹𝐿). 𝑛𝑠⏟ )𝑆𝑡𝑎𝑏𝑖𝑙𝑖𝑠𝑖𝑛𝑔 𝑚𝑜𝑚𝑒𝑛𝑡
(7)
where ns is the transverse distance between the centre of gravity of the geobag and the
rotation point (Figure 6a,b). This force acts as resistance against pull-out forces. According to Equations (6) and
(7), pull-out of a geobag occurs when mobilising moments (due to hydrodynamic forces) around the rotation point (Figure 6) are large enough to encounter the resisting moments (due to friction forces). In the case of pull-out, the rotation point is a virtual point (in the
horizontal plane), which is located at the inner edge of the contact area of the geobag with
the adjacent geobag underneath, or bed of the flume.
(a) Definition sketch for pull-out of a geobag
11 of 18
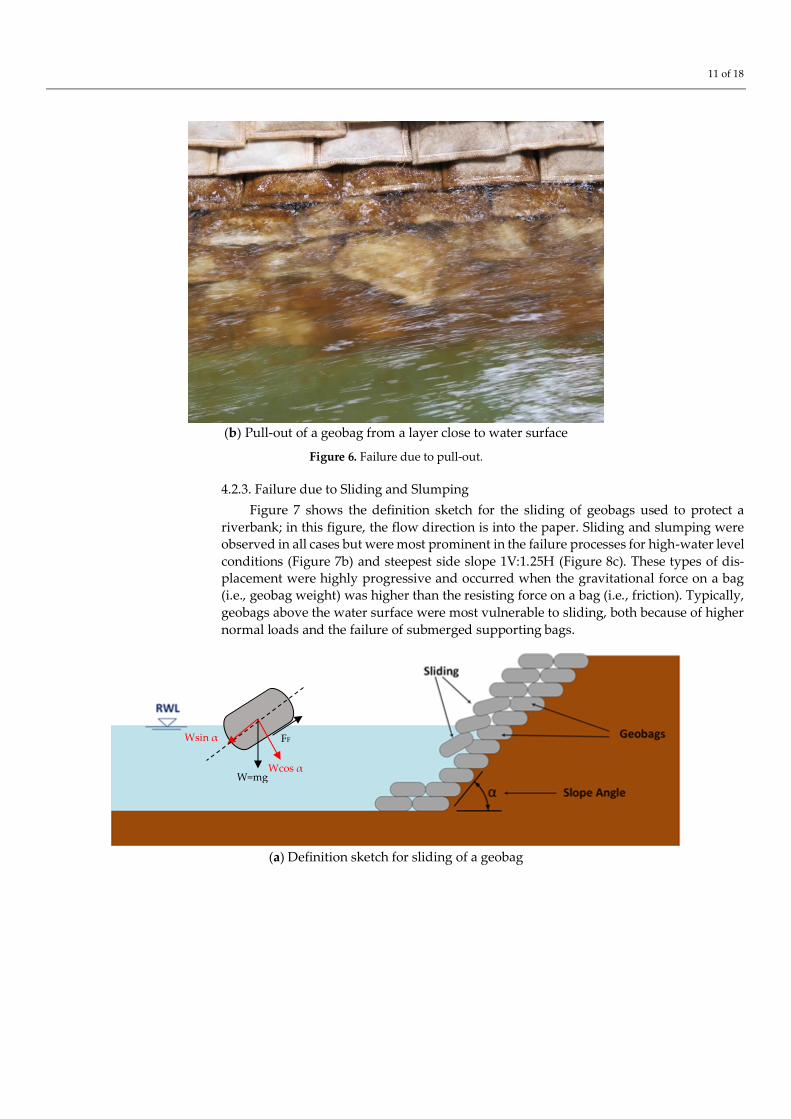
(b) Pull-out of a geobag from a layer close to water surface
Figure 6. Failure due to pull-out.
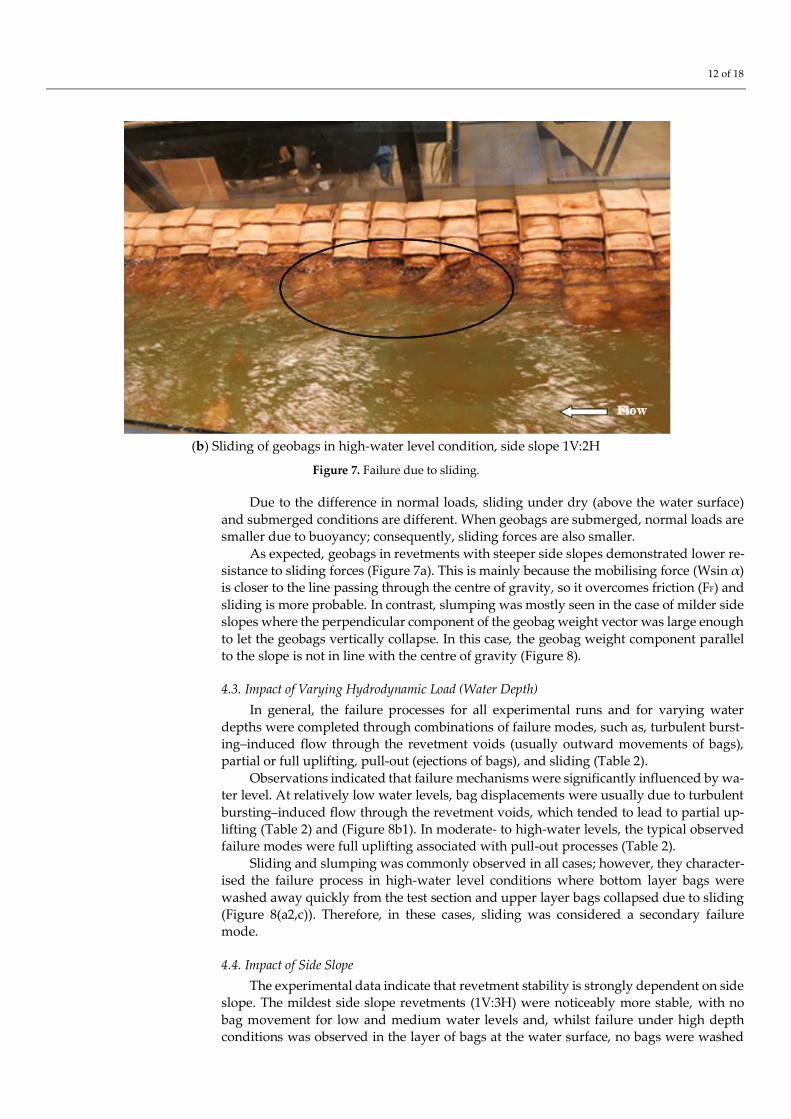
4.2.3. Failure due to Sliding and Slumping
Figure 7 shows the definition sketch for the sliding of geobags used to protect a
riverbank; in this figure, the flow direction is into the paper. Sliding and slumping were observed in all cases but were most prominent in the failure processes for high-water level
conditions (Figure 7b) and steepest side slope 1V:1.25H (Figure 8c). These types of dis-placement were highly progressive and occurred when the gravitational force on a bag (i.e., geobag weight) was higher than the resisting force on a bag (i.e., friction). Typically,
geobags above the water surface were most vulnerable to sliding, both because of higher
normal loads and the failure of submerged supporting bags.
(a) Definition sketch for sliding of a geobag
W=mg
Wsin α
Wcos α
FF
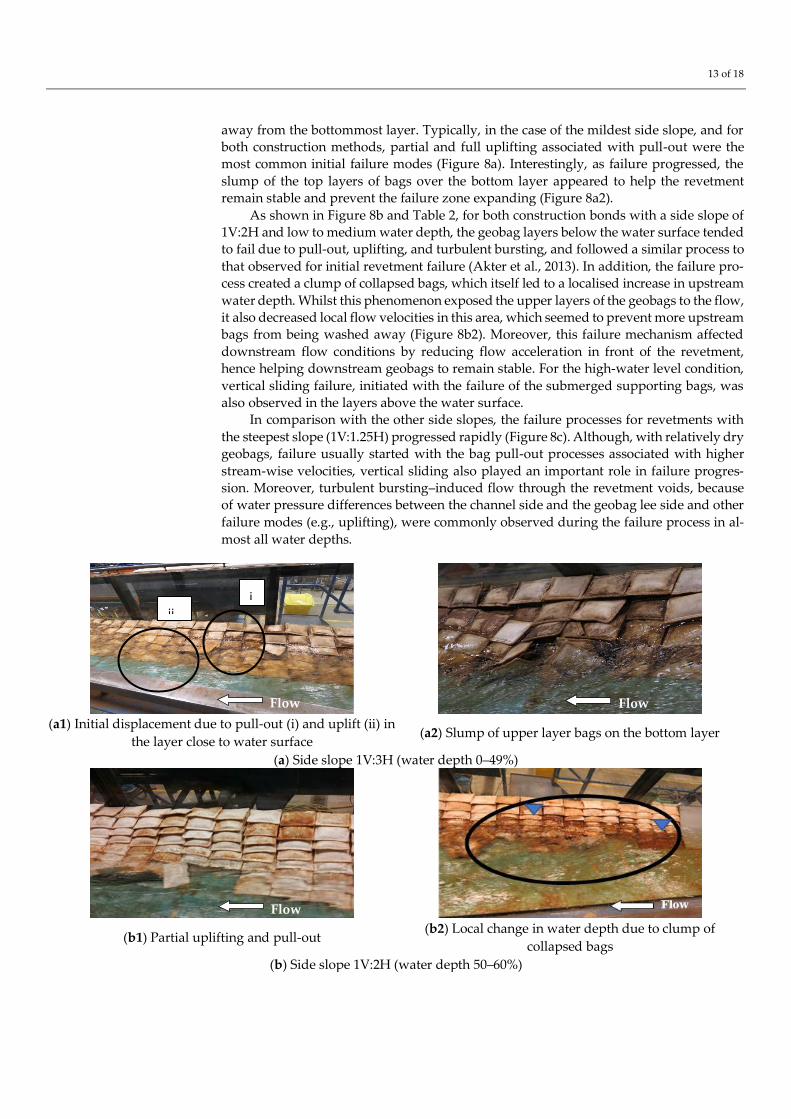
12 of 18
(b) Sliding of geobags in high-water level condition, side slope 1V:2H
Figure 7. Failure due to sliding.
Due to the difference in normal loads, sliding under dry (above the water surface)
and submerged conditions are different. When geobags are submerged, normal loads are smaller due to buoyancy; consequently, sliding forces are also smaller.
As expected, geobags in revetments with steeper side slopes demonstrated lower re-sistance to sliding forces (Figure 7a). This is mainly because the mobilising force (Wsin α) is closer to the line passing through the centre of gravity, so it overcomes friction (FF) and
sliding is more probable. In contrast, slumping was mostly seen in the case of milder side slopes where the perpendicular component of the geobag weight vector was large enough
to let the geobags vertically collapse. In this case, the geobag weight component parallel to the slope is not in line with the centre of gravity (Figure 8).
4.3. Impact of Varying Hydrodynamic Load (Water Depth)
In general, the failure processes for all experimental runs and for varying water
depths were completed through combinations of failure modes, such as, turbulent burst-ing–induced flow through the revetment voids (usually outward movements of bags), partial or full uplifting, pull-out (ejections of bags), and sliding (Table 2).
Observations indicated that failure mechanisms were significantly influenced by wa-ter level. At relatively low water levels, bag displacements were usually due to turbulent
bursting–induced flow through the revetment voids, which tended to lead to partial up-lifting (Table 2) and (Figure 8b1). In moderate- to high-water levels, the typical observed failure modes were full uplifting associated with pull-out processes (Table 2).
Sliding and slumping was commonly observed in all cases; however, they character-ised the failure process in high-water level conditions where bottom layer bags were
washed away quickly from the test section and upper layer bags collapsed due to sliding (Figure 8(a2,c)). Therefore, in these cases, sliding was considered a secondary failure mode.
4.4. Impact of Side Slope
The experimental data indicate that revetment stability is strongly dependent on side slope. The mildest side slope revetments (1V:3H) were noticeably more stable, with no
bag movement for low and medium water levels and, whilst failure under high depth conditions was observed in the layer of bags at the water surface, no bags were washed
13 of 18
away from the bottommost layer. Typically, in the case of the mildest side slope, and for both construction methods, partial and full uplifting associated with pull-out were the most common initial failure modes (Figure 8a). Interestingly, as failure progressed, the
slump of the top layers of bags over the bottom layer appeared to help the revetment remain stable and prevent the failure zone expanding (Figure 8a2).
As shown in Figure 8b and Table 2, for both construction bonds with a side slope of 1V:2H and low to medium water depth, the geobag layers below the water surface tended to fail due to pull-out, uplifting, and turbulent bursting, and followed a similar process to
that observed for initial revetment failure (Akter et al., 2013). In addition, the failure pro-cess created a clump of collapsed bags, which itself led to a localised increase in upstream
water depth. Whilst this phenomenon exposed the upper layers of the geobags to the flow, it also decreased local flow velocities in this area, which seemed to prevent more upstream bags from being washed away (Figure 8b2). Moreover, this failure mechanism affected
downstream flow conditions by reducing flow acceleration in front of the revetment, hence helping downstream geobags to remain stable. For the high-water level condition,
vertical sliding failure, initiated with the failure of the submerged supporting bags, was also observed in the layers above the water surface.
In comparison with the other side slopes, the failure processes for revetments with
the steepest slope (1V:1.25H) progressed rapidly (Figure 8c). Although, with relatively dry geobags, failure usually started with the bag pull-out processes associated with higher
stream-wise velocities, vertical sliding also played an important role in failure progres-sion. Moreover, turbulent bursting–induced flow through the revetment voids, because of water pressure differences between the channel side and the geobag lee side and other
failure modes (e.g., uplifting), were commonly observed during the failure process in al-
most all water depths.
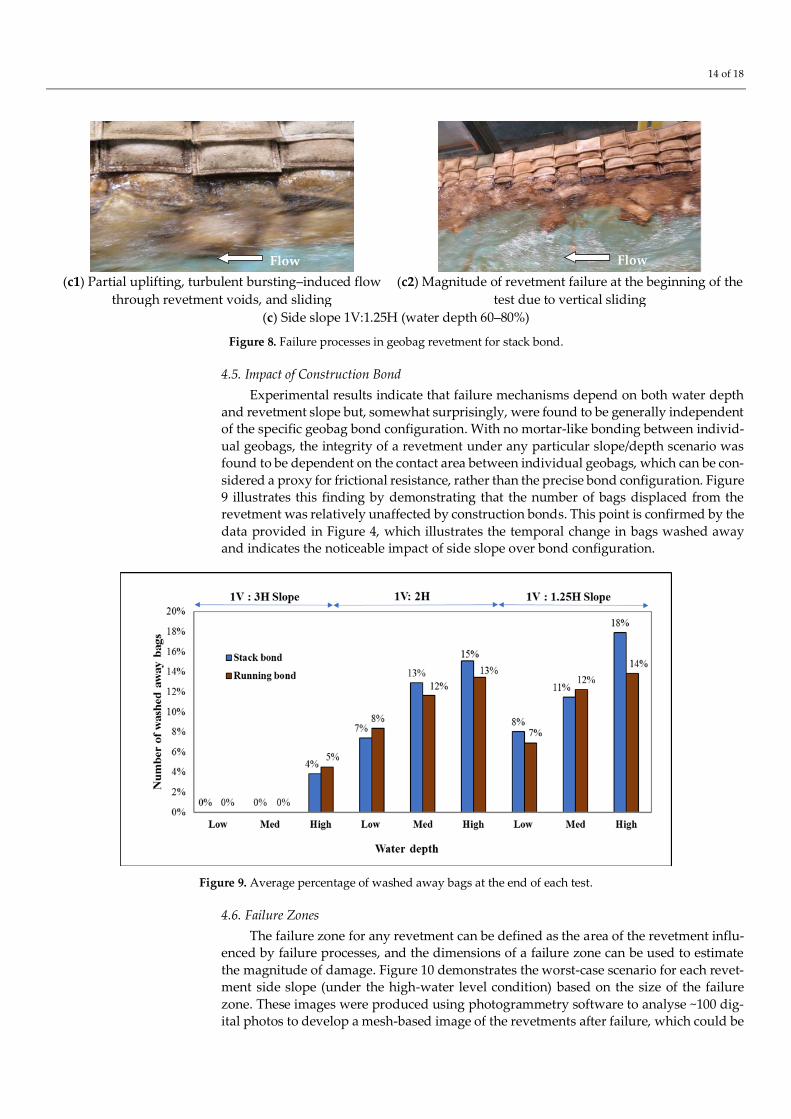
(a1) Initial displacement due to pull-out (i) and uplift (ii) in
the layer close to water surface (a2) Slump of upper layer bags on the bottom layer
(a) Side slope 1V:3H (water depth 0–49%)
(b1) Partial uplifting and pull-out (b2) Local change in water depth due to clump of
(c2) Magnitude of revetment failure at the beginning of the
test due to vertical sliding
(c) Side slope 1V:1.25H (water depth 60–80%)
Figure 8. Failure processes in geobag revetment for stack bond.
4.5. Impact of Construction Bond
Experimental results indicate that failure mechanisms depend on both water depth and revetment slope but, somewhat surprisingly, were found to be generally independent of the specific geobag bond configuration. With no mortar-like bonding between individ-
ual geobags, the integrity of a revetment under any particular slope/depth scenario was found to be dependent on the contact area between individual geobags, which can be con-
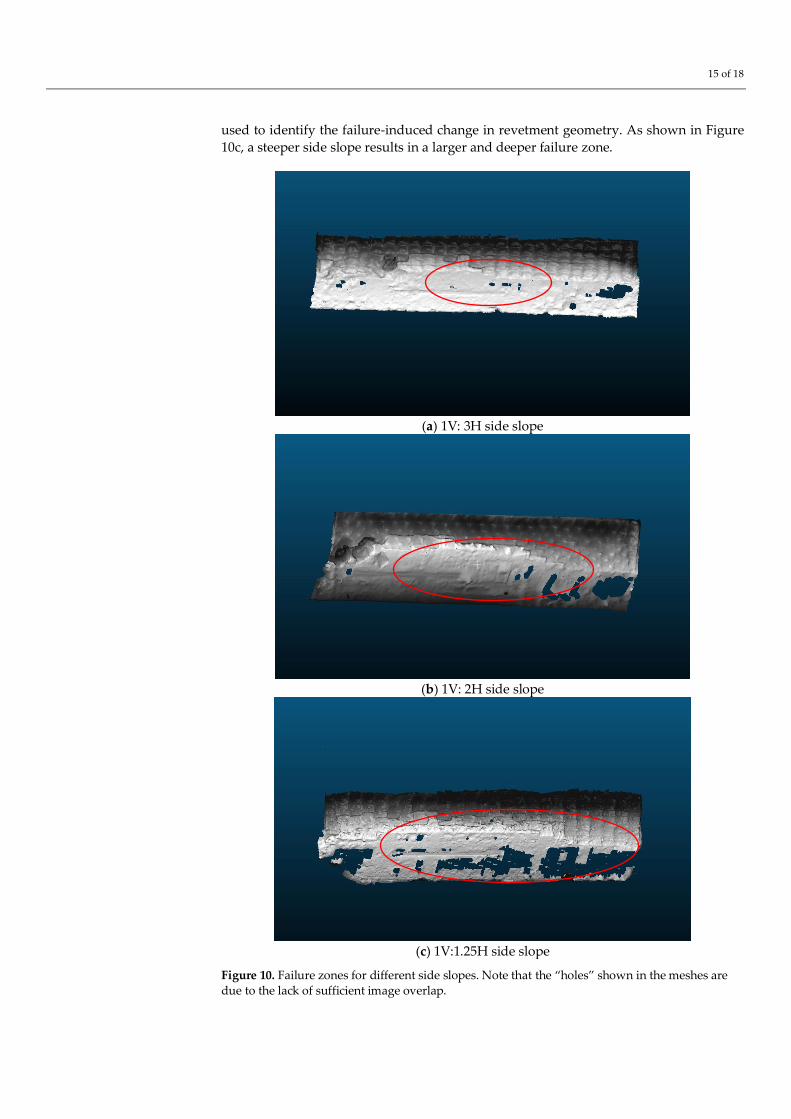
sidered a proxy for frictional resistance, rather than the precise bond configuration. Figure 9 illustrates this finding by demonstrating that the number of bags displaced from the revetment was relatively unaffected by construction bonds. This point is confirmed by the
data provided in Figure 4, which illustrates the temporal change in bags washed away and indicates the noticeable impact of side slope over bond configuration.
Figure 9. Average percentage of washed away bags at the end of each test.
4.6. Failure Zones
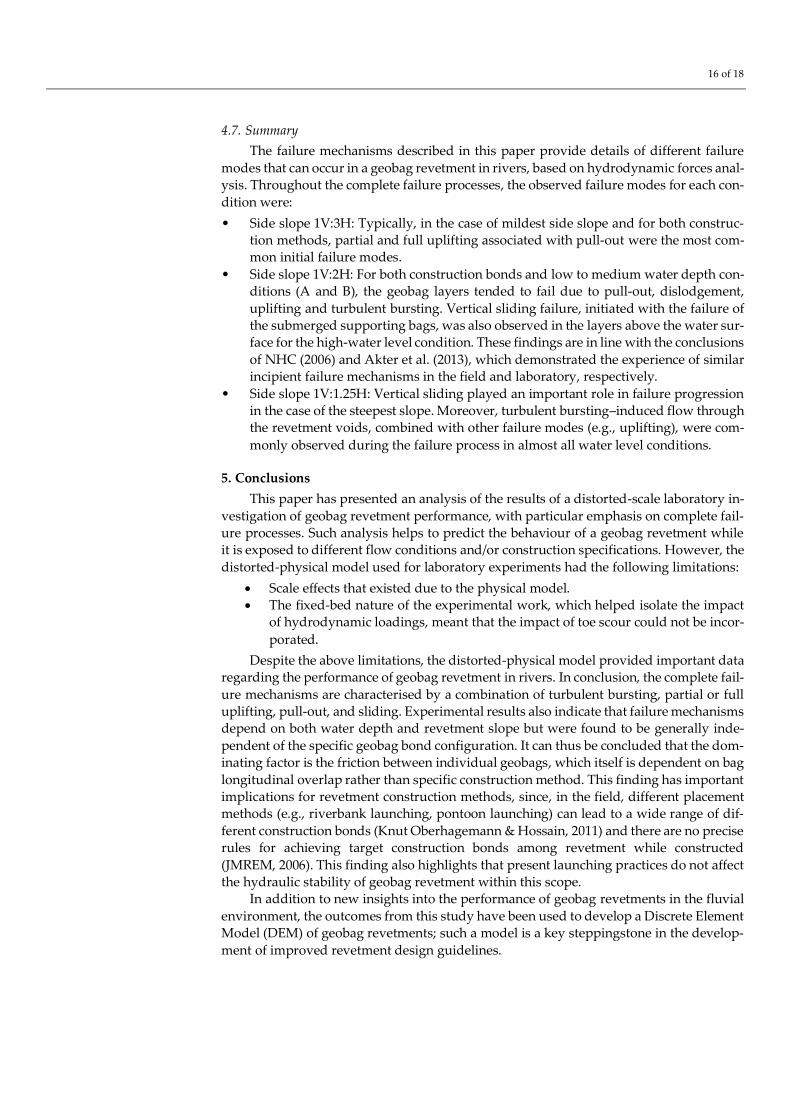
The failure zone for any revetment can be defined as the area of the revetment influ-enced by failure processes, and the dimensions of a failure zone can be used to estimate
the magnitude of damage. Figure 10 demonstrates the worst-case scenario for each revet-ment side slope (under the high-water level condition) based on the size of the failure
zone. These images were produced using photogrammetry software to analyse ~100 dig-ital photos to develop a mesh-based image of the revetments after failure, which could be
Flow Flow
15 of 18
used to identify the failure-induced change in revetment geometry. As shown in Figure
10c, a steeper side slope results in a larger and deeper failure zone.
(a) 1V: 3H side slope
(b) 1V: 2H side slope
(c) 1V:1.25H side slope
Figure 10. Failure zones for different side slopes. Note that the “holes” shown in the meshes are due to the lack of sufficient image overlap.
16 of 18
4.7. Summary
The failure mechanisms described in this paper provide details of different failure
modes that can occur in a geobag revetment in rivers, based on hydrodynamic forces anal-ysis. Throughout the complete failure processes, the observed failure modes for each con-
dition were:
• Side slope 1V:3H: Typically, in the case of mildest side slope and for both construc-tion methods, partial and full uplifting associated with pull-out were the most com-mon initial failure modes.
• Side slope 1V:2H: For both construction bonds and low to medium water depth con-ditions (A and B), the geobag layers tended to fail due to pull-out, dislodgement,
uplifting and turbulent bursting. Vertical sliding failure, initiated with the failure of the submerged supporting bags, was also observed in the layers above the water sur-face for the high-water level condition. These findings are in line with the conclusions
of NHC (2006) and Akter et al. (2013), which demonstrated the experience of similar incipient failure mechanisms in the field and laboratory, respectively.
• Side slope 1V:1.25H: Vertical sliding played an important role in failure progression in the case of the steepest slope. Moreover, turbulent bursting–induced flow through the revetment voids, combined with other failure modes (e.g., uplifting), were com-
monly observed during the failure process in almost all water level conditions.
5. Conclusions
This paper has presented an analysis of the results of a distorted-scale laboratory in-
vestigation of geobag revetment performance, with particular emphasis on complete fail-ure processes. Such analysis helps to predict the behaviour of a geobag revetment while it is exposed to different flow conditions and/or construction specifications. However, the
distorted-physical model used for laboratory experiments had the following limitations:
• Scale effects that existed due to the physical model. • The fixed-bed nature of the experimental work, which helped isolate the impact
of hydrodynamic loadings, meant that the impact of toe scour could not be incor-
porated.
Despite the above limitations, the distorted-physical model provided important data regarding the performance of geobag revetment in rivers. In conclusion, the complete fail-
ure mechanisms are characterised by a combination of turbulent bursting, partial or full uplifting, pull-out, and sliding. Experimental results also indicate that failure mechanisms depend on both water depth and revetment slope but were found to be generally inde-
pendent of the specific geobag bond configuration. It can thus be concluded that the dom-inating factor is the friction between individual geobags, which itself is dependent on bag
longitudinal overlap rather than specific construction method. This finding has important implications for revetment construction methods, since, in the field, different placement methods (e.g., riverbank launching, pontoon launching) can lead to a wide range of dif-
ferent construction bonds (Knut Oberhagemann & Hossain, 2011) and there are no precise rules for achieving target construction bonds among revetment while constructed
(JMREM, 2006). This finding also highlights that present launching practices do not affect the hydraulic stability of geobag revetment within this scope.
In addition to new insights into the performance of geobag revetments in the fluvial
environment, the outcomes from this study have been used to develop a Discrete Element Model (DEM) of geobag revetments; such a model is a key steppingstone in the develop-
ment of improved revetment design guidelines.
17 of 18
Author Contributions:
Funding:
Data Availability Statement:
Acknowledgments: This study has been funded by the Institutes for Infrastructure and Environ-ment at Heriot-Watt University and the University of Edinburgh, with additional support provided by NAUE Gmbh & Co. Their support is gratefully acknowledged.
Conflicts of Interest:
Notation
AS cross area normal to the flow (m2)
At projected area of the geobag in the flow direction (m2)
CL Coefficients of lift force (-)
CD Coefficients of drag force (-)
CM Coefficients of inertia (-)
FA Buoyancy Force (N)
FD Drag force (N)
FG Gravitational force (N)
FL Lift force (N)
g gravity acceleration (m s−²)
hG thickness of geobag
lG length of geobag
U horizontal flow velocity (m s−1)
Vgeobag volume of geobag (m3)
α Slope angle of the revetment
ρw = density of water (kg m−3)
ρs density of dry geobag (kg m·3)
friction coefficient (-)
References
1. Akter, A.; Pender, G.; Wright, G.; Crapper, M. Predicting the hydrodynamic forces on geobag revetments. J. Flood Risk Manag. 2011, 4, 328–338, doi:10.1111/j.1753-318X.2011.01117.x.
2. Akter, A. Modelling of Geobags for River Bank Protection; Heriot-Watt University: Edinburgh, UK, 2011. 3. Akter, A.; Pender, G.; Wright, G.; Crapper, M. Performance of a geobag revetment. I: Quasi-physical modeling. J. Hydraul. Eng.
2013, 139, 865–876. 4. Akter, A.; Wright, G.; Crapper, M.; Pender, G. Failure Mechanism in Geobag Structure. In Proceedings of the 4th IASME/WSEAS
International Conference on Water Resources, Hydraulics and Hydrology (WHH'09), Cambridge, UK, 24–26 February 2009. 5. Bezuijen, A.; De Groot, M.B.; Breteler, M.K.; Berendsen, E. Placing accuracy and stability of geocontainers. Proc. EuroGeo 2004,
3. 6. British Standards Institution (BSI). Hydrometry. In Measurement of Liquid Flow in Open Channels Using Current-Meters or Floats;
BSI: London, UK, 2007. 7. Dassanayake, D.T.; Oumeraci, H. Engineering properties of geotextile sand containers and their effect on hydraulic stability
and damage development of low-crested/submerged structures. Int. J. Ocean Clim. Syst. 2012, 3, 135–150. 8. Dassanayake, D.T.; Oumeraci, H. Important engineering properties of geotextile sand containers and their effect on the hydrau-
lic stability of GSC-structures. Terra Aqua J. 2012, 127, 3–11. 9. Jackson, A.; Corbett, B.; Restall, S. Failure modes & stability modelling for design of sand filled geosynthetic structures. In
Proceedings of the 30th International Conference on Coastal Engineering, San Diego, CA, USA, 3–8 September 2006; pp. 1–20. 10. JMREM. Jamuna-Meghna River Erosion Mitigation Project Part B. In Special Report 17, Geobag Revetments; Government of the
People’s Republic of Bangladesh, Asian Development Bank and Bangladesh Water Development Board: 2006. 11. Mori, E.; Amini, P.L.; Eliso, C.D. Field experiment on a groin system built with sand bags. In Proceedings of the International
Conference on Coastal Engineering, Hamburg, Germany, 31 August–5 September 2008; 219. 12. Dassanayake Mudiyanselage, D.T.B.D. Experimental and Numerical Modelling of the Hydraulic Stability of Geotextile Sand
Containers for Coastal Protection. 2013.
18 of 18
13. NHC, N.H.C. Jamuna-Meghna River Erosion Mitigation Project Part B. In Special Report 11, Physical Model Study (Vancouver, Canada), Final Report; Government of the People’s Republic of Bangladesh, Asian Development Bank and Bangladesh Water Development Board: 2006.
14. Oberhagemann, K.; Stevens, M.A.; Haque, S.M.S.; Faisal, M.A. Geobags for Riverbank Protection. In Proceedings of the ICSE-3rd International Conference on Scour and Erosion, Amsterdam, The Netherlands, 1–3 November 2006.
15. Oberhagemann, K.; Hossain, M. Geotextile bag revetments for large rivers in Bangladesh. Geotext. Geomembr. 2011, 29, 402–414. 16. Oumeraci, H.; Hinz, M.; Bleck, M.; Kortenhaus, A. Sand-filled geotextile containers for shore protection. In Proceedings of the
COPEDEC VI, Colombo, Sri Lanka, 15–19 September 2003. 17. Recio, J.; Oumeraci, H. Process based stability formulae for coastal structures made of geotextile sand containers. Coast. Eng.
2009, 56, 632–658. 18. Recio, J.; Oumeraci, H. Processes affecting the hydraulic stability of coastal revetments made of geotextile sand containers. Coast.
Eng. 2009, 56, 260–284. 19. Saathoff, F.; Oumeraci, H.; Restall, S. Australian and German experiences on the use of geotextile containers. Geotext. Geomembr.
2007, 25, 251–263. 20. Yang, S.Q.; Shu, Y.M.; Yang, X.C. Flume experiment and numerical analysis for bank reinforcement with geocontainer. In Geo-
synthetics in Civil and Environmental Engineering; Springer: Berlin, Germany, 2008; pp. 630–636.
21. Zhu, L.; Wang, J.; Cheng, N.-S.; Ying, Q.; Zhang, D. Settling distance and incipient motion of sandbags in open channel flows. J. Waterw. Port Coast. Ocean Eng. 2004, 130, 98–103.