Laboratory Manual 1.0.7 Background What is X-ray Diffraction? X-rays scatter off of electrons, in a process of absorption and re-admission. Diffraction is the accumulative result of the x-ray scattering of a group of electrons that are spaced in an orderly array. For an incident X-ray photon of monochromatic wavelength λ, coherent waves are produced from the sample at an angle of θ (2-θ with respect to the incident x-ray beam) if the electron groups interact with the x-ray beam and are spaced at a repeat distance d. The interaction is described by Bragg's law : nλ=2dsinθ. The intensity of the scattered x-ray is proportional to the number of electrons that the x-ray is scattered from. Why use X-rays? Normally one would use a microscope to view small objects. For a microscope, light is scattered by an object and collected using lenses, which in turn magnifies the image of the object. The limit of the microscope is intrinsic to the nature of the electromagnetic radiation that is used to probe the object. If we use white light we cannot look at objects smaller than the wavelength of light, which is about 10 -6 m. Since the atom has dimensions of about 10 -10 m we cannot image an atom with a photon of white light. X-rays, on the other hand, have a wavelength of about 10 -10 m and are suitable for imaging objects at the atomic scale. What are X-rays X-rays are electromagnetic radiation of wavelength about 1 Å (10 -10 m) which is about the same size as an atom. They occur in that portion of the electromagnetic spectrum between gamma rays and the ultraviolet. The discovery of X-rays in 1895 enabled scientists to probe crystalline structure at the atomic level. X-ray diffraction has been employed in two main areas: for the fingerprint characterization of crystalline materials and the determination of their structure. Each crystalline solid has its unique characteristic X-ray powder pattern, which may be used as a "fingerprint" for its identification. Once the material has been identified, X-ray crystallography may be used to determine its structure, i.e. how the atoms pack together in the crystalline state and what the inter-atomic distance and angle are etc. X-ray diffraction is one of the most important characterization tools used in solid-state chemistry and materials science. We can determine the size and the shape of the unit cell for any compound most easily using the diffraction of x-rays. Diffraction of X-rays
Transcript
Laboratory Manual 1.0.7 Background What is X-ray Diffraction?
X-rays scatter off of electrons, in a process of absorption and re-admission. Diffraction is the accumulative result of the x-ray scattering of a group of electrons that are spaced in an orderly array. For an incident X-ray photon of monochromatic wavelength λ, coherent waves are produced from the sample at an angle of θ (2-θ with respect to the incident x-ray beam) if the electron groups interact with the x-ray beam and are spaced at a repeat distance d. The interaction is described by Bragg's law : nλ=2dsinθ. The intensity of the scattered x-ray is proportional to the number of electrons that the x-ray is scattered from.
Why use X-rays?
Normally one would use a microscope to view small objects. For a microscope, light is scattered by an object and collected using lenses, which in turn magnifies the image of the object. The limit of the microscope is intrinsic to the nature of the electromagnetic radiation that is used to probe the object. If we use white light we cannot look at objects smaller than the wavelength of light, which is about 10 -6 m. Since the atom has dimensions of about 10-10 m we cannot image an atom with a photon of white light. X-rays, on the other hand, have a wavelength of about 10 -10 m and are suitable for imaging objects at the atomic scale.
What are X-rays
X-rays are electromagnetic radiation of wavelength about 1 Å (10-10m) which is about the same size as an atom. They occur in that portion of the electromagnetic spectrum between gamma rays and the ultraviolet. The discovery of X-rays in 1895 enabled scientists to probe crystalline structure at the atomic level. X-ray diffraction has been employed in two main areas: for the fingerprint characterization of crystalline materials and the determination of their structure. Each crystalline solid has its unique characteristic X-ray powder pattern, which may be used as a "fingerprint" for its identification. Once the material has been identified, X-ray crystallography may be used to determine its structure, i.e. how the atoms pack together in the crystalline state and what the inter-atomic distance and angle are etc. X-ray diffraction is one of the most important characterization tools used in solid-state chemistry and materials science. We can determine the size and the shape of the unit cell for any compound most easily using the diffraction of x-rays.
Diffraction of X-rays
Given that two parallel rays will strike a grating at an angle theta where the grating separation is given as d then :
An interference maximum will be observed when Γ is an integral multiply (n) of λ.
This leads to the Bragg equation: nλ = 2dsinθ
d 2d
θ
θ
θ
θ 2d
Γ λθλ
θ
θ
===Γ
=−=Γ=−=ΓΓ=
Γ=
sin2)(
''''
sin22
sin
ddifferencepathBC
BCABACthenABBAgivenBAAC
dd
A B
C
A'
B'
X-ray Sources and Monochromation. The two sources for in-house or laboratory X-rays are the sealed-tube and the rotating anode types. The sealed tube is simply a glass or ceramic tube where a tungsten cathode has been placed above a metallic stationary anode. The tube is then evacuated and current is applied to the cathode and the anode. A rotating anode is similar to the sealed tube instrument except for the fact that the metallic anode is now spinning. The spinning anode spreads the heat of the electron bombardment over a wider area. This allows for higher wattages, which produces a higher X-ray flux. For diffraction experiments the X-rays should be monochromatic. To do this we employ either a crystal monochromator or a metallic filter. The crystal monochromator produces more monochromatic X-rays at the expense of X-ray flux. The metallic filter is normally used with powder diffraction and results in high X-ray flux with poor monochromation. The anode is also rectangular which allows for a line focus (which is broad but has low flux and a point focus, which is intense but has a narrow illumination area. In practice the line focus is used with powder diffraction so as to illuminate more sample and the point focus is used in single crystal and small angle x-ray scattering instruments for higher flux for small samples.
X-ray Sources
cathode
50kV
anode
e-
Be window
primary beam
main beam crystal (graphite) monochromator
Focus
anode (top view)
line focus
point focus
sealed tube
rotating anode
Normal operation 40kV and 40ma the power = 1600 watts
metal filter
anode
rotating anode ~4000rpm
50kV
cathode
e-
main beam
evacuated chamber
Normal operation 50kV x 180ma the power = 9000 watts
The primary beam is used for experimentation.
Single crystal work requires a point focus, while powder work employs the line focus
The x-rays that are generated are of two types
1) Characteristic (ejection of electrons from the atom in the anode 2) White Radiation (synchrotron effect)
e-
The energy of the X-ray is determined from the observed
wavelength and is given by the formula :
Energy (KeV) = 1.2398 / λ (nm)
M Characteristic X-rays Kalpha Kbeta
White Radiation “Bremsstrahlung” or breaking radiation
Electron strikes the target and ejects an electron. The cascade of electrons from higher orbitals generates X-ray
Electron reaccelerate when entering the metal and "bend" their trajectory path. Loss of momentum results in generation of X-rays.
Profile of X-rays generated by electron ejection and momentum loss. K alpha and K beta are the characteristic X-rays from the lowest electron shells and are superimposed on the white radiation.
Energy for K alpha (for Mo) = 17.28 KeV
Powder and Single Crystal Diffraction normally employ the Kα characteristic radiation, due to its intensity and monochromatic wavelengths.
Laboratory 1. Radiation Safety for X-ray Diffractometers To begin the X-ray Crystallography Laboratory you must complete the on-line X-ray safety training. http://xray.tamu.edu/safety_training.php The following appendix is available for your information and not necessary reading. Bibliography "Procedures Manual for Use of Radioisotopes and Radiation Producing Devices", Office of Radiological Safety, Texas A & M University "A Guide to the Safe Use of X-ray Diffraction and Spectrometry Equipment", Martin, E., Science Reviews Ltd., Ash Drive, Leeds, LS 17 8RA U.K. "A Case History of Severe Radiation Burns from 50 kVC X-rays", Steidley, K., Stabile, R. & Santillippo, L. Health Physics (1981). 40 399-405. "Analytical X-ray Hazards: A Continuing Problem" Lubenau, J., Davis, J., McDonald, D. & Gerusky, T. Health Physics (1969). 16, 739-746. "Occupational Hazards in X-ray Analytical Work" Lindel, B. Health Physics (1968). 15, 481-486. "Incidence, Detection and Monitoring of Radiation from X-ray Analytical Instrumentation" Jenkins, R. & Haas, D. X-ray Spectrom (1975). 4, 33-39. "Protection Against Radiation Injury" Cook, J. & Oosterkamp, W. International Tables for Crystallography (1962). 333 -338.
Warning : This laboratory employs X-rays (~10KeV). X-rays are hazardous. All necessary safety procedures are in place. Instructors will mount/dismount samples. The student is not allowed to enter the x-ray enclosure.
Learning Experiences
• Materials Analysis • Qualitative Analysis • Bragg's Law
In this lab you will measure the x-ray powder diffraction pattern from silicon. Your TA will give you the sample to be measured and show you how to set up the D8 x-ray diffractometer. You should measure all the values of 2theta from the chart, and after converting them into d values calculate the repeat distance in your unit cell. In your lab notebook list all the 2theta values with their corresponding values of n and d. INSTRUMENTATION The X-ray diffraction experiment requires an X-ray source, the sample under investigation and a detector to pick up the diffracted X-rays. Figure 1 is a schematic diagram of a powder X-ray diffractometer. Fig. 1. Schematic of an X-ray powder diffractometer
θ θ R1
X-ray Tube X-ray Detector
Receiving Slit R2
R1 = R2 Sample
The X-ray radiation most commonly used is that emitted by copper, whose characteristic average wavelength for the K radiation is 1.5418Å. When the incident beam strikes a powder sample, diffraction occurs in every possible orientation of 2theta. The diffracted beam may be detected by using a moveable detector such as a x-ray counter, which is connected to a computer. In normal use, the counter is set to scan over a range of 2theta values at a constant angular velocity. Routinely, a 2theta range of 5 to 90 degrees is sufficient to cover the most useful part of the powder pattern.
PROCEDURE
**Do not open the enclosure while the alarm red light is on.
1. Obtain a sample from your instructor and place it into the sample holder. 2. Place sample holder in the sample positioner. 3. Record the values of the fixed slits. 4. Close the DOORS. The green ready light should be the only LED displayed 5. Run the COMMANDER program. 6. For RAW-file name type ijkSILICON wher ijk are YOUR initials 7. Add a title under sample identification. 8. Set the instrument at optimum setting as follows
time constant 1 deg/min range 20 to 90o (2θ)
step size .04
9. Your scan should be complete in about 30 mins. 10. Save the *.raw file when scan is complete.
11. When finished : Close all windows and start EVA
12. Start the EVA program and import your “RAW” file.
13. Locate all peaks on the chart and corresponding 2theta values and write their values into your lab notebook. Perform the necessary calculations in the table and calculate the repeat distance.
14. Use the ZOOM key to zoom out the plot (if necessary). 15. Keep this information for Laboratory 3.
(You can cut and paste the results from the peak list to the notepad)
Use slid bar append to list when finished
type this tab to get the peak list.
16. Find Silicon in the ICCD data base.
17. PLOT the results
23. Print the results and be sure you have written down the peak positions.
toggle all unwanted red all wanted green
CHECK ONLY THE *
reference peaks appear in red
Laboratory 3. Indexing Powder Patterns
Learning Experiences
o - How to manually index a simple powder pattern. o - Mathematics involved in pattern indexing
In this lab you will manually index the powder pattern for Silicon. An example of how to index powder patterns is presented. The mathematics are introduced and the step by step procedure is presented. You will need a calculator and a pencil. For the peak positions of Silicon use the values that you determined in Laboratory 2. or ask your Laboratory assistant for the values. ---------------------------------------------------------------------- Example How to Index the powder pattern for NaCl Analytical Method : Equations Given Bragg’s Law
2
22
4sin
2sin
sin2
d
dn
nd
λθ
λθ
λθ
=
=
=
d* can be determined as : d* = 1/d = (h2a* + k2b*+ l2c* + 2hka*b*cosγ* + 2hla*c*cosβ* + 2klb*c*cosα*)1/2 See "Crystal Structure Determination" by Werner Massa pp 23-25.
For a cubic system a* = b*= c* = 1/a and α* = β* = γ* = 90 cos γ* = 0.000 then
Let X = λ2/4a2 and M = h2+k2+l2 Now create a table for M values given h,k and l are integers
some h,k,l values share h2+k2+l2 sums e.g. 2,2,1 and 3,0,0 sum to h2+k2+l2 = 9 h, k and l must be integers. Not all h2+k2+l2 sums have integer h, k, l values (i.e. some h2+k2+l2 values are not possible)
137.47 68.735 0.868462 0.434231 0.289487 0.217115 0.173692 0.144744 0.108558 0.096496 0.086846 0.086846 0.078951 Largest common sin2θ/M value(s) (X) are (see bold values above) 0.036268 = 0.036242 = 0.036225 = 0.036206 = 0.0362 ± 0.001 = X inserting = 0.0362 into the equation affords : 0.0362 = λ2/4a2 a = (1.54056 Å)2 / 4 (0.0362)2 = 4.049 Å From Table 2 we see that 0.0362 is the result for sin2θ/M3 : M3 is the result for h =1, k =1 and l =1. Completing the table for the first 4 peaks we now can assign these peaks with h,k,l values Table 3. M = h2 + k2 + l2
h k l M 1 1 1 3 2 0 0 4 2 2 0 8 3 1 1 11
Or we can solve Bragg’s equation for each observed peak. For example for 2θ = 38.52 : sin2θ/0.0362 = 3.005652 or 3.00. From table 1 we see that M=3 is equivalent to h=1, k=1 and l =1. Therefore the peak at 38.52 is assigned as the (1,1,1) reflection. Table 4 summarizes the results for all peaks and assigns their h,k,l values.
some h,k,l values share h2+k2+l2 sums e.g. 2,2,1 and 3,0,0 sum to h2+k2+l2 = 9 h, k and l must be integers. Not all h2+k2+l2 sums have integer h, k, l values (i.e. some h2+k2+l2 values are not possible)
Table 2. List of sin2θ / Mn (n=1,..) use only observed Mn From your peak list from Laboratory 2 fill in this table. For example a peak at 26o 2θ will afford θ = 13o sin2(13) = 0.0506 sin2(13)/M1 = 0.0506/1 = 0.0506 sin2(13)/M2 = 0.0506/2 = 0.0253 Complete this table for your peaks. (or you may generate a spread sheet in EXCEL to do the same thing)
Largest common sin2θ value from Table 2 (value of X) = _________ Remember X = λ2/4a2 Calculate unit cell a given λ = 1.54056Å _________ Now complete Table 3 from the given information assign the h,k,l value for each peak. Table 3 List of h, k, l values Peak # sin2θ sin2θ/A h2+k2+l2=M hkl
1 2 3 4 5 6 7 8 9 10
Laboratory 4. Indexing Complex Patterns
Learning Experiences
o - Use of computer peak picking and indexing programs o - Programs that you will use
Powder X (C. Dong)
"PowderX: Windows-95 based program for powder X-ray diffraction data processing", C. Dong, J. Appl. Cryst. (1999), 32, 838-838
Treor (P-E. Werner)
TREOR, a semi-exhaustive trial-and-error powder indexing program for all symmetries. Werner,P.-E.,Eriksson,L. and Westdahl,M., J.Appl. Cryst.. 18(1985)367-370.
Link to this web site to download POWDERX : www.chem.tamu.edu/xray/pwdx.zip
In this lab you will index a powder pattern from a known and unknown sample. You will need to use the computers in the X-ray Laboratory. Bring a calculator, your notebook and a pencil. The three steps to Indexing and Refined Unit Cell Parameters 1. Peak Picking - Generation of a list of dhkl and their intensities 2. Peak Indexing with the program TREOR
- Choice of unit cell parameters based on the number of reflections indexed and the figure of merit.
3. Indexing and Cell parameters refinement
1. Peak Picking. Begin the program POWDERX and load the Ascorbic Acid data.
--- Point to peak and pick simple peak (picking)
Pick show and ok (do not change the tolerances)
Note : The raw data file is in the BRUKER RAW format. This is input with the Simens *.RAW selection. (Siemens was bought out by BRUKER in 2000)
Keep the wavelength and save the results.
Caution : If you have background that has been choosen as a peak then click on the ZOOM feature and ZOOM in on the area in question. Then use the add/delete peak function (right click on peak) to remove the unwanted peak. When in doubt ask the instructor
Point to OK
Example of the Table of peak positions from the peak Pick routine
Step 2. Indexing unit cell with the program TREOR Point to index and Treor
Point to file and use current peaks
Save (overwrite) the file if prompted.
You should see a table similar to this one. This is the TREOR input file and can be edit if necessary..
Point to Start and VBTreor90
Let the program run and examine (print) the output for later study. (point to file and then print)
Summary of TEROR output Scroll down the TEROR listing file and find : THIS MAY BE THE SOLUTION This is a good sign that you have successfully indexed the cell 0 LINES ARE UNINDEXED. <-number of peaks not indexed 0 is good M-TEST= 27 UNINDEXED IN THE TEST=0 THIS MAY BE THE SOLUTION !!! THE REFINEMENT OF THE CELL WILL NOW BE REPEATED THREE CYCLES MORE. --- GOOD LUCK ! .... The predicted unit cell NUMBER OF SINGLE INDEXED LINES = 24 TOTAL NUMBER OF LINES = 40 A = 17.288210 0.001634 A ALFA= 90.000000 0.000000 DEG. B = 6.353682 0.000787 A BETA= 102.102612 0.009219 DEG. C = 6.410086 0.000446 A GAMMA= 90.000000 0.000000 DEG. The predicted volume. Does is make sense based on the chemical formula? UNIT CELL VOLUME = 688.46 The first few indexed peaks. Is the DELTA value small? H K L SST-OBS SST-CALC DELTA 2TH-OBS 2TH-CALC D-OBS FREE PARAM. 2 0 0 0.008335 0.008306 0.000029 10.476 10.458 8.4373 211 0 0 1 0.015096 0.015105 -0.000009 14.115 14.119 6.2695 72 3 0 0 0.018689 15.715 6.2695 82 3 0 0 0.018689 15.715 6.2695 82 -2 0 1 0.018708 0.018714 -0.000006 15.723 15.725 5.6317 82 1 0 1 0.019581 0.019530 0.000051 16.088 16.067 5.5048 79 2 1 0 0.023014 0.023005 0.000010 17.451 17.448 5.0776 318 -1 1 1 0.029661 0.029531 0.000130 19.834 19.790 4.4727 510
Final Figures of Merit NUMBER OF OBS. LINES = 40 NUMBER OF CALC. LINES =62 M(20)= 26 AV.EPS= 0.0000304 F20 = 44. (0.009199,50) M(30)=27 AV.EPS= 0.0000290 F30 = 51. (0.007849,0) M(40)=23 AV.EPS= 0.0000293 F40 = 52. (0.007162,109)
How interpret the Figures of Merit The main rule is that if all the first twenty lines are indexed and the De Wolff figure of merit M(20) [J. Appl. Cryst. (1972). 5, 243] is greater than 9, then the indexing problem is in principle solved. Comments a. If the De Wolff figure of merit M(20) is less than 10 or more than one line is un-indexed within the 20 first observed lines, the solution is probably meaningless. b. Hexagonal and Tetragonal cells are sometimes indexed as ortho- rhombic. c. Observe that the De Wolff figure of merits are derived from the assumption
that no systematic extinctions occur and all lines are indexed. Warning. a high figure of merit has no meaning unless the lines are indexed.
d. If possible, use the density and formula weight to check that the unit cell contains an integral number of formula units. e. If a cell axis is more than 20 a....be very suspicious! The De Wolff figure of merit test may fail in such cases. f. If one cell edge is much shorter than the others, be suspicious! It may cause a dominant zone problem. g. If a table starts with....not refined unit cell... then two parameters are probably almost identical (the symmetry may be higher) and the trial cell parameters are used to print the list. Is this the correct unit cell?
Proceed to the next window for refinement and point to CALCULATE
Exam the DHKL results and look for unassigned peaks. If none then point to PEAK MATCH. You should see something like this
Zoom in on the first few peaks with the zoom command Notice all of the peaks (save the one near 13.48o ) are labeled. You did not select the 13.48 peak at the peak picking stage so it is not labeled now. Add this peak with the TASK/ADD remove peak command and type finish. For the wavelength box point to OK Goto to
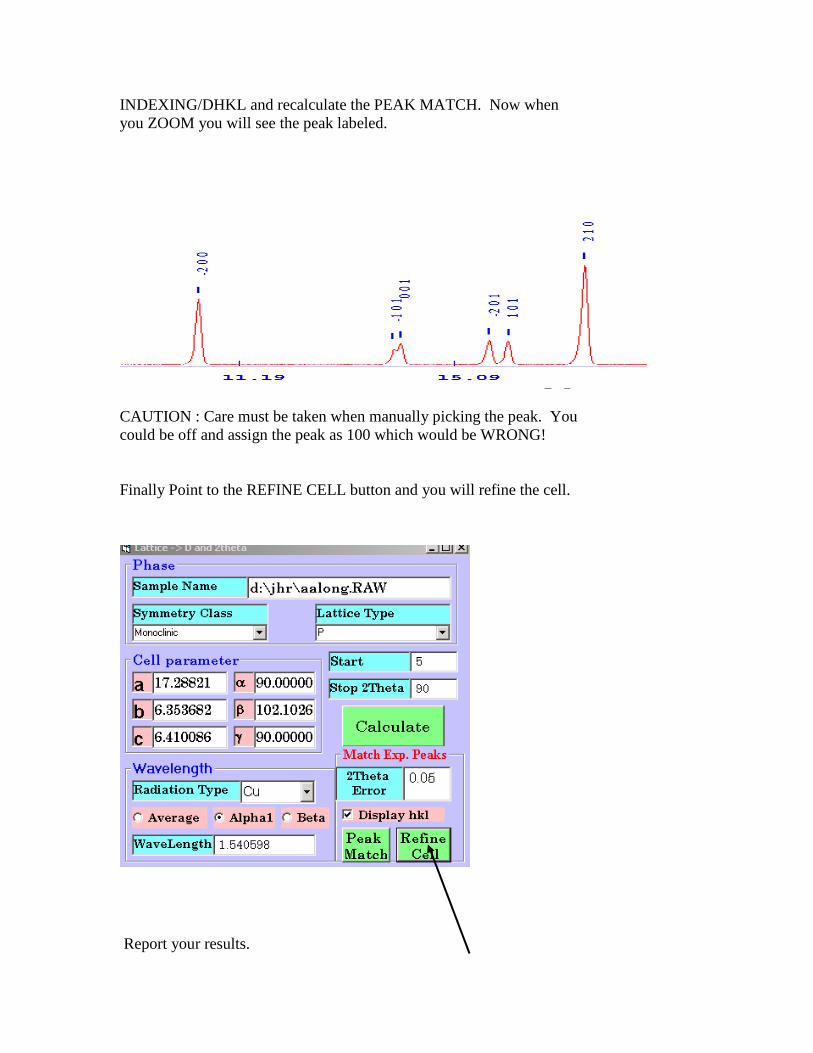
INDEXING/DHKL and recalculate the PEAK MATCH. Now when you ZOOM you will see the peak labeled.
CAUTION : Care must be taken when manually picking the peak. You could be off and assign the peak as 100 which would be WRONG! Finally Point to the REFINE CELL button and you will refine the cell.