Page 1
Presented at the First IntOrn<_ional Conference on Laboratory Research for Planetary
Atmospheres, 25-27 October 1989, Bowie State University, Maryland
LABORATORY MEASUREMENTS OF MICROWAVE AND MILLIMETER-
WAVE PROPERTIES OF PLANETARY ATMOSPHERIC CONSTITUENTS
PAUL G. STEFFES /J_-"_""
Georgia Institute of Technology
School of Electrical EngineeringAtlanta, GA 30332-0250
ABSTRACT
Accurate data on microwave and millimeter-wave properties of potential
planetary atmospheric constituents is critical for the proper interpretation of
radio occultation measurements, and of radio astronomical observations of both
continuum and spectral line emissions. Such data is also needed to correct for
atmospheric effects on radar studies of surface reflectivity. Since the
refractive and absorptive properties of atmospheric constituents often vary
drastically from theoretically-predicted profiles, especially under the extreme
conditions characteristic of planetary atmospheres, laboratory measurements under
simulated planetary conditions are required.
This paper reviews the instrumentation and techniques used for laboratory
measurement of the refractivity and absorptivity of atmospheric constituents at
wavelengths longward of I mm, under simulated planetary conditions (temperature,
pressure, and broadening gases). Techniques for measuring both gases and
condensates are considered. Also reviewed are the relative accuracies of the
various techniques. We conclude by reviewing laboratory measurements which have
already been made, and highlight additional measurements which are needed for
interpretation of data from Venus and the outer planets.
I. INTRODUCTION
Radio absorptivity data for planetary atmospheres obtained from spacecraft
radio occultation experiments and earth-based radio astronomical observations
can be used to infer abundances of microwave absorbing atmospheric constituents
in those atmospheres, as long as reliable information regarding the microwave
absorbing properties of potential constituents is available. The use of
theoretically-derived microwave absorption properties for such atmospheric
constituents, or laboratory measurements of such properties under environmental
conditions which are significantly different than those of the planetary
(NASA-CR-!o59]_#) LA30,_KATOKy MEA3URFMr. NTS UF N90-I0319hiICROWAVE AN_ MI"LLIMETER-WAVE PROPEPT[_S r)6
PLANETARY ATMqSPHFRIC CO_STTTUENT_ (Georqia
Inst. oF:Tech.), _>Z p C_CL 03_ Unclas
: _,3/Yl 0?34443
https://ntrs.nasa.gov/search.jsp?R=19900001499 2018-06-06T20:41:33+00:00Z
Page 2
atmosphere being studied, often leads to significant misinterpretation of
available opacity data. For example, results obtained for the microwave opacity
from gaseous H2SO4, under simulated Venus conditions showed that not only was
the opacity from H2SO4 much greater than theoretically predicted, but that its
frequency (wavelength) dependence was far different than that theoretically
predicted (Steffes, 1985 and Steffes, 1986). Subsequent measurements made by
Steffes and Jenkins (1987), showed that the microwave opacity of gaseous ammonia
(NH3) under simulated Jovian conditions did agree with theoretical predictions
to within their experimental accuracy at wavelengths longward of 1.3 cm.
However, work performed by Joiner et al. (1989) has shown that laboratory
measurements of the millimeter-wave opacity of ammonia between 7.5 mm and 9.3
mm and also at the 3.2 mm wavelength require a different lineshape to be used
in the theoretical prediction for millimeter-wave ammonia opacity than had been
previously used. The recognition of the need to make such laboratory
measurements of simulated planetary atmospheres over a range of temperatures and
pressures which correspond to the altitudes probed by both radio occultation
experiments and radio astronomical observations, and over a range of frequencies
which correspond to those used in both radio occultation experiments and radio
astronomical observations, has led to the development of facilities at Georgia
Tech and at other institutions which are capable of making such measurements.
This paper reviews the instrumentation and techniques used for laboratory
measurement of the refractivity and absorptivity of atmospheric constituents at
wavelengths longward of I mm, under simulated planetary conditions (temperature,
pressure, and broadening gases). Techniques for measuring both gases and
condensates are considered. Also reviewed are the relative accuracies of the
various techniques. We conclude by reviewing laboratory measurements which have
already been made, and highlight additional measurements which are needed for
interpretation of data from Venus and the outer planets.
II. INSTRUMENTATION AND MEASUREMENT TECHNIQUES
A large number of measurement techniques are used for characterizing the
refractivity and absorptivity of gases and condensates at microwave and
millimeter-wavelengths. At the shorter millimeter-wavelengths (near I mm), the
techniques resemble the IR/optical spectroscopic techniques described by other
authors. At the longer microwave wavelengths (_ > I cm), techniques involving
Page 3
RF (radio frequency) components are employed.
A. Absorptivity Measurements at Wavelengths Lonqward of ] cm
At wavelengths longward of I cm, the two major techniques for inferring
planetary atmospheric opacity and refractivity are spacecraft radio occultation
experiments and earth-based radio emission measurements. At these wavelengths,
the vast majority of measured opacity is due to atmospheric gases at pressures
at or above ] Bar. Measurement of the microwave absorption and refraction
properties of such gases is most often accomplished with cylindrical cavity
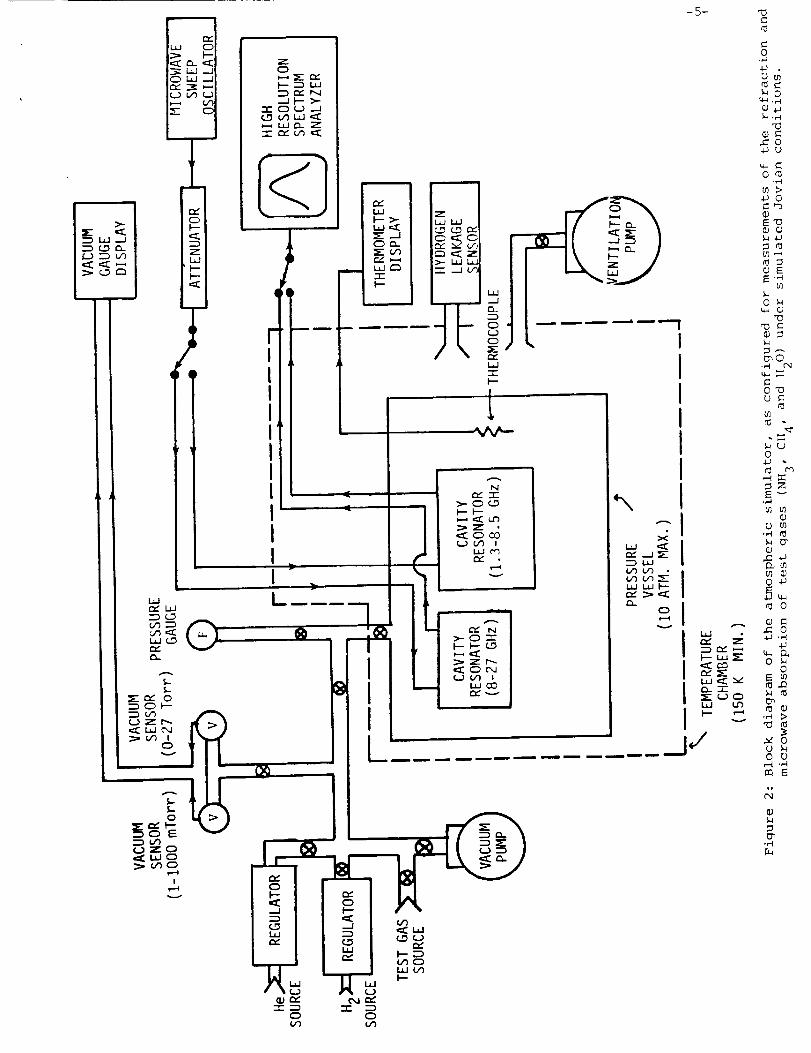
resonators. Figure I (from Steffes, ]g86) and Figure 2 (from Steffes and
Jenkins, 1987) show measurement systems designed to measure microwave absorption
and refraction properties of atmospheric gases under simulated conditions for
the Venus atmosphere (Figure 1) and the atmospheres of the outer planets (Figure
2).
The approach used to measure the microwave absorptivity of gaseous H2SO 4
in a CO 2 atmosphere can be seen in Figure I. The absorptivity is measured by
observing the effects of the introduced gas mixture on the Q, or quality factor,
of two cavity resonators at particular resonances from 1.34 GHz to 23.6 GHz.
The changes in the Q of the resonances which are induced by the introduction of
an absorbing gas mixture can be monitored by the high resolution microwave
spectrum analyzer, since Q is simply the ratio of the cavity resonant frequency
to its half-power bandwidth. For relatively low-loss gas mixtures, the relation
between the absorptivity of the gas mixture and its effect on the Q of a
resonance is straightforward:
= (Q'IL Q'IC) _/_ (1)
where e is absorptivity of the gas mixture in Nepers km"I. (Note, for example,
that an attenuation constant or absorption coefficient or absorptivity of I Neper
km "I = 2 optical depths per km (or km"I) = 8.686 dB km "I, where the first notation
is the natural form used in electrical engineering, the second is the usual form
in physics and astronomy, and the third is the common (logarithmic) form. The
third form is often used in order to avoid a possible factor-of-two ambiguity
in meaning.) QL is the quality factor of the cavity resonator when the gas
mixture is present, QC is the quality factor of the cavity resonator in a vacuum,
and _ is the wavelength (in km) of the test signal in the gas mixture.
Page 4
• , ©1
I_ _I_._
'i O
_...lu..
,1L__,__] ,,
£-
/
i..... ,...1
-7=
c_)_ IJ
w
r.,
n,,
,,r
0.
0wnn_ ww_mm, r,_ •
0
X
-r
ul
U
(J>
o o
u _.,.q
E _o
o >_ 0
I/1
0 0-r"l
4._ • ,'t
_ o_ o
_ u
E _C-
O 0
0
0
0 ©
.._ h-
E u_
u_ oo
o
,..-._ 0 _m _
r_ .o ,x::
0 >
_ 0• ,-I ._ ,'3
o
-,-I
Page 5
:>-
eY" i.l.l
_,..} _ ,.- ,,,_ _
I, I _..D
$-
Ot-'-
o E
I
L.l "'
rIIlIIII
IIlIL_
$
I
III
c,FL._
l--
i
f
I II
If
>- 0 {,--_I--" k--
_Z
_....} (._ !
#y"
v
J,
>_ 0 "m--
f.__ IL_CO
oI--
¢.Di,i
c_
= I_, !
,- _o
¢IP e'_ _,11_
O O
-5-
--.,--.--i
I
IIIII
•,, I
°1v
IIII
___.JJ
e_ .__
v
0
_-._ . ,.._
_.,-_
O_
-PO
oE_-_
O _
.,--I _
O_
_r)
O4J •
_ m
°_..__ m
O
_ m-,-t _
_4 _"
_tnm _
O-_
_ O
4.J .,.-1
O
_ O
O O,-4.,-Im N
q)
.M
Page 6
In order to obtain a gas mixture with a sufficient amount of H2SO 4 vapor
so that the microwave absorption is detectable, the system must be operated at
temperatures exceeding 450 K. While this is suboptimal in that the temperatures
at altitudes from 35 to 50 km (where both radio occultation and radio
astronomical experiments have detected microwave opacity) range from 350 to 450
K, temperature dependencies measured for similar gases (such as S02) can be used
to estimate temperature effects in that range. In order to infer H2SO 4 vapor
pressure, the volume of liquid sulfuric acid which is vaporized to generate the
gaseous H2SO 4 is determined to a high accuracy (up to ±0.005 ml). It is then
possible to compute the partial pressure of gaseous H2SO 4 using the ideal gas
equation, the measured change in liquid volume, and published densities for H2SO 4
liquid. However, since gaseous H2SO 4 can dissociate to form gaseous H20 and SO3
which have relatively low microwave opacity when compared with gaseous H2SO 4,
an accurate estimate of the "dissociation factor" is necessary in order
accurately estimate the H2SO 4 abundance, and therefore the relationship between
abundance and absorptivity. Recently, Fahd and Steffes (1989) have measured this
dissociation factor. Initially, a vacuum is drawn in the pressure vessel
containing the microwave cavity resonator, and the bandwidth and center frequency
of the resonances are then measured. For this experiment, resonances at 1.34
GHz (22.3 cm) 2.24 GHz (13.4 cm), 8.42 GHz (3.6 cm), 13.23 GHz (2.26 cm), 21.63
GHz (1.38), and 23.64 GHz (1.27 cm) were used. A valve is then opened which
allows the sulfuric acid vapor eluting from the flask to fill the pressure vessel
(0.031 cubic meters of open volume with resonator in place) and reach vapor
pressure equilibrium with the liquid H2SO 4.
As H2SO 4 vapor fills the chamber, changes in the resonance center frequency
are observed. These changes are related to the H2SO 4 vapor abundance. After
equilibrium is reached, the valve to the reservoir flask is then closed, and CO2
is admitted to the chamber containing the H2SO 4 vapor. For this experiment, a
total pressure of 6 atm was used. The bandwidth of each response is then
measured and compared with its value when the chamber was evacuated in order to
determine the absorptivity of the C02/H2S04 gas mixture at 6 atm total pressure.
The total pressure is then reduced by venting, and the bandwidths are again
measured. Subsequent measurements are likewise made at lower pressures in order
to determine absorptivities at those pressures. The pressure vessel is then
evacuated and the bandwidths again measured so as to assure no variation (either
6
Page 7
due to thermal shift or chemical reaction) of the Q's of the evacuated resonators
has occurred. Note that this approach has the advantage that the samegas
mixture is used for the absorptivity measurementsat the various pressures.
Thus, even though some uncertainty may exist as to the mixing ratio of the
initial mixtue, the mixing ratios at all pressures are the same, and thus the
uncertainty for any derived pressure dependence is due only to the accuracy
limits of the absorptivity measurements, and not to uncertainty in the mixing
ratio. Similarly, measurements of the frequency dependence of the absorptivity
from the gas mixture are likewise immune to mixing ratio uncertainty, as long
as foreign-gas broadening predominates.
Measurements have also been made of the absorptive properties of several
gases under simulated conditions for the outer planets, using the system in
Figure 2. The first experiment involved gaseous NH3.
In order to obtain a gas mixture with a sufficient amount of gaseous NH3
so that microwave absorption is detectable using our system, temperatures at or
above 170 K must be used. (This limit is set by the saturation vapor pressures
for ammonia and by the sensitivity of our measurement system.) While this covers
most of the temperature range in the Jupiter atmosphere over which radio
occultation and radio astronomical experiments have detected microwave opacity
(140-300 K), it is somewhat above the temperature range over which microwave
opacity has been detected at Saturn. However, the measured temperature
dependencies can be used to extrapolate to those temperatures. In order to
conduct the required measurements, the pressure vessel and its microwave
resonators must first be cooled to the desired temperature.
After thermal stability is reached, which can be monitored using both the
temperature sensors and the resonant frequencies of the system, a vacuum is drawn
in the pressure vessel containing the resonators, and the bandwidth and center
frequency of each of resonances is then measured. For this experiment
(absorption from NH3), resonances at 1.34 GHz (22.3 cm), 2.25 GHz (13.3 cm), 8.53
GHz (3.52 cm), 13.3 GHz (2.26 cm), and 21.7 GHz (1.38 cm) were used. A valve
is then opened which allows the ammonia gas to enter the chamber. Measurements
of the gaseous NH3 pressure were made with the high accuracy thermocouple vacuum
gauge tubes which are shown in Figure 2. Next, 5.4 atm of hydrogen (H2) and 0.6
Page 8
atm of helium (He) are added. These gases are admitted to the chamber at a
sufficiently slow rate so as not to significantly affect the temperature within
the chamber. The bandwidth of each resonance is then measured and compared with
its value when the chamber was evacuated in order to determine the absorptivity
of the gas mixture at 6 atm total pressure. The total pressure is then reduced
by venting to 4 atm, and the bandwidths are again measured.
As before, this approach has the advantage that the same gas mixture is
used for the absorptivity measurements at the various pressures. Thus, even
though some small uncertainty may exist as to the mixing ratio of the initial
mixture, the mixing ratios at all pressures are the same.
B. Absorptivity Measurements at Wavelenqths Between ] mm and ] cm
While the techniques for measuring millimeter-wave absorptivity are similar
to those used at longer wavelengths, the cylindrical resonators used at
wavelengths longward of I cm become ineffective at the shorter wavelengths.
Shortward of I cm, cylindrical resonators become extremely small, resulting in
a very low quality factor (Q) and making it difficult to couple energy in and
out of the resonator. An alternative approach is the semi-confocal Fabry-Perot
resonator shown in Figure 3. The resonator shown in Figure 3 has several
bandpass resonances in the range from 30-40 GHz with quality factors around 8000.
A similar resonator which operates at 94 GHz with a Q of over 30,000 is shown
in Figure 4. The system used to measure the 94 GHz absorptivity of NH3 in a
H2/He atmosphere is shown in Figure 5. Note the use of a premixed, constituent
analyzed, hydrogen/helium/ammonia atmosphere with a mixing ratio accuracy of
better than ± 2% of its value (e.g., [1.85 ± 0.04] % of NH3).
Before the absorption coefficient can be calculated, the effect of the
dielectric properties of hydrogen and helium on the system must be known. The
dielectric properties of gases with little or no absorption such as hydrogen and
helium can cause changes in the apparent bandwidths of resonances. Because the
percentage change in bandwidth (on the order of 20%) due to the absorption of
NH 3 is relatively small for our system, any changes in bandwidth due to the
dielectric effects of hydrogen and helium may lead to significant errors in the
absorption measurement.
Page 9
-9-
'_ l ' ° i I
L_Jr"
I
L , JL
• Uv
Eo
II
__1
r_
II
0
II
l,w
C"
I
,--t0
m
0
e- 0
m 2
! °o,
¢¢3
_'_
-,-I
Page 10
N
C_
0
LUrr _
E_W
I>-
Ii
LL0
rY
_J
I
/tI
1
rr"UJ
r-. J lj_-
i
If
i
Im
Wm
_o
-1@-
\
Page 11
-ll-
!iI '
I_ I _-
o _=_
I
.\-/-J
m
I i-
g
.._1
oe
c; E
-,.4-_ c_2
Page 12
The resonator, which operates as a bandpass filter, is connected to a
signal source (the sweep oscillator) and to a receiver (the high resolution
spectrum analyzer). The Q of the resonator, which is defined as the ratio of
the resonant center frequency to the resonance half-power bandwidth, is
proportional to the ratio of the energy stored in the resonator to the energy
lost per cycle. Therefore, stronger coupling between the resonator and the
spectrum analyzer or sweep oscillator causes more energy to be lost per cycle,
and thus decreases the Q of the resonance. For this reason, the resonator was
designed with minimal coupling, so as to maximize Q and minimize the variations
in Q that might result from changes in coupling that occur when gases are
introduced into the resonator. These changes in coupling, which we refer to as
dielectric loading, are due to the dielectric constant or permittivity of the
test gas mixtures and are not related to the absorptivity of the gases. Slight
imperfections in the waveguide or irises can make the apparent Q of the resonator
appear to vary with the abundance of lossless gases. It is therefore necessary
to repeat the absorption measurement without the absorbing gas present. The last
step in the experimental procedure is to measure the bandwidth of each resonance
in a mixture consisting of 90% hydrogen (H2) and 10% helium (He) with no ammonia
present. Since, for the pressures and wavelengths involved, the H2/He atmosphere
is essentially transparent, no absorption is expected. If any apparent
absorption is detected, dielectric loading (or a change in coupling due to the
dielectric properties of the gases) is indicated.
We have found that the effects of dielectric loading are additive, in that
they add to the apparent changes of resonator bandwidth caused by the absorbing
gases. Thus, as long as the effects of dielectric loading are not time variable,
they can be removed by using the measured value of the Q of the resonance with
the non-absorbing gases present rather than the Q of the resonance in a vacuum
for the quantity QC in equation (I).
C. _xperimental Uncertainties
Uncertainties in the measurement of the absorption coefficient may be
classified into two categories: uncertainties due to instrumental error and the
uncertainty due to noise. The uncertainties due to instrumental error are caused
by the limited resolution and capability of the equipment used to measure
pressure, temperature, and resonant bandwidth. These uncertainties have been
12
Page 13
significantly reduced so that they are relatively small when compared to the
uncertainty due to noise. For instance, proper calibration of the spectrum
analyzer has made the uncertainty in the measurement of the resonant bandwidth
and center frequency in the absence of noise negligible. Likewise, the limited
ability of the temperature chamber to maintain a constant temperature results
in variations of only ± 2.5%. The largest source of uncertainty due to
instrumental error in the past has been associated with the mixing ratio of the
gas mixture. The uncertainty in the measurement of the amount of ammonia present
in the mixture due to the inaccuracy inherent in the thermocouple vacuum gauge
is on the order of ±20%, or (1.85 ± 0.37) % NH3 volume mixing ratio. Thus, even
though measurements at all frequencies are made with the same mixing ratio and
the frequency dependence remains intact, a large uncertainty still remains in
the relative amplitude of the absorption. We have been able to reduce this
uncertainty by repeating the measurements using a pre-mixed, constituent
analyzed, hydrogen/helium/ammonia atmosphere with a mixing ratio accuracy of
better than ± 2%, or (1.85 ± 0.04) % NH 3 volume mixing ratio.
The most significant source of uncertainty in the measurement of the
absorption coefficient is due to the effects of noise in the system. This
electrical noise is displayed by the spectrum analyzer. As a result, the
measurement of the bandwidth of a resonance must be accompanied by an error term
which is directly related to the width of the noise on the spectrum analyzer's
display.
In order to reduce the effects of noise, the system sensitivity, which is
dependent on both the Q of the resonator and the noise present in the system,
must be as high as possible. Because the Q is defined as 2_ times the ratio of
the average energy stored in the resonator to the energy lost ( per cycle) in
the resonator, reducing losses in the resonator increases the sensitivity of the
system. The losses in a Fabry-Perot type resonator can be attributed to the
resistive losses on the surfaces of the mirrors, coupling losses due to energy
coupling out of the resonator through the irises on the flat-surfaced mirror,
and diffraction losses around the sides of the mirrors (Collin, 1966). (The
diffraction losses are, of course, minimal in the cylindrical cavity resonators.)
13
Page 14
Computation of the resistive losses from the mirrors of the Fabry-Perot
resonators showed that, in the absence of all other losses, the quality factor
should have been on the order of 250,000, whereas its actual quality factor was
on the order of 10,000. Therefore, the limiting factor in the performance of
the resonator must be attributed to either coupling losses or diffraction losses.
(As a result, even the introduction of high temperature superconducting material
would not significantly improve the sensitivity of the system.) In order to
minimize the coupling losses, adjustable irises were developed so that the
smallest possible coupling losses would occur, while still allowing sufficient
signal coupling in and out of the resonator. However, this yielded only slightly
improved results.
The major limiting factor to the system sensitivity is diffraction losses
around the edges of the mirrors. One approach used to reduce diffraction losses
involves the precise pointing of the mirrors to assure that both mirrors are
oriented directly toward each other. This is accomplished by directing the beam
of a helium-neon laser through the input waveguide and iris and into the
resonator. The parabolic mirror is then adjusted so that the reflected beam
focuses precisely on the output iris. This is found to maximize both the signal
to noise ratio and the Q of the resonator, and therefore increase the sensitivity
of the system. Figure 6 shows the improvement in the sensitivity of the 30-40
GHz system obtained with this approach. Figure 7 shows the sensitivity of the
1.34 23.6 GHz system shown in Figure 2.
D. Refractivity Measurements
The refractive index, n, of a gas is the ratio of the velocity of an
electromagnetic wave in a vacuum, c, to the velocity of the wave in the presence
of the gas, Vg. Since the resonant frequencies of a microwave resonator are
directly proportional to the velocity of electromagnetic waves within the
resonator, the refractive index of a gas can be determined by comparing the
frequency of a particular resonance when a vacuum is present within the
resonator, fv' to the resonant frequency when the gas is present, fg. That is,
n - C/Vg = fv/fg (2)
Refractivity, N, is defined as being equal to (n-3) x 106. Thus, it can be
determined simply by measuring the chanc_ in center frequency of a given
14
Page 15
E
zn13V
10Cx 90
BO
7orO 6o
._ 4O
1--
0
.Q 3O<
0
_Q0-_ 2000
0r_
E
EC
QI
Figure 6: Performance (minimums, detectable absor_:.tivities) for the 32-40 GHz resonator
system (operating at 200 K). Note im?.rovement in average performance (solidlines) after laser tuning.
Wavelength (mm)9 8I i
102OO
0
0
0 0
0 0
-_0 0 0 CD
•- • • lt"'-,,R OI
0
O Before Improvements
0 After Laser Tuning and Replating
_ I I l I I ! I
30 32 34 36 38 4-0
Frequency (GHz)
-15-
Page 16
-16-
I0
E
v
UJ
rr 10--
x
_ _
<
b"r_
©
<
W
.J
k-
uJ 0.1--
tu
_ -
2OJ
WAVELENGTH ( cm 1
3 2I !
LARGERESONATOR
0.01
0 S 10 15 20 25 30
FREQUENCY (GHz)
Figure 7: Predicted sensitivity (dashed line) and actual measured sensitivity (solid)
of resonator system shown in Figure 2 when operated at 150 K.
Page 17
resonance after the gas has been introduced. That is,
N - (n-l) x 106 : [(fv " fg)/fg] x 106 (3)
Since the refractivity of a gas is directly proportional to the molecular density
of the gas, #, the refractivity is often expressed in a form which Is normalized
by molecular density in terms of the temperature and pressure of the gas. That
is, # - P/RT where # is density in molecules per cm3, P is the pressure in
atmosphere, R is the ideal gas constant (1.362344 x I0"_2 cm3-
atm/molecule/Kelvin), and T is the temperature in Kelvins. Thus, the density-
normalized refractivity, N/p, can be expressed as NRT/P. It is often assumed
that the density-normalized refractivity for a gas is independent of pressure
or temperature.
Any of the resonator systems described can be used'to measure the density-
normalized refractivity of gas mixtures. Knowledge of this quantity is necessary
I determining pressure-temperature profiles from radio occultation data, andproper modeling of microwave and millimeter-wave emission. Initially, a
uum is drawn in the chamber containing the resonator. The heating or cooling
_tem is then used to bring the chamber to the appropriate planetary
iperature. As the temperature is changed, the resonant frequencies change due
!thermal contraction. Thus, when thermal stability is reached, the resonant
!quencies likewise stabilize. After thermal stability is reached, a vacuum|
rawn in the pressure vessel containing the two microwave resonators, and the
ter frequencies of the resonances of interest are than measured. A valve
then opened which admits the test gas to the chamber. As the gas is added,
shifting of the center frequencies of the various resonances can be
_rved. Once the desired pressure is reached the total frequency shift can
Jsed to compute the refractivity, N, of the gas under those conditions. It
Lld be noted that while the major source of uncertainty for our refractivity
urements is the frequency measuring capability of our system, two other
ces of uncertainty affect the accuracy of our determination of density-
iali_ed refractivity, and those are our abilities to measure pressure and
erature.
Measurements of Absorptivity and Refractivitx of Solids and LiQuids
Measurements of the absorptivity and refractivity (also referred to as the
17
Page 18
complex dielectric constants) of condensate materials have been less commonat
longer wavelengths becauseof their relatively small effect on observed microwave
emission, or measured microwave absorption at the depths to which radio
occultation experiments have been able to probe. However, with the upcoming
Galileo mission, in which a probe carrying a microwave transmitter will penetrate
into the deep Jovian atmosphere, the opportunity to measure the microwave
absorption from the dense clouds may be possible. Similarly, radar studies of
Titan have suggested the possibility of measuring the properties of surface
liquids (Spilker and Eshleman, private communication). Therefore, in order to
properly identify surface constituents based on their radar reflectivity,
measurementsof the complex dielectric constants of potential surface liquids
are necessary at the 12.6 and 3.6 cm radar wavelengths.
Three techniques are used for the measurement of complex dielectric
constants. The first is essentially identical to that previously described.
That is, a system such as that shown in Figure 2 (using cylindrical resonators)
is employed, and changes in the bandwidth and center frequencies of the
resonances when the resonators are filled with liquid or solid materials are
measured to determine refractivity and absorptivity. However, many liquids have
such large amounts of refraction and absorption that the resonances are totally
attenuated. With these sorts of materials, the most common alternative approach
for measuring the complex dielectric constant is to place the material within
an open circuited coaxial line (between the conductors), and to measure the
complex impedance of the line using a microwave network analyzer. Scott and
Smith (1986a) have used this technique at frequencies up to 2 GHz, and expect
it to be useful to over 8 GHz. (Note that we have successfully used this
technique to measure the properties of aqueous ammonia solutions up to 2 GHz.)
The third method involves placing a monopole antenna in a hemispherical
tank containing the material (liquid or crystalline) to be tested. By measuring
the change in the complex impedance of the antenna from when it is in air to when
it is immersed in the material, it is possible to infer the complex dielectric
constant of the material. Scott and Smith (1986b) have used this technique at
frequencies up to 10 GHz, and expect it to be useful at much higher frequencies
as long as the network analyzers to measure complex impedance are available.
18
Page 19
Since the first two techniques described are generally not useful at
wavelengths shortward of I cm and since the third technique has yet to be tried
at millimeter-wavelengths, an alternative approach is frequently employed.
Breeden and Langley (1969) developed a technique whereby a slab of solid material
or a container of liquid material is placed on the surface of the flat mirror
of a semi-confocal Fabry-Perot resonator, such as those shown in Figure 3 and
4. As long as the physical dimensions of the material being tested are well
known, it is possible to infer its complex dielectric constant from the measured
changes in the resonant frequency and quality factor of the resonator which
accompany the introduction of the material. We intend to pursue this technique
for future laboratory measurements of the millimeter-wave properties of potential
Venus and Jovian cloud constituents.
III. CONCLUSION
In this paper, we have described techniques for laboratory measurement of
microwave and millimeter-wave absorption and refraction properties of planetary
atmospheric constituents. In Table I, we present a summary of known laboratory
measurements of a number of plenetary atmospheric constituents. It should be
noted that this summary should not be considered to be complete. Similarly, even
if multiple measurements are listed for a given constituent, more measurements
may be necessary in order to provide a complete spectral analysis and to provide
measurements over a complete range of appropriate pressures and temperatures with
the necessary accuracy.
ACKNOWLEDGEMENT
This work was supported by the Planetary Atmospheres program of the Solar
System Exploration Division (Office of Space Science and Applications) of the
National Aeronautics and Space Administration Under Grant NAGW-533.
19
Page 20
TABLE I: REFERENCES FOR LABORATORY MEASUREMENTS OF
MICROWAVE/MILLIMETER-WAVE PROPERTIES OFPLANETARY ATMOSPHERIC CONSTITUENTS
CONSTITUENT
CH4
CO
CO2
COS
H20 (g)
H20 (_)
H2CO
H2SO 4 (g)
H2SO 4 (_)
N2
NH3
NO
O2
SO2
SO3
REFERENCE
Jenkins and Steffes (]988)
Britt, Tolbert, and Straiton (1961)
Ho, Kaufman, and Thaddeus (1966)
Tyler and Howard (]969)
Kolbe, Buscher, and Leskovar (1977)
Ho, Kaufman and Thaddeus (1966)
Jenkins and Steffes (1988)
Liebe and Dillon (1969)
Hasted (1973)
Kolbe, Buscher, and Leskovar (1977)
Steffes (1985)
Steffes (1986)
Fahd and Steffes (1989)
Ho and Hall (in Cimino, 1982)
Ho, Kaufman, and Thaddeus (1966)
Birnbaum and Maryott (]953)
Bleaney and Loubser (1950)
Morris and Parsons (1970)
Poynter and Kakar (1975)
Steffes and Jenkins (1987)Joiner, Steffes and Jenkins (1989)
Spilker and Eshleman (1988)
French and Arnold (1968)
Liebe and Layton (1969)
Steffes and Eshleman (1981)
Steffes and Eshleman (1981)
2O
Page 21
IV. REFERENCES
Bleaney, B. and J.H.N. Loubser (1950). The inversion spectrum of NHR, CH3Cl,and CH3Br at high pressures. PrQc. Royal Soc. (London) A6__._33,483-493. _
Britt, C.O., C.W. Tolbert, and A.W. Straiton (1961). CO line parameters. J.Res. NBS) 65D, 15.
Birnbaum, G. and A.A. Maryott (1953). Absorption in the low-frequency wing of
the NH3 inversion spectrum. J. Chem. Phys: 21, 1774-1777.
Fahd, A.K. and Steffes, P.G. (1989). Laboratory Measurements of the Dissociation
Factor of Gaseous Sulfuric Acid (H2S04). Bull. Amer. Astron. Soc. 21, 927.
French, I.P. and T.E. Arnold, Jr. (1968). Nitric oxide absorption coefficients
and transitions. J. Chem. Phys. 48, 5720.
Hasted, J.D. (1973). A__queous Dielectrics, Chapman and Hall, London.
Ho, W. and W.F. Hall (in Cimino, J.B., 1982). The composition and verticalstructure of the lower cloud deck on Venus. Icarus 5], 334-357.
Ho, W., I.A. Kaufmann and P. Thaddeus (1966). Laboratory measurements ofmicrowave absorption in models of the atmosphere of Venus, J. Geophys. Res. 21,5091-5108.
Jenkins, J.M. and P.G. Steffes (1988). Constraints on the microwave opacity ofgaseous methane and water vapor in the Jovian atmosphere. Icarus 76, 378-382.
Joiner, J., P.G. Steffes, and J.M. Jenkins (1988). Laboratory measurements of
the 7.5 9.38 mm absorption of gaseous ammonia (NH3) under simulated Jovianconditions. Icarus 81, 386-395.
Kolbe, W.F., H. Buscher, and B. Leskovar (1977). Microwave absorption
coefficients of atmospheric pollutants and constituents. J. Ouant. Spec. Radiat.
Transfer ]8, 47-64.
H.J. Liebe and T.A. Dillon (1969). Accurate foreign-gas-broadening parameters
of the 22-GH H20 line from refraction spectroscopy. J. Chem. PhYs. 50, 727-732.
H.J. Liebe and D.H. Layton (1987). Millimeter-Wave Properties of the Atmosphere:Laboratory Studies and Propagation Modeling. NTIA Report 87-224, U.S. Dept. ofCommerce.
Morris, E.C., and R.W. Parsons (]970). Microwave absorption by gas mixtures at
pressures up to several hundred bars. Astron, J. PhYs. 23, 335-349.
Poynter, R.L., and R.K. Kakar (]975). The microwave frequencies, line
parameters, and spectral constants for NH 3. Astrophys. J. Suppl. 29, 87-96.
Spilker, T.R. and V.R. Eshleman (1988). Anew formalism for predicting microwaveabsorption by ammonia based on laboratory measurements under varying conditions.
Bull. Amer. Astron. Soc. 20, 867.
21
Page 22
Steffes, P.G. (1985).pressure of sulfuricof Venus. Icarus 64,
Laboratory measurements of the microwave opacity and vaporacid under simulated conditions for the middle atmosphere
576-585.
Steffes, P.G. (1986). Evaluation of the microwave spectrum of Venus in the 1.2to 22 centimeter wavelength range based on laboratory measurements of constituentgas opacities. Astrophysical Journal 310, 482-489.
Steffes, P.G., and V.R. Eshleman (1981). Laboratory measurements of themicrowave opacity of sulfur dioxide and other cloud-related gases under simulatedconditions for the middle atmosphere of Venus. icarus _, 180-187.
Steffes, P.G. and J.M. Jenkins (1987). Laboratory measurements of the microwave
opacity of gaseous ammonia (NH3) under simulated conditions for the Jovianatmosphere. Icarus 7__22,35-47.
Tyler, G.L., and Howard, H.T. (1969). Refractivity of carbon dioxide undersimulated Martian conditions. Radio Sci. 4, 899-904.