Laboratory Performance Evaluation SMA, CMH D and Dense Graded Asphalt Mixtures by Louay Mohammad, Ph.D., Correspondi ng Author Assistant Pr ofessor and Manager Xisbun Z hang, Ph.D. Pavement Research Engineer Baoshan Huang, P.E. Research Associate and Zhengzheng Tan, P.E. Pavement Engineer Subm itt ed to : The Annual Meeting of the Association of Asphalt Paving Technologists March 8 - 10, 1999 C hicago, Illinois
Transcript
Laboratory Performance Evaluation SMA, CMHD and Dense Graded Asphalt Mixtures
by
Louay Mohammad, Ph.D., Corresponding Author Assistant Professor and Manager
Xisbun Zhang, Ph.D. Pavement Research Engineer
Baoshan Huang, P.E. Research Associate
and
Zhengzheng Tan, P.E. Pavement Engineer
Submitted to:
The Annual Meeting of the Association of Asphalt Paving Technologists March 8 - 10, 1999
Chicago, Illinois
MOhammad, Zhang, Huang and Ta n
Laboratory Performance Evaluation SMA, CMBB and Dense Graded Asphalt Mixtures
Louay N. Mohammadl, Xisbun Zbang!, Baosban Huang' and Zbengzheng Tan·
ABSTRACT
2
A study has been carried out at tbe Louisiana Transportation Researcb Center (L TRC) to evaluate tbe laboratory perfonnance of three types of asphaltic concrete mixtures. These three mixtures were: I) stone matrix asphalt (SMA), 2) Coarse Matrix High Binder (CMHB) and, 3) conventional Type 8 WC mixture (serving as the control mix). For the SMA and CMHB, two types of modified asphalt cement were used: an SB polymer modified meeting Louisiana PAC· 40HG specifications and a chemically modified asphalt. In addition, for the SMA mixtw"e, a conventional AC-30 and a cellulose fiber was used. In order to evaluate the effect of aggregate type on SMA perfonnance, three types of aggregates (limestone, sandstone, and novaculite) were utilized for Ihe SMA mixtures; the other mixtures incorporated limestone aggregates. Fundamental engineering tests such as indirect tensile strength and strain, resilient modulus, creep compliance, and fatigue life were used to evaluate the perfonnance of these mixes. Axial creep, indirect tensile creep, indirect tensile resilient modulus tests, Superpave frequency sweep at constant beight (FSCH), repetitive shear at constant height (RSCH) and repetitive shear at constant stress ratio test have been perfonned. In addition, Hamburg Wheel Tracking test has been conducted for each of the mixtures. Although perfonnance indices from different tests do not show uniform agreement, a comprehensive comparison suggests that dense-graded mixture containing limestone aggregates and polymer modified asphalt binder (D _PL) and CMHB bave higher rutting performance indices than the SMA mixtures. For tbe SMA mixtures with different asphalt binders, the mixture with PAC-40HG shows relatively better rut-resistant performance indices while the mixture witb MG20-40 and AC-30 added with fibers lowest draindown. For SMA mixtures with dilTerenLaggregate types, the mixture with sandstone shows the best rut· resistant indices while the one with novaculite sbows better indices tban the one with limestone.
lNTRODUcnON
Stone MaIm Asphalt (SMA) Stone matrix asphalt (SMA) originated in Germany in !he 1970s aimed at reducing
pennanent deformation in asphalt Il1vement (\} SMA is a gap-graded. dense (about 3 percent air voids in mix design), hot-mix asphalt (HMA) with a large prolXlrtion of coarse aggregate (lllSSing 2
I Ph.D., AssiSWl! Professor, Louisiana Transponalioo Researcb Center, Louisim.a State University, 41 01 Goorrier, Balon RooSe. LA 70808, e·mlil: !owym@I!rclw.edu, Td: 22S·767·9126, fax: 22S·767·'HOB. 1 Ph.D., Pavement Research Engineer. Heri tage Research Group,790\ W. Moms St., Indianapoli~, IN 46231. e-mail: 5islpn lhao¥@bcrillHC=td'Jviro,corn. Tel: 317·24)-08 11, Fu: 117-486-S09S. l Research Associale, louisiana Transponl lion Reseuch Center, 4101 GourTier, Balon Rooge. lA 70808, e·mail: bioshan@hrc lsu.¢u. Tel: 22S·767·9164, Fu: 22P67·9108. , Pavc:mtnt Engineer, Tew Department ofTranspon.aliOll.
Mohdmlndd, Zh dnq, Huang and Tan 3
mm limited to about 20 percent, all aggregates are 100 percent crushed) and rich asphalt cement/filler mastic (about [Q percent minus 75 11m) (1 ,2). The philosophy of SMA mixture design is to use high quality coarse aggregate, through stone..on-stone contact, to fonn a structure that can carry heavy traffic loads. At the same time, the voids in the coa~ aggregate are filled with a voidless mastic binder to ensW"e the durability and flexibility oflhe mix.
SMA has been introduced into the US since 1991 , when the Federal Highway Administration (FHWA) initiated the Demonstration Project No. 18 (2). Since then more and mOTe state OOTs have adapted this new design concept According to a FHWA national survey conducted by the National Center for Asphalt Technology (NCA n in 1996, at least 17 slates had constructed pavements based on the SMA design (3). Of the 105 SMA IJivements they have investigated, 90 percent exhibited satisfactory perfonnance and had rut depths less than 4mm (3).
The philosophy of SMA design is to provide SIOne-on-stone contact of coarse aggregates in the mixtures, numerous reports have been found in the literatwe about the SMA volumetric design and perfonnance (4,5,7). The latest SMA design guideline has been the procedure developed by the NCHRP 9-8 in which volumetric design criteria have been designated (4). Although nwnerous rep:lrts have been found in literature about the SMA mix design and perfonnance features, few of the works has betn conducted to evaluate SMA performance utilizing Superpave Shear Tesler Protocols such as the frequency sweep at comtant height (FSGI), repetitive shear at constant height (RSCH), repetitive shear at constant stress mtio (RSCSR), and other mechanistic tests.
Coarse Matm High Binder Mil (CMHB) Similar to the concept of SMA, the Texas Department ofT ransportation (T xDOl) developed
a mix design called Coarse Matrix High Binder mix (CMHB) as a less e)(pensive alternative for the traditional SMA. CMH8 is a stone filled SMA, where some of the void space is filled with an intermediate size aggregate. These mixtures are reported 10 be rut-resistant and, based on field experience, do not segregate (8,10).
Ixro et aI. of the Texas Trwportalion Institute (Ill) conducted a comparative study of CMHB and conventional dense-graded mixtures through a series of laboratory srudies. They reported that dense-graded mixes exhibited higher indirect tensile .strength and resi lient modulus (M.) values than the corresponding CMHB mixnrres and there was no consistent difference in the permanent deformation of the static creep test between the two mixes (10).
A research srudy has been conducted at the Louisiana Transportation Research Center (LIRC) to evaluate the fundamental engineering properties of SMA, CMHB and conventional dense-graded mixtures. This paper presents the findings of this comparative study of the labomtory performance among the SMA, CMHB and conventional dense-graded mixtures with the variation of aggregate types and asphalt binders.
4
OBJECTIVE
The main objective of this research is to evaluate the performance of SMA and CMHB mixtures, using IclCally available materials in Louisiana, as defined by their fundamenlal. engineering properties compared to a conventional Louisiana Department of Transportation and Development (lAOOTD) Type 8 wearing coarse mixturr:. A sccordary objective of this srudy is 10 examine the perfonnance of SMA mixture using lhree binder \yIX!S (conventional viSC()sity grnded AC·30, an S8 polymer modified asphalt PAC-40HG and a chemically modjfied gelled asphal t MG2(40) aOO three aggregate typeS (limestone, novaculite and sandstone).
MATEIUAL';
Asphalt Binder Three types of asphalt cement, a conventional viscosity graded AC·)O, an S8 polymer
modified asphalt cement meeting LaDOID specification (Table I) [or PAC40HG and a chemically modified asphalt MG20-40 are used These binde~ are also classified using the Superpave PG system (Table 2).
I Dynamic shear rheometer, G'sin delta MPa, 25°C 3403 4100 3725 Bending Beam creeD stiffness S, MPa 99 100 I 238 BendinR Beam creep slope, m value 0.452 o '. ", 0.310 ..
PG Grade 70-22 70-22 64-22
To prevent asphalt draindown in the SMA mixes, a cellulose fiber, with an average length or 3-6 nun, a diameter or 30-40 Illll and a loose density or 42 gIL, was introduced to the AC-30 SMA mix at 0.3% by weight of the total mix. The function of the ceUulose fiber is to allow the SMA mix to hold more asphalt at mixing temperature and during construction Vlithout serious draindown.
Aggregates aDd GradatioD Three types of aggregates (siliceous limestone, sandstone, and novaculite) were used in this
srudy. The siliceous limestone acquired from the Vulcan Materials Company, Reed Quany in Kentuc~ was used to rorm the stone structures in SMAs, CMHBs and dense-graded mix. A sandstone from Pine and Bluff Sand and Gravel, Arkansas, and an navaculite from Meridian. Arkansas were used to form the SMAs in order to comJmC the influence or aggregate types. Filler in these mixes mostly came from granite fine materials known as donna fill, which is an industrial waste or granite fines. Three percent hydrated lime is also used as mineral filler in all SMA mixes to meet the gradation specification of passing No. 200 sieve. The aggregate source codes, gradations and their consensus properties are ~esented in Table 3.
Mohal!ll!lad, Zhang, Huang and Tan
T bl ) A a e ,ggregate G d ra al lons an dC onsenslIs P ropertle5
All· .,. ." '" OIl LS LS LS LS
Cod, .. SO ,1.037 AASO .. SO I" 100 100
." 100 81 " ." 96 46 55.3 3'" " 21 30.8 100 No.4 , , I' 8l NIhIO 2 II 0.' 4l No.~O I 0.8 0.' " No.1O I 07 0.' Il No.lOO OJ 0.' 0.' ' .7 LA Abr 20 20 20 21.S f1&D 4.4 7.' l.3 eM 100 100 100 FAA 41.6
A total of eighl mimes were evaluated, Table 4. They include three mixtw"e types; SMA, CMHB and dense·graded. Five ofme eight mixtures evaluated were SMAs. The other three mixes include two CMHBs and one dense·graded. Mixtures were coded by three alphabetic letters for convenience as shown in Table 4. The first letter represents mixture types (D for dense-graded, S for SMA and C for CMHB), the second represents AC binders (P for polymer-modified AC·30, M for multi ·graded MG 2040 and A for AC·30) and, the third, aggregate types (L for limestone, S for sand·stone and N for novaculite.) The gradations of the three mixtw'es are shown in Figure I. The optimum binder content ~ determined from the standard Marshall mix design, Table 4. It should be noted that the gradation of dense-graded mixture passes !he Superpave Restricted Zone. The Job Mix Formulae for !he eight mixes are shown in Table 5.
Table 4 Mixtures Evaluated No. Gradation Asp/mll Aggre,," Abbreviation I Dense G<aded PAC-40HG Limestone D PL IT SMA PAC-40HG Limestone S PL ill SMA PAC-40HG Novaculite S PN IV SMA PAC-40HG Sondo .. >e S PS V SMA MG20-40 Limestone S ML VI SMA AC·30 Limestone SAL VII CMHB PAC4 0HG Limestone C PL VIII CMHB MGlO-4O Limestone CML
Hohammad, Zhang, HlIang and Tan
I
,. ~
." .."'" O~ _
Figure 1. Aggrega/e Gradotiam a/SMA, CMHB and Dense·graded ,4-/ues
•
Five: SMAs an: designed and evaluated for this study. Three of them an: limestone with PAC-40HG, MG20-40 and AC-30 binder. The other two are saOOstone and novaculite with PAC· 40HG binder. The opimwn binder content is 6.3 percent for limestone SMA, 6.6 percent for sandstone SMA and 6.8 percent for novaculite SMA
T'W CMHB mixes are designed with limestone (24% ofNo.57, 36% ofNo.78, 33¥.ofNo.ll and 1'" of donno fill) wilb 5.5 percent PAC->WHG and MGlQ.4O binders.
in addition 10 above: seven SMAs and CMHBs, a Type 8 dense-graded mix is designed with limestone and sandstone at 4.4 percent PAC-40HG binder contenl
Test Factorials Axial and indirect tensile creep tests, resilient modulus test, three Superpave shear tests
(frequency sweep at oonstant height, repetitive shear at constant height and repetitive shear at constant stress ratio) and. Hamburg whee! tracking test \\otte COOOllCled in this study. Three replicates were used for axial creep, indirect tensile creep and resilient modulus tests. Two replicates were for the Superpave shear tests and the Hamburg wheel tracking test. In addition, gyralOf)' shear index (GSI) was recorded for !hose specimens made with the US Army Corp of Engineer's Gyratory Testing Machine (G1M), Table 8 presents the test factorials in this study.
Indirect tensile and axial creep tests are used to lest the pennanen! deformation characteristics of the mixtures. Indirect tensile resilient modulus test indicates the elastic properties of the mixtures. Frequency sweep test al constant height is used to determine viscoelastic propenies of the asphalt mixtures that include dynamic shear modulus (G") and shear phase angle (5). Repeated shear test at constant height and repeated shear test al constant scress ratio are used to evaluate permanent defonnation behavior of the asphalt mi:dure. The Hamburg wheel tracking rut depth test is used to test the rut and moisture susceptibility of the mixtures.
In Superpave shear tests, an effective temperature of 47.9-degree Celsius for permanent deformation was used to evaluate the asphalt mixtures. This effective temperature is c!efmed as the single test temperature at which the amount of pennanent deformation produced would be equivalent to that measured by considering each season throughout the year.
Specimen Preparation Three sizes of spe<:imens were fabricated for the fundamental engineering property tests
in Ihis study. These include the 101 .6 mm (4 inch) in diameter and 800u163.5 mm (2.5 inch ) high, 150 mm (5.91 inch) diameter by 130 to 140 mm (5.12 to 5.5 1 inch) high cylindrical specimens and 80 x 260 x 320 mm (3.2" x 10.2" x 12.6") beam specimens.
The l00mm diameter cylindrical specimens were compacted with the US· Army Corp of Engineer's Gyratory Testing Machine (GTM) for the indirect tensile resilient modulus, creep and
Mohammad, Zhang, Huang and Tan 11
axial creep tests. The GTM gyration angle was 0.8 degree and compaction pressure was 87 psi. The target air void for the mixtures was 15±{}.5%.
The 150mm diameter cylindrical specimens were compacted with the Superpave Gyratory Compactor (SGC) in accordance with AASHTO Designation TP4 for the Superpave Shear Tests. The Ndmsn used was 109 sac gyrations. Each compacted specimen, which was 150 mm in diameter and approximately 130 - 140 mm high, was cut into two test specimens. These test specimens met the AASHTO TP7 height requirements of 50 ± 2.5 nun for perfonnance based testing.
The beam s~imens were mixed in the LTRC's asphalt laboratory and compacted in the Koch Material Company's laboratory using a kneading compactor.
Fundamental Engineering Property Tests A series of engineering performance-based tests were conducted based on the preceding
factorials to characterize performance of the eight different mixtures in Ihis study. Test protocols and the corresponding engineering properties are listed in Table 9. A brief review of these tests is given below.
Indirect Tentile Creep Test
Protocols I
At testing temperatures of2SoC (77"F) and 4O"C (104°F) a compressive load of 1112.5 N (250 Ibf) was applied on the sample using the stress controlled mode of the MTS test system. The load was applied for 60 minutes or until sample failure (II). The deformations acquired during this time were used to compute the creep modulus as follows:
(1)
where, S(f) - creep modulus at time T, MPa, P - applied vertical load, N, I - sample thickness, mm, and
8V(f) - vertical deformation at lime T, mm.
Mohammad, Zhan g, Huang and Tan 12
Figure 2 shom a typical creep modulus versus time graph on a log-log scale for the indirect tensile creep data. From this graph the creep slope was computed and used in the analysis.
Axiaf Creep Tesl This test was conducted in accordance with the Test Method Tex·231·F (12). A static
load of 0.545 leN (125 Ibl) was applied for a duration of one hour along the centric longitudinal axis of the specimen. The axial deformation of the specimen is continuously measured and subsequently used to calculate creep propenies such as stiffuess, slope, and permanent strain these data are used to evaluate the permanent deformation characteristics of asphalt mixtures.
Indirecl Tensile ReSilient Modulus Test The testing temperatures were 5, 25, and 40 degree Celsius, and the test was conducted
according to the modified ASTM D 4123 (II). This test is a repeated load indirect tension test for determining the resilient modulus of the asphalt mixtures. The recoverable venical deformation BV and horizontal deformation 5H were used to calculate the indirect tensile resilient modulus, MR and Poisson's ratio, 11 in Eq. (2) and (3):
iii 1',,359--017
'" Frequency Sweep Test 01 Canslanl Height
(2)
(3 )
This test. conducted. in the shear mode, is a strain controlled. test, that is, a specific amount of deformation is induced in the specimen. Stress generated in the specimen is not controlled but is simply the reaction to the induced strain. The sinusoidal shear strain with peak amplitude of approximately 0.051J.ffi1mm is applied. at frequencies of 10, 5, 2, 1,0.5,0.2,0.1,0.05, 0.Q2 and 0.Q1 Hz. This strain level was selected. during the SHRP Research Program to ensure that the viscoelastic response of the asphalt mixture is within the linear range. This means that the ratio of stress to strain is a function of loading time (or frequency) and not of the stress magnitude. An axial stress is applied to maintain constant height Frequency is directly related to traffic speed. For example, a frequency of 1 Hz is equivalent to a traffic speed of 63 k:mIhr. (39 mileJhr.) and 2 Hz. is 125 kmIhr. (78 mile1hr.} Hence, frequenc.y sweep test can be used to evaluate the performance of an asphal t mixture at different traffic speeds.
Repemed Shear Tesl 01 Comlant Helghl This is a stress controlled test A repetitive shear load (havernine) is applied to the specimen
to generate a shear deformation. The shear load is applied with a maximum shear stress of68 kPa for a loading time of 0.1 seconds and a rest period of 0.6 seconds. Repetitive loading is applied. for a total of 5000 repetitions or until 5 percent shear strain is reacbed. An axial stress is applied to maintain constant height.
Iiohclllunad, Zhang, HlJanq and T.w 13
In development of the repeated shear test at constant height two mechanisms that puvide resistance to permanent deformatioo in an asphalt mi$fe were hypothesized (13):
Asphalt Binder Stiffnws Stiffer binders help in resisting permanent deformation as the magnirude of the shear
strains is reduced under each load application. The rate of accumulation of permanent deformation is strongly related to the magnitude of the shear strains. Therefore a stiffer asphalt will improve rutting resistance as it minimizes shear strains in the aggregate skeleton.
Aggregatt Structure StabilitY The axial slresses aCI as a confining pressure and lend to stabilize the mixture. A well
compacted mixture with a good granular aggregate will develop high axial forces at very small shear stram levels. Poorly compacted mixtures can also generate similar levels of axial stresses but they will require much higher shear strain.
In the constant height simple shear lest these two mechanisms are frcc to fully develop their relat ive contribution to the resistance of permanent deformation as they are not constrained by imposed axial or confining stresses. The development of the repeated shear test al constant heighl was detailed elsewhere (13).
Repel1letl Shear Test Q/ Constant Slress Ratio This is a stress controlled lest. A repetitive shear load (havmine) is applied to the specimen
10 produce • shear deformatiOll AI the same time, the specimen is subjected to synchronized haversian compressive axial loading. A maximum shear sueSs of 84 kPa and • maximlDll compressive axial stress of 105 kPa, as determined from the SHRP repon (14), were utilized in this test The ratio of the axial stress 10 the shear stress is 1.25, whicb meets the AASHTO TP7 requirtment of 1110 1.5. The shear load and the axial load are applied for a loading time of 0.1 seconds and a rest period of 0.6 seconds. Repetitive loading is applied for a total of SOOO repetitions or until 5 pen:ent shear strain is reached.
The repeated shear test at constant stress ratio is used in the Superpave system as an initial screening test to identify a mixture that exhibits tertillf}' flow leading to gross mix instability. If the mix fails the screening test. it is necessary to either make adjusnnents to the mix puportioning or to redesign the mixture completely.
Hamburg Wheel Tracking Tesl This test is considered a torture test. The Hamburg Wheel·Tracking Device produces
damage by rolling a steel wheel across the surface of a slab that is submerged in water at 50°C (122°F) for 20,000 passes. The slabs have a length of 320 mm (12.6 inch), a width of260 mm (10.2 inch), and a thickness of 80 nun (3.2 inch) .. They are secured in a reusable steel containers using plaster of paris, and are then placed into the wheel-tracking device.
The device tests two slabs al a lime using two reciprocating solid·steel wheels. The wheels have a diameter of 203.5 mm (8 inch) and a width of 47 mm (L85 inch). The load is 710 N (160 Ib ). The rolling speed is 1.1 kmIh (0.68 mph). Each wheel rolls 2]0 nun (9.1 inch) before reversing direction. The device operates at 53 ± 2 passesfmin. A maximum allowable rut
depth of 4 mm al 20,000 passes is used in Hamburg, Germany. However, Colorado considers
HohdlMlotd, Zhdng, Huang dnd roln " the Hamburg specification to be too severe for their pavements and uses a rut depth of 10 mm after 20,000 passes to be more reasonable (15).
The following four indices are used to quantify the test results (16). Figure 3:
• Post-Compaction Consolidation: A low post-compaclion consolidation value (reponed in mm) is desirable, because thIS would indicate that the compaction during laboratory fabrication was near optimum levels.
• Creep Slope: The creep slope is the inverse of the rate of deformation in the linear region of the defonnation curve. This linear region is the region after post«lmpaction effects have ended and before the beginning of stripping. The creep slope value is reported as ~mm.
The larger the value, the more energy is needed to defonn the mix; therefore, the slower the rate of permancnt defonnalion and the less sensitiYC the mix to runing.
• Stripping Slope: This slope is the inverse of the rate of defonnation in the linear region of the dcfonnation curve, after the beginning of stripping until the end of the test. The stripping slope is reported as passeslmm, The stripping slope is related to the severity of moisture damage, and for this reason a higher number of passes for each I mm of impression from stripping is the desirable value.
• Stripping Inflection Point: The-stripping inflection point (rcported in number of passes) is the number of passes at the intersection of the creep stope and the stripping slope. The stripping inflection point is related to the resistance of the mixture to moisture damage and a high value for this index is desired. The higher the value for the stripping inflection point, the more energy is needed to cause stripping; therefore the less sensitive the mix is to stripping.
DraindoWD Test The FHWA draindown test was used to evaluate the efficiency of the stabilizer to prevent
draindown of the binder in loose mixtures. 1200 grams of loose mix was placed in the sieve and put into the oven at the prescribed temperature for 60 minutes. A paper plate was plaud under the sieve. The calculation of asphalt draindown is perfonned by subtracting the initial paper plate mass from the final paper plate mass and dividing this by the initial total sample mass. Multiply the result by 100 to obtain a percentage. Draindown greater than 0.3 percent indiccate that draindown may be a problem for the mix.
DISCUSSION OF RESULTS
A standard statistical procedure, One Way ANOVA, has been used to test if the mean values of the fundamental enginetring properties are significantly different among the eight mixtures. A 95·percent confidence level has been utilized to analyze the test results. The ANOVA analysis places sample averages into groups by detennining which averages are statistically equal. Groups are designated by letters "A", "8", "e", "AS", "8C", etc. Group "A" has a mean that is statistIcally higher than group "8" and so fonh. A designation of "AS" shows that the average can be placed into either its corresponding statistical ranking group "A" or "8".
HohalMlad, Zhang , Huang and Ta n " The ANOVA analysis is not applied to the results of the Superpave shear tests and the
Hamburg wheeltracklOg test due to the insufficient replicas for each tesl Common arirhmetic means have been used \0 analyze these test results.
Elastic Properties Elastic properties of asphalt mixtures are examined by the indirect tensile resilient modulus
test Table 10 presents the ~ values of the lest at three different temperatureS. The resi lient modulus values of all eight mixtures decreased as the lesting temperatw'eS increased, as ex.pected, since HMACs are known to be stiffer at lower temperature. For limestone SMA with three different asphalts and limestone CMHB with two different binde~ the mean resilient moduli are statistically similar at the same temperature. for SMAs using PAC40 with three different ~e types (S]L. S _PN and S_ PS~ the resilient moduli ofS _PN and S]S are statistically similar and they are both higher than that ofS]L at three testing temperarures.
I
lDdirut Teusile Creep Re:lulu The indirect tensile creep test results of eight mix.es tested at 40 degree Celsius (104
degree Farenheit) are presented and statistically ranked in Table 11. Results of creep test show that D_PL ellhibited a lower creep slope than SMAs and CMHBs. S]S and S]N have the highest creep slopes. Because an asphalt mix with a higher creep slope indicates a higher rutting potential, these resul ts contradict the infonnation obtained from the literature about the SMAs performance, which showed that SMA was more rut resistant than the dense·graded mixes. One the other hand, the results indicate the creep slope increase with the mastic contenl This may be attributed to the fact thai testing in the indirect tensile mode at high temperature without confinement may not capture the added conttibutions of the aggregate structure due to high binder content. The creep slopes of limestone SMAs and CMHBs indicate no significant change due to the change of asphalt binders.
MohalMl<ld, Zh<ino , HU<ing and Tan "
bl Ta ell. Rankmgo n lrect Tensile Creep Test Results Engineering Mix Propenies o PL S PL S PN S PS S M!. SAL C PL CM!.
Creo, Slo", -0.35 -0.50 -0.63 -0.63 -0.58 -0.59 .{J.54 .o.sS Rankine A B C C B B B B
Ali.l Creep Test Results Table 12 presents the average axial creep slope and creep modulus of each mix and its
statistical ranking designation. S _PN and S _PS mixtures showed the highest stiffness compared to the other mixes. The other mixes were not significantly different, however, they all meet the minimum requirement of creep stiffness set by TxDOT, which is 41 .4 MPa (6000 psi) (8). S]N and S]S exhibited the lowest creep slo~s. D _PL has the highest creep slope. The creep slopes of the rest of SMAs and CMHBs are not significantly different.
Tbl 12 Rni, fA · IC T R I • e • me. 0 ". reeD est eso. Engineering Mix
Pro",ny o PL S PL S PN S PS SM!. SAL C PL CM!. Creep Slope 5.5 2.9 0.9 1.0 4.0 3.5 4.4 4.5
xlO-<lmmlmmlsec A B C C AS AS AS AS Stiffness 78.7 80.0 90.4 89.7 82.1 78.7 78.7 78.0
MPa C BC A A B BC C C
Gyn.tory Shear Index The average gyratory shear index (GS!) of each mix is presented in Table 13. The GS! of
D]L is greater than I and is the highest The OS!s of the rest of the mixes are not significantly different with values of less than I. A higher OS! is reponed to indicate that a mix may be susceptible to rutting,
T bl 13 R.ni' fG a e mg 0 uyratory Sh I d ear n ex Engineering Mi,
Pro",rty o PL S PL S PN S PS S M!. SAL C PL CM!. GSI 1.07 0.96 0.95 0.96 0.95 0.98 0.96 0.98
Rankin~ A BC C BC BC B BC B
Draiodowo Test Results Table 14 presents the results of draindoWll test on the five SMA mixes. S _ ML and S _ AL
have nearly zero percent draindown of asphalt while the SMA mixes with PAC40HG binder (S ]L, S _PN and S ]S) exhibit draindown from 0.22 to 0.2S percent of total weight of the mix. These results show that cellulose fiber is very effective in terms of preventing draindown of asphalt. Also, MG20-40 asphalt will not calL'ie any draindown problem. PAC-40HG SMAs with three different coarse aggregates indicale no significant difference in percent of draindown,
MohdlMldd, Zhdnq , HUdnq dnd r dn 17
Table 14 Draindown Test Results Mix IUS PL "'IS PN IVIS PS VIS ML VlISAL
Visroelastic Properties Viscoelastic propenies of asphalt mixtures are examined by performing a frequency sweep
test Material properties obtained from this test are dynamic shear modulus and shear phase angle as shown in Figures 4 and 5.
Dynamic shear modulus (Go) is defined as the ratio of the peak stress amplitude to the peak slmin amplitude. It is a measure of total stiffness of asphalt mixtures and is com~ of elastic and viscous components of asphalt mixture stiffuess. Thus far, the correlation between dynamic shear modulus and pavement rutting has not been well established although it is well known that, for a stiff mixture, the strain generated in asphalt pavement under traffic loading is relatively small and., therefore, the pavement rutting performance is enhanced. Phase angle is defined as the time lag between the application of a stress and the resulting strain.
Effia of Mixlun Type Effect of mixture type on dynamic shear modulus is presented in Figure 6. It is observed that
the dynamic shear modulus increases significantly with increasing frequency. For the S8 polymer modified asphalt, the CMHB mix has the highest dynamic shear modulus at I and 10 Hz. At 0.01 Hz, C]L mixture had the highest G', whereas, D _PL and S _PL showed similar dynamic shear modulus
wi"". The ~hear phase angles for all the asphalt mixtures are shown in Figure 5. It was found the
shear phase angle increases with increasing frequency, which is different from asphalt binder in that the shear phase angle for asphalt binder generally decreases with increasing frequency. The explanation is as follows:
If the frequency sweep test for the asphalt mixture was performed at different temperature.<; and the master curve was created, shear phase angle would increase with increasing frequency, reach a peak, and then decrease (17·21). This is because at high frequency (low temperature), the phase angle of asphalt mixtures is primarily affected by the asphalt binder. Hence, the shear phase angle of the asphalt binder and asphalt mixture follows similar trend. However, at low frequency (high temperature), it is predominantly affected by the aggregate, and therefore, the shear phase angle for asphalt mixtures decreases with decreasing frequency or increasing temperature because of the aggregate influence.
II appem that the shear phase angle for all the asphalt mixtures at this effective temperature wooId only represent the left side portion of the master curve in which the aggregate influence becomes more imlXlrtanl
It was also fotmd that the sensitivity of shear phase angle to frequency is dependent ulXln the mixture type. The JXllymer modified CMHB has the least sensitivity .
. .
MOhammad, Zhang, Huang and Tan J8
Effect of Asphalt Binder Type The dynamic shear moduh. ,fthe SB polym" modifiod (pAC-41lHG\ gcllod (MG2O-41l)
and AC-)O plus fiber mixtures is p-esented in Figure 7. It was found that for SMA mixtures. the AC)0 plus fiber mixture has the highest dynamic shear modulus values at all frequencies. Among the SMA mixtures with limestone aggregate, at 0.01 Hz, S _At had tugher Ot than S_PL, which in nun exhibited higher dynamic shear modulus than S ML mixture. Between the CMHB mixtw'es, PAC-40HG mixture has the tugher dynamic shear modulus values than that ofMG20-40 mixture. It is not known whether this ranking correlates to acrual field performance. It appears that the fiber significantly Sliffens the asphalt mastic within the asphah mixture. Since the frequency sweep test was performed at very small sIrlin level and the test results may reflect the effect of both aggregate skeleton and asphalt mastic. Since the AC-)O plus fiber SMA mixture has stiffer mastic, its dynamic shear modulus is higher.
Effect of Aggrtg(Jfe Type Figure 8 presents the dynamic shear modulus for the limestone, novaculite and sandstone
SMA mixtures. The sandstone mixture has the highest dynamic shear modulus, and the other two
mixtures are comparable, however, at 0.01 Hz frequency, S]N had higher 0 ' values than S]L.
Permanent Derormation Properties The permanent deformation properties of asphaIl mixtures are obtained through repetitive
shear at COCl\lant height (fSCH) and repetitive shear a! constant stress raJio (RSCSR~ In addition, the Hamburg Wheel Tracking test indica1es the relative rut and rnoisrure suscertibility of diff~
""""= RepetJled Shoor Test at Canstant Height
A pavement rutting perfonnancc prediction model was developed during SHRP-AOO)A projccl Permanent shear strain obtained fi"om the repeated shear test at COIl'itant height can be input inlo this performance prediction model to predict rut depth as a function of equivalent single axle loads (ESAl..s~ This model was based on a relationship between rut dqth aOO maximum shear strain that was developed from a non-linear elastic, visco-plastic constitutive equalion to describe the behavior of the a,spwt concrete incorporated into I finite element progJ3III (13~
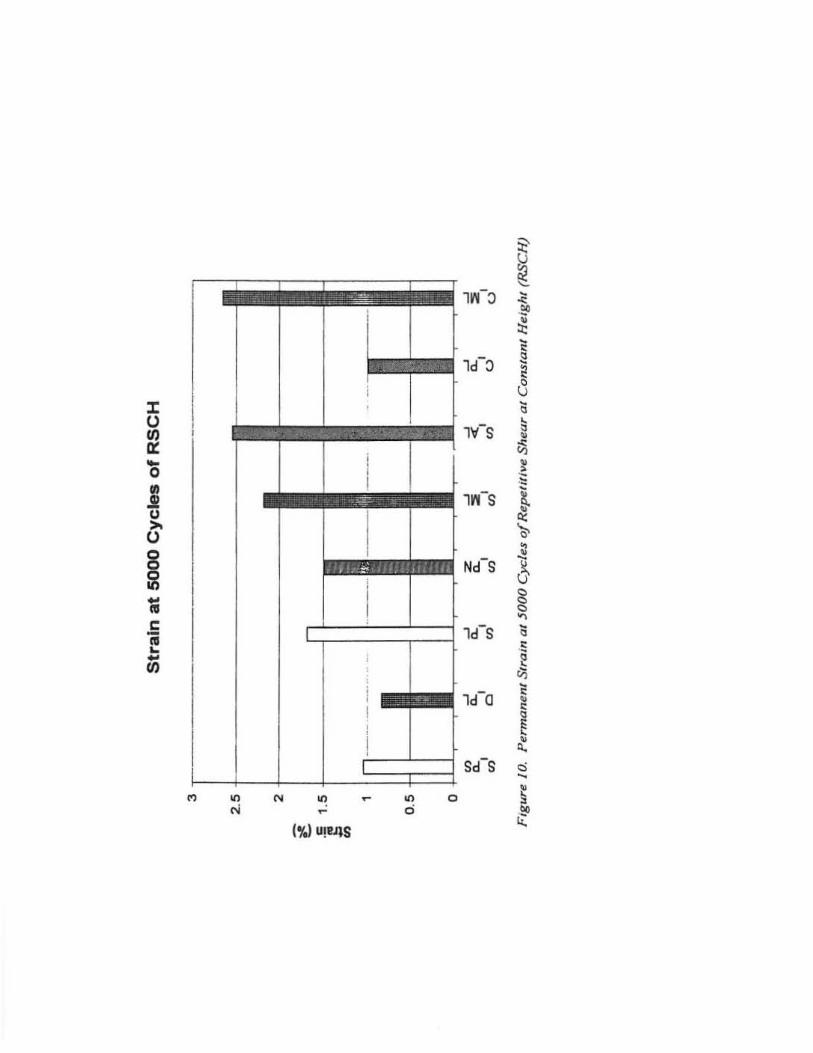
Figure 9 prt:SCn1S permanent shear strain IS a function of load repetitions. It was found that the most permanent sIrlins .....-cre developed during the tim 500 load repetitions. The strain rate depends on mi~ type. Figure 10 presents the permanent strain at 5000 load ~tions.
Effect o(MixtW'f! Tvpe Among the SB polymer moo;fiod asphalt mi><1W<S (D]L, UL, and C]L\ the deme
graded mi~ has the lowesl permanent strain and the SMA mixnrre has the highest pennanent shear stnUll For the gelled asphalt mixtures (S_ML and C_ML). the SMA mixture has slightly smaller permanent strain than the CMHB mixture. While this ranking is inconsistent with that from the frequc:ncy sweep lest, il is evident the SMA mix is not shown to be the best mix in either of the
""'-Effect o(Aspha!t Binder Type
" In the SMA """'It mixtures IS PI., S ML and S ALI the AC·JO ~us fib« mixture has the - - -
highest permanent strain and the S8 IXllymer modified asphalt mixture has the lowest, which is COfItrary to the results from frequency sweep test
HtfeCfofAggregale Type Among the limestone, novaculite and sandstone SMA mixtures (S]L, S]N and S _ PS), the
sandstone mixture has the smallest pennanent strain. and the S_PL has the highest permanent strain. This ranking is consistent with thai from the frequency SWl:ep tests.
RepeiJled Sheor Test oJ Consfanl Slrw Rtrt.o In SupefPlvc mil( desiWl and anaJysis system, the repeated shear lest al constant stress ratio is
used to identify mixrures susceiXible to accelclllted deformation. This test can be used 10 estimate !he mixture 's resistance to permanent shear strains. This is a pass-fail type lest plior to beginning the entire testing program for mix analysis procedure.
Figure 11 presents pennanent shear strain as a function of load repetitions. Similar to repetitive shear at constant height lest, it was found that the most permanent strains were developed during the first 500 load repetitions. The strain rate depends 011 mixture type. Figure 12 presents the permanent strain at 5000 load repetitions.
[ffecl o[MaJun Tvpe Among the polymer modified asP>aJt rnixn= ID_PL. S1L, and C_PL), the CMHB
mixture has the lo~ permanent strain and the SMA mixture has the highest. For the gelled asphalt mixtures (5)& .. and C _ ML1 the SMA mixture has sl ightly higher permanent strain than the CMHB mixture. This ranking is not always consistent with that from the frequeocy sweep test and repeated shear lest at constant heighl
It is felt that the test puameters for t/Us repeated shear test should be modified to better simulate the field conditions. For irwnce, the test temperarure for this test at constant height should be incrtased 10 reflect the field oonditiom.
Efta ofhphalt Binder Tm In the SMA aspMIt mixtures IS PI., S ML and S ALI tho AC·JO plus fib« rnixtun: has the - - -
smallest permanent strain and the S8 polymer modified and gelled mixture are comparable. This ranking is the same as that from the frequency sweep tests bUi contrary to that from repeated shear test at constant height.
Efftcl ofAggregate Tvpe Among the limestone, novacuJite and sandstone SMA mixtures (S-PL, S-PN and S-PS). the
sandstone mixturt: has the smallest permanent strain, which is consistent with that from the frequ:ncy sweep tests. The limestone mixrure has the highest permanent shear strain.
ComporISOll of the Two Repeated Shear Tau A compuison of the pennancnt shear strains obtained from the two repeated shear tests is
shown in Figure 13. The pennanent shear strain obtained from t1!e repealed shear test at constant height is much higher than that from the repeated shear test at constant stress ratio although the maximum shear stress (68 kPa) applied in the repeated shear test at OOrL'itanl height is lower than that
MohalMlad, Zhang, Huanq and Ta n 20
(84 kPa) in the repeated shear test at constant stress ratio. One explanation is that the axial stress generated in the repeated shear test at constant height is always significantly lower than the axial suess (105 kPa) applied in the repeated shear test at constant stress ratio. The high axial stress applied in the repeated shear test al constant stress ratio significantly increases the structure stability of the as!Xlalt mixture. Therefore, the permanent shear strain generated in the repeated shear lest al constant stress ratio is expected to be much smaller as compared to the repeated shear test at constant height.
Hamburg Wheel Tracking Tesl Table 15 presents the results of the Hamburg Wheel Tracking test. For rut and moisture
resistance, higher creep slope and stripping slope values, as well as higher nwnber of passes to 20 mm rut depth and a higher suipping inflection point value, are desirable. The rut depth at 20,000 passes (final), is desired to be a low value. The failure criteria defined by the city of Hamburg specification are 4.0 mm maximwn deformation for roads and 2.5 rom deformation for industrial areas. Colorado OOT uses a failure criteria of to mm at 20,000 passes based on correlation to fie ld perfonnance for Colorado pavements. Figure 14 shows the final (20,000 passes) pennanent deformation for all the mixttlres. Among the mixtures tested, S]S had the lowest final deformation at 20,000 passes and the highest creep slope. Also, none of the mixtures tested exhibited susceptibility to moisture damage.
Table 15. Results from the Hambur~ Wheel Trackin 1"t. Mixture D PL S PL S PS S PN S ML SAL C PL CML Air voids, % 6.6 6.7 4.4 3.4 4.l 5.2 4.5 45 Intercept, mm 1.92 2.38 2.11 3.01 2.84 259 2.89 2.50 CreeD slone, passes/nun 11407 12980 24558 10665 8325 5819 17939 15078 Final defonnation, mm 3.695 3.910 2.860 4.950 5.235 6.035 4.020 3.765
E{fecl arMature Type Among the S8 polymer modified mixtures (0 _PL, S]L and C _PL), the D] L mixture
presented the lowest deformation, whereas the C _PL presented the highest defonnation.
Effect of Binder Tvpe In the SMA mixtures (S PL, S ML and SAL), the S PL had the lowest deformation. - - - -
The S Al mixture had the highest defonnation.
E((ecl orAggregale Type Among the limestone, sandstone and novaculite SMA mixtures with S8 polymer
modified binder, tbe S_PS mixture presented the lowest final defonnation. The S_PN had the highest defonnation. This ranking is consistent with most of the other tests.
Overall Ranking of Rut Susceptibility Table 16 presents the ranking of the engineering performance properties of all the tests based
on a summary of the observations during this study. Here each mixture is ranked numerically from I to 3 within a comparing group for each performance test. Ranks that have smaller numbers tend to be less susceptible to rutting based on that particular item. In other words, a mixture ranked I is less
Mohammad, Zhang, Huang and Tan 2J
susceptible to rutting than that of 2 from the results of a specific tesl Summing up aU the points of a mixture from all the tests, a total !Xlint is obtained Coru;equently, a mixture with a lower total JXlint tends to perform beller in resisting rutting than the ones that have higher JXlin\s.
Table 16. Summary ofComoarison ofDifferent Mix, Binder and A ~T
Propmjes rrom Tests MilT As halt BinderTlDts A "T D PL SPL C PL SPL S ML SAL SPL SPN SPS
lndirtd Teailee .... I 2 2 I I I I 2 2 A1iIICmp l I 2 I I I 2 I I
GTMG rltll Shm'lnda 2 I I I I I 2 I 2 G' 110.011h 2 2 I 2 l I 2 l I
RSCB F"IIUII DefOlUlltioa I l 2 I 2 l l 2 I RSCSR Fillll Dd'onnlIion 2 l I 2 2 I l 2 I
Bambo Wbed Trackill I 2 l I 2 l 2 l I
Slm 'oials 12 " 12 , 12 II II 14 , SUMMARY AND CONCLUSIONS
The perfonnance of stone mastic asphalt (SMA) mixtures and come matrix high binder (CMHB) mixtures has been studied through the engineering performance testing with comparisons to the conventional Louisiana Type 8 dense-graded mixtures. The influences of aggregate type and asphalt binder type have also been considered in the study. The following observalions have been made based on this laboratory study.
• Among the D]L, S_PL and C _PL mixtures, the dense-graded (D ]L) and the come matrix high binder (CMHB) mixtures had the better overall rutting performance index than the SMA mixture (UL);
• SMA mixture containing sandstone (S_PS) and PAC4DHG binder exhibited the highest overall rutting performance index when compared to similar mixes with limestone and novaculite;
• Among the SMA mixtures with limestone, (S]L, S_ML and S_AL), the mixture with SB polymer modified PAC40HG had the better overall rutting performance index. Mixture S _AL had the lowest performance ranking;
• Of aU the eight mixtures tested, S_PN and S]S had the relatively lower elastic resilient modulus values while the rest of the six showed similar values;
• SMA mixtures with chemically modified asphalt MG204 0 and AC-30 with fiber exhibited lower asphalt draindown than PAC-40HG;
• None of the eight mixtures tested with the Hamburg Wheel Tracking test device exhibited moisture susceptibility.
ACKNOWLEDGMENT
This research was supported by the Louisiana Transportation Research Center (L lRC). The Supetpave perfonnance tests were conducted by the Heritage Research Group and the Hamburg Wheel Tracking tests were perfonned by the Koch Materials Company. The authors would like to express their thanks to all those who have provided valuable helps in this study.
Mohammad, Zh~n9, Huan g and Tan 22
REFERENCES
1. AASI-ITO, "Report on the 1990 European Asphalt Study Tour," Wasington, D.C., lWlC, 1991. 2. ---' "Test and Evaluation of Project No. IS - Stone Mastic Asphalt (SMA)," Federal Highway
Administrntion, Office ofTechnology Application, Washington, OC, December 23, 1991. 3. ER Brown, RR Maltick, 1. Haddock, 1. Bukowski, "Performance of Stone Mastic Asphalt
(SMA) Mixtures in the United States," Asphalt Paving Technology 1997, Vol. 66, 10umal of the Association of Asphalt Paving T echno\ogist, 1997.
4. E.R Brown, 1.E. Haddock, R.8. Mallick, TA Lynn, "Development of a Mix Design Procedure for Stone Matrix Asphalt (SMA) MiKture," Asphalt Paving Technology 1997, Vol. 66,louma1 of the Association of Asphalt Paving Technologist, 1997.
S. W.S. Mogawer, K.D. Sruart, "Effect of Coased Aggregate Content on Stone Matrix Asphalt Rutting and Draindown," TRR 1492, Transportation Research Board, Washington, D.C., 1995, pp. l·lI .
6. GW. Maupin lr., "Determination ofCompactive Effort to Duplicate Pavement Voids for Corps of Engineers Gyratory Testing Machine," TRR 1492, Transportation Research Board, Washington, D.C., 1995, pp. 12·17.
7. J.J. Emery, et aI., "Stone Mastic Asphalt Trials in Ontario," Pavement Surface Courses, Stone Mastic Asphalt Pavements, and Asphalt Concrete R~ling, Transportation Research Record, No. 1427, lRB, Washington, OC, 1993.
S. ---' "Texas Department ofTransportation Special Specification - Coarse Matrix High Binder Hot Mix Asphaltic Concrete Pavement," Project CAR 2005·3-1 & NH 94{2S), Austin, Texas, 1993.
9. H.R Paul, H. Shirazi, and L.N. Mohammad, "Construction Report - US 61 - Sl Francisville, Field and Labonttory Evaluation ofHMAC with CRM and Polymers Utilizing SMA, SAMl, Gap Graded. and Dense Graded Mixes," Louisiana Trwportation Research Center, Baton Rouge, lA, 1994.
10. RP. lzzo, JW. Button, M Tahmoressi, "Comparntive Study of Coarse Matrix Binder and Demie-Graded HMA," Paper Presented at the 76" Annual Meeting, Paper No. 970482. Transportation Research Board, Washington, D.C., January, 1997.
11. L.N. Mohammad, and H.R. Paul, "Evaluation of the Indirect Tensile Test for Dctennining the Structural Propenies of Asphalt Mix.' National Academy of Science, Transportation Research Record No.1417, 1993, pp. 5S-63 .
12. ---' 'jest Method Tex·23I·F," Texas Department ofTransportation, Division of Materials and Tests, Revised, Feb., 1991
11 1. Sousa, M. Solaimanian and S. Weissman. ''Development and Use of the Repeated Shear Test (Constant Height): An Optional Superpave Mix Design Too\." SHRP·A-69S, Strategic Highway Research Program, National Research Council, Washington, OC, 1994.
14. R. Cominsky. ''The SlJperpave Mix Design Manual for New Construction and Overlays." SHRP·A407, Strategic Highway Research Program, National Research Council, Washington, OC 1994.
IS. T. Aschcnbrener, "Evaluation of the Hamburg WheeJ.Tntcking Device to Predict Moisture Damage in Hot Mix AsjNIt,' Preprint, Transportation Research Board, 741h Annual Meeting, 1995, Paper No. 950475.
HohalMlad, Zhang, Huang and Tan 2J
16 . ...--..J "Hamburg Whetl Tracking Device," Technotes, A publication by Elf Asphalt Research, 1990.
17. X. Zhang. "Evaluating Superpave Performance Prediction Models Using a Conuolled Laboratory Laborntory Experiment" To be published in the Journal of the Association of Asphalt Paving Technologists, Volume 66, 1997.
18. O.A. Fonseca. "Development of a Time-Dependent Model for !he Dynamic Modulus of Asphalt Mixes.· Dissertation, Department of Civil Engineering, University of Maryland., College Park, MD, I995.
19. Univer.;ity of California at Berkeley. ·Permanent Defonnation Response of Asphalt Aggregate Mixes." SHRP-A-415, Strategic Highway Researth Program, National Research Council, Wuhin~on, DC, 1994.
20. S.H. Alavi and c.L. Mooismith. "Time and Temperature DepeOOent Properties of As(ilalt Concme Mixes T esled as Hollow Cylinder.; and Subjected 10 Dynamic Axial and Shear Loads." Joumal of the Association of Asphalt Paving Technologists, Volume 63, 1994.
21. 1.B. Sousa and S.L Weissman. "Modeling Permanent Deformation of Asphalt-Aggregate Mixes.. Jownal of the Association of Asphalt Paving Technologists, Volwne 63, 1994.