LABORATORY WORK BOOK For Academic Session ______ Semester _____ TELECOMMUNICATION MANAGEMENT NETWORKS (TC-488) For BE (TC) Name: Roll Number: Batch: Department: Year/Semester: Department of Electronic Engineering NED University of Engineering & Technology, Karachi
Transcript
LABORATORY WORK BOOK
For Academic Session ______
Semester _____
TELECOMMUNICATION MANAGEMENT NETWORKS
(TC-488)
For BE (TC)
Name: Roll Number: Batch: Department: Year/Semester:
Department of Electronic Engineering NED University of Engineering & Technology, Karachi
LABORATORY WORK BOOK
For The Course
TC-488 TELECOMUUNICATION MANAGEMENT NETWORKS
Prepared By: Shahid Ur Rehman (Lecturer)
Reviewed By: Dr. Irfan Ahmed (Associate Professor)
Approved By: The Board of Studies of Department of Electronic Engineering
INTRODUCTION
Telecommunication Management Networks Practical Workbook covers those practical that are very knowledgeable and quite beneficial in grasping the core objective of the subject. These practical solidify the theoretical and practical concepts that are very essential for the engineering students.
This work book comprise of practical work covering the course work of Telecom Management Networks. All the practicals are designed and arranged on modern concepts. Above all this workbook contains a relevant theory about the Lab session.
CONTENTS
Lab No.
Date
Experiments
Page No.
Remarks/ Signature
1 (a) To learn the concept of a Network. Perform a simple service oriented network design activity in Packet Tracer 5. (b) Introduction to Network Management Tools. Learn how Networks can be managed using these tools.
2 Introduction to WireShark (Network Protocol Analyzer /Packet Sniffer) and Layered Protocol.
3 (a) To study the concept of a Network Monitoring System (NMS). (b) To study a SNMP based NMS and observe communication between a managed element (CISCO 2950 Catalyst Switch) and NMS system
4 To study the MIB(Management Info. Base) File structure written in ASN.1 focusing on RFC-1155 SMI and RFC 1212.
5 To design a SNMP based managed network in Packet Tracer 5.3 using SNMPv2c and RW and Read Only communities.
6 To learn the packet format of SNMP GET REQUEST, SET REQUEST and GET RESPONSE PDUs using WIRESHARK in a managed network.
7 To learn the packet format of a SNMPv1 and v2 TRAP PDUs using WIRESHARK and Trap Receiver in a managed network.
8 (a) TO learn SNMPv3 packet formats using noAuthnoPrivacy, authnoPrivacy and authPrivacy modes. (b) To understand VACM based access Control mechanism.
9 (a) To understand Remote Monitoring (RMON) concept. (b) To learn configuration of ALARM and Event Groups and configure an Alarm and map it to a Logs/TRAPS Event using a cisco 2950 switch and observe Traps with Trap Receiver.
10 Learn the concept of Performance management in a LAN environment using Multi Router Traffic Grapher (MRTG).
11 (a) Introduction to TCL(Tool Command Language) programming. Learn installation of ActiveTCL in windows environment.
(b) Running a basic TCL script to learn the PUTS, GET and SET commands with grouping and substitution concepts.
12 To learn Looping structures (For and While) in TCL 13 To learn about the TCL Lists. 14 Lab Project
TC-488 TELECOMMUNICATION MANAGEMENT NETWORKS____________________________ NED University Of Engineering & Technology, Department of Electronic Engineering
1
LAB SESSION 01
Objective: (a) To learn the concept of a Network. Perform a simple service oriented network design activity in Packet Tracer 5.
(b) Introduction to Network Management Tools. Learn how Networks can be managed using these tools. Background Theory for part (a):
A computer network or simply Network is a collection of computers and devices connected together via communications devices and media such as modems, cables, telephone lines, and satellites that facilitates communications among users and allows users to share resources with other users. Networks may be classified according to a wide variety of characteristics.
Packet Tracer is a wonderful development program put out by Cisco: a leader in computer networking hardware for simulating and testing network designs.
In this lab we will form a simple network as shown below. After completing the design you will verify the connectivity between network elements by using the ping utility.
Constructing the network will take straight cables over the based network. You will also assign the IP addresses on each network element. We will simply use a subnet of Class C (27 bits for network).After configuring the IP addresses; you will need to configure a gateway address. The gateway address is simply the IP address of the Ethernet port that a computer is destined to route its data. We will configure the server for the provisioning of HTTP service.
Procedure: Design the network as shown below in packet tracer 5.3 and finally test HTTP service on it.
TC-488 TELECOMMUNICATION MANAGEMENT NETWORKS____________________________ NED University Of Engineering & Technology, Department of Electronic Engineering
2
(a) Network management refers to the activities, methods, procedures, and tools that can be used for maintaining following three operations on a network.
(i) Operation deals with keeping the network (and the services that the network provides) up and running smoothly. It includes monitoring the network to spot problems as soon as possible, ideally before a user is affected.
(ii) Administration involves keeping track of resources in the network and how they are assigned. It deals with all the “housekeeping” that is necessary to keep things under control. Maintenance is concerned with performing repairs and upgrades—for example, when a line card must be replaced, when a router needs a new operating system image with a patch, when a new switch is added to the network. Maintenance also involves corrective and preventive proactive measures such as adjusting device parameters as needed to make the managed network run “better.”
(iii) Provisioning is concerned with configuring resources in the network to support a given service. For example, this might include setting up the network so that a new customer can receive voice service.
Network Management Tools: There are plenty of Tools that can be used for Network Management. A few of them are as follows ;
LANState builds a network map automatically by scanning Windows network neighborhood or IP address range. It can monitor the network or individual traffic of each NE. Also supports SNMP based management.
Castlerock
SnmpC http://www.castlerock.com/
The Work Group Edition 5.1 is appropriate for small networks It supports SNMPv3, as does the Enterprise edition that provides other capabilities. Cost of the Work Group Edition is $995.00 The company has been a leader in the SNMP field
Solar Winds
Engineers Edition
http://solarwinds.net/ Provides a number of management tools ranging in price from $145 to $1995. The $1995.00 package is Web-enabled. The Engineers Edition at $995.00 looks like the most attractive for users of this book in that it contains most of the features of the HiFn Ama;uzer.
MG-SOFT
Net Inspector Lite
http://www.mg-soft.si/ Net Inspector Lite is $495.00. It looks like a good choice for readers of this book. MG-SOFT provides many other more comprehensive
TC-488 TELECOMMUNICATION MANAGEMENT NETWORKS____________________________ NED University Of Engineering & Technology, Department of Electronic Engineering
3
products and products can be enhanced by proxy front-end modules. There are also products that support SNMPv3
Procedure: We will first use LANSTATE tool to demonstrate how a network manager discovers a network and creates/maintains a graphical view of its network in a single window. Open LANSTATE software. Run “Map Creation Wizard” from File menue. A window will appear as shown below,
Click Next, a second window like below will appear,
TC-488 TELECOMMUNICATION MANAGEMENT NETWORKS____________________________ NED University Of Engineering & Technology, Department of Electronic Engineering
4
Enter the IP Address range of you target network to be discovered and click next to get following window,
TC-488 TELECOMMUNICATION MANAGEMENT NETWORKS____________________________ NED University Of Engineering & Technology, Department of Electronic Engineering
5
Now clicking Next button will result in start of network discovery process as shown below,
The finally discovered network would be like as shown below,
Students are encouraged to explore the features of this software.
Now open the PowerSnmp from start menu. You should get a window like below,
TC-488 TELECOMMUNICATION MANAGEMENT NETWORKS____________________________ NED University Of Engineering & Technology, Department of Electronic Engineering
6
Goto Discover SNMP Agents to obtain the following window, In the address bar you can specify the target network to be discovered or use the default broadcast address and press find. Based on the SNMP community (public and NED) set in the properties clients with snmp agent enabled will be discovered. Add these discovered clients to obtain the below window,
Now select the parameter of sysDescr from the Snmp MIT shown in the rightest window and select any discovered agent from left most window ,right click on it and select query , a windows will pop up in which press query button again to obtain the below window .You can
TC-488 TELECOMMUNICATION MANAGEMENT NETWORKS____________________________ NED University Of Engineering & Technology, Department of Electronic Engineering
7
see that it has returned the complete description of the selected client. You can similarly any of the supported parameter in the snmp MIT.
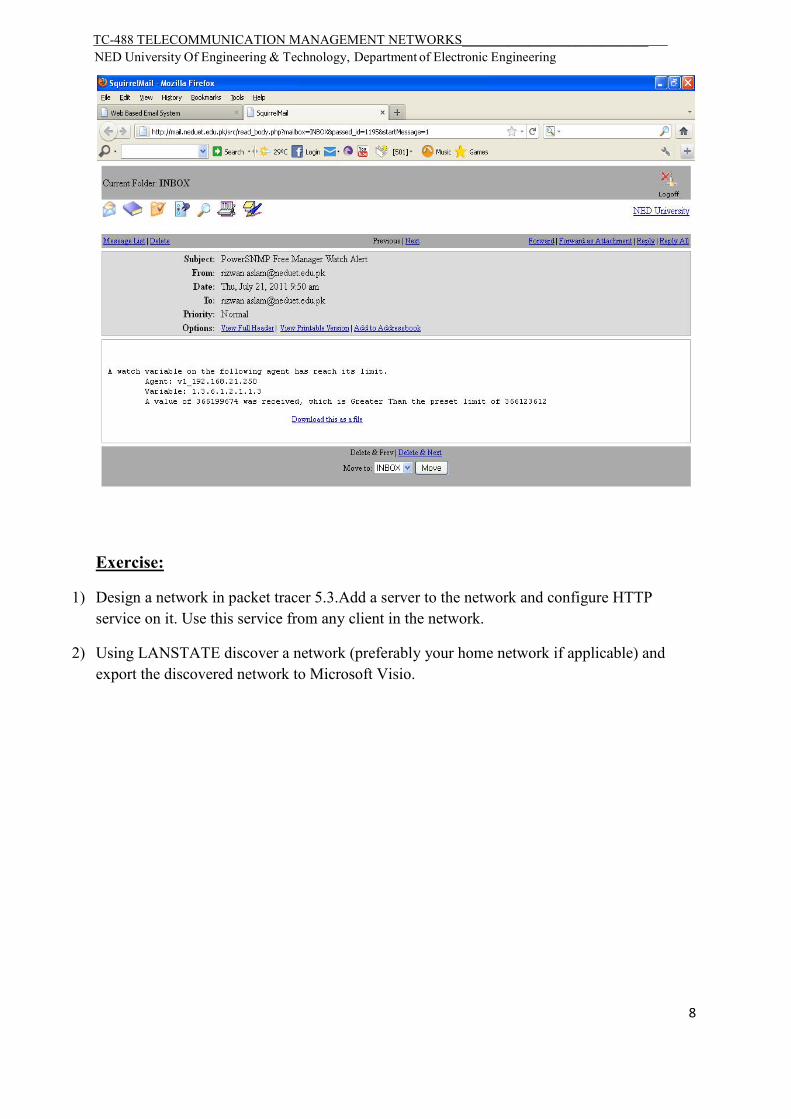
Now select any of the snmp agent and select the sysUptime parameter from MIT and select the add watch option from the right click options on the selected agent. You can also specify warning limit and trigger an auto email notification if limit is crossed as shown below,
TC-488 TELECOMMUNICATION MANAGEMENT NETWORKS____________________________ NED University Of Engineering & Technology, Department of Electronic Engineering
8
Exercise:
1) Design a network in packet tracer 5.3.Add a server to the network and configure HTTP service on it. Use this service from any client in the network.
2) Using LANSTATE discover a network (preferably your home network if applicable) and export the discovered network to Microsoft Visio.
TC-488 TELECOMMUNICATION MANAGEMENT NETWORKS____________________________ NED University Of Engineering & Technology, Department of Electronic Engineering
9
LAB SESSION 02
Objective: Introduction to WireShark (Network Protocol Analyzer /Packet Sniffer) and Layered Protocol . Background Theory A better way to understand network protocols is to observe how they actually work. A basic tool for observing the messages exchanged between executing protocol entities is the packet sniffer, which is an essential part of network protocol analyzer. WireShark is a free and open-source network protocol analyzer that runs on various operating systems including Linux, Unix, Mac, and Windows. WireShark: WireShark (previously called Ethereal) is one of the most widely used network protocol analyzer. It passively sniffs packets that are sent from or received by a designated network interface, but never sends packets itself. It receives a copy of packets that are sent from or received by the applications and protocols executing on the end-system (e.g., your computer). WireShark also has a graphical front-end to display the packets that it sniffs.
Fig2.1
Fig2.1. shows the structure of a network protocol analyzer. At the right of the figure shows the protocol stack and applications (such as a web browser or an FTP client) that normally run on your computer. The network protocol analyzer, shown within the dashed rectangle, has two parts, the packet capture and the packet analyzer. The packet capture library receives a copy of every link-layer frame that is sent from or received by a designated network interface. The messages exchanged by higher layer protocols such as HTTP, FTP, TCP, UDP, DNS, or IP all are eventually encapsulated in link-layer frames that are transmitted over
TC-488 TELECOMMUNICATION MANAGEMENT NETWORKS____________________________ NED University Of Engineering & Technology, Department of Electronic Engineering
10
physical media such as an Ethernet cable. In Fig. the assumed physical media is an Ethernet, and so all upper layer protocols’ headers are eventually encapsulated within an Ethernet frame. Capturing all link-layer frames thus gives you all messages sent from or received by all protocols and applications executing in your computer. The second component is the packet analyzer, which displays the contents of all fields within a link-layer frame. In order to do so, the packet analyzer must understand the structure of messages exchanged by the protocols. For example, we are interested in displaying the various fields in messages exchanged by the HTTP protocol in Fig. 2.1. The packet analyzer understands the format of Ethernet frames, and so it can identify the IP datagram within an Ethernet frame. It also understands the IP datagram format, so it can extract the TCP segment within the IP datagram. It understands the TCP segment structure, so it can extract the HTTP message contained in the TCP segment. Finally, it understands the HTTP protocol and so, for example, knows that an HTTP message may contain the string of “GET”, “POST” or “HEAD”. Layered Protocol Two reference models are used to describe the network architecture, the OSI/ISO reference model and the TCP/IP reference model. The OSI/ISO model divides the network into seven layers and the TCP/IP model divides the network into four layers. No matter which model is used, the basic principle of the layered architecture is that each layer performs some services for the layer above it. Procedure: Installation WireShark is free to download at http://www.wireshark.org/. How to build and install WireShark onto machines first consult the Wireshark User's Guide, the Wireshark Developers Guide and the various README files provided with Wireshark. Starting WireShark When you run WireShark, you will see the graphical user interface (GUI) as shown in Fig. 2.2. There are four main fields: _ Filter field: Used to filter out uninteresting packets with the entered specifications, so you can choose which packets should (not) be shown on the screen; _ Captured packets: Lists the packets captured by the selected interface; _ Details of selected packet: Lists information about the packet that is selected in the captured packets window; _ Content of packet in hex/ASCII: Displays the content of the captured packet, in hex and ASCII.
TC-488 TELECOMMUNICATION MANAGEMENT NETWORKS____________________________ NED University Of Engineering & Technology, Department of Electronic Engineering
11
Figure 2.2: WireShark graphical user interface
Capture Trace Use the following procedure to capture the trace. _ Pick a URL and fetch it by wget. For example, open a console, type “wget http://www.google.com.pk”, you will obtain the fetched resource written in a file. _ Close web browser. By minimizing browser activity you will stop your computer from fetching unnecessary web content, and avoid incidental traffic in the trace. _ Launch Wireshark. Choose the network interface that we would like to capture the packets on. To do this, select “Capture ) Options” from the command menu. A window similar to the one shown in Fig. 2.4 should pop up. Select the interface you are using. Uncheck “Capture packets in promiscuous mode”.
TC-488 TELECOMMUNICATION MANAGEMENT NETWORKS____________________________ NED University Of Engineering & Technology, Department of Electronic Engineering
12
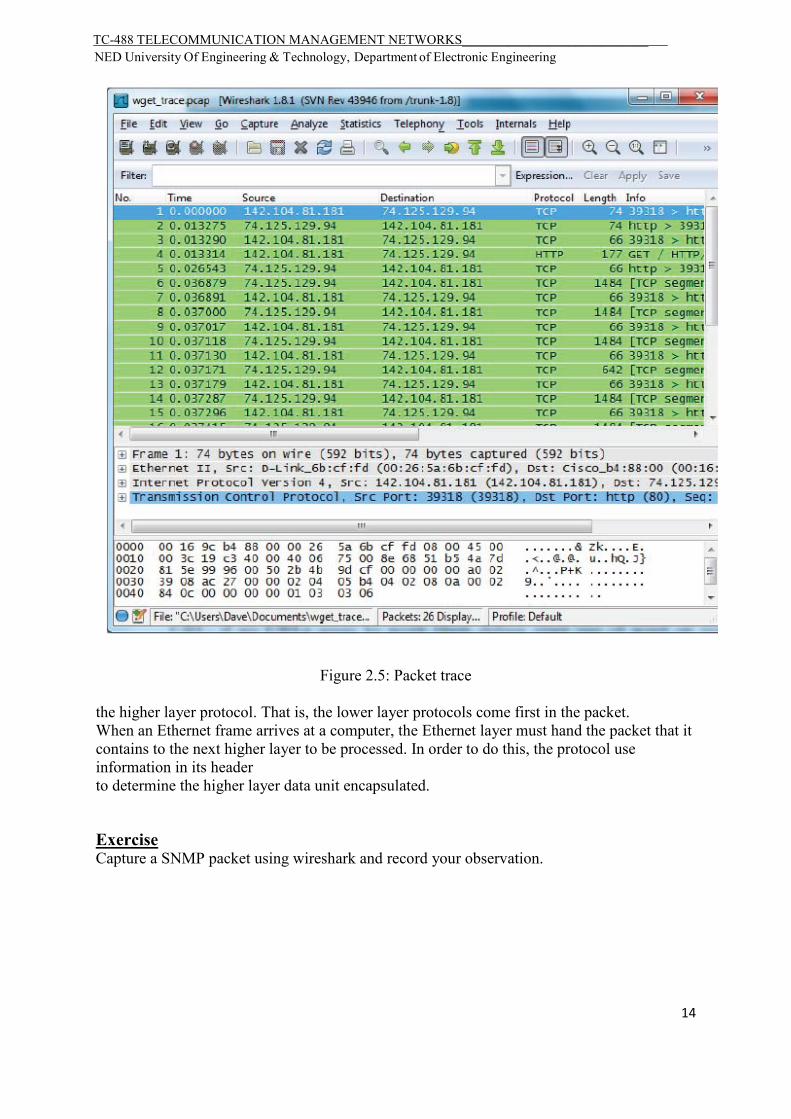
Figure 2.3: Wget URL This mode is useful to overhear packets sent to/from other computers on broadcast networks. We only want to record packets sent to/from your computer. Use capture filter “tcp port 80”. This filter will record only standard web traffic and not other kinds of packets that your computer may send. Click “Start” to start the packet capture process. _ When the capture is started, repeat the web fetch using wget above.This time, the packets will be recorded by Wireshark as the content is transferred. _ After the fetch is successful, return to Wireshark and use the menus or buttons to stop the trace (“Capture ) Stop”). If you have succeeded, the upper Wireshark window will show multiple packets. How many packets being captured will depend on the size of the web page. An example is shown in Fig. 2.5.
Layered Protocol By inspecting the captured trace, or the provided trace (lab2-wget-trace.pacp) to understand the layered protocol.
TC-488 TELECOMMUNICATION MANAGEMENT NETWORKS____________________________ NED University Of Engineering & Technology, Department of Electronic Engineering
13
Figure 2.4: Capture options window Select an HTTP GET packet. This packet carries the HTTP request sent from your computer to the server. _ HTTP is the application layer web protocol used to fetch URLs. It runs on top of the TCP/IP transport and network layer protocols. The link layer protocol shown in the figure is Ethernet. It may be other protocol, depends on your network. _ Click on one HTTP packet, and turn to the middle panel with details of the packet. The first block is “Frame”. This is a record that describes overall information about the packet, including when it was captured and how many bits long it is. The second block is “Ethernet” (You may have taken trace in a computer with 802.11, but still you will see an Ethernet block. This is because Wireshark capture traffic in Ethernet format determined on the capture options. See Link-layer header type.). Then we can see IP, TCP, and HTTP. This is a bottom-up order, because as packets are passed down the protocol stack, the header of the lower layer protocol is added to the front of the information from
TC-488 TELECOMMUNICATION MANAGEMENT NETWORKS____________________________ NED University Of Engineering & Technology, Department of Electronic Engineering
14
Figure 2.5: Packet trace the higher layer protocol. That is, the lower layer protocols come first in the packet. When an Ethernet frame arrives at a computer, the Ethernet layer must hand the packet that it contains to the next higher layer to be processed. In order to do this, the protocol use information in its header to determine the higher layer data unit encapsulated.
Exercise Capture a SNMP packet using wireshark and record your observation.
TC-488 TELECOMMUNICATION MANAGEMENT NETWORKS____________________________ NED University Of Engineering & Technology, Department of Electronic Engineering
15
LAB SESSION 3
Objective: (a) To study the concept of a Network Monitoring System (NMS). (b) To study a SNMP based NMS and observe communication between a managed element (CISCO 2950 Catalyst Switch) and NMS system. Background Theory:
Short for Network Management System, NMS is a computer that has been setup to monitor and/or manage a Data/voice network and the devices contained in that network. Network management refers to the activities, methods, procedures, and tools that pertain to the operation, administration, maintenance, and provisioning of networked systems. Operation deals with keeping the network (and the services that the network provides) up and running smoothly. It includes monitoring the network to spot problems as soon as possible, ideally before users are affected. Administration deals with keeping track of resources in the network and how they are assigned. It includes all the "housekeeping" that is necessary to keep the network under control. Maintenance is concerned with performing repairs and upgrades—for example, when equipment must be replaced, when a router needs a patch for an operating system image, when a new switch is added to a network. Maintenance also involves corrective and preventive measures to make the managed network run "better", such as adjusting device configuration parameters. Provisioning is concerned with configuring resources in the network to support a given service. For example, this might include setting up the network so that a new customer can receive voice service. NMS implementation using SNMP
Simple Network Management Protocol (SNMP) is a UDP-based network protocol. It is used mostly in network management systems to monitor network-attached devices for conditions that warrant administrative attention. SNMP is a component of the Internet Protocol Suite as defined by the IETF. It consists of a set of standards for network management, including an application layer protocol, a database schema, and a set of data objects. SNMP exposes management data in the form of variables on the managed systems, which describe the system configuration. These variables can then be queried (and sometimes set) by managing applications. In typical SNMP use, one or more administrative computers have the task of monitoring or managing a group of hosts or devices on a computer network. Each managed system (also called Slave) executes, at all times, a software component called an agent (see below) which reports information via SNMP to the managing systems (also called Masters). Essentially, SNMP agents expose management data on the managed systems as variables (such as "free memory", "system name", "number of running processes", "default route"). But the protocol also permits active management tasks, such as modifying and applying a new configuration. The managing system can retrieve the information through the GET, GETNEXT and GETBULK protocol operations or the agent will send data without being asked using TRAP or INFORM protocol operations. Management systems can also send configuration updates or controlling requests through the SET protocol operation to actively manage a system. Configuration and control operations are used only when changes are
TC-488 TELECOMMUNICATION MANAGEMENT NETWORKS____________________________ NED University Of Engineering & Technology, Department of Electronic Engineering
16
needed to the network infrastructure. The monitoring operations are usually performed on a regular basis. The variables accessible via SNMP are organized in hierarchies. These hierarchies such as type and description of the variable are described by Management Information Bases (MIBs). Typically, SNMP uses UDP ports 161 for the agent and 162 for the manager. The manager may send requests from any available source port to port 161 in the agent. The agent response will be sent back to the source port. The manager typically receives notifications on port 162. The agent may generate notifications from any available port.
Lab Scenario: We have a very simple network comprising of following components ; A CISCO 2950 CATALYST Switch configured for SNMP A PC loaded with IReasoning MIB Browser. We have simple Ethernet connectivity between the two elements with following IPs assigned ; 192.168.21.116 assigned to PC 192.168.21.117 assigned on VLAN1 in Cisco 2950 Switch. Procedure: Open the IReasoning MIB Browser on the PC. It should load as shown below ;
Ensure that RFC-1213 MIB file is loaded in the left pane.Also go to ‘Advanced ‘ Option and ensure that the SNMP v1 is selected , the Port No is 161 and the community name is ‘public’. Now go to the CISCO Switch 2950 prompt using Hyper Terminal and type following commands to configure SNMP on the Switch ;
TC-488 TELECOMMUNICATION MANAGEMENT NETWORKS____________________________ NED University Of Engineering & Technology, Department of Electronic Engineering
17
Switch(config)#snmp-server enable
Switch(config)#snmp-server enable informs
Switch(config)#snmp-server community public
Now go back to Ireasoning MIB Browser and go to RFC-1213 Interfacesi
pane and right click on it and then select the option Table View.You will get the following view ;
Exercise: Observe the different parameters of the managed element being shown in this Table and write your comments in the result section. Result:
TC-488 TELECOMMUNICATION MANAGEMENT NETWORKS____________________________ NED University Of Engineering & Technology, Department of Electronic Engineering
18
LAB SESSION 4
Objective: To study the MIB File structure based on RFC-1155 SMI and RFC 1212.
Introduction
The MIB are files describing the objects used by the SNMP protocol. The MIB term stands for Management Information Base because the structure of it is quite similar to a database description. This is a text file following the ASN1 standard. The RFC 1155 defines writing rules of the MIB file in SMI V1 and the RFC 1213 contains the object definition that should be implimented in an agent. MIB are organized in hierarchy that looks like a tree. The structure of this tree follows standard defined by RFC (Request For Comments). Currently there are two versions, the SMI V1 and the V2.
The MIB tree representation in any MIB Compiler like LoriotPro with snmp object name and mib file name.
SNMP Versions and Definitive Documents
TC-488 TELECOMMUNICATION MANAGEMENT NETWORKS____________________________ NED University Of Engineering & Technology, Department of Electronic Engineering
19
SNMP is defined by IETF (http://www.ietf.org ) through a group of RFCs shown below. rfc1155 : Structure and Identification of Management Information for TCP/IP based internets rfc1156 : Management Information Base Network rfc1157 : A Simple Network Management Protocol rfc1441 : Introduction to SNMP v2 rfc2579 : Textual Conventions for SNMP v2 rfc2580 : Conformance Statements for SNMP v2 rfc2578 : Structure of Management Information for SNMP v2 rfc3416 : Protocol Operations for SNMP v2 rfc3417 : Transport Mappings for SNMP v2 rfc3418 : Management Information Base for SNMP v2 rfc3410 : Introduction and Applicability Statements for Internet Standard Management Framework rfc3411 : Architecture for Describing SNMP Frameworks rfc3412 : Message Processing and Dispatching for the SNMP rfc3413 : SNMP Applications rfc3414 : User-based Security Model (USM) for SNMP v3 rfc3415 : View-based Access Control Model for the SNMP rfc3584 : Coexistence between SNMP v1, v2 and v3
Proprietary MIB
The proprietary MIB are attached to the private branch in the MIB tree and are defined and registered by each constructor. Each constructor should ask for an enterprise number allowing him to insert his MIB entries in the global tree.
LoriotPro owns the 7291 number and then has its proper MIB file.
TC-488 TELECOMMUNICATION MANAGEMENT NETWORKS____________________________ NED University Of Engineering & Technology, Department of Electronic Engineering
20
The SMI V2 norm defines in the RFC 1902 modifies the syntax of the object definition field.
Example : SysName objet definition in SMI V1
sysName OBJECT-TYPE SYNTAX DisplayString (SIZE (0..255)) ACCESS read-write STATUS mandatory DESCRIPTION "An administratively-assigned name for this managed node. By convention, this is the node's fully-qualified domain name." ::= { system 5 }
The Sysname object is attached to the upper tree object System with index number 5. By taking each consecutive object definition, it is possible to walk the tree up to the root. The definitions of SNMP objects that are nodes in the tree representation use the keyword OBJECT IDENTIFIER and not OBJECT-TYPE like leaf objects.
system OBJECT IDENTIFIER ::= { mib-2 1 } The system object is linked to the mib-2 object with index 1 mib-2 OBJECT IDENTIFIER ::= { mgmt 1 } The mib-2 object is linked to the mgmt object with index 1 mgmt OBJECT IDENTIFIER ::= { internet 2 } The mgmt object is linked to the internet object with index 2 internet OBJECT IDENTIFIER ::= { dod 1 } The internet object is linked to the dod object with index 1 dod OBJECT IDENTIFIER ::= { org 6 }
TC-488 TELECOMMUNICATION MANAGEMENT NETWORKS____________________________ NED University Of Engineering & Technology, Department of Electronic Engineering
21
The dod object is linked to the org object with index 6 org OBJECT IDENTIFIER ::= { iso 3 } The org object is linked to the iso object with index 3
This gives in the numerical format: 1.3.6.1.2.1.1.5.0
Exercise: You are required to design your own MIB file for a customized information model and place it as a group in at suitable location in the MIT. Your MIB file should be successfully loaded with MIB Browser. Attach the screen shot of the loaded MIB file in IReasoning Mib Browser.
TC-488 TELECOMMUNICATION MANAGEMENT NETWORKS____________________________ NED University Of Engineering & Technology, Department of Electronic Engineering
22
LAB SESSION 5
Objective: To design a SNMP based managed network in Packet Tracer 5.3 using SNMPv2c and RW and Read only communities.
Theory: Covered in class theory.Stduents should consult class lectures for any reference needed.
Procedure: Design the following network in the packet Tracer 5.3 and assign names as shown below.
The medway-ME router is configured to serve an SNMP community medway-public for read-only access, and medway-private for read-write access. Using SNMP it is possible to retrieve and set various configuration options. Test SNMP Requests from medway-ME router
1. Start the MIB browser from the desktop on MIB_Browser PC. Click the Advanced button and use the following details: Address: 10.0.0.1 Port: 161 Read Community: medway-public Write Community: medway-private SNMP Version: v3
Select OK
2. Suppose we wanted to view the IOS version on the medway-ME router, we need to select this parameter from the MIB options.
Expand the MIB tree on the left side of the application to select the node with the name:
3. Ensure that Get is selected in the Operations field of the MIB browser. Press the GO button to retrieve the value from the device.
TC-488 TELECOMMUNICATION MANAGEMENT NETWORKS____________________________ NED University Of Engineering & Technology, Department of Electronic Engineering
23
Which version of IOS is running? Verify this directly on the router via the CLI - type show version at the priv exec prompt.
Ensure that Get Bulk is selected in the Operations field of the MIB browser. Press the GO button to retrieve the values from the device.
TC-488 TELECOMMUNICATION MANAGEMENT NETWORKS____________________________ NED University Of Engineering & Technology, Department of Electronic Engineering
24
Note that now you have received all of the data held under the interfaces branch of the MIB tree.
How many interfaces are there? Which of the three interfaces is administratively down?
Accessing other devices
Now click the Advanced button and use the following details: Address: 10.2.0.1 Port: 161 Read Community: medway-public Write Community: medway-private SNMP Version: v3
Select OK
You can now access the nelson-south router.
11. Access the .sysLocation node and give this an appropriate value. Remember to use the OctetString for the Type.
12. Access the .sysContact node and give this an appropriate value. Remember to use the OctetString for the Type.
13. How many interfaces does this router have in its MIB table under Tree.router_std MIBs.iso.org.dod.internet.mgmt.mib-2.interfaces
Check the exchange of PDUs via the Simulation tab on Packet Tracer. View the contents of a request PDU and a Response PDU.
Lab Exercise: Design your own network like above in packet tracer 5 and repeat the above steps.
TC-488 TELECOMMUNICATION MANAGEMENT NETWORKS____________________________ NED University Of Engineering & Technology, Department of Electronic Engineering
25
LAB SESSION 6
Objective: To learn the packet format of SNMP GET REQUEST, SET REQUEST and GET RESPONSE PDUs using WIRESHARK in a managed network.
Understanding SNMP Packets and PDU: During this lab session, student will learn using two types of softwares i.e. IReasoning Mib Browser and Wireshark by Ethereal. IReasoning Mib Browser is one of the network management software to that you have used in previous lab sessions too while Ethereal software is a packet sniffer using which you can capture any packet transmitted during this experiment. Student will use both concurrently to gain maximum information. Here is overview on ethereal software. Ethereal is Open Source software released under the GNU General Public License. Ethereal is still technically beta software, but it has a comprehensive feature set and is suitable for production use. Here is the list of features, current as of version 0.9.14, in no particular order:
• Data can be captured "off the wire" from a live network connection, or read from a capture file.
• Ethereal can read capture files from tcpdump (libpcap), NAI's Sniffer™ (compressed and uncompressed), Sniffer™ Pro, NetXray™, Sun snoop and atmsnoop, Shomiti/Finisar Surveyor, AIX's iptrace, Microsoft's Network Monitor, Novell's LANalyzer, RADCOM's WAN/LAN Analyzer.
• Live data can be read from Ethernet, FDDI, PPP, Token-Ring, IEEE 802.11, Classical IP over ATM, and loopback interfaces (at least on some platforms; not all of those types are supported on all platforms).
• Captured network data can be browsed via a GUI, or via the TTY-mode "tethereal" program.
• Capture files can be programmatically edited or converted via command-line switches to the "editcap" program.
• 530 protocols can currently be dissected: 3GPP2 A11, 802.11 MGT, 802.11 Radiotap, AAL1, AAL3/4, AARP, ACAP, ACSE, AFP, AFS (RX), AH, AIM, AIM Administration, AIM Advertisements, AIM BOS, AIM Buddylist, AIM Chat, AIM ChatNav, AIM, & SNMP to name a few.
Ethereal can be downloaded from: http://www.ethereal.com/download.html Equipments Required : 1. Two unit of workstations connected to each other.
2. One unit of Switch.
3. One unit of Switch console cable.
4. One unit of Ireasoning MIB Browser.
TC-488 TELECOMMUNICATION MANAGEMENT NETWORKS____________________________ NED University Of Engineering & Technology, Department of Electronic Engineering
26
5. One unit of Wireshark by Ethereal software. Running Analyzer and Ethereal 1. Open your MIB BROWSER.
2. Connect to any SNMP client that you know in the network (e.g. 10.1.65.254, 10.1.65.253 & 10.1.65.252)
3. Start your packet capture using Ethereal .Apply display filter for SNMP packets only.
4. Use you analyzer the normal way to initiate a GET REQUEST & SET REQUEST PDU using your name as community string.
5. After a few minutes, stop your Ethereal and analyze the packet.
6. Using your data and the topic discusses in the lecture, verify the format of packets captured with the standard format of SNMP packets as shown below.
Exercise:
1) Attach screenshots of the captured packets in expanded form. 2) Write down the values of the captured packets in the above shown format. 3) Find the community string and the var-binding in the following SNMP packet.
TC-488 TELECOMMUNICATION MANAGEMENT NETWORKS____________________________ NED University Of Engineering & Technology, Department of Electronic Engineering
27
LAB SESSION 7
Objective: To learn the packet format of a SNMPv1 and v2 TRAP PDUs using WIRESHARK and Trap Receiver in a managed network.
Background Theory: SNMP traps enable an agent to notify the management station of significant events by way of an unsolicited SNMP message. It is an asynchronous notification from agent to manager. Includes current sysUpTime value, an OID identifying the type of trap and optional variable bindings. Destination addressing for traps is determined in an application-specific manner typically through trap configuration variables in the MIB. The format of the trap message was changed in SNMPv2 and the PDU was renamed SNMPv2-Trap.
In this diagram, the setup on the left shows a network management system that polls information and gets a response. The setup on the right shows an agent that sends an unsolicited or asynchronous trap to the network management system (NMS).
Lab setup : We will be using Cisco 2950 switch as a manged element with trap manager configured in it.For receiving the traps we will be using Ireasoning MIB Browser.
Procedure:
Configuring Trap Manager and Enabling Traps
A trap manager is a management station that receives and processes traps. Traps are system alerts that the switch generates when certain events occur. By default, no trap manager is defined, and no traps are issued.
Switches running this IOS release can have an unlimited number of trap managers. Community strings can be any length.
Table 22-3 describes the supported switch traps (notification types). You can enable any or all of these traps and configure a trap manager to receive them.
TC-488 TELECOMMUNICATION MANAGEMENT NETWORKS____________________________ NED University Of Engineering & Technology, Department of Electronic Engineering
28
c2900 Generates a trap for Catalyst 2950-specific notifications.
cluster Generates a trap when the cluster configuration changes.
config Generates a trap for SNMP configuration changes.
entity Generates a trap for SNMP entity changes.
HSRP Generates a trap for Hot Standby Router Protocol (HSRP) changes.
MAC notification Generates a trap for MAC address notifications.
RTR Generates a trap for the SNMP Response Time Reporter (RTR).
SNMP Generates a trap for SNMP-type notifications.
syslog Generates a trap for SNMP syslog notifications.
UDP-port Sends notification of the User Datagram Protocol (UDP) port number of the host.
vlan-membership Generates a trap for SNMP VLAN membership changes.
VTP Generates a trap for VLAN Trunking Protocol (VTP) changes.
Beginning in privileged EXEC mode, follow these steps to configure the switch to send traps to a host:
Command Purpose
Step 1 configure terminal Enter global configuration mode.
•For host-addr, specify the name or address of the host (the targeted recipient).
•Specify traps (the default) to send SNMP traps to the host. Specify informs to send SNMP informs to the host.
•Specify the SNMP version to support. Version 1, the default, is not available with informs.
Note Though visible in the command-line help string, the version 3 keyword (SNMPv3) is not supported.
•For community-string, specify the string to send with the
TC-488 TELECOMMUNICATION MANAGEMENT NETWORKS____________________________ NED University Of Engineering & Technology, Department of Electronic Engineering
29
notification operation. Though you can set this string using the snmp-server host command, we recommend that you define this string by using the snmp-server community command before using the snmp-server host command.
•For notification-type, use the keywords listed in Table 22-3.
Enable the switch to send specific traps. For a list of traps, see Table 22-3.
To enable multiple types of traps, you must issue a separate snmp-server enable traps command for each trap type.
Step 4 end Return to privileged EXEC mode.
Step 5 show running-config Verify your entries.
Step 6 copy running-config startup-config
(Optional) Save your entries in the configuration file.
To remove the specified host from receiving traps, use the no snmp-server host host global configuration command. To disable a specific trap type, use the no snmp-server enable traps notification-types global configuration command.
TRAP RECIEVER: Start TRAP Receiver to receive the configured both SNMPv2 and SNMPv1 Traps as shown below,
TC-488 TELECOMMUNICATION MANAGEMENT NETWORKS____________________________ NED University Of Engineering & Technology, Department of Electronic Engineering
30
TC-488 TELECOMMUNICATION MANAGEMENT NETWORKS____________________________ NED University Of Engineering & Technology, Department of Electronic Engineering
31
Exercise: Explain the highlighted traps in your own word? What information they convey and how it is interpreted by the managed element?
TC-488 TELECOMMUNICATION MANAGEMENT NETWORKS____________________________ NED University Of Engineering & Technology, Department of Electronic Engineering
32
LAB SESSION 8
Objective: (a) TO learn SNMPv3 packet formats using noAuthnoPrivacy, authnoPrivacy and authPrivacy modes.
(b) To understand VACM based access Control mechanism.
Background Theory:
Simple Network Management Protocol Version 3 (SNMPv3) is an interoperable standards-based protocol for network management. SNMPv3 provides secure access to devices by a combination of authenticating and encrypting packets over the network. The security features provided in SNMPv3 are:
• Message integrity—Ensuring that a packet has not been tampered with in-transit. • Authentication—Determining the message is from a valid source. • Encryption—Scrambling the contents of a packet prevent it from being seen by an
unauthorized source. SNMPv3 provides for both security models and security levels. A security model is an authentication strategy that is set up for a user and the group in which the user resides. A security level is the permitted level of security within a security model. A combination of a security model and a security level will determine which security mechanism is employed when handling an SNMP packet. Three security models are available: SNMPv1, SNMPv2c, and SNMPv3. Table 1 identifies what the combinations of security models and levels mean:
Table 1 SNMP Security Models and Levels
Model Level Authentication Encryption What Happens
v1 noAuthNoPriv Community String
No Uses a community string match for authentication.
v2c noAuthNoPriv Community String
No Uses a community string match for authentication.
v3 noAuthNoPriv Username No Uses a username match for authentication.
v3 authNoPriv MD5 or SHA No Provides authentication based on the HMAC-MD5 or HMAC-SHA algorithms.
v3 authPriv MD5 or SHA DES Provides authentication
TC-488 TELECOMMUNICATION MANAGEMENT NETWORKS____________________________ NED University Of Engineering & Technology, Department of Electronic Engineering
33
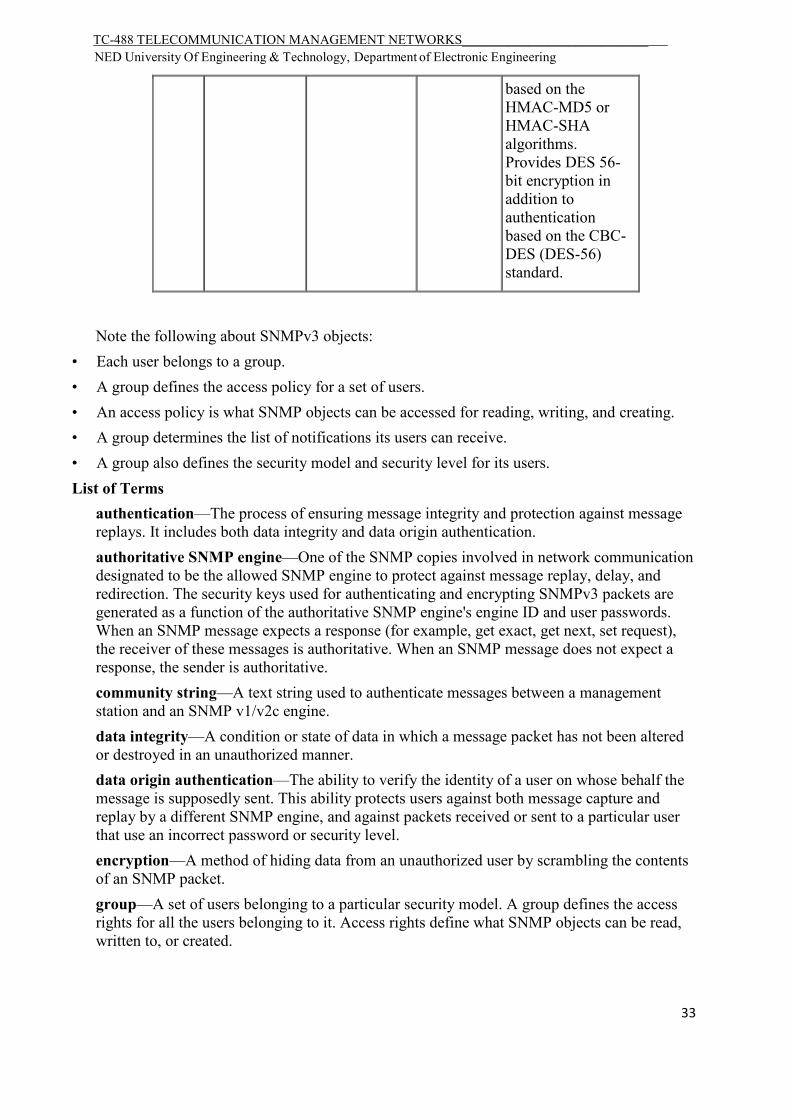
based on the HMAC-MD5 or HMAC-SHA algorithms. Provides DES 56-bit encryption in addition to authentication based on the CBC-DES (DES-56) standard.
Note the following about SNMPv3 objects: • Each user belongs to a group. • A group defines the access policy for a set of users. • An access policy is what SNMP objects can be accessed for reading, writing, and creating. • A group determines the list of notifications its users can receive. • A group also defines the security model and security level for its users. List of Terms
authentication—The process of ensuring message integrity and protection against message replays. It includes both data integrity and data origin authentication. authoritative SNMP engine—One of the SNMP copies involved in network communication designated to be the allowed SNMP engine to protect against message replay, delay, and redirection. The security keys used for authenticating and encrypting SNMPv3 packets are generated as a function of the authoritative SNMP engine's engine ID and user passwords. When an SNMP message expects a response (for example, get exact, get next, set request), the receiver of these messages is authoritative. When an SNMP message does not expect a response, the sender is authoritative. community string—A text string used to authenticate messages between a management station and an SNMP v1/v2c engine. data integrity—A condition or state of data in which a message packet has not been altered or destroyed in an unauthorized manner. data origin authentication—The ability to verify the identity of a user on whose behalf the message is supposedly sent. This ability protects users against both message capture and replay by a different SNMP engine, and against packets received or sent to a particular user that use an incorrect password or security level. encryption—A method of hiding data from an unauthorized user by scrambling the contents of an SNMP packet. group—A set of users belonging to a particular security model. A group defines the access rights for all the users belonging to it. Access rights define what SNMP objects can be read, written to, or created.
TC-488 TELECOMMUNICATION MANAGEMENT NETWORKS____________________________ NED University Of Engineering & Technology, Department of Electronic Engineering
34
privacy—An encrypted state of the contents of an SNMP packet where they are prevented from being disclosed on a network. Encryption is performed with an algorithm called (DES-56). read view—A view name (not to exceed 64 characters) for each group that defines the list of object identifiers (OIDs) that are accessible for reading by users belonging to the group. security level—A type of security algorithm performed on each SNMP packet. The three levels are: noauth, auth, and priv. noauth authenticates a packet by a string match of the user name. auth authenticates a packet by using either the HMAC MD5 or SHA algorithms. priv authenticates a packet by using either the HMAC MD5 or SHA algorithms and encrypts the packet using the CBC-DES (DES-56) algorithm. security model—The security strategy used by the SNMP agent. Currently, Cisco IOS supports three security models: SNMPv1, SNMPv2c, and SNMPv3. Simple Network Management Protocol (SNMP)—A network management protocol that provides a means to monitor and control network devices, and to manage configurations, statistics collection, performance, and security. SNMP engine—A copy of SNMP that can either reside on the local or remote device. SNMP group—A collection of SNMP users that belong to a common SNMP list that defines an access policy, in which object identification numbers (OIDs) are both read-accessible and write-accessible. SNMP user—A person for which an SNMP management operation is performed. For informs, the user is the person on a remote SNMP engine who receives the informs. SNMP view—A mapping between SNMP objects and the access rights available for those objects. An object can have different access rights in each view write view—A view name (not to exceed 64 characters) for each group that defines the list of object identifiers (OIDs) that are able to be created or modified by users of the group. Procedure:
Run the following commands on cisco switch to create a view, group and a snmpv3 user with authNoPriv ;
1) snmp-server view view1 mibdomain included
2) snmp-server group NED v3 auth read view1 write view1
3) snmp-server user Rizwan NED v3 auth md5/sh1 xxxxxxx
Now write following query to send snmpv3 get packet using snmpv3 on the linux terminal;
You should get the output like this : Iso.3.6.1.2.1.1.3.0 = Timeticks: (197304) 0:32:53.04
TC-488 TELECOMMUNICATION MANAGEMENT NETWORKS____________________________ NED University Of Engineering & Technology, Department of Electronic Engineering
35
Exercise: consider the following Wireshark capture of snmpv3 query above and answer the
following questions.
1) Explain the purpose of report pdu.
2) Which fields in the expanded pdu are used in providing the authentication service ? What are their values?
TC-488 TELECOMMUNICATION MANAGEMENT NETWORKS____________________________ NED University Of Engineering & Technology, Department of Electronic Engineering
36
LAB SESSION 9
Objective: (a) To understand Remote Monitoring (RMON) concept.
(b) Understand configuration of ALARM and Event Groups and configure an Alarm and map it to a Logs/TRAPS Event using a cisco 2950 switch.
Background Theory : RMON (Remote Network Monitoring) provides standard information that a network administrator can use to monitor, analyze, and troubleshoot a group of distributed local area networks (LANs) and interconnecting T-1/E-1 and T-2/E-3 lines from a central site. RMON specifically defines the information that any network monitoring system will be able to provide. It's specified as part of the Management Information Base (MIB) in Request for Comments 1757 as an extension of the Simple Network Management Protocol (SNMP). The latest level is RMON Version 2.
Procedure : We will configure an Event and an Alarm on cisco 2950 switch using following procedure and syntax ,
1. event—Configure an RMON event. 2. eventIndex— Event number (1–65535) 3. log—(Optional) Generate an RMON log when the event fires. 4. trap eventCommunity —(Optional) Generate an SNMP trap when the event fires, for the
specified SNMP community string. 5. description eventDescription —(Optional) Specify a WORD or a description of the event. 6. owner eventOwner —(Optional) Specify an owner for the event.
• If you do not specify either the log or the trap option, the alarmTable object eventType (1.3.6.1.2.1.16.9.1.1.3) is set to none.
• If you only specify log, eventType is set to log. • If you only specify trap, the eventType is set to snmp-trap. • If you specify both log and trap, eventType is set to log-and-trap.
TC-488 TELECOMMUNICATION MANAGEMENT NETWORKS____________________________ NED University Of Engineering & Technology, Department of Electronic Engineering
37
6. delta—Test delta between samples. 7. rising-threshold—Configure the rising threshold. 8. alarmRisingThreshold—Rising threshold value (-2147483648–2147483647) 9. alarmRisingEventIndex—(optional) Event to fire when the rising threshold is crossed
(1–65535) 10. falling-threshold—Configure the falling threshold. 11. alarmFallingThreshold—Falling threshold value (-2147483648–2147483647) 12. alarmFallingEventIndex—(Optional) Event to fire when the falling threshold is
crossed (1–65535) 13. owner alarmOwner —(Optional) Specify an owner for the alarm (WORD).
The alarmVariable is specified one of these ways:
• As the entire dotted decimal Abstract Syntax Notation One (ASN.1) object identifier (OID) for the object (such as .1.3.6.1.2.1.2.2.1.10.1)
• With the table entry name followed by the table object number and the instance
For example, to specify ifInOctets for the first instance, use ifEntry.10.1 for the alarmVariable.
Examples
In the examples in this section, “public” is the Read-Only (RO) SNMP community string and 171.68.118.100 is the host that receives the trap.
In order to set up an event to send a trap when triggered, issue these commands:
!--- Enter these commands on one line each. rmon event 3 log trap public description "Event to create log entry and SNMP notification" owner "jdoe 171.68 118.100 2643" rmon alarm 2 ifEntry.10.12 30 delta rising-threshold 2400000 3 falling-threshold 1800000 3 owner "jdoe 71.68 118.100 2643"
In this example, a Cisco 2950 is configured to send a trap and to log an event, when the alarm threshold that monitors its own ifInOctets (ifEntry.10.1) exceeds an absolute value of 90000:
snmp-server host 171.68.118.100 public SNMP-server community public RO rmon event 1 log trap public description "High ifInOctets" owner butt
Trap Receiver: Open Trap Receiver and receive RMON Traps as shown below,
TC-488 TELECOMMUNICATION MANAGEMENT NETWORKS____________________________ NED University Of Engineering & Technology, Department of Electronic Engineering
38
Exercise:
1) Write in your own words the purpose of RMON you have understood
2) Which RMON groups do cisco 2950 switch supports? What is the use of each group in configuring RMON in the switch?
TC-488 TELECOMMUNICATION MANAGEMENT NETWORKS____________________________ NED University Of Engineering & Technology, Department of Electronic Engineering
39
LAB SESSION 10
Objective: Learn the concept of Performance management in a LAN environment using Multi Router Traffic Grapher (MRTG).
Background Theory
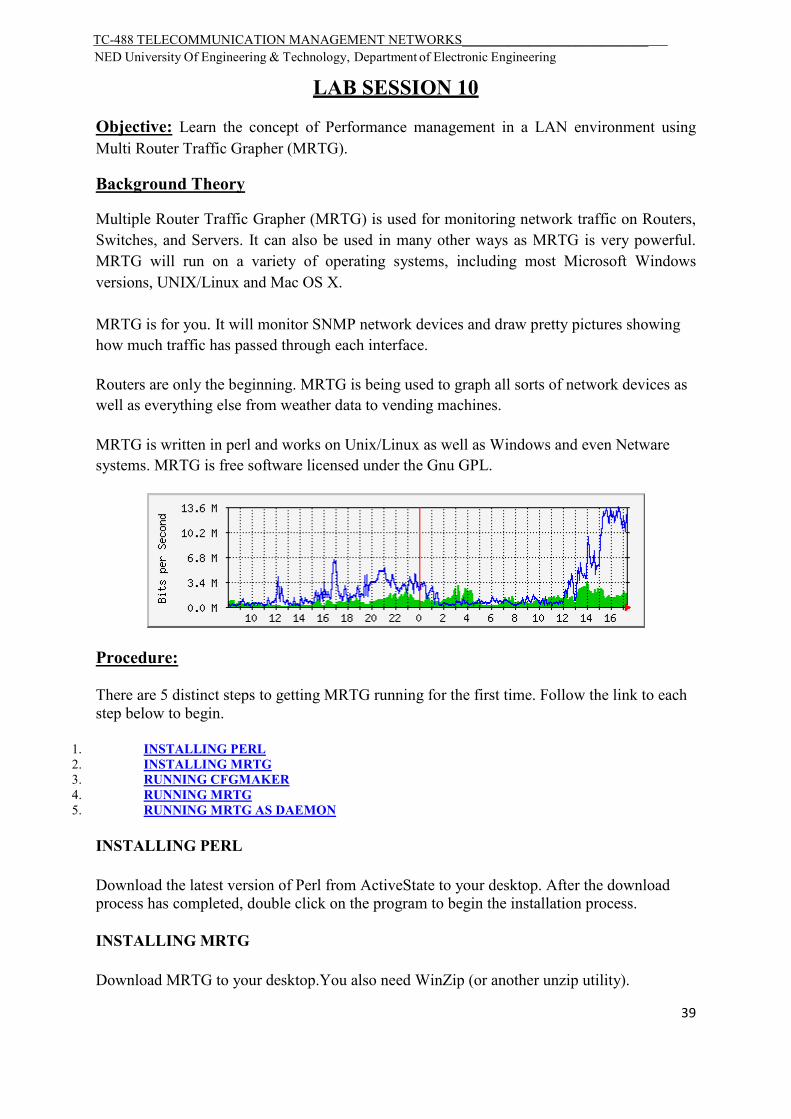
Multiple Router Traffic Grapher (MRTG) is used for monitoring network traffic on Routers, Switches, and Servers. It can also be used in many other ways as MRTG is very powerful. MRTG will run on a variety of operating systems, including most Microsoft Windows versions, UNIX/Linux and Mac OS X.
MRTG is for you. It will monitor SNMP network devices and draw pretty pictures showing how much traffic has passed through each interface.
Routers are only the beginning. MRTG is being used to graph all sorts of network devices as well as everything else from weather data to vending machines.
MRTG is written in perl and works on Unix/Linux as well as Windows and even Netware systems. MRTG is free software licensed under the Gnu GPL.
Procedure:
There are 5 distinct steps to getting MRTG running for the first time. Follow the link to each step below to begin.
Download the latest version of Perl from ActiveState to your desktop. After the download process has completed, double click on the program to begin the installation process.
INSTALLING MRTG
Download MRTG to your desktop.You also need WinZip (or another unzip utility).
TC-488 TELECOMMUNICATION MANAGEMENT NETWORKS____________________________ NED University Of Engineering & Technology, Department of Electronic Engineering
40
Double Click the MRTG icon to unzip the file.
Notice there is a default path (right) in the above screen. Choose the location to unzip MRTG and then choose Extract. After the extraction process completes, close WinZip. (This set up uses F:\.)
Navigate to the location you extracted MRTG to and notice the odd name on the folder. Right Click on the folder and select Rename. Change the name to mrtg.
Create a new folder called on the same drive called mrtghtml.
TC-488 TELECOMMUNICATION MANAGEMENT NETWORKS____________________________ NED University Of Engineering & Technology, Department of Electronic Engineering
41
You are now finished with the installation of MRTG.
The next step is to create a config file for the MRTG data you will collect. You can create this file with CFGMAKER.
RUNNING CFGMAKER
CFGMAKER is used to create a configuration text file for MRTG Data Collection. It is ran from a DOS Prompt. Before running CFGMAKER, download an install MRTG and Perl.
Go to DOS command and Navigate to the mrtg\bin directory.
This is the fun part! At this point, you must know the community string and IP address for the equipment you want to monitor. If you don't know, you most likely don't have any business monitoring it! In this document, I will use a Windows NT Server. It would work exactly the
TC-488 TELECOMMUNICATION MANAGEMENT NETWORKS____________________________ NED University Of Engineering & Technology, Department of Electronic Engineering
42
same for a router, bridge, or switch. The only difference would be the output file might include several interfaces (or ports) instead of just one. We will use the community string of public and an IP of 10.1.1.1. Substitute yours as appropriate. Also, we will name the cfg file server.cfg. Use a name that makes sense to you and your environment.
Type the following syntax on one line as follows. (DOS may automatically wrap the text which is acceptable.)
Hit Enter when finished. If you used the correct information, your output should look similar to the output below.
data. You have now created your first cfg file. For more config options also check Indexmaker. We can now move forward and start collecting
You could collect data sitting around all day and run MRTG manually from a command prompt. However, the simplest way to run MRTG is to run it as a daemon.
Navigate to the \mrtg\bin directory and find your cfg file. This example has used server.cfg. Open the file with Notepad.
Near the top of the file, type the following syntax:
TC-488 TELECOMMUNICATION MANAGEMENT NETWORKS____________________________ NED University Of Engineering & Technology, Department of Electronic Engineering
43
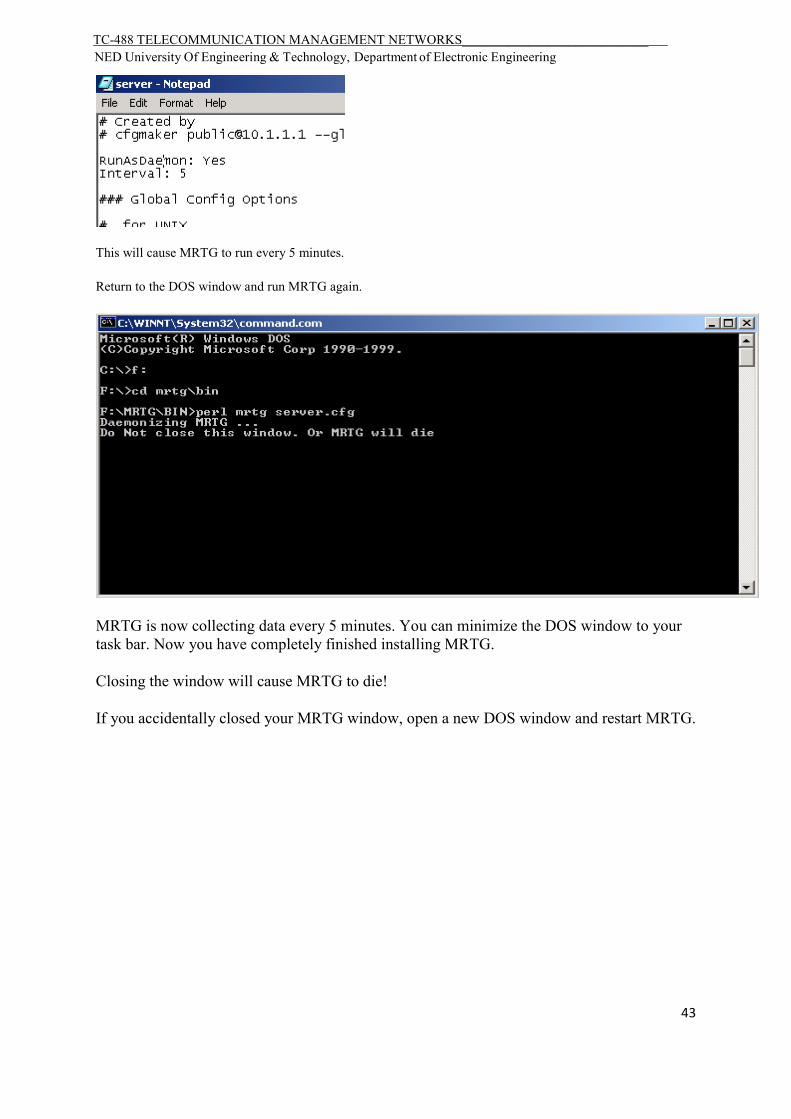
This will cause MRTG to run every 5 minutes.
Return to the DOS window and run MRTG again.
MRTG is now collecting data every 5 minutes. You can minimize the DOS window to your task bar. Now you have completely finished installing MRTG.
Closing the window will cause MRTG to die!
If you accidentally closed your MRTG window, open a new DOS window and restart MRTG.
TC-488 TELECOMMUNICATION MANAGEMENT NETWORKS____________________________ NED University Of Engineering & Technology, Department of Electronic Engineering
44
LAB SESSION 11
Objective: (a) Introduction to TCL programming. Learn installation of ActiveTCL in windows environment.
(b) Running a basic TCL script to learn the commands PUTS GET and SET with grouping and substitution concepts.
Background Theory: Tcl stands for Tool Command Language and is a string-based, interpreted command language. Its simplicity in syntax and common easy approach to semantics makes this an easy language to learn and become proficient in. It is widely using in Telecom and Network devices to automate the tasks. Many routers and servers have tcl scripting provision. It is also used as front end scripting language in Network Simulator.
Procedure(a): When you have installed Tcl, the program you will then call to utilize it is tclsh. For instance, if you write some code to a file "hello.tcl", and you want to execute it, you would do it like so: tclsh hello.tcl. Depending on the version of Tcl installed, and the operating system distribution you use, the tclsh program may be a link to the real executable, which may be named tclsh8.6 or tclsh86.exe on Microsoft Windows.
The tclsh is a simple command-line interactive interpreter. You can either start it with a script on the command line, in which case it runs the script to completion and then exits, or you can start it without any arguments, in which case you will be presented with an interactive prompt, usually using a % symbol to prompt for input. In interactive mode, you can type in commands, which Tcl will then execute and display the result, or any error messages that result. To exit the interpreter, type exit and press Return. Playing around with the interactive interpreter is a great way to learn how to use Tcl. Most Tcl commands will produce a helpful error message explaining how they are used if you just type in the command with no arguments. You can get a list of all the commands that your interpreter knows about by typing info commands.
Procedure(b): Go to tclsh prompt and type the following tcl commands one by one na drecord your observations in the observation section.
% a= gets stdout
invalid command name "a="
% set a [gets stdout]
channel "stdout" wasn't opened for reading
% gets stdout a
channel "stdout" wasn't opened for reading
% gets stdout a
wrong # args: should be "gets channelId ?varName?"
TC-488 TELECOMMUNICATION MANAGEMENT NETWORKS____________________________ NED University Of Engineering & Technology, Department of Electronic Engineering
45
% gets stdin a
gggg
4
% puts $a
gggg
% set a 5
% PUTS $a
5
% set a [gets stdin b]
% Puts “$a $b”
3 ggg
Similarly you can write your commands in a file in form of a script and run that file.To do so type tclsh filename.tcl on command prompt.
Exercise: Write you own program in tcl to take a number as input , multiply it by 5 and then print the result in a new line on the console.
TC-488 TELECOMMUNICATION MANAGEMENT NETWORKS____________________________ NED University Of Engineering & Technology, Department of Electronic Engineering
46
LAB SESSION 12
Objective: To learn Looping structures (while and for) in TCL Background Theory: Tcl supports a number of commands for looping, or executing the same command or set of commands multiple times. Two of them are while and for. While command creates a loop that executes as long as the test expression evaluates to a true value. When the test expression evaluates to false value, control exits the loop and continues with the command immediately following the while command. The for command creates an iterative loop, that is, a loop that executes a fixed number of times and then terminates (again, with control passing to the command immediately following the for command). Loops that use while are sometimes referred to as indeterminate loops because we don’t know how many times they will execute, only that they will (hopefully) eventually terminate when their test condition evaluates to false. The syntax of the while command is: while { test} { body} test is a Boolean expression. When the loop starts, test is evaluated; if it is true, the command or commands in body execute. Otherwise, body is skipped and execution resumes with the command immediately following the while command. After each pass through body, test is re-evaluated. If test is still true, body will execute; otherwise, the loop terminates and execution resumes with the command immediately following the while command. The for command enables you to execute one or more commands a fixed number of times, or iterations. Hence, for loops are often referred to as iterative loops. Its syntax is: for { start} { test} { next} { body} Procedure: Write the following script in a file named while.tcl and run that file using tclsh while.tcl on command prompt: set lineCnt 0 set charCnt 0 while {[gets stdin line] >= 0} { incr lineCnt incr charCnt [string length $line] } puts "Read $lineCnt lines" puts "Read $charCnt characters" This simple script reads input typed at the keyboard (or redirected from another file). Each time it encounters a newline, it increments the variable lineCnt by 1 and the variable
TC-488 TELECOMMUNICATION MANAGEMENT NETWORKS____________________________ NED University Of Engineering & Technology, Department of Electronic Engineering
47
charCnt by the number of characters in the line. When it encounters EOF (end-of-file), it drops out of the loop and displays the number of lines and number of characters read. $ ./while.tcl < while.tcl Read 13 lines Read 229 characters Recall that gets returns -1 when it reads EOF—that means that the test condition [gets std line] >= 0 will return evaluate to true as long as gets receives valid input. When gets sees EOF in the input stream, the test condition evaluates to false and the loop terminates. incr command increments(hence the name) the value of a variable. incr’s syntax is simple: incr var ? unit? By default, incr increments var, which must be an integer variable, by 1. If you specify unit, which must also be an integer value (or an expression that evaluates to an integer value, as in while.tcl). Again write a file named for.tcl and run it using tclsh for.tcl for {set i 1} {$i <= 10} {incr i} { puts "Loop counter: $i" } This script increments the value of a loop counter variable, i, and displays that value. • The start condition is set i 1. • The test condition is $i <= 10. • The next expression is incr i, which increments the value of i by 1 on each pass through the loop. • The body command is puts "Loop counter: $i". The body of the loop executes for each value of i that is less than or equal to 10. The runtime behavior should be unsurprising: $ ./for.tcl Loop counter: 1 Loop counter: 2 Loop counter: 3 Loop counter: 4 Loop counter: 5 Loop counter: 6 Loop counter: 7 Loop counter: 8 Loop counter: 9 Loop counter: 10 Exercise: Write a program each to demonstrate the use of while and for loops.
TC-488 TELECOMMUNICATION MANAGEMENT NETWORKS____________________________ NED University Of Engineering & Technology, Department of Electronic Engineering
48
LAB SESSION 13
Objective: To learn about the TCL Lists
Background Theory:
A Tcl list is nothing more than an ordered sequence of values(elements), separated by a space character. Elements that contain embedded white space need to be grouped using braces or quotes. Like strings, lists are accessed by their indices, which are 0-based. The most cogent example of Tcl lists is a Tcl command. In fact, Tcl lists have the same syntax as Tcl commands. A command is a list, the first element of which is the command itself, and the remaining elements of which are the arguments to that command. Not surprisingly, then, the same rules and considerations that apply to creating Tcl commands ( grouping and substitution) also apply to creating Tcl lists. The definition of a Tcl list as an ordered sequence of values doesn’t necessarily mean that lists are sorted. Rather, lists are ordered because list elements are accessed by their indices. Tcl lists also consist of potentially heterogeneous elements( mixed data types). Unlike arrays in traditional programming languages (like C), which consist of homogeneous elements. Tcl lists can contain integers, strings, characters, and even other lists. For example, {a b 893 "Some random string" {Z Y X W}} is a perfectly valid list consisting of five elements: the character a, the character b, the number 893, the string "Some random string", and the embedded list {Z Y X W}. Procedure: To create a list in Tcl, the most efficient way is to use the list command: list item1 [ item2] … The list command creates and returns a list which consists of the arguments item1, item2, and so forth. Each argument to list must be separated by whitespace. The following example shows how to create lists. $ tclsh % set faceCards [list Ace King Queen Jack] Ace King Queen Jack % set acesBySuit [list {Ace of Hearts} {Ace of Diamonds} {Ace of Spades} {Ace of Clubs}] {Ace of Hearts} {Ace of Diamonds} {Ace of Spades} {Ace of Clubs} In the first example, we assign faceCards a list consisting of four elements: Ace, King, Queen, and Jack. In the second example, we create another four-element list, acesBySuit. This time, though, because the elements contain spaces, we use braces to group the items that make up each element. If you need to add items to the end of an existing list, use the lappend command. Its syntax is: lappend listVar item1 … The first argument to lappend is the name of a list variable ( listVar ). The second and subsequent arguments are the items to append to the list.
TC-488 TELECOMMUNICATION MANAGEMENT NETWORKS____________________________ NED University Of Engineering & Technology, Department of Electronic Engineering
49
The concat command works much like lappend, except that it does not maintain the list structure of appended elements. In addition, concat strips leading and trailing spaces from each of its arguments before concatenating them together. The concat’s syntax is : concat ? item1 ...? concat’s return value is the concatenated list with one level of list structure removed. To see the difference between lappend and concat, consider the following code, concat.tcl, in this chapter’s code directory: set faceCards [list Ace King Queen Jack] set numberedCards [list 10 9 8 7 6 5 4 3 2] # lappend creates a list of two lists lappend suit $faceCards $numberedCards puts "$suit (length: [llength $suit])" # concat creates a singe list set suit [concat $faceCards $numberedCards] puts "$suit (length: [llength $suit])" You can see the difference in the resulting output: $ ./concat.tcl {Ace King Queen Jack} {10 9 8 7 6 5 4 3 2} (length: 2) Ace King Queen Jack 10 9 8 7 6 5 4 3 2 (length: 13) The lappend command creates a list that consists of two elements: the list of face cards and the list of numbered cards; the list structure of the parent lists has been preserved. The concat command returns a list that consists of 13 elements, having created a single list by splicing together the two constituent lists and removing a single (and, in this case, the only) level of list structure from the parent lists. If you need a simple list that contains all the elements of the parents, use concat. If you need to maintain list structure, use lappend. Exercise: Modify a list by inserting new elements into it. Hint: To insert one or more elements into a list at a specific location, use the linsert command. Its syntax is: linsert listVar index item ? item ...? This command inserts each new element (denoted by item) into the list specified by listVar immediately before the index specified by index. listVar itself is not modified. Rather, linsert returns a new list with the inserted values. If index is less than zero, the new elements will be inserted at the beginning of the list (at index 0); if greater than the number of elements in the list, the new elements will be appended to the end of the list.
TC-488 TELECOMMUNICATION MANAGEMENT NETWORKS____________________________ NED University Of Engineering & Technology, Department of Electronic Engineering
50
Lab Project
Task: Using Mib Browser inquire any one sub-group in the Mib Tree of a device. Also capture the packet transactions using Wireshark. Analyze the results obtained in the the above task.