Sara Elder and Koko Siaka Koné February 2014 Labour market transitions of young women and men in sub-Saharan Africa No. 9 Publication Series Youth Employment Programme Employment Policy Department LABOUR MARKET TRANSITIONS OF YOUNG WOMEN AND MEN IN SUB-SAHARAN AFRICA ILO
Transcript
Sara Elder and Koko Siaka Koné
February 2014
Labour market transitions of young women and men in sub-Saharan Africa
This report presents the results of the School-to-work transition surveys (SWTS) implemented in eight sub-Saharan African countries – Benin, Liberia, Madagascar, Malawi, the United Republic of Tanzania, Togo, Uganda and Zambia – in 2012 or 2013. The indicators resulting from the surveys and analysed in this report provide a detailed picture of the youth in the labour market in a part of the world where labour market information is sparse and sporadic. Results show that unemployment of young people remains a matter of concern, but that issues relating to the quality of work available to young people are of even greater relevance to the design and implementation of policy interventions. The report also draws attention to the path and length of the school-to-work transition for young people who are currently employed and draws some conclusions about the characteristics or experiences that can help to achieve a smoother transition.
The SWTSs are made available through the ILO “Work4Youth” (W4Y) Project. This Project is a five-year partnership between the ILO and The MasterCard Foundation that aims to promote decent work opportunities for young men and women through knowledge and action. The W4Y Publications Series covers national reports, with main survey findings and details on current national policy interventions in the area of youth employment, regional synthesis reports and thematic explorations of the 28 datasets from the target W4Y countries.
No. 9
For more information, visit our website: www.ilo.org/w4yYouth Employment Programme4 route des MorillonsCH-1211 Genève 22Switzerland [email protected]
Publication Series
Youth Employment ProgrammeEmployment Policy Department
LAB
OU
R MA
RKET TRA
NSITIO
NS O
F YOU
NG W
OM
EN A
ND M
EN IN
SUB
-SAH
ARA
N A
FRICAILO
ISSN 2309-6780
Work4Youth Publication Series No. 9
Labour market transitions of young women and men in sub-Saharan Africa
Publications of the International Labour Office enjoy copyright under Protocol 2 of the Universal Copyright Convention. Nevertheless, short excerpts from them may be reproduced without authorization, on condition that the source is indicated. For rights of reproduction or translation, application should be made to the Publications Bureau (Rights and Permissions), International Labour Office, CH–1211 Geneva 22, Switzerland, or by email: [email protected]. The International Labour Office welcomes such applications
Libraries, institutions and other users registered with reproduction rights organizations may make copies in accordance with the licences issued to them for this purpose. Visit www.ifrro.org to find the reproduction rights organization in your country.
ILO Cataloguing in Publication Data
Elder, Sara; Siaka Koné, Koko
Labour market transitions of young women and men in sub-Saharan Africa / Sara Elder and Koko Siaka Koné ; International Labour Office, Youth Employment Programme, Employment Policy Department.. – Geneva: ILO, 2014
Work4Youth publication series ; No.8; International Labour Office. Employment Policy Dept. transition from school to work / youth employment / youth unemployment/ women workers/ men workers / employment status / Africa south of Sahara 06.02 Cover design by: Creative Cow
ISSN 2309-6780 (printed version) ISSN 2309-6799 (web pdf )
The designations employed in ILO publications, which are in conformity with United Nations practice, and the presentation of material therein do not imply the expression of any opinion whatsoever on the part of the International Labour Office concerning the legal status of any country, area or territory or of its authorities, or concerning the delimitation of its frontiers.
The responsibility for opinions expressed in signed articles, studies and other contributions rests solely with their authors, and publication does not constitute an endorsement by the International Labour Office of the opinions expressed in them.
Reference to names of firms and commercial products and processes does not imply their endorsement by the International Labour Office, and any failure to mention a particular firm, commercial product or process is not a sign of disapproval.
ILO publications can be obtained through major booksellers or ILO local offices in many countries, or direct from ILO Publications, International Labour Office, CH–1211 Geneva 22, Switzerland. Catalogues or lists of new publications are available free of charge from the above address, or by email: [email protected]
Visit our website: www.ilo.org/publns
Printed by the International Labour Office, Geneva, Switzerland
iii
Preface
Youth is a crucial time of life when young people start realizing their aspirations, assuming their economic independence and finding their place in society. The global jobs crisis has exacerbated the vulnerability of young people in terms of: i) higher unemployment, ii) lower quality jobs for those who find work, iii) greater labour market inequalities among different groups of young people, iv) longer and more insecure school-to-work transitions, and v) increased detachment from the labour market.
In June 2012, the International Labour Conference of the ILO resolved to take urgent action to tackle the unprecedented youth employment crisis through a multi-pronged approach geared towards pro-employment growth and decent job creation. The resolution “The youth employment crisis: A call for action” contains a set of conclusions that constitute a blueprint for shaping national strategies for youth employment.1 It calls for increased coherence of policies and action on youth employment across the multilateral system. In parallel, the UN Secretary-General highlighted youth as one of the five generational imperatives to be addressed through the mobilization of all the human, financial and political resources available to the United Nations (UN). As part of this agenda, the UN has developed a System-wide Action Plan on Youth, with youth employment as one of the main priorities, to strengthen youth programmes across the UN system.
The ILO supports governments and social partners in designing and implementing integrated employment policy responses. As part of this work, the ILO seeks to enhance the capacity of national and local-level institutions to undertake evidence-based analysis that feeds social dialogue and the policy-making process. To assist member States in building a knowledge base on youth employment, the ILO has designed the “school-to-work transition survey” (SWTS) and the “labour demand enterprise survey” (LDES). The current report, which presents the results of the surveys in eight sub-Saharan African countries (Benin, Liberia, Madagascar, Malawi, the United Republic of Tanzania, Togo, Uganda and Zambia), is a product of a partnership between the ILO and The MasterCard Foundation. The “Work4Youth” Project entails collaboration with statistical partners and policy-makers of 28 low- and middle-income countries to undertake the SWTS and assist governments and the social partners in the use of the data for effective policy design and implementation.
It is not an easy time to be a young person in the labour market today. The hope is that with leadership from the UN system, with the commitment of governments, trade unions and employers’ organizations and through the active participation of donors such as The MasterCard Foundation, the international community can provide the effective assistance needed to help young women and men make a good start in the world of work. If we can get this right, it will positively affect young people’s professional and personal success in all future stages of life.
Azita Berar Awad Director Employment Policy Department
Dan Cunniah Acting Regional Director Regional Office for Africa
1 The full text of the 2012 resolution “The youth employment crisis: A call for action” can be found on the ILO website at: http://www.ilo.org/ilc/ILCSessions/101stSession/texts-adopted/WCMS_185950/lang--en/index.htm.
v
Contents
Page
Preface ....................................................................................................................................... iii
Contents ....................................................................................................................................... v
Acknowledgements ............................................................................................................................ ix
1. Introduction and main findings ................................................................................................ 1
3.1 Distribution of youth by age group, area of residence and marital status (%) ......................... 11
3.2 Distribution of youth with no schooling by reason and sex (%) .............................................. 13
3.3 Current labour market and educational status of youth (%) .................................................... 15
4.1 Key youth labour market indicators – traditional distribution by country and sex (%) ........... 16
4.2 Key youth labour market indicators – alternative distribution by country and sex (%) .......... 18
5.1 Youth employment by occupation (ISCO-08, %) ................................................................... 21
5.2 Youth employment by status in employment and sex (%) ...................................................... 23
5.3 Wage and salaried young workers by type of contract and duration (%) ................................ 24
vii
5.4 Wage and salaried young workers by access to employment entitlements/benefits (multiple responses, %) ........................................................................................................... 25
5.5 Self-employed youth by reason for taking up self-employment (%) ....................................... 26
5.6 Self-employed youth by main challenge to doing business (%) .............................................. 26
5.7 Share of working youth who want to change their job and reason for wanting to change (%) ........................................................................................................................................... 31
5.8 ISCO major groups and education levels ................................................................................ 33
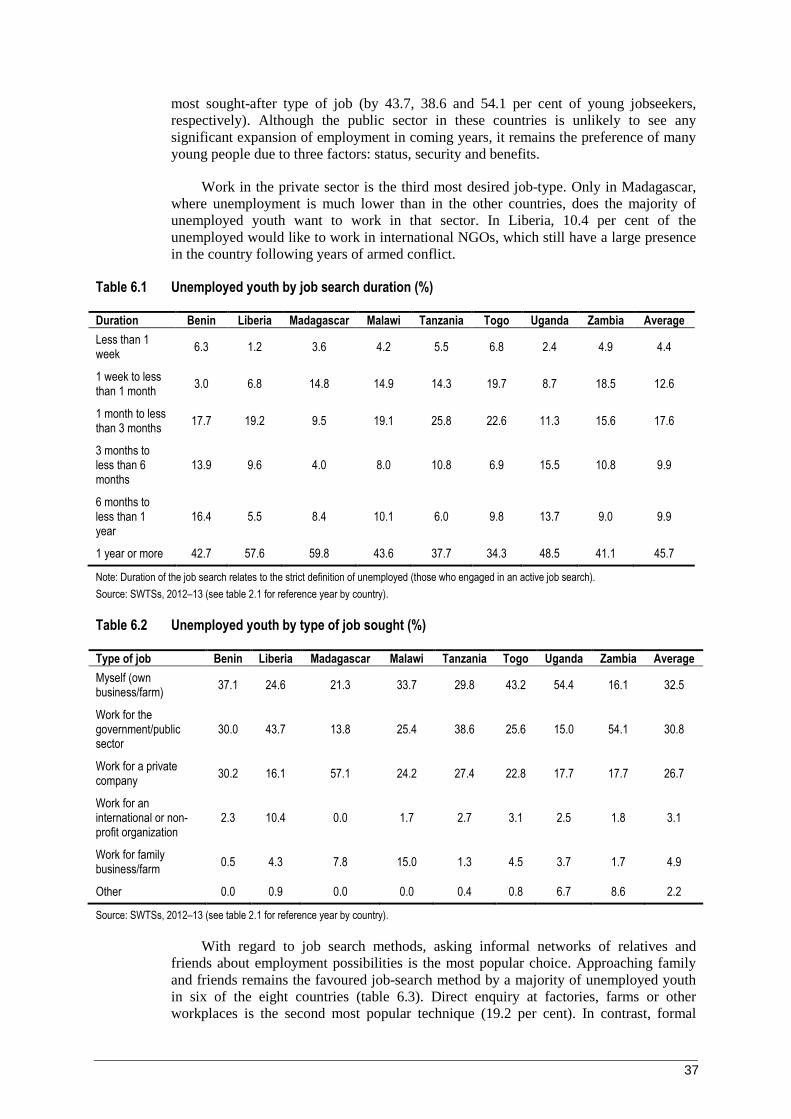
6.1 Unemployed youth by job search duration (%) ....................................................................... 37
6.2 Unemployed youth by type of job sought (%) ......................................................................... 37
6.3 Unemployed youth by job search method (%) ........................................................................ 38
6.4 Unemployed youth by main obstacle to finding employment (%) .......................................... 39
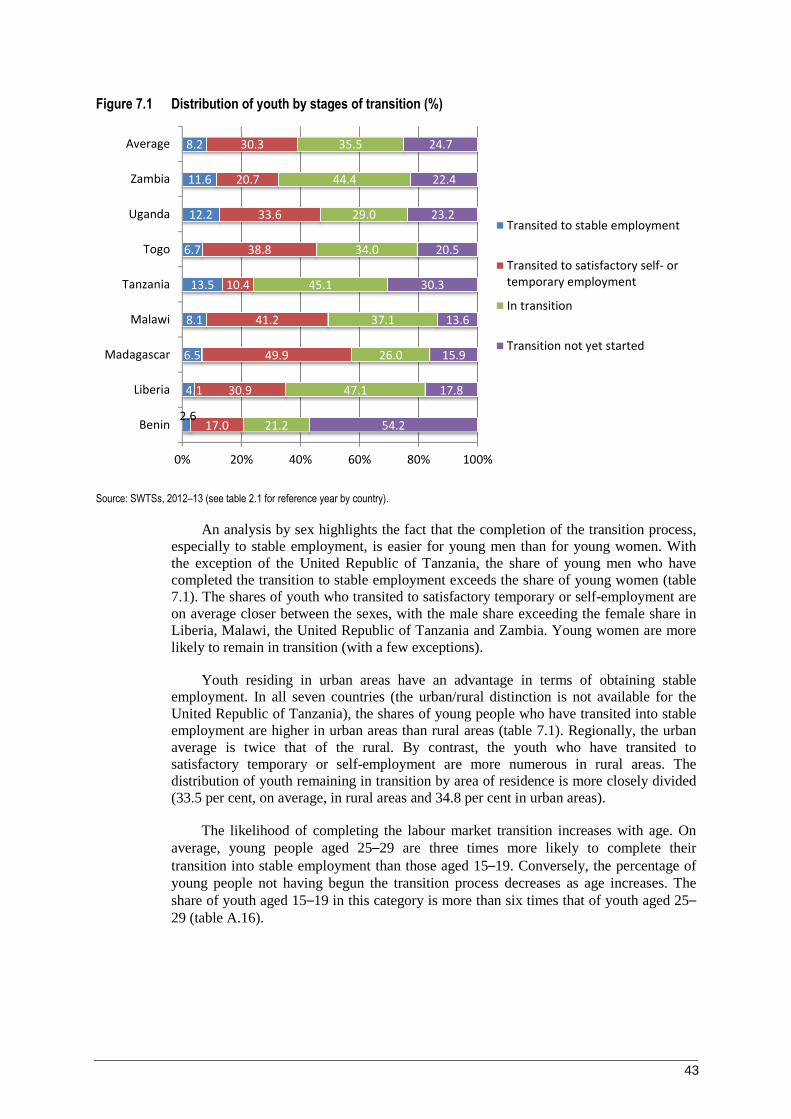
7.1 Distribution of youth by stages of transition, sex and area of residence (%) .......................... 44
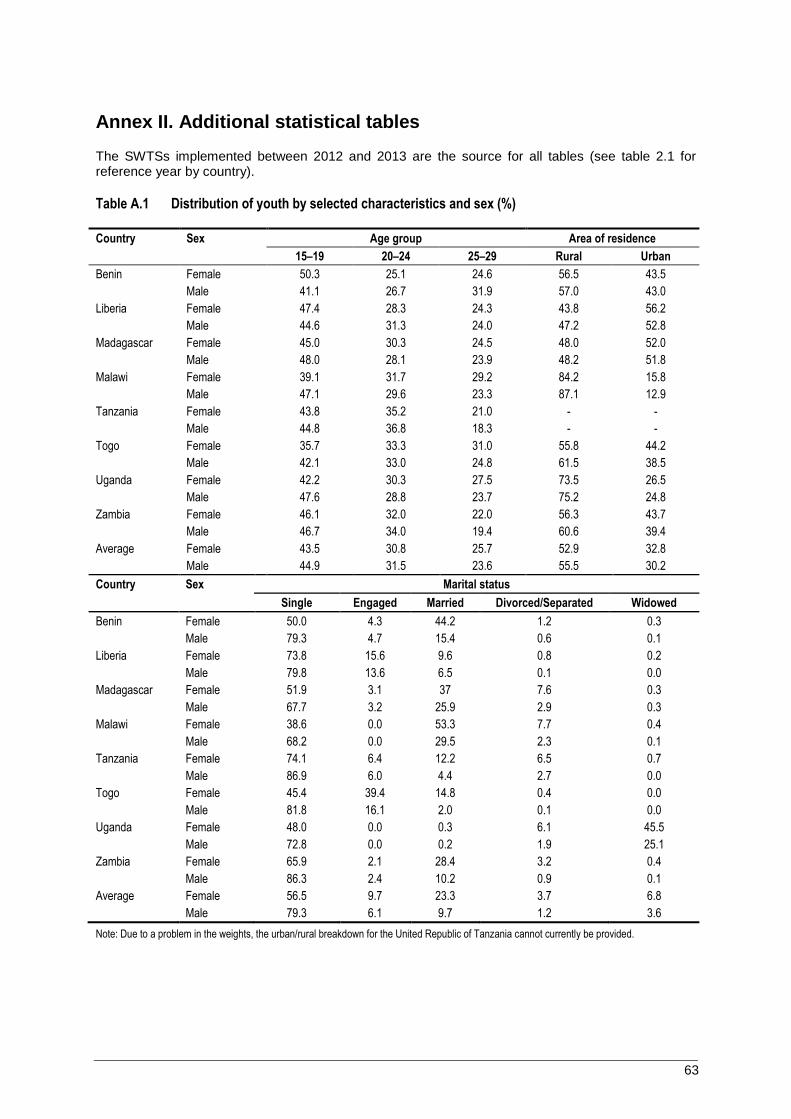
A.1 Distribution of youth by selected characteristics and sex (%) ................................................. 63
A.2 Distribution of youth by household financial status and area of residence (%) ...................... 64
A.3 Distribution of youth by level of completed education and sex (%) ....................................... 64
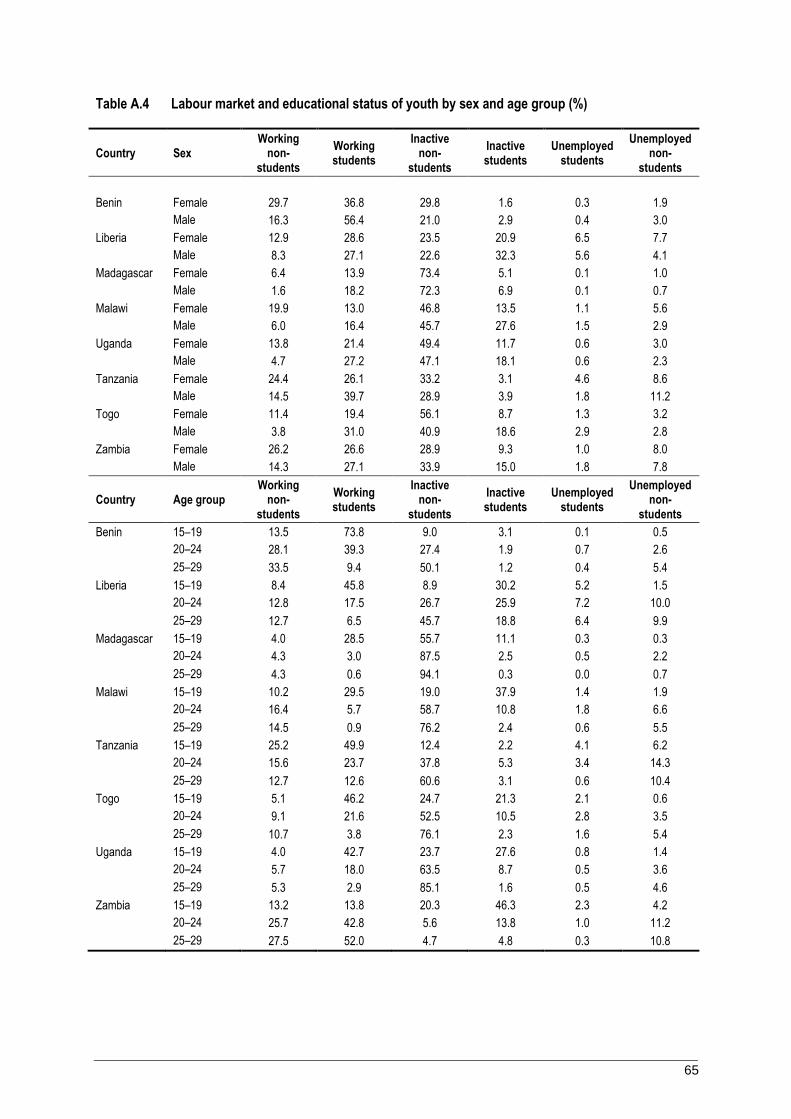
A.4 Labour market and educational status of youth by sex and age group (%) ............................. 65
A.5 Share of youth neither in employment nor in education or training by sex (%) ...................... 66
A.6 Youth employment by aggregate sector and sex (%) .............................................................. 66
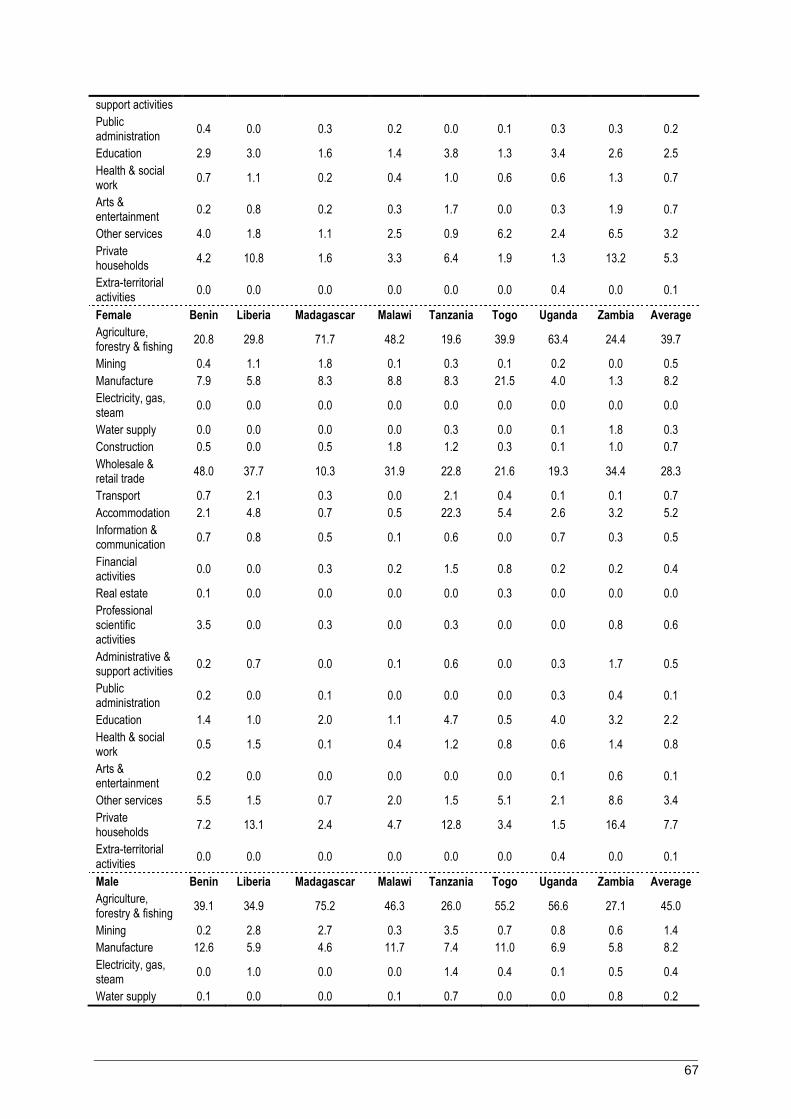
A.7 Distribution of youth employment by detailed 1-digit sector (ISIC) and sex (%) ................... 66
A.8 Distribution of employed youth by occupation (ISCO-08) and sex (%) ................................. 68
A.9 Wage and salaried young workers on limited duration contract by reason (%) ...................... 69
A.10 Satisfaction/non-satisfaction with contract situation of wage and salaried young workers by reason (%) ........................................................................................................................... 69
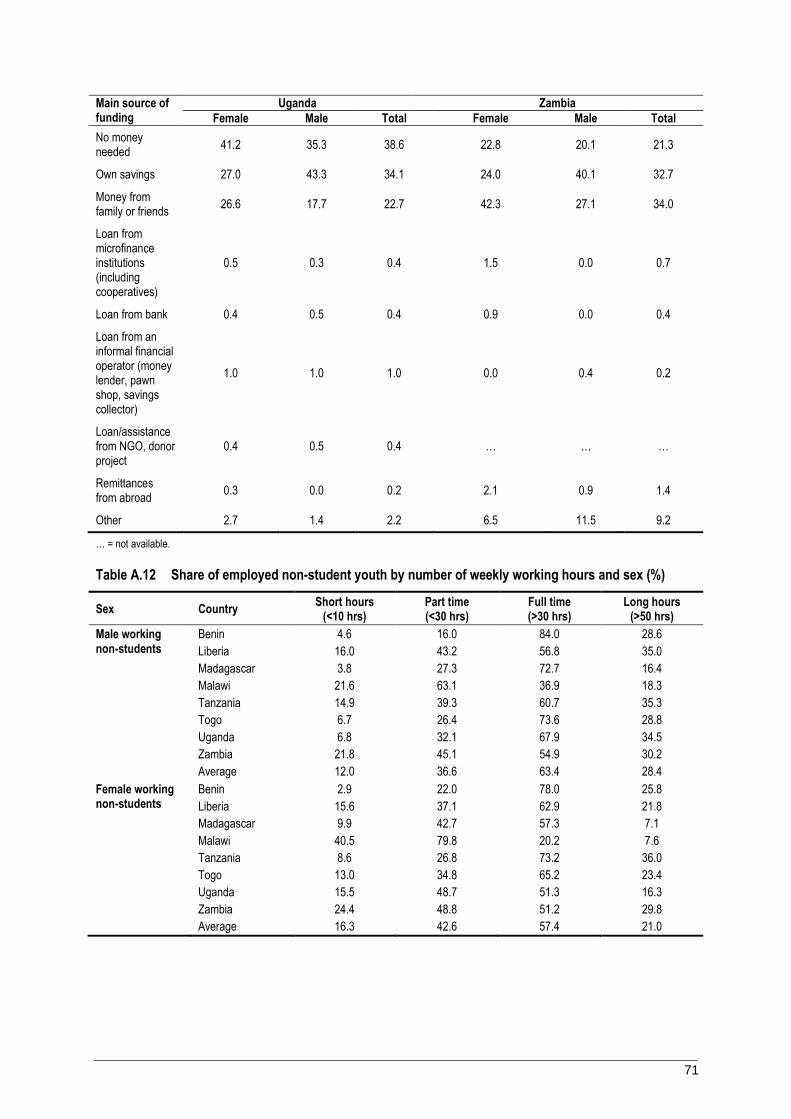
A.11 Main source of funding for self-employed youth to start their own business, by sex (%) ...... 70
A.12 Share of employed non-student youth by number of weekly working hours and sex (%) ...... 71
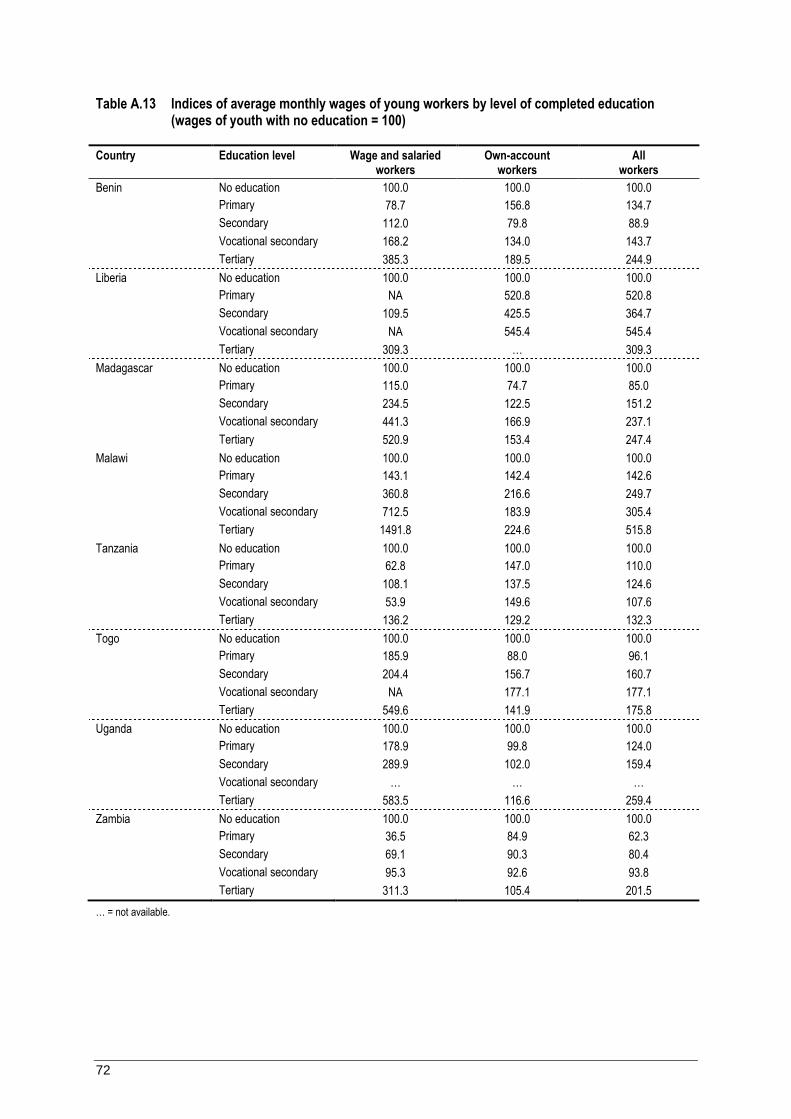
A.13 Indices of average monthly wages of young workers by level of completed education (wages of youth with no education = 100) .............................................................................. 72
A.14 Youth unemployment rates (relaxed definition) by level of completed education (%) ........... 73
A.15 Perception of unemployed youth of usefulness of education in helping to obtain work (%) ........................................................................................................................................... 73
A.16 Stages of transition of youth by age group (%) ....................................................................... 73
A.17 Stages of transition of youth by level of completed education (%) ......................................... 74
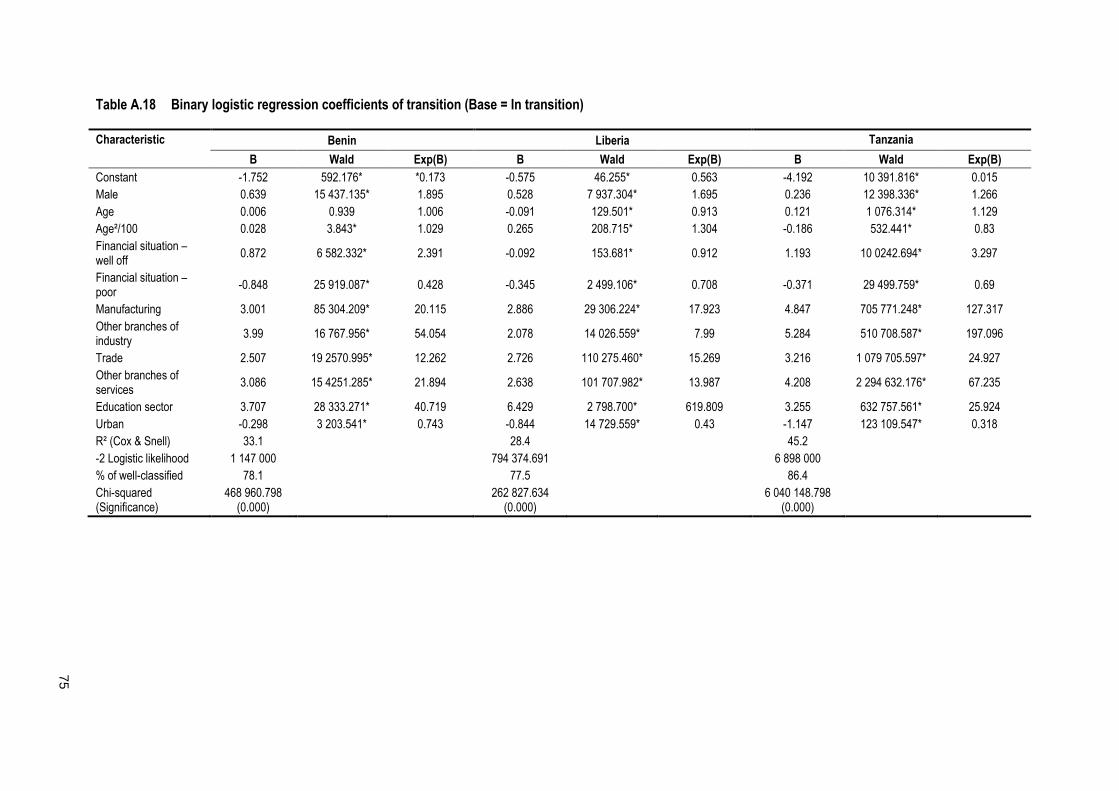
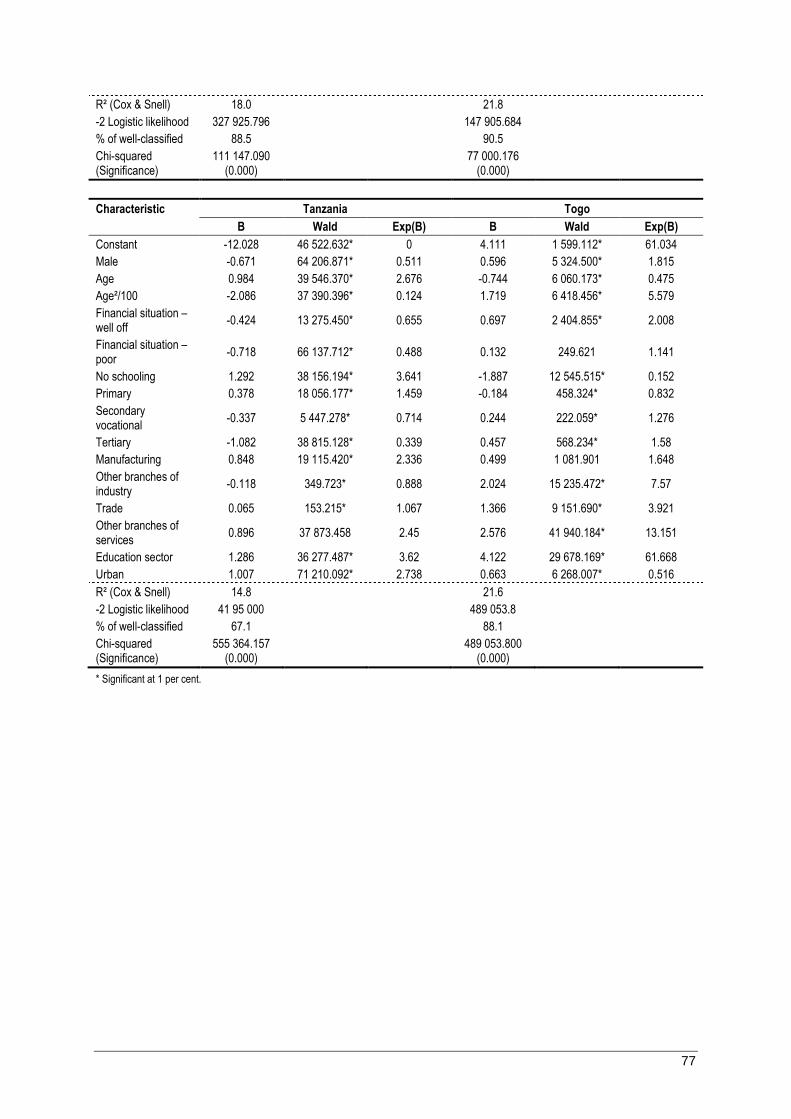
A.18 Binary logistic regression coefficients of transition (Base = In transition) ............................. 75
A.19 Binary logistic regression coefficients of transition to stable employment (Base = Transited to satisfactory self- or temporary employment) ....................................................... 76
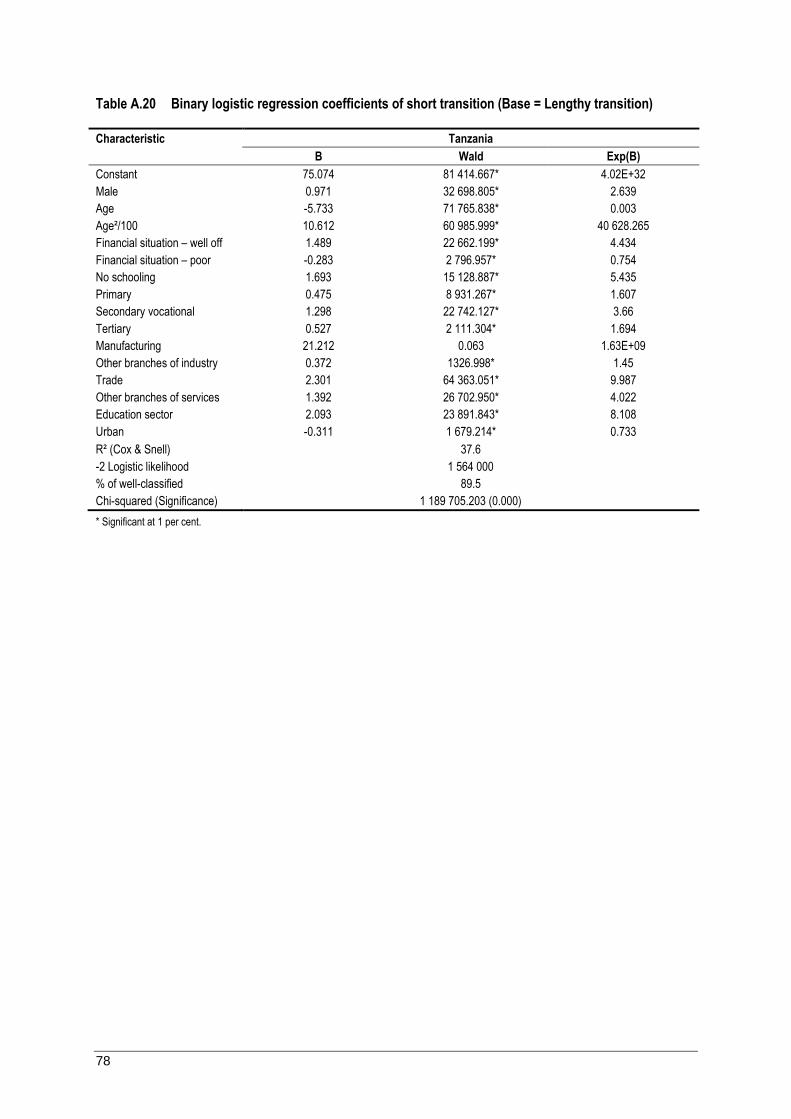
A.20 Binary logistic regression coefficients of short transition (Base = Lengthy transition) .......... 78
Figures
2.1 Real GDP growth, 2013–14 (%) .............................................................................................. 9
2.2 Aid and government revenue per capita (US$), 2011.............................................................. 10
viii
3.1 Distribution of youth by level of household income (%) ........................................................ 11
3.2 Distribution of youth by current status in education (%) ......................................................... 12
3.3 Share of youth population with no education or incomplete education and youth with completed education by sex (%) .............................................................................................. 13
3.4 Distribution of youth by highest level of completed education (%) ........................................ 14
5.1 Distribution of employed youth by aggregate sector (%) ........................................................ 20
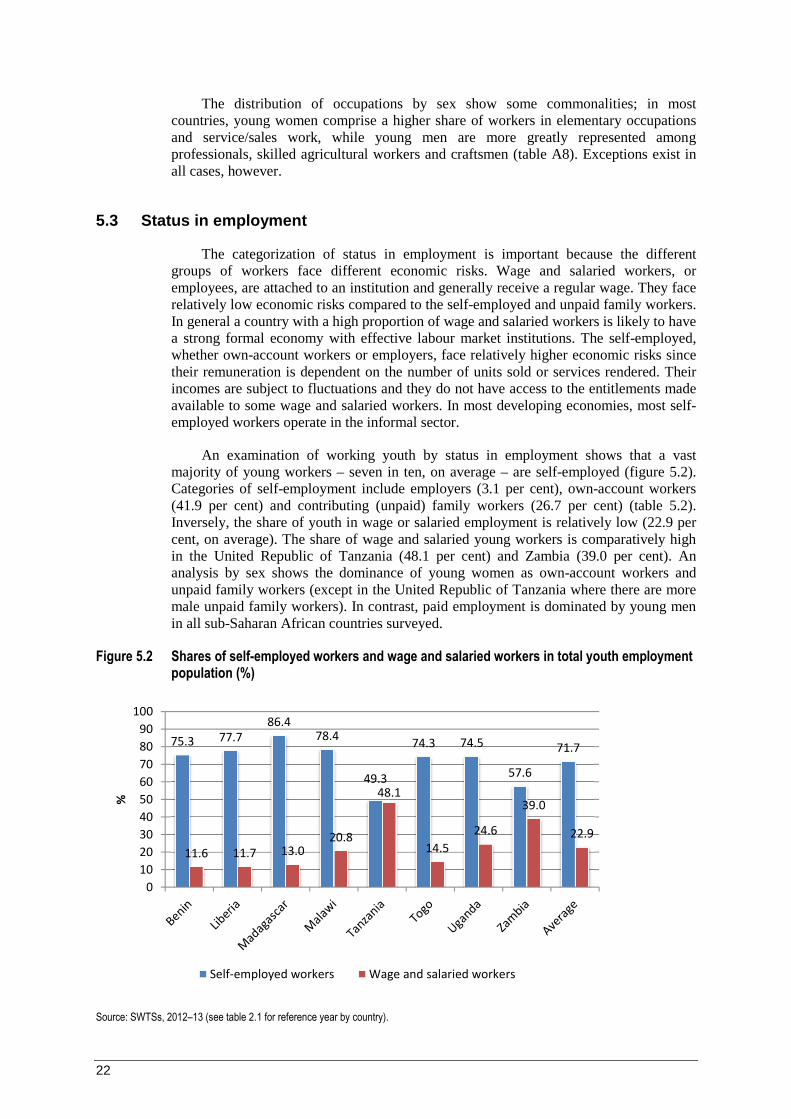
5.2 Shares of self-employed workers and wage and salaried workers in total youth employment population (%) .................................................................................................... 22
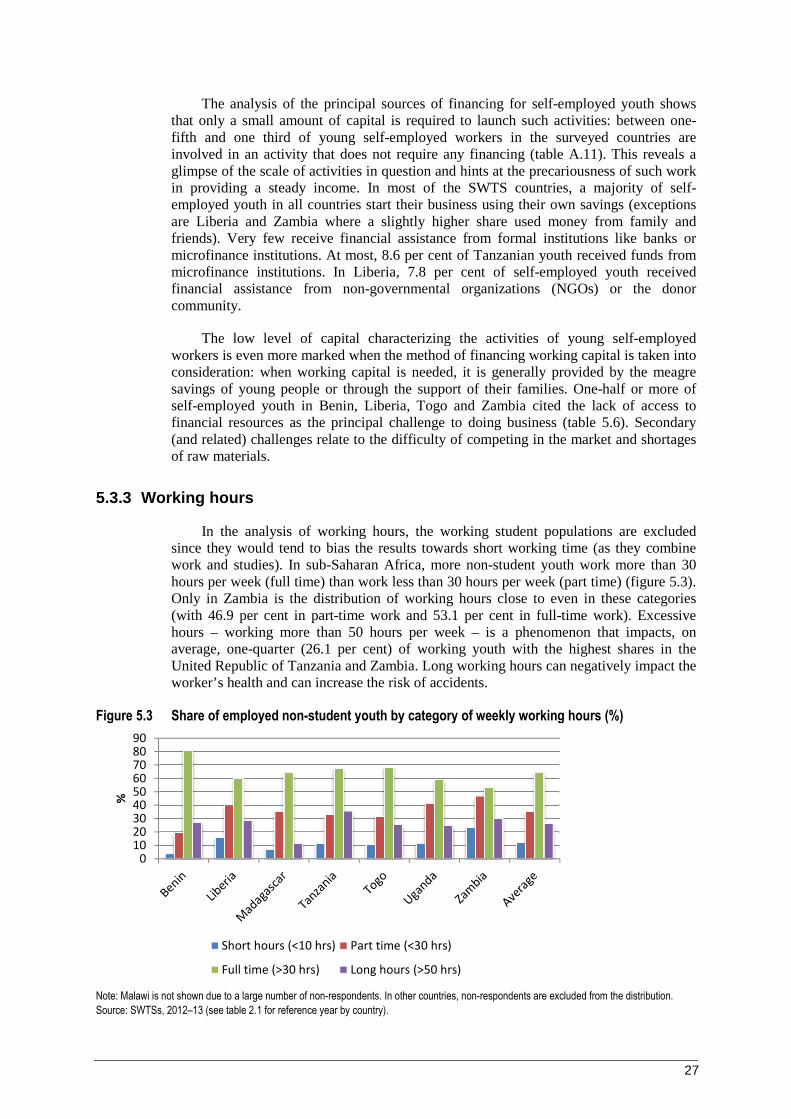
5.3 Share of employed non-student youth by category of weekly working hours (%) .................. 27
5.4 Involuntary part-time employment (share of total youth employment, %) ............................. 28
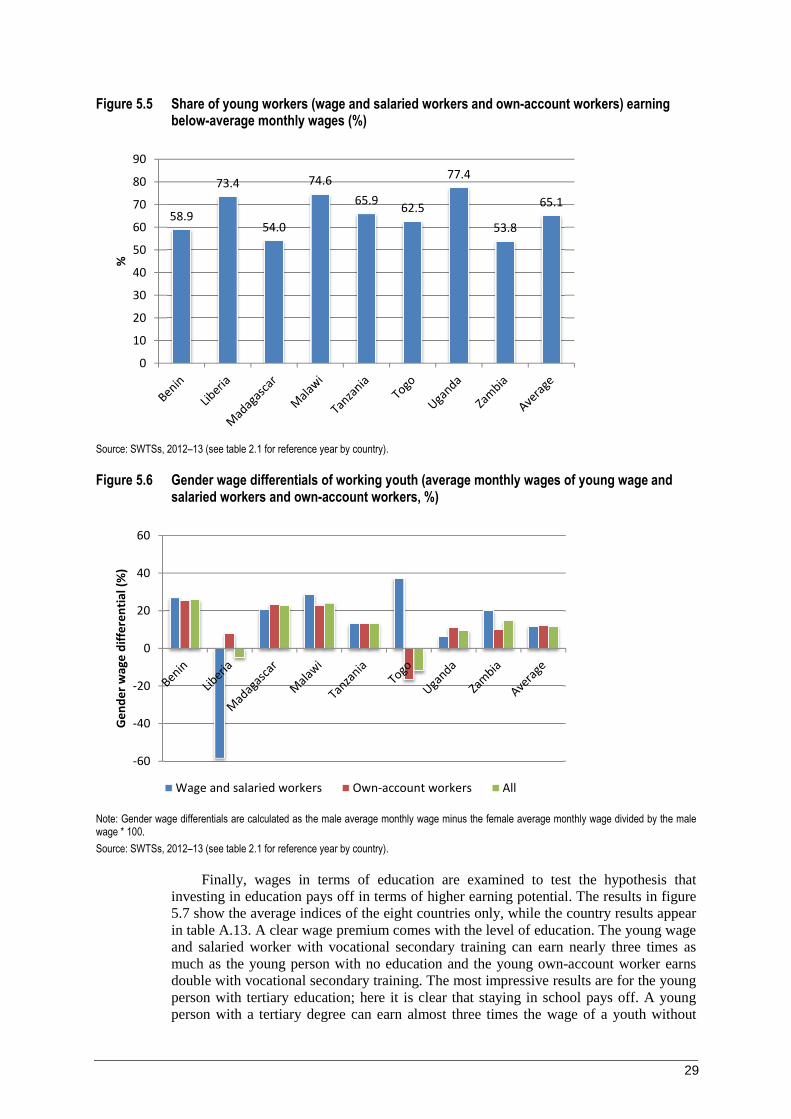
5.5 Share of young workers (wage and salaried workers and own-account workers) earning below-average monthly wages (%) ......................................................................................... 29
5.6 Gender wage differentials of working youth (average monthly wages of young wage and salaried workers and own-account workers, %) ...................................................................... 29
5.7 Indices of nominal average monthly wages of young workers (wage and salaried workers and own-account workers) by level of completed education (wages of youth with no education = 100) ...................................................................................................................... 30
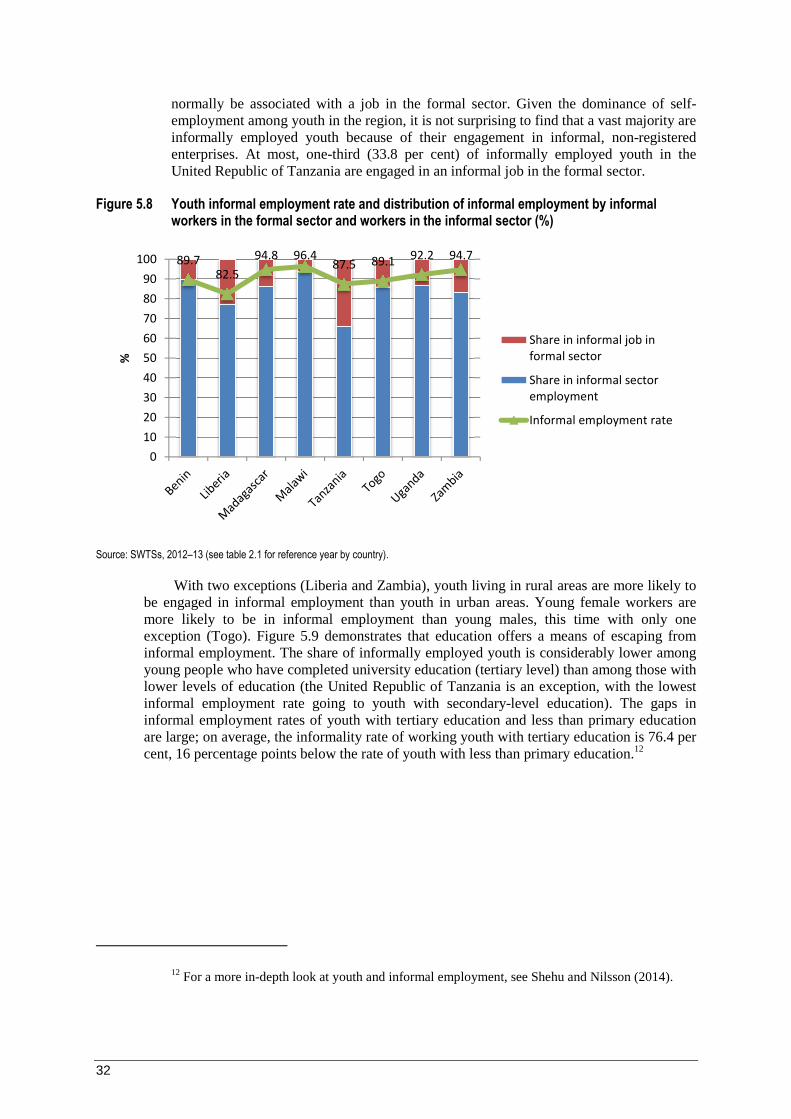
5.8 Youth informal employment rate and distribution of informal employment by informal workers in the formal sector and workers in the informal sector (%)...................................... 32
5.9 Youth informal employment rate by level of completed education (%).................................. 33
5.10 Share of working youth by overeducation, undereducation or matching qualifications (%) .. 34
6.1 Youth unemployment rates (relaxed definition) by area of residence (%) .............................. 35
6.2 Youth unemployment rates (relaxed definition) by level of completed education (%) ........... 36
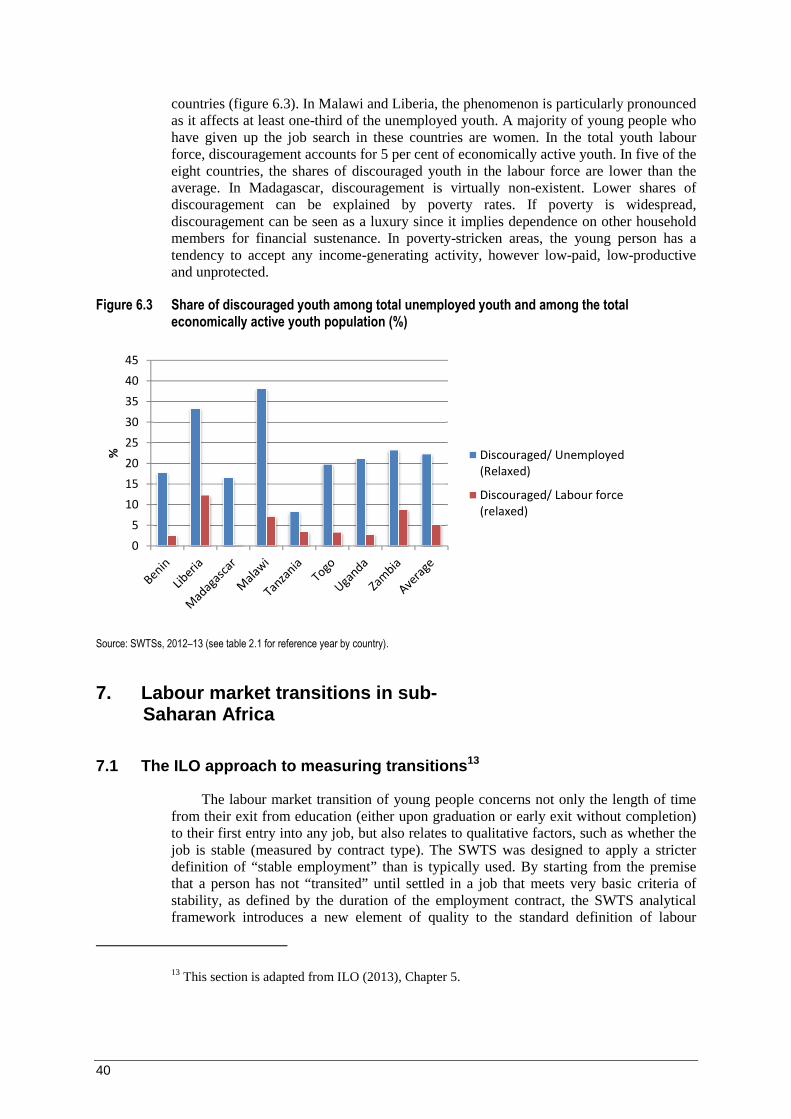
6.3 Share of discouraged youth among total unemployed youth and among the total economically active youth population (%) .............................................................................. 40
7.1 Distribution of youth by stages of transition (%) .................................................................... 43
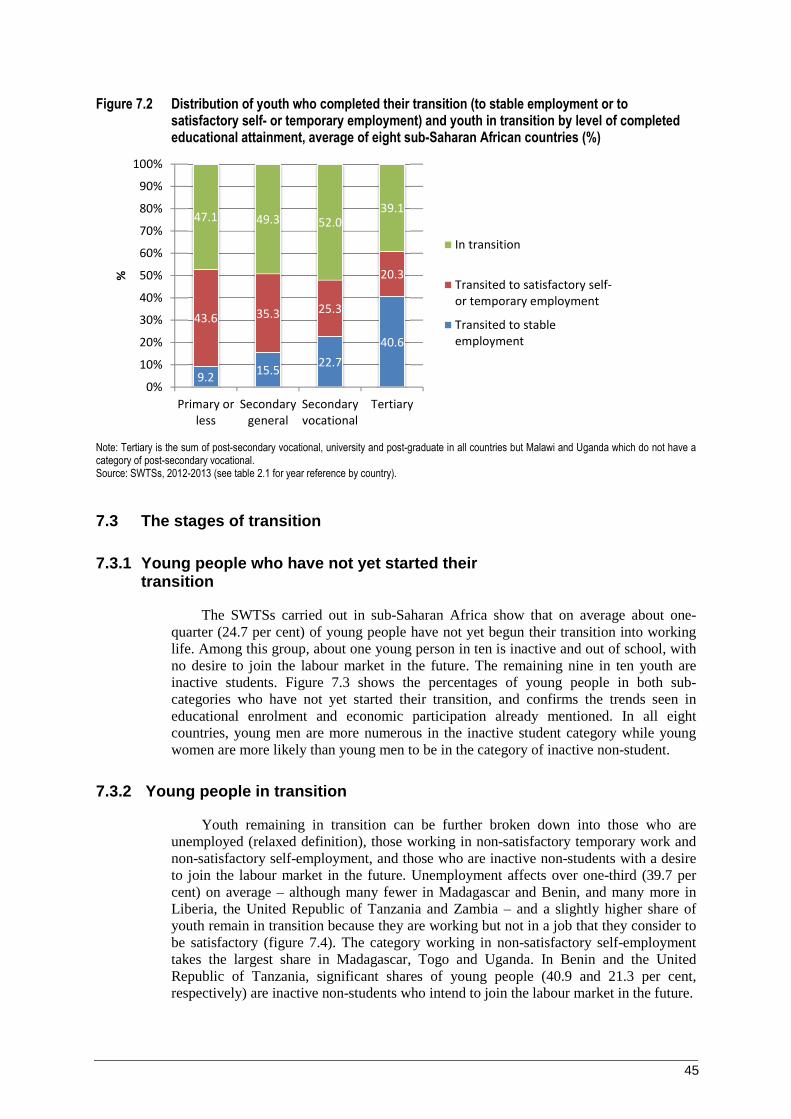
7.2 Distribution of youth who completed their transition (to stable employment or to satisfactory self- or temporary employment) and youth in transition by level of completed educational attainment, average of eight sub-Saharan African countries (%) ......................... 45
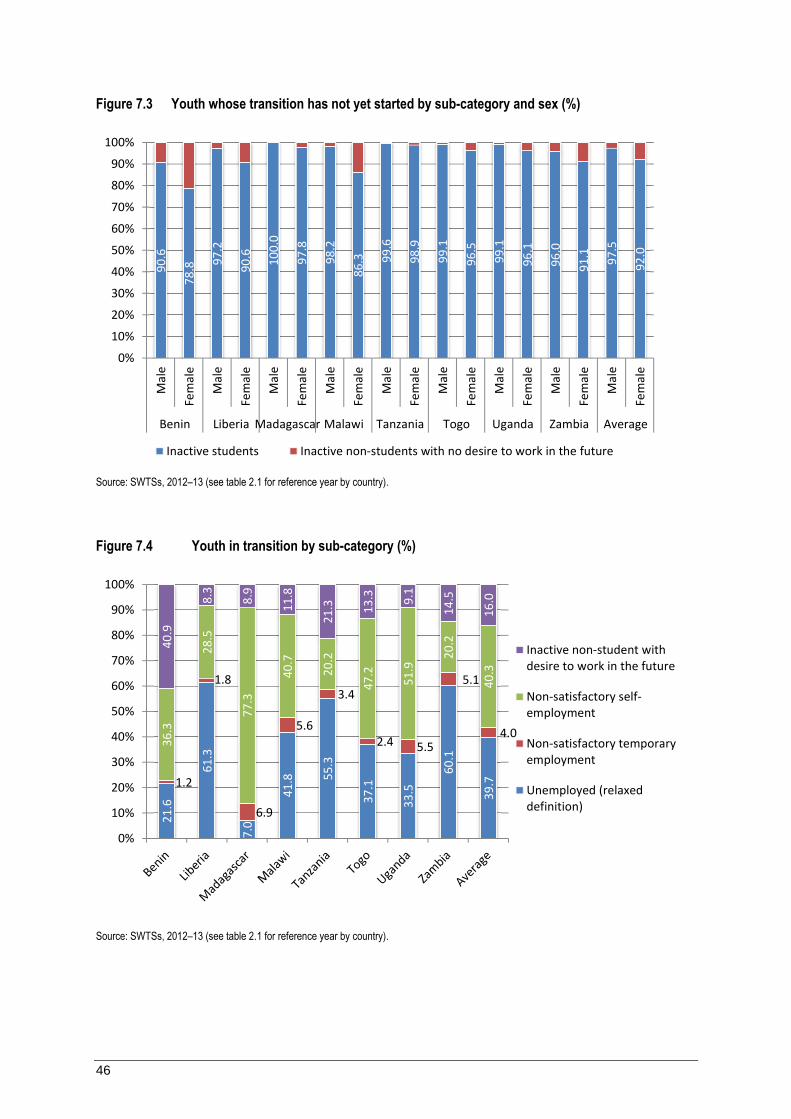
7.3 Youth whose transition has not yet started by sub-category and sex (%) ............................... 46
7.4 Youth in transition by sub-category (%).................................................................................. 46
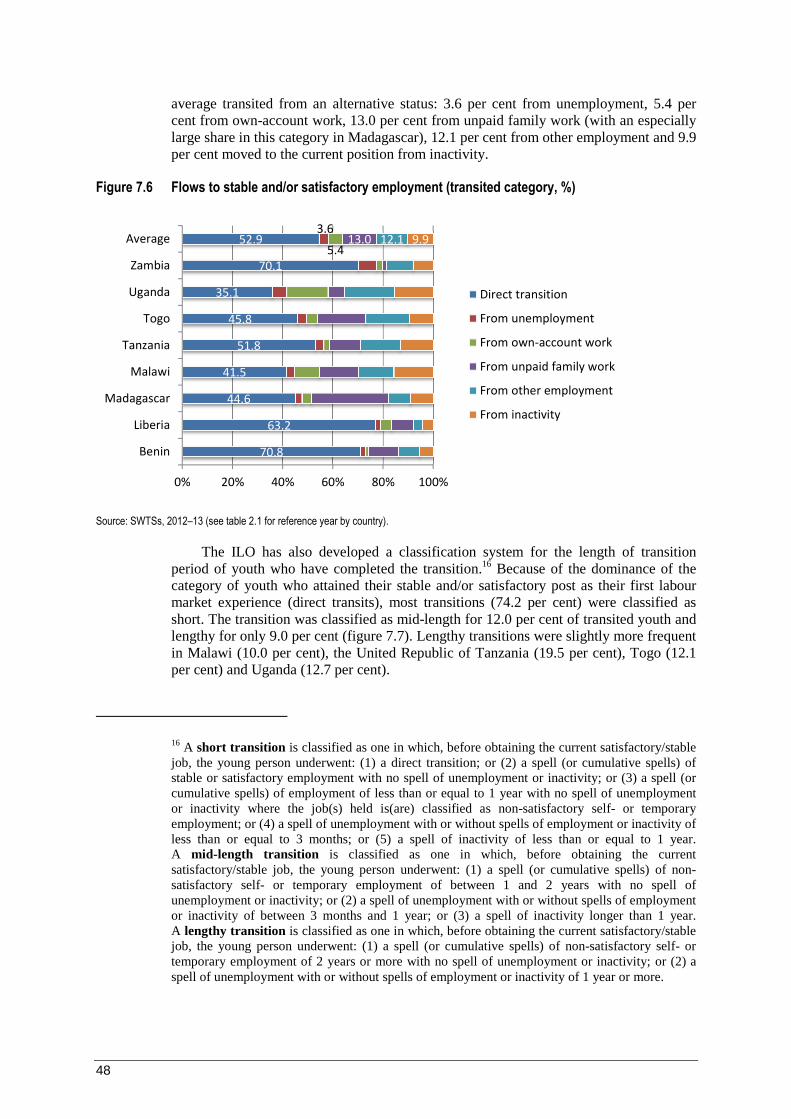
7.5 Youth who completed the transition by sub-category (%) ...................................................... 47
7.7 Youth who completed the transition by length of transition (%) ............................................. 49
7.8 Average length of transition of youth who completed the transition (months) ....................... 49
Boxes
1 Definition of youth .................................................................................................................. 5
2 Work4Youth: An ILO project in partnership with The MasterCard Foundation .................... 6
3 Approaches to boost aggregate demand and promote youth employment .............................. 54
ix
Acknowledgements
The authors take this opportunity to thank members of the ILO Work4Youth team –Valentina Barcucci, Susan Divald, Yonca Gurbuzer, Marco Minocri and Yves Perardel – for their technical support and valuable input during all stages of the surveys and report production. Sincere thanks to Yacouba Diallo, Naoko Otobe, Diego Rei and Theo Sparreboom for useful comments on the draft. We are grateful also to Gianni Rosas, Coordinator, ILO Youth Employment Programme, for his continuing support of the Work4Youth Project.
The preliminary results of the survey were presented at a Regional Conference on “Labour market transitions of young women and men in sub-Saharan Africa”, held in Addis Ababa, Ethiopia on 3−4 December 2013. The authors wish to thank the participants of the conference for their validation of the results and feedback on the relevance of the survey to the design of national and regional interventions on youth employment. Geir Tonstol, Programme Officer, ILO Regional Office for Africa, offered invaluable assistance in organizing the regional event.
Finally, the ILO would like to acknowledge the support given by The MasterCard Foundation in allowing the research to move forward, under the scope of the Work4Youth partnership.
1
1. Introduction and main findings
1.1 Overview
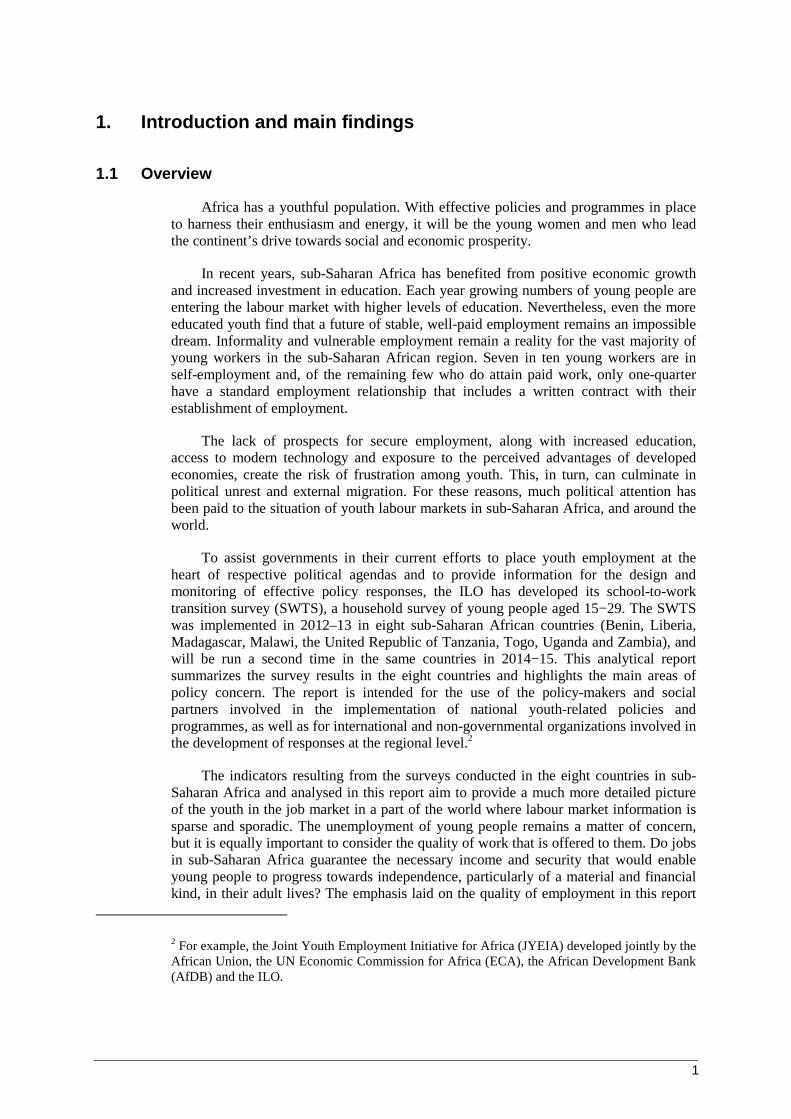
Africa has a youthful population. With effective policies and programmes in place to harness their enthusiasm and energy, it will be the young women and men who lead the continent’s drive towards social and economic prosperity.
In recent years, sub-Saharan Africa has benefited from positive economic growth and increased investment in education. Each year growing numbers of young people are entering the labour market with higher levels of education. Nevertheless, even the more educated youth find that a future of stable, well-paid employment remains an impossible dream. Informality and vulnerable employment remain a reality for the vast majority of young workers in the sub-Saharan African region. Seven in ten young workers are in self-employment and, of the remaining few who do attain paid work, only one-quarter have a standard employment relationship that includes a written contract with their establishment of employment.
The lack of prospects for secure employment, along with increased education, access to modern technology and exposure to the perceived advantages of developed economies, create the risk of frustration among youth. This, in turn, can culminate in political unrest and external migration. For these reasons, much political attention has been paid to the situation of youth labour markets in sub-Saharan Africa, and around the world.
To assist governments in their current efforts to place youth employment at the heart of respective political agendas and to provide information for the design and monitoring of effective policy responses, the ILO has developed its school-to-work transition survey (SWTS), a household survey of young people aged 15−29. The SWTS was implemented in 2012–13 in eight sub-Saharan African countries (Benin, Liberia, Madagascar, Malawi, the United Republic of Tanzania, Togo, Uganda and Zambia), and will be run a second time in the same countries in 2014−15. This analytical report summarizes the survey results in the eight countries and highlights the main areas of policy concern. The report is intended for the use of the policy-makers and social partners involved in the implementation of national youth-related policies and programmes, as well as for international and non-governmental organizations involved in the development of responses at the regional level.2
The indicators resulting from the surveys conducted in the eight countries in sub-Saharan Africa and analysed in this report aim to provide a much more detailed picture of the youth in the job market in a part of the world where labour market information is sparse and sporadic. The unemployment of young people remains a matter of concern, but it is equally important to consider the quality of work that is offered to them. Do jobs in sub-Saharan Africa guarantee the necessary income and security that would enable young people to progress towards independence, particularly of a material and financial kind, in their adult lives? The emphasis laid on the quality of employment in this report
2 For example, the Joint Youth Employment Initiative for Africa (JYEIA) developed jointly by the African Union, the UN Economic Commission for Africa (ECA), the African Development Bank (AfDB) and the ILO.
2
should help to provide a response to this question. The report also draws attention to the path and duration of the school-to-work transition for young people who are employed and draws some conclusions about the characteristics or experiences that can help to achieve a smoother transition.
1.2 Structure of the report
This report presents the objectives and methodology of the SWTS and provides certain aspects of the social and economic context of the labour market in sub-Saharan Africa. It then highlights the survey results, focusing in section 3 on the individual, household and educational characteristics of youth in the sub-Saharan African countries surveyed. It also presents the labour market characteristics of youth. Section 4 provides the main indicators, section 5 presents a detailed overview of youth employment, including significant details on conditions of work, and section 6 focuses on the characteristics of unemployed youth. Section 7 presents the classification of the stages of the school-to-work transition and examines the characteristics that lead to better integration in the job market, especially in terms of obtaining a stable and/or satisfactory job. The section also deals with the duration of the transition for young men and women and traces the various experiences they have had inside or outside the job market during their transition. In section 8 the report ends with an examination in greater depth of the issue of transition, identifying the factors that explain why some young people make the transition relatively easily to stable and satisfactory employment through econometric modelling. Finally, section 9 outlines some general policy implications and a selection of “good” practices in youth employment interventions.
1.3 Main findings
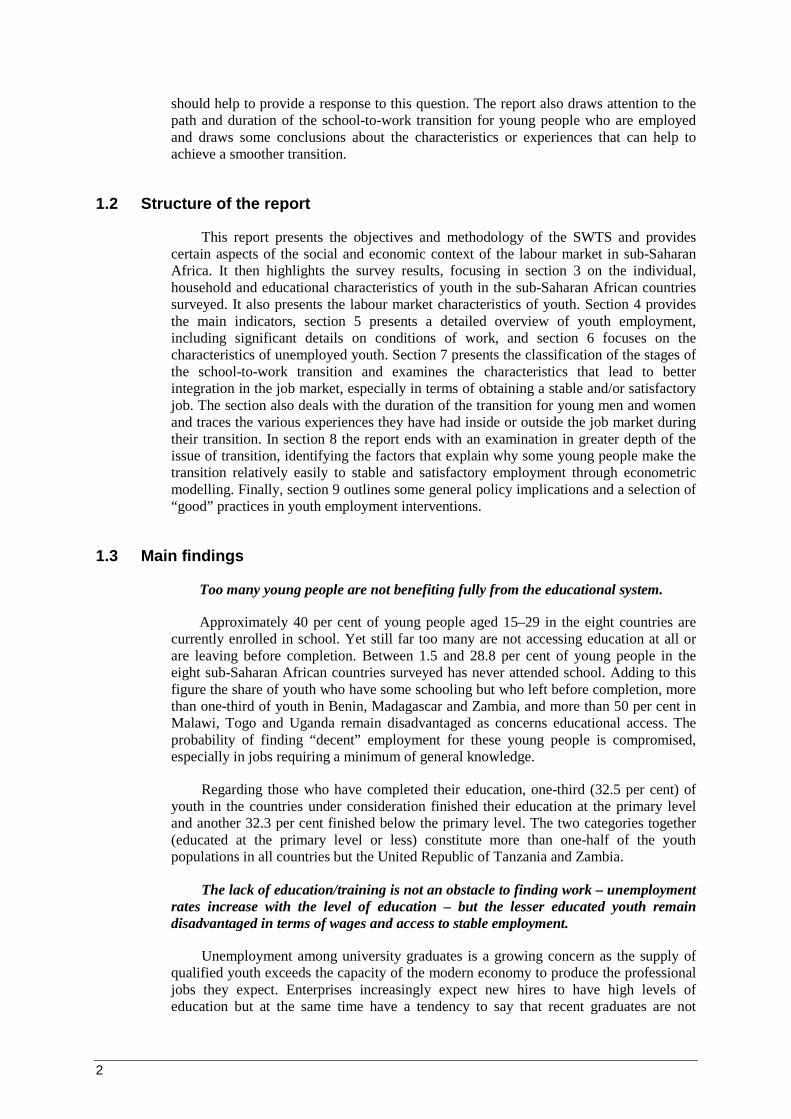
Too many young people are not benefiting fully from the educational system.
Approximately 40 per cent of young people aged 15–29 in the eight countries are currently enrolled in school. Yet still far too many are not accessing education at all or are leaving before completion. Between 1.5 and 28.8 per cent of young people in the eight sub-Saharan African countries surveyed has never attended school. Adding to this figure the share of youth who have some schooling but who left before completion, more than one-third of youth in Benin, Madagascar and Zambia, and more than 50 per cent in Malawi, Togo and Uganda remain disadvantaged as concerns educational access. The probability of finding “decent” employment for these young people is compromised, especially in jobs requiring a minimum of general knowledge.
Regarding those who have completed their education, one-third (32.5 per cent) of youth in the countries under consideration finished their education at the primary level and another 32.3 per cent finished below the primary level. The two categories together (educated at the primary level or less) constitute more than one-half of the youth populations in all countries but the United Republic of Tanzania and Zambia.
The lack of education/training is not an obstacle to finding work – unemployment rates increase with the level of education – but the lesser educated youth remain disadvantaged in terms of wages and access to stable employment.
Unemployment among university graduates is a growing concern as the supply of qualified youth exceeds the capacity of the modern economy to produce the professional jobs they expect. Enterprises increasingly expect new hires to have high levels of education but at the same time have a tendency to say that recent graduates are not
3
hireable due to factors such as the lack of technical expertise.3 In this sense, unemployment among graduates is demand-driven, but graduate employment is also susceptible to supply-driven elements that come from young graduates’ expectations of good wages and working conditions. Some young graduates are waiting for a “good” job to materialize. Evidence from the SWTSs shows high (and unrealistic) expectations on the part of youth to attain work in the public sector.
The less educated, on the other hand, are more likely to create their own job in self-employment or to accept lower wages. For these reasons, in all the countries but Malawi, the young person with the lowest level of education is the least likely to be unemployed.
While unemployment may be higher among the better educated, the results clearly show that investing in education brings positive returns to youth in terms of wages and access to the “better” jobs.
Evidence from the surveys show that youth with tertiary-level degrees can earn almost three times the wages of youth with no education. The average monthly wages of youth increases steadily with each incremental step of education.
Also, the higher the educational attainment of youth, the more likely they are to attain stable employment and the better chance they have to escape informal employment. The young person with a tertiary education is more than four times more likely to attain stable employment than the young person with primary education or less. In contrast, the lesser educated youth are much more likely to end up in satisfactory temporary or self-employment. Also, the share of youth informally employed is considerably lower among young people who have completed university education (tertiary level) than among those with lower levels of education.
The average youth unemployment rate (relaxed definition) is 22.8 per cent; the lowest rate is in Madagascar (2.2 per cent) and the highest is in the United Republic of Tanzania (42.0 per cent).
Young women are at a disadvantage in the region’s labour markets in terms of finding work. The unemployment rate of young women exceeds that of young men in all the countries but Benin. The average female youth unemployment rate is 25.3 per cent compared to the male rate of 20.2 per cent.
Most sub-Saharan African youth search for jobs through friends, relatives and acquaintances.
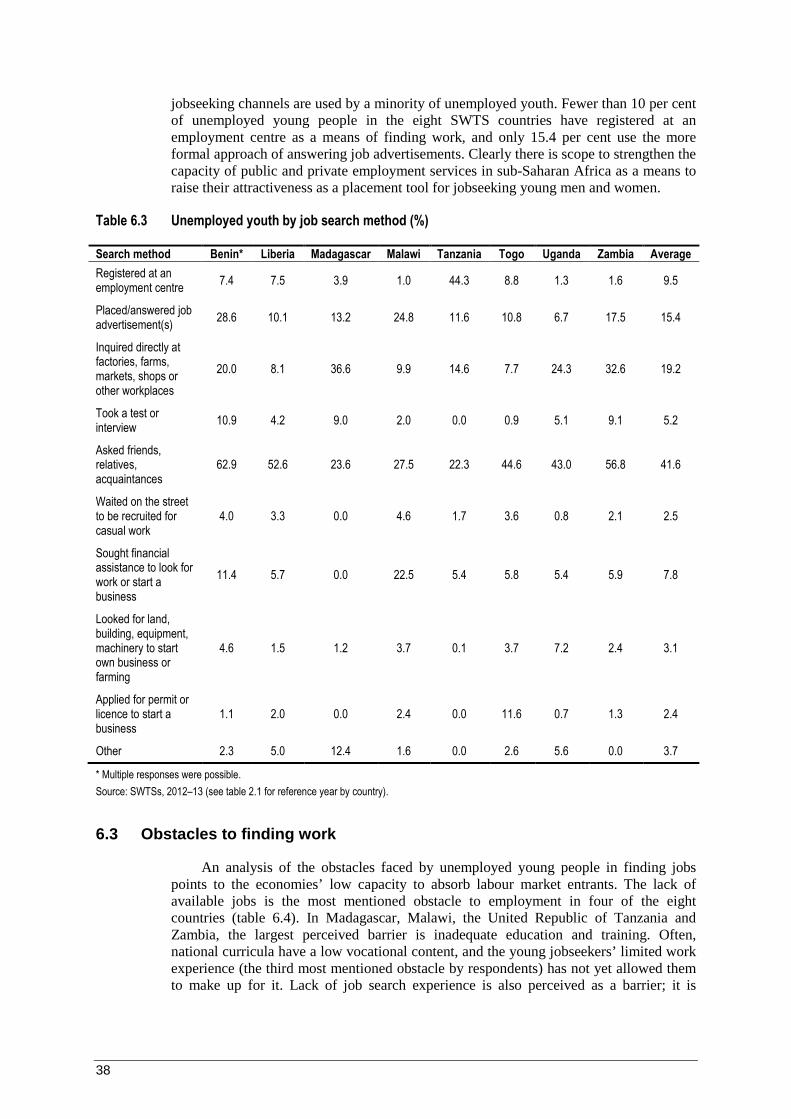
Approaching family and friends remains the favoured job-search method by a majority of unemployed youth in six of the eight countries. Fewer than 10 per cent of unemployed young people in the eight countries have registered at an employment centre as a means of finding work, and only 15.4 per cent use the more formal approach of answering job advertisements. Clearly there is scope to strengthen the capacity of public and private employment services in sub-Saharan Africa as a means to raise their attractiveness as a placement tool for jobseeking youth.
3 See, for example, Mussa (2013).
4
On average, one-half of the youth in the eight countries are working (53.2 per cent), but the quality of employment is often poor, making it difficult for the youth (and countries) to make the most of their economic potential.
The shares of employed youth in the population range from 27.6 per cent in Benin to 78.9 per cent in Madagascar. With a high share of working youth in self-employment (71.7 per cent) and 40.6 per cent of paid employees engaged on temporary contracts (almost three-quarters with contract lengths of less than 12 months), it is clear that employment is far from stable for most sub-Saharan African youth. Only 9.7 per cent of youth on average in the eight countries are engaged in “regular” employment. The United Republic of Tanzania, Uganda and Zambia do slightly better, but shares remain low at around 14 per cent.
In five of the eight countries, a majority of young workers would like to change their job.
Unsatisfactory work conditions are reflected in the stated desire of a majority of young workers to change their job. The principal reasons for wanting to change include dissatisfaction over the temporary nature of the job, and the desire for higher wages and better working conditions.
Even among wage and salaried workers – the category that typically reflects the least vulnerability – few workers are covered by a written contract, almost one-half of employment contracts are temporary in duration and fewer than one-fifth of young employees receive additional entitlements such as paid annual or sick leave.
Almost three-quarters (73.2 per cent) of wage and salaried youth are tied to their employer on the basis of an oral agreement only. A slight majority of young paid employees have a contract without a time limit (permanent) but among the 40.6 per cent engaged on a fixed-term (temporary) basis, a majority has contract durations of less than 1 year. The entitlement most frequently granted to young employees is paid sick leave, yet only one-fifth (21.6 per cent, on average) of young employees benefit from it. Even fewer receive paid annual leave, maternity/paternity leave, social security coverage or other employment entitlements.
Informal employment is the standard condition among youth in the eight sub-Saharan African countries.
At least eight in ten young workers in all eight countries are in the category of informal employment. Youth living in rural areas are more likely to be engaged in informal employment than youth in urban areas, and young female workers are more likely to be in informal employment than young males.
The average youth labour underutilization rate in the eight countries is 67.1 per cent.
The youth labour underutilization rate is a measure that aims to capture all elements of the youth population whose economic potential is not being fully realized, either because the person works in a non-standard employment arrangement or is neither employed nor in education or training (NEETs). The labour underutilization rate combines the share of youth in irregular employment, unemployed (relaxed definition) and inactive non-students as a percentage of the youth population. The disadvantages experienced by young women show up most strongly in the labour underutilization rates. The female–male gap exceeds 10 percentage points in the youth labour underutilization rates in Benin, the United Republic of Tanzania, Togo and Uganda.
5
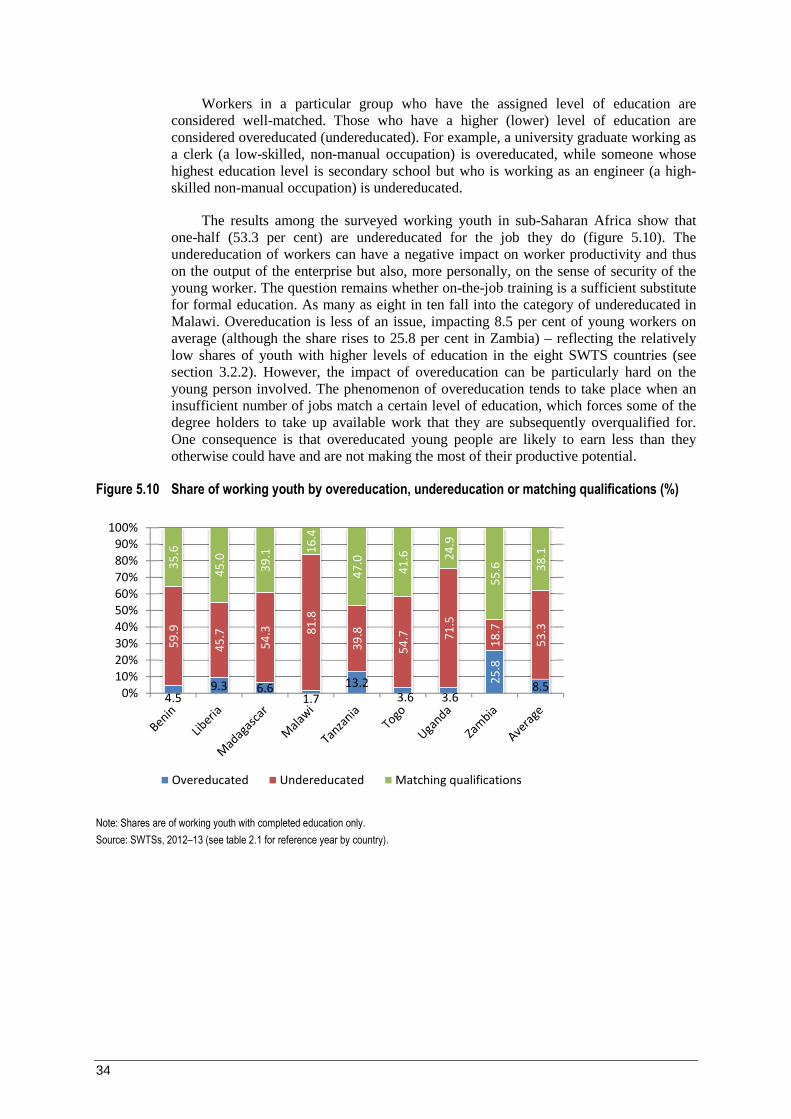
The qualifications mismatch is high among young workers in the eight countries; over one-half (53.3 per cent) of young workers are undereducated for the work they do.
The undereducation of workers can have a negative impact on the productivity of the worker and thus on the output of the enterprise but also, more personally, on the sense of security and well-being of the young worker.
Agriculture and services are the main sectors of youth employment in the eight countries; industry remains underdeveloped.
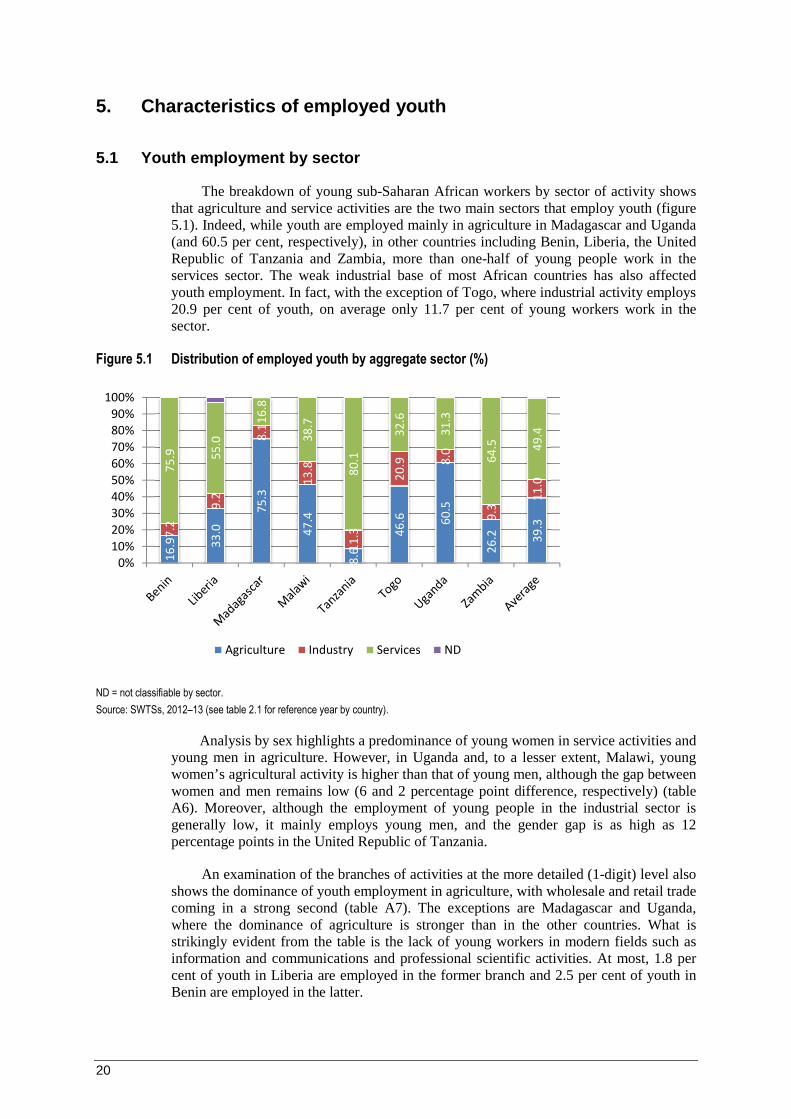
The breakdown of young sub-Saharan African workers by sector of activity shows that agriculture and service activities are the two main sectors that employ youth. While youth are employed mainly in agriculture in Madagascar and Uganda, in other countries including Benin, Liberia, the United Republic of Tanzania and Zambia, more than one-half of young people work in the services sector. In all the countries, youth employment in industry remains weak. Togo is the most industrialized country of the eight in terms of youth employment, but even there only one young worker in five is employed in the sector.
2. School-to-work transition surveys in sub-Saharan Africa
2.1 Survey objectives and methodology
Sub-Saharan Africa is characterised by an insufficiency of labour market statistics. Often the most recent data on the employment situation date back more than 5 years and even survey data that are made publicly available are rarely tabulated by age beyond the most basic of indicators. Consequently, the current limitations in labour market information make it difficult to obtain detailed information about the conditions of youth employment and the labour market transition that young people undertook. Regardless, the issue of improving the transition for young people has become a policy priority for a growing number of countries. In response to this obvious gap, the ILO has developed a framework for understanding the labour market transitions of youth, based on the SWTS. The detailed household survey covering 15−29 year-olds (see box 1) is applied at the national level to generate information on the current labour market situation, the history of economic activities and the perceptions and aspirations of youth.
Box 1. Definition of youth
While in other contexts, a youth is defined as a person aged between 15 and 24 (United Nations) or between 15 and 35 (African Union), for the purpose of the SWTS and related reports, the upper age limit is 29 years of age. This recognizes the fact that some young people remain in education beyond the age of 24, and allows the opportunity to capture more information on the post-graduation employment experiences of young people.
In many sub-Saharan African countries, a broader definition of youth is applied. Nevertheless, in compliance with the Work4Youth (W4Y) Project, most national statistical offices generally agreed to apply the 15–29 definition when implementing the SWTS. Liberia was the exception, where it was agreed to capture the broader age band of 15–35. The W4Y team will consider how to approach the varying age definitions in the second round of surveys.
6
Funding for the surveys came from the Work4Youth partnership between the ILO Youth Employment Programme and The MasterCard Foundation (see box 2). The partnership supports the SWTS in 28 target countries, and data from the first round of surveys were made available throughout 2013. A second series of SWTSs will be conducted in each of the 28 countries surveyed in 2014−15. National reports summarizing survey results as well as the data itself (raw and tabulated) are available on the W4Y website.4
In some W4Y target countries, a labour demand enterprise survey (LDES) was also implemented. This survey of enterprises is intended to balance the supply-side picture captured by the SWTS. The LDES investigates the current and expected workforce needs of enterprises and the perspectives of managers on the pool of available young jobseekers and workers. By running the two surveys simultaneously, it is possible to shed light on issues such as labour market inefficiencies, weak job search/recruitment methods and mismatches between the skills-base of young labour market entrants and the needs of the labour market. Among the sub-Saharan African countries, the LDES was implemented in Liberia, Malawi, the United Republic of Tanzania and Zambia. As this report concentrates on the results of the SWTS alone, readers are recommended to review the available national reports for results of the LDES.5
Box 2. Work4Youth: An ILO project in partnership with The MasterCard Foundation
The Work4Youth (W4Y) Project is a partnership between the ILO Youth Employment Programme and The MasterCard Foundation. The project has a budget of US$14.6 million and will run for 5 years to mid-2016. Its aim is to “promot[e] decent work opportunities for young men and women through knowledge and action”. The immediate objective of the partnership is to produce more and better labour market information specific to youth in developing countries, focusing in particular on transition paths to the labour market. The assumption is that governments and social partners in the project’s 28 target countries will be better prepared to design effective policy and programme initiatives once armed with detailed information on:
• what young people expect in terms of transition paths and quality of work;
• what employers expect in terms of young applicants;
• what issues prevent the two sides – supply and demand – from matching; and
• what policies and programmes can have a real impact.
Work4Youth target areas and countries:
Asia and the Pacific: Bangladesh, Cambodia, Nepal, Samoa, Viet Nam
Eastern Europe and Central Asia: Armenia, Kyrgyzstan, the former Yugoslav Republic of Macedonia, the Republic of Moldova, the Russian Federation, Ukraine
Latin America and the Caribbean: Brazil, Colombia, El Salvador, Jamaica, Peru
Middle East and North Africa: Egypt, Jordan, Occupied Palestinian Territory, Tunisia
Sub-Saharan Africa: Benin, Liberia, Madagascar, Malawi, the United Republic of Tanzania, Togo, Uganda,
Zambia
4 www.ilo.org/w4y. National reports are currently available for Benin, Cambodia, the former Yugoslav Republic of Macedonia Liberia, Malawi, Togo and Zambia. The SWTS tabulated data will be made available from the ILOSTAT database (www.ilo.org/ilostat) since early March 2014. 5 See, for example, Chigunta, Chisup and Elder (2013), Mussa (2013) and De Mel, Elder and Vansteenkiste (2013).
7
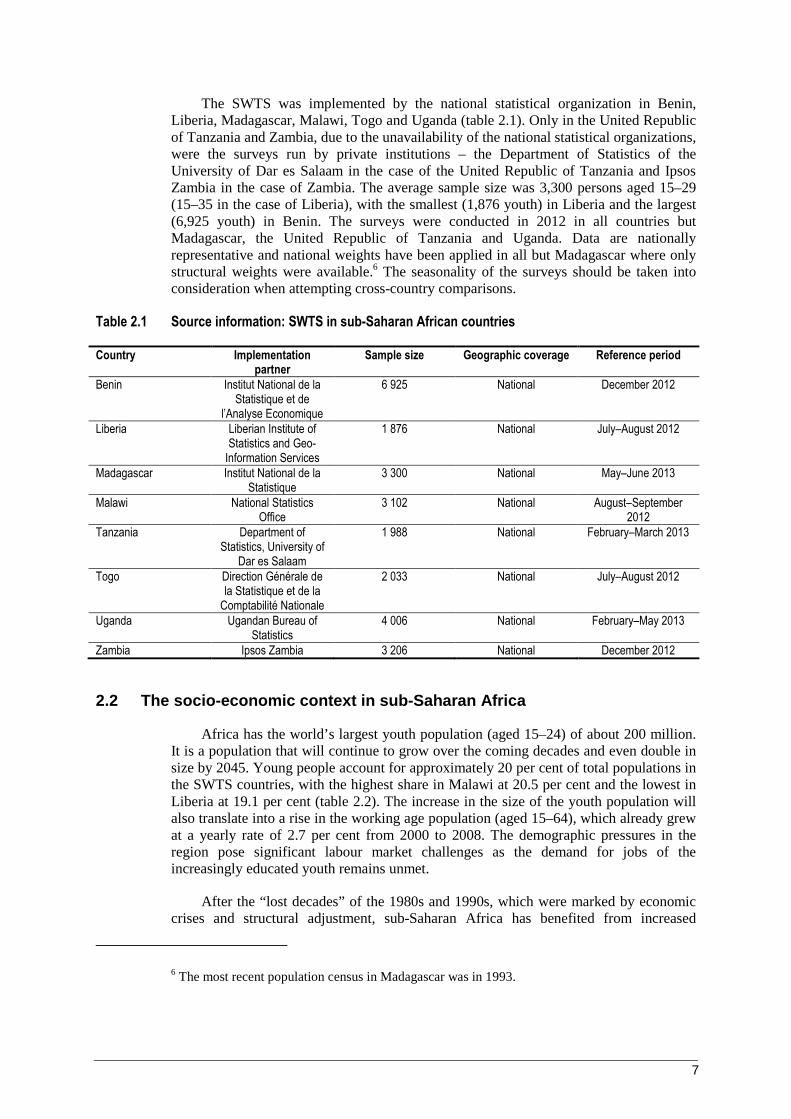
The SWTS was implemented by the national statistical organization in Benin, Liberia, Madagascar, Malawi, Togo and Uganda (table 2.1). Only in the United Republic of Tanzania and Zambia, due to the unavailability of the national statistical organizations, were the surveys run by private institutions – the Department of Statistics of the University of Dar es Salaam in the case of the United Republic of Tanzania and Ipsos Zambia in the case of Zambia. The average sample size was 3,300 persons aged 15–29 (15–35 in the case of Liberia), with the smallest (1,876 youth) in Liberia and the largest (6,925 youth) in Benin. The surveys were conducted in 2012 in all countries but Madagascar, the United Republic of Tanzania and Uganda. Data are nationally representative and national weights have been applied in all but Madagascar where only structural weights were available.6 The seasonality of the surveys should be taken into consideration when attempting cross-country comparisons.
Table 2.1 Source information: SWTS in sub-Saharan African countries
Country Implementation partner
Sample size Geographic coverage Reference period
Benin Institut National de la Statistique et de
l’Analyse Economique
6 925 National December 2012
Liberia Liberian Institute of Statistics and Geo-
Information Services
1 876 National July–August 2012
Madagascar Institut National de la Statistique
3 300 National May–June 2013
Malawi National Statistics Office
3 102 National August–September 2012
Tanzania Department of Statistics, University of
Dar es Salaam
1 988 National February–March 2013
Togo Direction Générale de la Statistique et de la
Comptabilité Nationale
2 033 National July–August 2012
Uganda Ugandan Bureau of Statistics
4 006 National February–May 2013
Zambia Ipsos Zambia 3 206 National December 2012
2.2 The socio-economic context in sub-Saharan Africa
Africa has the world’s largest youth population (aged 15–24) of about 200 million. It is a population that will continue to grow over the coming decades and even double in size by 2045. Young people account for approximately 20 per cent of total populations in the SWTS countries, with the highest share in Malawi at 20.5 per cent and the lowest in Liberia at 19.1 per cent (table 2.2). The increase in the size of the youth population will also translate into a rise in the working age population (aged 15–64), which already grew at a yearly rate of 2.7 per cent from 2000 to 2008. The demographic pressures in the region pose significant labour market challenges as the demand for jobs of the increasingly educated youth remains unmet.
After the “lost decades” of the 1980s and 1990s, which were marked by economic crises and structural adjustment, sub-Saharan Africa has benefited from increased
6 The most recent population census in Madagascar was in 1993.
8
economic growth since 2000. The positive trend has continued in the region despite the global economic crisis and political unrest. The real gross domestic product (GDP) growth rate declined to 2.2 per cent in 2009 but recovered to 4.6 per cent in 2010 and reached 5.0 per cent in 2012 (Economic Commission for Africa [ECA], 2013, pp. 6–8). Economic growth is driven in part by domestic demand, private consumption and investment, and has occurred in both resource-rich and resource-poor countries.
Table 2.2 Share of youth (15–24*) in total population in SWTS countries, 2012 (%)
Country %
Benin 19.8
Liberia 19.1
Madagascar 20.3
Malawi 20.5
Tanzania 19.5
Togo 20.2
Uganda 20.2
Zambia 19.7
Average 19.9
*The age band 15-29 is not available from the source.
Source: AfDB Statistical Data Portal, 2013.
The eight countries in which the SWTS was implemented are fairly representative of the situation in sub-Saharan Africa. Indeed, in a context of global recession, all economies are seen to be expanding (table 2.3). GDP growth is more moderate in the francophone countries compared to the English-speaking countries. Liberia, despite its low GDP per capita, shows the highest growth rate of the countries at 7.4 per cent. Looking to the future, growth prospects are positive in all eight countries, with Zambia taking the lead with a strong expected annual GDP growth of 7.6 per cent between 2013 and 2014 (figure 2.1).
Table 2.3 Macroeconomic indicators, 2012
Country
Population (million)
Area (thousands
of km²)
Population density (pop./km²)
GDP (PPA)
GDP per capita (PPA)
GDP growth rate (yearly
average from 2004–12) (%)
Benin 9 352 115 81 15 505 1 658 3.5
Liberia 4 245 111 38 2 693 635 7.4
Madagascar 21 929 587 37 21 372 975 3.1
Malawi 15 883 118 134 14 581 918 5.6
Tanzania 47 656 947 50 73 498 1 542 6.9
Togo 6 283 57 111 6 899 1 098 3.3
Uganda 35 621 242 147 50 591 1 420 6.9
Zambia 13 884 753 18 23 676 1 705 6.3
Africa 1 068 444 30 066 36 3 359 148 3 204 5.4
Source: OECD StatExtracts, 2013.
9
Figure 2.1 Real GDP growth, 2013–14 (%)
Source: AfDB et al., 2013, figure 1.9.
The most important source of employment in Africa continues to be the agricultural sector. In 2012, between 65 and 80 per cent of the economically active population in SWTS countries was employed in agriculture, except in Togo and Benin, where it accounted for approximately 44 per cent. Despite the labour intensity of the agricultural sector, the contribution to GDP is underwhelming and reflective of the low levels of productivity and wages in agriculture as a whole. Exceptions are Liberia and Togo, where 73.4 and 46.2 per cent of GDP, respectively, came from agriculture in 2012. In the rest of the SWTS countries, the average contribution of the sector to GDP was 28.1 per cent.
The industrial sector played a more prominent role than agriculture in GDP contribution in both Zambia and Uganda, amounting to 41.2 and 27.3 per cent, respectively, while in other countries it averaged 18.2 per cent. In all eight countries, manufacturing was a minor contributor to GDP, ranging from 6.0 per cent in Liberia to 13.7 per cent in Madagascar in 2012 (AfDB Statistical Data Portal, 2013). Despite its growth potential in a labour-rich region, expansion of the manufacturing sector continues to be constrained by infrastructure challenges, including unreliable and expensive energy supply, red tape, expensive investment financing and foreign competition (AfDB et al., 2013, p. 28).
External financial flows, which comprise Oversees Development Assistance (ODA), Foreign Direct Investment (FDI), portfolio investment and remittances, continue to play an important role in sub-Saharan African economies. In 2012, for the African continent, external financial flows reached an all-time high of US$186.3 billion, and for the first time remittances became the largest external financial flow, surpassing both ODA and FDI. Four SWTS sub-Saharan African countries appear on the African Economic Outlook’s list of top 15 African countries in terms of shares of remittances to GDP: the average share of remittances to GDP (2005–2011) was 10.3 per cent in Togo, 7.3 per cent in Liberia, 4.3 per cent in Uganda and 3.6 per cent in Benin (AfDB et al., 2013, table 2.3).
Reducing the reliance on foreign aid in favour of domestic revenues from taxes is a signal of more sustainable development and increases the legitimacy of governments. According to data from the African Economic Outlook, only Liberia among the eight sub-Saharan African countries continued to receive a greater share of its national revenue
3.5
4.3
5.2
5.4
5.8
6.5
7.0
7.6
0 2 4 6 8 10
Madagascar
Benin
Uganda
Togo
Malawi
Liberia
Tanzania
Zambia
Percentage
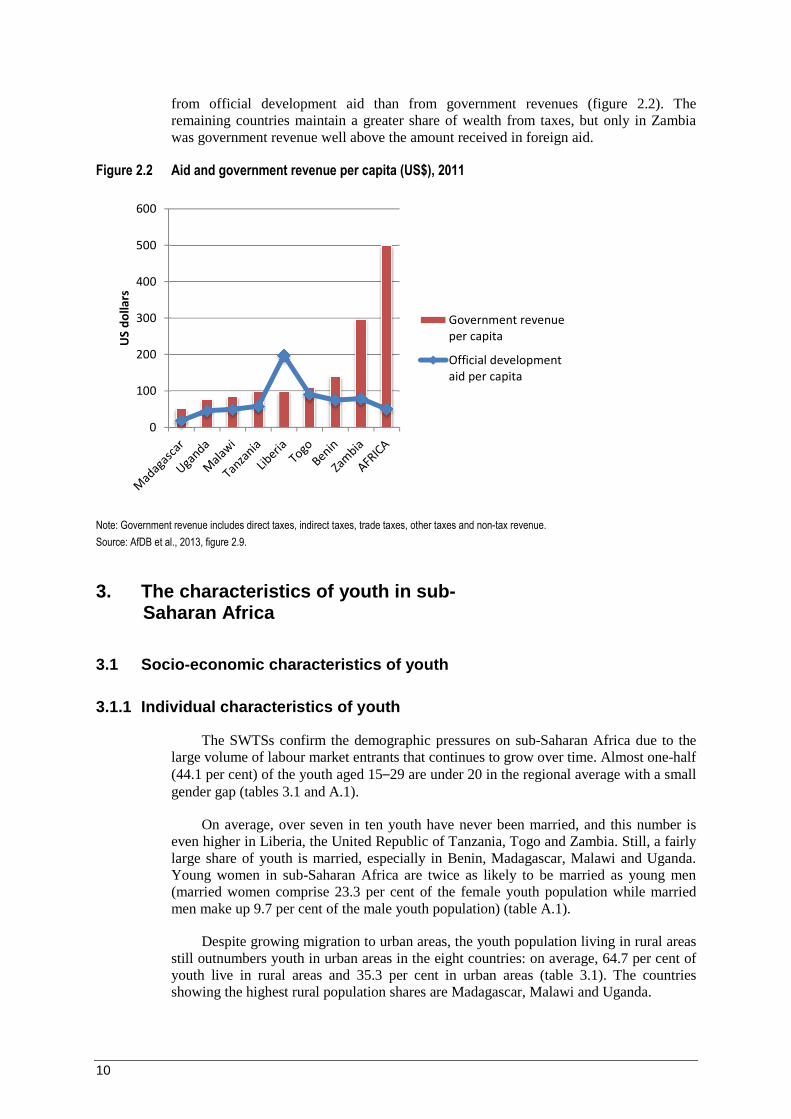
10
from official development aid than from government revenues (figure 2.2). The remaining countries maintain a greater share of wealth from taxes, but only in Zambia was government revenue well above the amount received in foreign aid.
Figure 2.2 Aid and government revenue per capita (US$), 2011
Note: Government revenue includes direct taxes, indirect taxes, trade taxes, other taxes and non-tax revenue.
Source: AfDB et al., 2013, figure 2.9.
3. The characteristics of youth in sub-Saharan Africa
3.1 Socio-economic characteristics of youth
3.1.1 Individual characteristics of youth
The SWTSs confirm the demographic pressures on sub-Saharan Africa due to the large volume of labour market entrants that continues to grow over time. Almost one-half (44.1 per cent) of the youth aged 15–29 are under 20 in the regional average with a small gender gap (tables 3.1 and A.1).
On average, over seven in ten youth have never been married, and this number is even higher in Liberia, the United Republic of Tanzania, Togo and Zambia. Still, a fairly large share of youth is married, especially in Benin, Madagascar, Malawi and Uganda. Young women in sub-Saharan Africa are twice as likely to be married as young men (married women comprise 23.3 per cent of the female youth population while married men make up 9.7 per cent of the male youth population) (table A.1).
Despite growing migration to urban areas, the youth population living in rural areas still outnumbers youth in urban areas in the eight countries: on average, 64.7 per cent of youth live in rural areas and 35.3 per cent in urban areas (table 3.1). The countries showing the highest rural population shares are Madagascar, Malawi and Uganda.
0
100
200
300
400
500
600
US
do
lla
rs
Government revenue
per capita
Official development
aid per capita
11
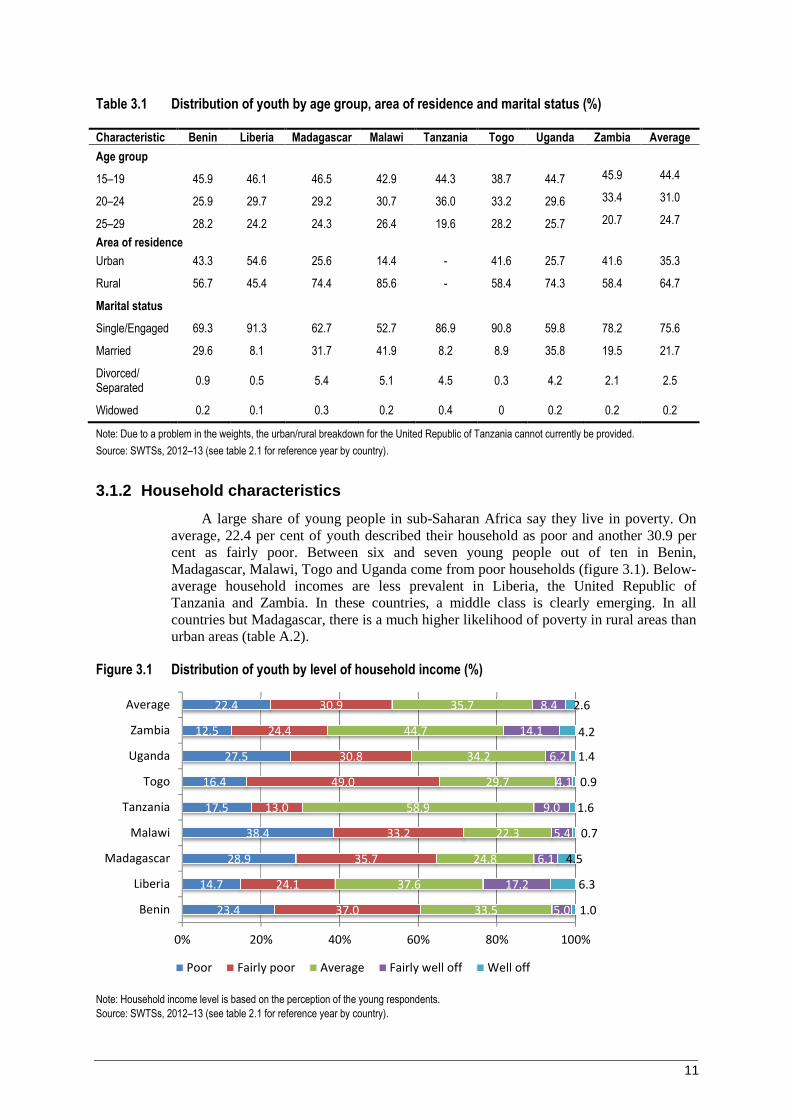
Table 3.1 Distribution of youth by age group, area of residence and marital status (%)
Characteristic Benin Liberia Madagascar Malawi Tanzania Togo Uganda Zambia Average
Note: Due to a problem in the weights, the urban/rural breakdown for the United Republic of Tanzania cannot currently be provided.
Source: SWTSs, 2012–13 (see table 2.1 for reference year by country).
3.1.2 Household characteristics
A large share of young people in sub-Saharan Africa say they live in poverty. On average, 22.4 per cent of youth described their household as poor and another 30.9 per cent as fairly poor. Between six and seven young people out of ten in Benin, Madagascar, Malawi, Togo and Uganda come from poor households (figure 3.1). Below-average household incomes are less prevalent in Liberia, the United Republic of Tanzania and Zambia. In these countries, a middle class is clearly emerging. In all countries but Madagascar, there is a much higher likelihood of poverty in rural areas than urban areas (table A.2).
Figure 3.1 Distribution of youth by level of household income (%)
Note: Household income level is based on the perception of the young respondents.
Source: SWTSs, 2012–13 (see table 2.1 for reference year by country).
23.4
14.7
28.9
38.4
17.5
16.4
27.5
12.5
22.4
37.0
24.1
35.7
33.2
13.0
49.0
30.8
24.4
30.9
33.5
37.6
24.8
22.3
58.9
29.7
34.2
44.7
35.7
5.0
17.2
6.1
5.4
9.0
4.1
6.2
14.1
8.4
1.0
6.3
4.5
0.7
1.6
0.9
1.4
4.2
2.6
0% 20% 40% 60% 80% 100%
Benin
Liberia
Madagascar
Malawi
Tanzania
Togo
Uganda
Zambia
Average
Poor Fairly poor Average Fairly well off Well off
12
3.2 Educational attainment
3.2.1 Access to education
Looking at the status of education of young people in sub-Saharan Africa, the average current school participation rate of the youth population is 41.8 per cent, a phenomenon that is most marked in Benin and Liberia where between five and six out of ten young people are currently enrolled in school (figure 3.2). Still, a significant portion of youth in the SWTS countries has had no schooling at all; between 1.5 and 28.8 per cent of young people in the eight countries have never attended school. Add to this the share who have some schooling but left before completion and the number rises to between 30 and almost 60 per cent (the United Republic of Tanzania is the outlier here with only 9.7 per cent of its youth population falling outside the educational system). The probability of employment for these young people is compromised, especially in jobs requiring a minimum level of general knowledge.
Figure 3.2 Distribution of youth by current status in education (%)
Source: SWTSs, 2012–13 (see table 2.1 for reference year by country).
The disadvantages regarding access to education consistently affect young women more than young men (figure 3.3). In all the countries but Uganda, the share of young women who never attended school or left school before completion is higher than the share of young men (47.3 per cent for young women, on average, compared to 36.5 per cent of young men). The gender gaps in education access are particularly strong in Benin, Malawi and Togo.
Asked why they never attended school, most youth cited economic reasons – the inability to cover school fees or the need to work to contribute to the household income (45.0 per cent, on average) or the refusal of parents, perhaps also relating to economic reasons (24.4 per cent, on average) (table 3.2). Other common reasons include a lack of interest in school (particularly in Madagascar and Malawi) and the distance (particularly in Madagascar and Zambia). Young women are more likely than young men to be denied by their parents the right to attend school.
28.8
10.6
14.8
4.4
1.5
15.9
4.2
2.8
10.4
18.4
19.9
22.1
54.0
8.2
42.6
47.1
30.0
30.3
49.3
60.3
29.1
36.2
39.8
39.9
39.5
40.4
41.8
3.5
8.8
34.1
5.4
50.5
1.6
9.2
26.8
17.5
0% 20% 40% 60% 80% 100%
Benin
Liberia
Madagascar
Malawi
Tanzania
Togo
Uganda
Zambia
Average
Never attended school
Left school before completion
Currently attending school
Completed education
13
Figure 3.3 Share of youth population with no education or incomplete education and youth with completed education by sex (%)
Source: SWTSs, 2012–13 (see table 2.1 for reference year by country).
Table 3.2 Distribution of youth with no schooling by reason and sex (%)
Country Sex Lack of interest
To start work
To get married
Parents refusal
Economic reasons
Distance of school
Other
Benin Total 14.1 2.0 3.4 36.8 33.6 8.2 1.9
Female 13.7 1.6 4.8 38.8 30.8 8.2 2.1
Male 15.0 2.8 0.5 32.8 39.3 8.3 1.3
Liberia Total 4.3 0.3 1.2 13.4 60.8 1.3 18.6
Female 5.5 0.0 1.2 16.2 60.2 1.2 15.8
Male 0.1 1.5 1.3 3.8 62.8 1.9 28.5
Madagascar Total 22.8 0.2 0.4 10.4 44.6 15.6 6.1
Female 20.9 0.3 0.7 13.2 47.0 14.0 3.9
Male 25.3 0.0 0.0 6.5 41.2 17.8 9.1
Malawi Total 30.0 0.7 … 20.5 42.0 1.2 5.7
Female 26.2 1.0 … 21.4 44.8 1.8 4.9
Male 38.4 0.0 … 18.3 35.9 0.0 7.4
Tanzania Total 9.9 7.5 … 26.6 45.4 1.5 9.1
Female 10.4 0.0 … 40.0 35.2 0.7 13.7
Male 9.4 17.1 … 9.4 58.5 2.5 3.2
Togo Total 10.9 0.3 0.3 48.8 29.4 5.2 5.2
Female 9.6 0.4 0.4 53.6 25.7 5.5 4.8
Male 15.0 0.0 0.0 33.2 41.3 4.1 6.4
Uganda Total 6.1 … 0.8 25.3 56.3 1.1 10.4
Female 11.1 … 0.0 29.5 45.6 0 13.8
Male 3.3 … 1.2 22.9 62.5 1.7 8.5
Zambia Total 17.7 2.9 6.3 13.4 47.6 12.0 …
Female 17.9 4.4 9.5 14.9 45.2 8.0 …
Male 17.4 0.0 0.3 10.6 52.2 19.5 …
Average Total 14.5 1.7 1.6 24.4 45.0 5.8 7.1
Female 14.4 1.0 2.1 28.5 41.8 4.9 7.4
Male 15.5 2.7 0.4 17.2 49.2 7.0 8.1
… = not available.
Source: SWTSs, 2012–13 (see table 2.1 for reference year by country).
58
.9
35
.7
35
.2
25
.1
51
.9
45
.5 68
.5
47
.3
10
.8
8.8
70
.0
44
.7
45
.1 57
.0
37
.9
27
.6 47
.3
36
.5
41
.1
64
.3
63
.9
74
.9
48
.1
54
.5 31
.5
52
.7
89
.2
91
.2
30
.0
55
.3
54
.9 43
.0
62
.1
72
.4 52
.6
63
.5
0
10
20
30
40
50
60
70
80
90
100
Fe
ma
le
Ma
le
Fe
ma
le
Ma
le
Fe
ma
le
Ma
le
Fe
ma
le
Ma
le
Fe
ma
le
Ma
le
Fe
ma
le
Ma
le
Fe
ma
le
Ma
le
Fe
ma
le
Ma
le
Fe
ma
le
Ma
le
Benin Liberia MadagascarMalawi Tanzania Togo Uganda Zambia Average
%
Completed education or currently attending school
Never attended or left before completion of school
14
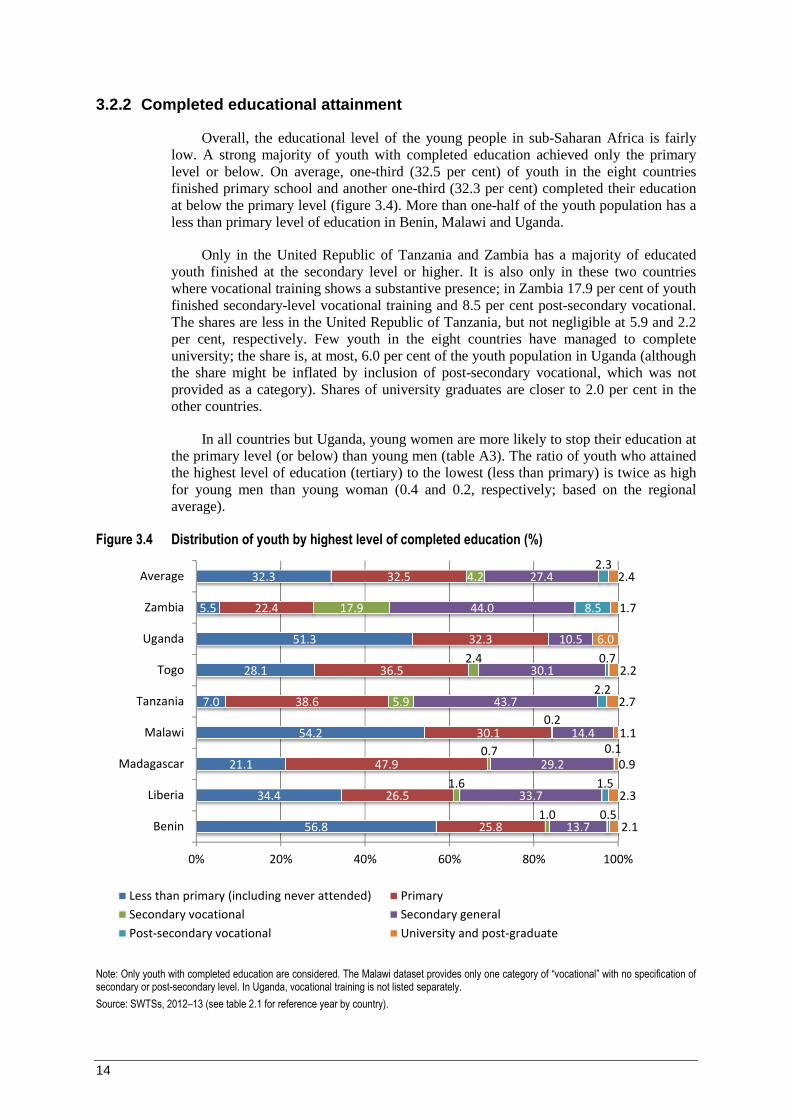
3.2.2 Completed educational attainment
Overall, the educational level of the young people in sub-Saharan Africa is fairly low. A strong majority of youth with completed education achieved only the primary level or below. On average, one-third (32.5 per cent) of youth in the eight countries finished primary school and another one-third (32.3 per cent) completed their education at below the primary level (figure 3.4). More than one-half of the youth population has a less than primary level of education in Benin, Malawi and Uganda.
Only in the United Republic of Tanzania and Zambia has a majority of educated youth finished at the secondary level or higher. It is also only in these two countries where vocational training shows a substantive presence; in Zambia 17.9 per cent of youth finished secondary-level vocational training and 8.5 per cent post-secondary vocational. The shares are less in the United Republic of Tanzania, but not negligible at 5.9 and 2.2 per cent, respectively. Few youth in the eight countries have managed to complete university; the share is, at most, 6.0 per cent of the youth population in Uganda (although the share might be inflated by inclusion of post-secondary vocational, which was not provided as a category). Shares of university graduates are closer to 2.0 per cent in the other countries.
In all countries but Uganda, young women are more likely to stop their education at the primary level (or below) than young men (table A3). The ratio of youth who attained the highest level of education (tertiary) to the lowest (less than primary) is twice as high for young men than young woman (0.4 and 0.2, respectively; based on the regional average).
Figure 3.4 Distribution of youth by highest level of completed education (%)
Note: Only youth with completed education are considered. The Malawi dataset provides only one category of “vocational” with no specification of secondary or post-secondary level. In Uganda, vocational training is not listed separately.
Source: SWTSs, 2012–13 (see table 2.1 for reference year by country).
56.8
34.4
21.1
54.2
7.0
28.1
51.3
5.5
32.3
25.8
26.5
47.9
30.1
38.6
36.5
32.3
22.4
32.5
1.0
1.6
0.7
0.2
5.9
2.4
17.9
4.2
13.7
33.7
29.2
14.4
43.7
30.1
10.5
44.0
27.4
0.5
1.5
0.1
2.2
0.7
8.5
2.3
2.1
2.3
0.9
1.1
2.7
2.2
6.0
1.7
2.4
0% 20% 40% 60% 80% 100%
Benin
Liberia
Madagascar
Malawi
Tanzania
Togo
Uganda
Zambia
Average
Less than primary (including never attended) Primary
Secondary vocational Secondary general
Post-secondary vocational University and post-graduate
15
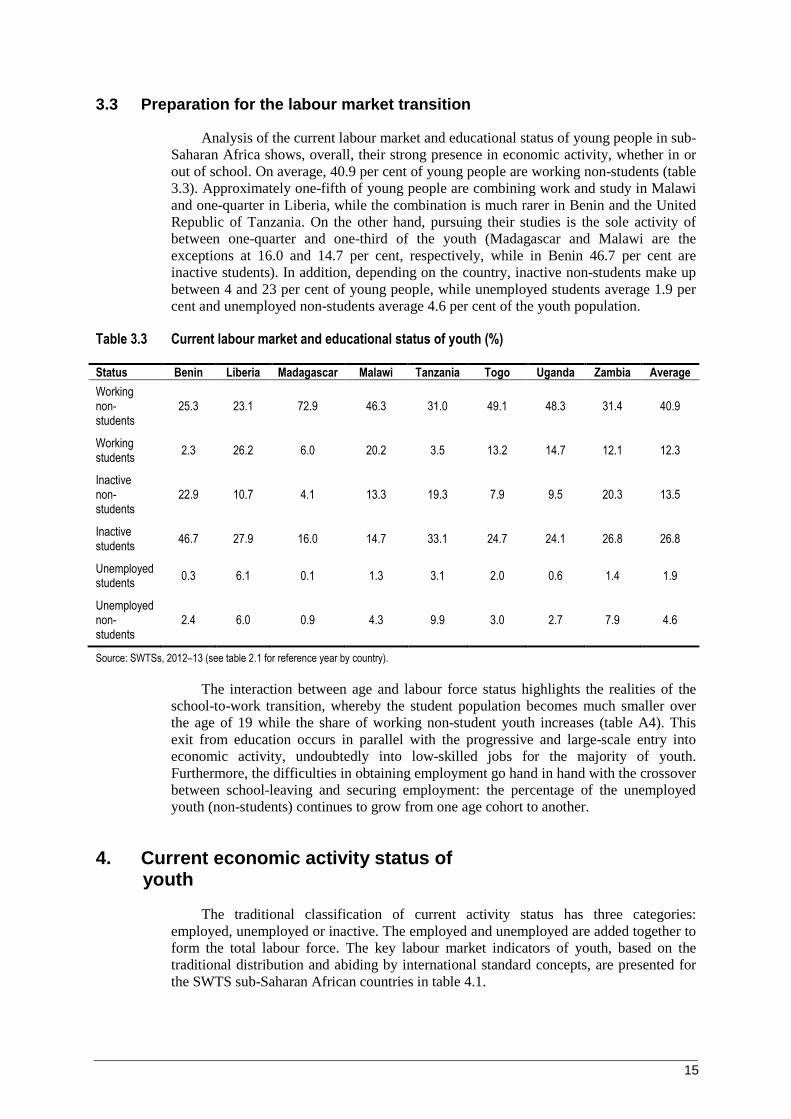
3.3 Preparation for the labour market transition
Analysis of the current labour market and educational status of young people in sub-Saharan Africa shows, overall, their strong presence in economic activity, whether in or out of school. On average, 40.9 per cent of young people are working non-students (table 3.3). Approximately one-fifth of young people are combining work and study in Malawi and one-quarter in Liberia, while the combination is much rarer in Benin and the United Republic of Tanzania. On the other hand, pursuing their studies is the sole activity of between one-quarter and one-third of the youth (Madagascar and Malawi are the exceptions at 16.0 and 14.7 per cent, respectively, while in Benin 46.7 per cent are inactive students). In addition, depending on the country, inactive non-students make up between 4 and 23 per cent of young people, while unemployed students average 1.9 per cent and unemployed non-students average 4.6 per cent of the youth population.
Table 3.3 Current labour market and educational status of youth (%)
Status Benin Liberia Madagascar Malawi Tanzania Togo Uganda Zambia Average
Working non-students
25.3 23.1 72.9 46.3 31.0 49.1 48.3 31.4 40.9
Working students
2.3 26.2 6.0 20.2 3.5 13.2 14.7 12.1 12.3
Inactive non-students
22.9 10.7 4.1 13.3 19.3 7.9 9.5 20.3 13.5
Inactive students
46.7 27.9 16.0 14.7 33.1 24.7 24.1 26.8 26.8
Unemployed students
0.3 6.1 0.1 1.3 3.1 2.0 0.6 1.4 1.9
Unemployed non-students
2.4 6.0 0.9 4.3 9.9 3.0 2.7 7.9 4.6
Source: SWTSs, 2012–13 (see table 2.1 for reference year by country).
The interaction between age and labour force status highlights the realities of the school-to-work transition, whereby the student population becomes much smaller over the age of 19 while the share of working non-student youth increases (table A4). This exit from education occurs in parallel with the progressive and large-scale entry into economic activity, undoubtedly into low-skilled jobs for the majority of youth. Furthermore, the difficulties in obtaining employment go hand in hand with the crossover between school-leaving and securing employment: the percentage of the unemployed youth (non-students) continues to grow from one age cohort to another.
4. Current economic activity status of youth
The traditional classification of current activity status has three categories: employed, unemployed or inactive. The employed and unemployed are added together to form the total labour force. The key labour market indicators of youth, based on the traditional distribution and abiding by international standard concepts, are presented for the SWTS sub-Saharan African countries in table 4.1.
16
In most countries under consideration, the volume of working youth is high: on average, one-half (53.2 per cent) of the young people are employed. The range is from 27.6 per cent in Benin, a reflection of the high numbers of youth enrolled in school (and not combining school and work), to 78.9 per cent in Madagascar, reflecting the vast number of working poor in the country’s dominant rural areas. The trends are also reflected in the youth labour force participation rates, which are low in Benin at 30.4 per cent, high in Madagascar at 79.9 per cent, and average 59.7 per cent among all the countries.
Table 4.1 Key youth labour market indicators – traditional distribution by country and sex (%)
Sex Country Distribution of youth population (%) Labour force
participation rate (%)
Youth unemployment
rate (%) Employed Unemployed Inactive
Total Benin 27.6 2.8 69.7 30.4 9.1
Liberia 49.3 12.1 38.6 61.4 19.8
Madagascar 78.9 1.0 20.1 79.9 1.3
Malawi 66.5 5.6 27.9 72.1 7.8
Tanzania 34.5 13.1 52.4 47.6 27.5
Togo 62.4 5.0 32.6 67.4 7.5
Uganda 63.1 3.3 33.6 66.4 5.0
Zambia 43.5 9.4 47.2 52.8 17.7
Average 53.2 6.5 40.3 59.7 12.0
Male Benin 23.9 3.3 72.8 27.3 12.3
Liberia 54.9 9.8 35.3 64.7 15.1
Madagascar 79.2 0.9 19.9 80.1 1.1
Malawi 73.2 4.3 22.5 77.5 5.6
Tanzania 32.8 12.9 54.3 45.7 28.3
Togo 59.5 5.7 34.8 65.2 8.8
Uganda 65.2 2.9 31.9 68.1 4.2
Zambia 49.0 9.6 41.4 58.6 16.4
Average 54.7 6.2 39.1 60.9 11.5
Female Benin 31.4 2.2 66.6 33.6 6.5
Liberia 44.4 14.2 41.5 58.5 24.2
Madagascar 78.5 1.2 20.3 79.7 1.5
Malawi 60.3 6.8 32.9 67.1 10.1
Tanzania 36.2 13.2 50.5 49.5 26.8
Togo 64.8 4.5 30.7 69.3 6.4
Uganda 61.1 3.7 35.2 64.8 5.7
Zambia 38.1 9.1 52.8 47.2 19.2
Average 51.9 6.8 41.3 58.7 12.5
Source: SWTSs, 2012–13 (see table 2.1 for reference year by country).
The share of the unemployed in the youth population (strict definition) averages 6.5 per cent among the countries. The outliers here are Liberia and the United Republic of Tanzania with higher shares of youth unemployed at 12.1 and 13.1 per cent, respectively,
17
and Madagascar, with an extremely low share of 1.0 per cent. The youth unemployment rates (strict definition) remain below 10 per cent in Benin, Madagascar (the lowest, at 1.3 per cent), Malawi, Togo and Uganda, but are nearly double in Liberia and Zambia, and is the highest in the United Republic of Tanzania (at 27.5 per cent). The average youth unemployment rate for the eight countries is 12.0 per cent, which is slightly lower than the ILO’s estimate for the global youth unemployment rate of 12.4 per cent in 2012, and slightly higher than the ILO’s regional estimate for youth aged 15–24 in sub-Saharan Africa of 11.7 per cent (ILO, 2013).
Within the framework of the SWTS analyses, the ILO proposes a more detailed classification of youth employment to reflect areas of underutilization and the quality of employment.7 In table 4.2 the youth populations are classified into four main categories (with a further subdivision of inactive youth) as follows:
a. regular employment, defined as wage and salaried workers (employees) holding a contract of greater than 12 months’ duration, plus self-employed youth with employees (employers); this category can be considered as the ideal employment arrangement, although section 5.3.1 demonstrates that even having a “regular” job is not a guarantee of good quality employment;
b. irregular employment, defined as wage and salaried workers (employees) holding a contract of limited duration, i.e. set to terminate prior to 12 months, self-employed youth with no employees (own-account workers) and contributing family workers; young people in this category almost certainly fall outside of the framework of standard employment relationships;
c. unemployed (relaxed definition), defined as persons currently without work and available to take up work in the week prior to the reference period;
d. inactive youth, which is further divided into two sub-categories: those who are inactive and in school (“inactive students”) and those who are inactive and not in school (“inactive non-students”). The inactive students are considered to be investing in their education to emerge better equipped for their future labour market experience. Hence, this can tentatively be judged as a “positive” category (notwithstanding issues of skills mismatch as discussed in 5.3.7). The inactive non-students have chosen to be outside of the labour market for reasons other than schooling (to engage in household duties or care for children, for example) and they may or may not have the intention to (re)enter the labour market in the future (although further SWTS data analyses show that a majority of inactive non-students do state an intention to join the labour market in the future in most countries). Those who say they intend to work in the future have some degree of labour market attachment and should thus be considered in the classification of labour (under)utilization.
7 The SWTS analytical framework was designed with an eye on the current efforts to adapt the international framework of statistics on the economically active population. The International Conference of Labour Statisticians (ICLS), held in Geneva in October 2013, adopted the “Resolution concerning statistics of work, employment and labour underutilization”. The Resolution provides guidelines on a wider set of measures than previously defined internationally, aiming specifically to enable better statistical measurement of participation of all persons in all forms of work and in all sectors of the economy while also enabling measurement of areas of labour underutilization. See, ICLS (2013).
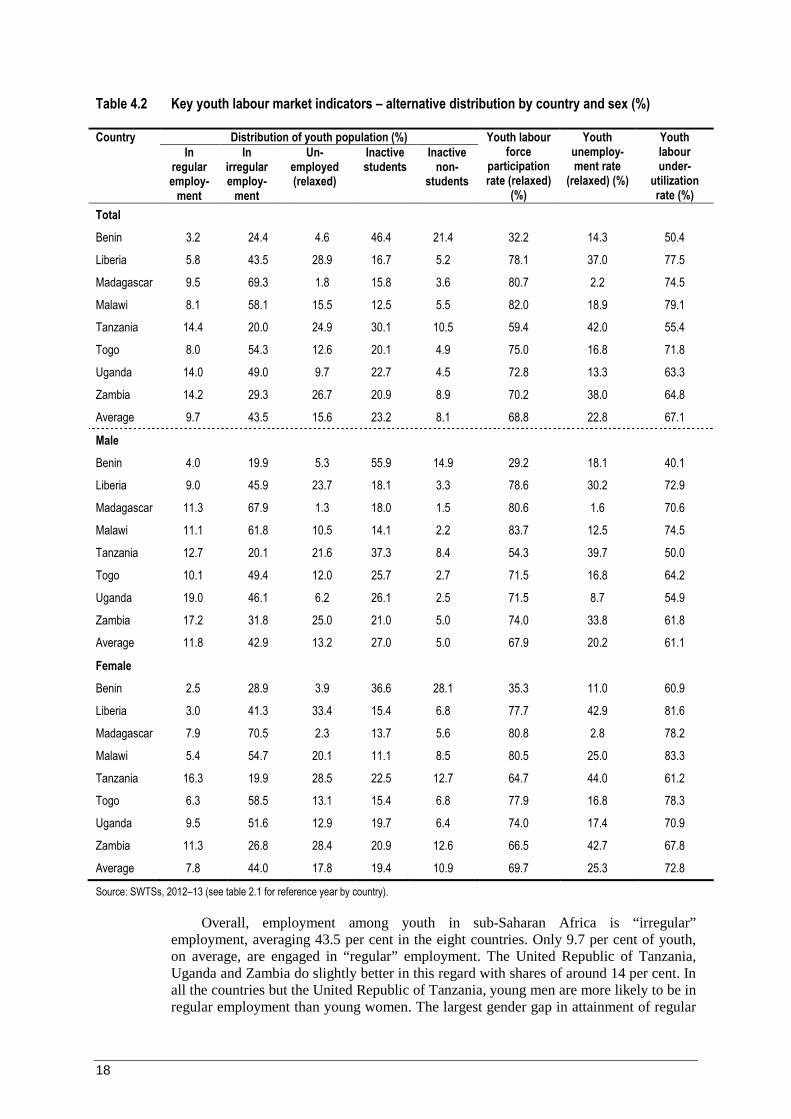
18
Table 4.2 Key youth labour market indicators – alternative distribution by country and sex (%)
Country Distribution of youth population (%) Youth labour force
participation rate (relaxed)
(%)
Youth unemploy-ment rate
(relaxed) (%)
Youth labour under-
utilization rate (%)
In regular employ-
ment
In irregular employ-
ment
Un-employed (relaxed)
Inactive students
Inactive non-
students
Total
Benin 3.2 24.4 4.6 46.4 21.4 32.2 14.3 50.4
Liberia 5.8 43.5 28.9 16.7 5.2 78.1 37.0 77.5
Madagascar 9.5 69.3 1.8 15.8 3.6 80.7 2.2 74.5
Malawi 8.1 58.1 15.5 12.5 5.5 82.0 18.9 79.1
Tanzania 14.4 20.0 24.9 30.1 10.5 59.4 42.0 55.4
Togo 8.0 54.3 12.6 20.1 4.9 75.0 16.8 71.8
Uganda 14.0 49.0 9.7 22.7 4.5 72.8 13.3 63.3
Zambia 14.2 29.3 26.7 20.9 8.9 70.2 38.0 64.8
Average 9.7 43.5 15.6 23.2 8.1 68.8 22.8 67.1
Male
Benin 4.0 19.9 5.3 55.9 14.9 29.2 18.1 40.1
Liberia 9.0 45.9 23.7 18.1 3.3 78.6 30.2 72.9
Madagascar 11.3 67.9 1.3 18.0 1.5 80.6 1.6 70.6
Malawi 11.1 61.8 10.5 14.1 2.2 83.7 12.5 74.5
Tanzania 12.7 20.1 21.6 37.3 8.4 54.3 39.7 50.0
Togo 10.1 49.4 12.0 25.7 2.7 71.5 16.8 64.2
Uganda 19.0 46.1 6.2 26.1 2.5 71.5 8.7 54.9
Zambia 17.2 31.8 25.0 21.0 5.0 74.0 33.8 61.8
Average 11.8 42.9 13.2 27.0 5.0 67.9 20.2 61.1
Female
Benin 2.5 28.9 3.9 36.6 28.1 35.3 11.0 60.9
Liberia 3.0 41.3 33.4 15.4 6.8 77.7 42.9 81.6
Madagascar 7.9 70.5 2.3 13.7 5.6 80.8 2.8 78.2
Malawi 5.4 54.7 20.1 11.1 8.5 80.5 25.0 83.3
Tanzania 16.3 19.9 28.5 22.5 12.7 64.7 44.0 61.2
Togo 6.3 58.5 13.1 15.4 6.8 77.9 16.8 78.3
Uganda 9.5 51.6 12.9 19.7 6.4 74.0 17.4 70.9
Zambia 11.3 26.8 28.4 20.9 12.6 66.5 42.7 67.8
Average 7.8 44.0 17.8 19.4 10.9 69.7 25.3 72.8
Source: SWTSs, 2012–13 (see table 2.1 for reference year by country).
Overall, employment among youth in sub-Saharan Africa is “irregular” employment, averaging 43.5 per cent in the eight countries. Only 9.7 per cent of youth, on average, are engaged in “regular” employment. The United Republic of Tanzania, Uganda and Zambia do slightly better in this regard with shares of around 14 per cent. In all the countries but the United Republic of Tanzania, young men are more likely to be in regular employment than young women. The largest gender gap in attainment of regular
19
employment is in Uganda. In all the countries, young women comprise a higher share of the inactive non-student category than young men and a lower share of the inactive student category.
Unemployment measured according to the relaxed definition8 yields significantly higher numbers than when the strict definition is applied in both the share of the youth population and the share of the labour force (i.e. the unemployment rate). The countries’ average youth unemployment rate (relaxed definition) is 22.8 per cent; Madagascar has the lowest rate (2.2 per cent) and the United Republic of Tanzania has the highest (42.0 per cent). Young women are at a disadvantage in the SWTS countries’ labour markets in terms of finding work. The unemployment rate of young women exceeds that of young men in all the countries but Benin and Togo (in the latter the rate is the same). The average female youth unemployment rate is 25.3 per cent compared to the male rate of 20.2 per cent.
The youth labour underutilization rate is a measure that aims to capture all elements of the youth population whose economic potential is not being fully realized, either because the person works in a non-standard employment arrangement or is neither employed nor in education or training (NEETs). Combining the shares of youth in irregular employment, unemployed (relaxed definition) and inactive non-students as a percentage of the youth population, the countries’ average youth labour underutilization rate stands at 67.1 per cent. The disadvantages experienced by young women show up most strongly in the labour underutilization rates. The female–male gap exceeds 10 percentage points in the youth labour underutilization rates of Benin, the United Republic of Tanzania, Togo and Uganda.
The share of the youth population classified as NEETs is high in the eight countries. The average NEET rate is 18.2 per cent: 23.0 per cent for young women and 13.1 per cent for young men (table A5). The NEET rate exceeds 25 per cent in Benin, the United Republic of Tanzania and Zambia. In all countries, the NEET rate of young women is above that of young men.
8 Young people in developing economies with widespread informal sectors are frequently without work and available to work but are not actively engaging in a job search, for example by registering at an employment centre or applying for advertised vacancies. They may not actively be seeking work because there are no formal outlets for doing so – there are no public employment services near them and few enterprises officially advertise vacancies – and/or they know their local markets and know no jobs are currently available. Under these circumstances, the person without work is more likely to wait for word-of-mouth informal connections that lead to occasional work than to engage in an active job search. Relaxing the active job search criterion from the unemployment definition can have a significant impact on results in low-income economies and is therefore the preferred measure in the SWTS analyses.
20
5. Characteristics of employed youth
5.1 Youth employment by sector
The breakdown of young sub-Saharan African workers by sector of activity shows that agriculture and service activities are the two main sectors that employ youth (figure 5.1). Indeed, while youth are employed mainly in agriculture in Madagascar and Uganda (and 60.5 per cent, respectively), in other countries including Benin, Liberia, the United Republic of Tanzania and Zambia, more than one-half of young people work in the services sector. The weak industrial base of most African countries has also affected youth employment. In fact, with the exception of Togo, where industrial activity employs 20.9 per cent of youth, on average only 11.7 per cent of young workers work in the sector.
Figure 5.1 Distribution of employed youth by aggregate sector (%)
ND = not classifiable by sector.
Source: SWTSs, 2012–13 (see table 2.1 for reference year by country).
Analysis by sex highlights a predominance of young women in service activities and young men in agriculture. However, in Uganda and, to a lesser extent, Malawi, young women’s agricultural activity is higher than that of young men, although the gap between women and men remains low (6 and 2 percentage point difference, respectively) (table A6). Moreover, although the employment of young people in the industrial sector is generally low, it mainly employs young men, and the gender gap is as high as 12 percentage points in the United Republic of Tanzania.
An examination of the branches of activities at the more detailed (1-digit) level also shows the dominance of youth employment in agriculture, with wholesale and retail trade coming in a strong second (table A7). The exceptions are Madagascar and Uganda, where the dominance of agriculture is stronger than in the other countries. What is strikingly evident from the table is the lack of young workers in modern fields such as information and communications and professional scientific activities. At most, 1.8 per cent of youth in Liberia are employed in the former branch and 2.5 per cent of youth in Benin are employed in the latter.
16
.9 33
.0
75
.3
47
.4
8.6
46
.6 60
.5
26
.2 39
.3
7.2
9.2
8.1
13
.8
11
.3
20
.9 8.0
9.3
11
.0
75
.9 55
.0
16
.8
38
.7
80
.1
32
.6
31
.3
64
.5 49
.4
0%
10%
20%
30%
40%
50%
60%
70%
80%
90%
100%
Agriculture Industry Services ND
21
5.2 Youth employment by occupation
The breakdown of young workers by occupational category highlights the dominance of low-skilled work in the eight countries. One-third (35.7 per cent) of young workers are engaged as skilled agricultural and fishery workers, 25.7 per cent as service and sales workers, 18.3 per cent in elementary occupations9 and 10.5 per cent in the crafts trade (table 5.1). Agricultural work is particularly dominant among youth in Madagascar (59.7 per cent), elementary occupations engage the greatest number of young workers in the United Republic of Tanzania and Zambia, and crafts work employs a greater proportion of youth in Benin, the United Republic of Tanzania and Togo than in the other countries. Less than 6 per cent of all young workers in the eight countries are hired in the higher skilled occupations – managers, professionals and associate professionals.10
Table 5.1 Youth employment by occupation (ISCO-08, %)
Occupation Benin Liberia Madag ascar
Malawi Tanzania Togo Uganda Zambia Average
Legislators, senior officials & managers
0.7 0.3 0.2 0.0 0.0 0.1 0.7 1.2 0.4
Professionals 3.0 4.4 1.7 1.6 2.2 1.3 3.3 4.8 2.8
Technicians & associate professionals
3.0 3.0 0.6 0.9 4.6 2.5 1.3 2.2 2.3
Clerks 1.4 1.0 0.6 0.4 4.9 1.7 0.3 3.3 1.7
Service workers, shop & market sales workers
26.7 30.2 8.1 33.0 29.9 26.7 19.1 32.2 25.7
Skilled agricultural & fishery workers
34.9 32.1 59.7 45.0 4.4 45.5 52.3 11.4 35.7
Craft & related trade workers
15.3 5.6 9.1 6.2 17.3 17.1 7.5 6.4 10.5
Plant & machine operators & assemblers
3.4 4.7 0.9 1.8 3.5 0.3 3.0 2.4 2.5
Elementary occupations
11.5 18.8 19.1 11.2 33.2 4.8 12.3 35.7 18.3
Armed forces 0.2 0.0 0.1 0.0 0.0 0.1 0.2 0.4 0.1
Source: SWTSs, 2012–13 (see table 2.1 for reference year by country).
9 The International Standard Classification of Occupations (ISCO-88) describes elementary occupations as those “which require the knowledge and experience necessary to perform mostly simple and routine tasks, involving the use of hand-held tools and in some cases considerable physical effort, and, with few exceptions, only limited personal initiative or judgment. The main tasks consist of selling goods in streets, door-keeping and property watching, as well as cleaning, washing, pressing, and working as labourers in the fields of mining, agriculture and fishing, construction and manufacturing”. 10 As a comparison, readers may be interested in the share of professionals among youth employment in a SWTS country in another region: the share in the former Yugoslav Republic of Macedonia was 15.9 per cent (Elder, Novkovska and Krsteva, 2013).
22
The distribution of occupations by sex show some commonalities; in most countries, young women comprise a higher share of workers in elementary occupations and service/sales work, while young men are more greatly represented among professionals, skilled agricultural workers and craftsmen (table A8). Exceptions exist in all cases, however.
5.3 Status in employment
The categorization of status in employment is important because the different groups of workers face different economic risks. Wage and salaried workers, or employees, are attached to an institution and generally receive a regular wage. They face relatively low economic risks compared to the self-employed and unpaid family workers. In general a country with a high proportion of wage and salaried workers is likely to have a strong formal economy with effective labour market institutions. The self-employed, whether own-account workers or employers, face relatively higher economic risks since their remuneration is dependent on the number of units sold or services rendered. Their incomes are subject to fluctuations and they do not have access to the entitlements made available to some wage and salaried workers. In most developing economies, most self-employed workers operate in the informal sector.
An examination of working youth by status in employment shows that a vast majority of young workers – seven in ten, on average – are self-employed (figure 5.2). Categories of self-employment include employers (3.1 per cent), own-account workers (41.9 per cent) and contributing (unpaid) family workers (26.7 per cent) (table 5.2). Inversely, the share of youth in wage or salaried employment is relatively low (22.9 per cent, on average). The share of wage and salaried young workers is comparatively high in the United Republic of Tanzania (48.1 per cent) and Zambia (39.0 per cent). An analysis by sex shows the dominance of young women as own-account workers and unpaid family workers (except in the United Republic of Tanzania where there are more male unpaid family workers). In contrast, paid employment is dominated by young men in all sub-Saharan African countries surveyed.
Figure 5.2 Shares of self-employed workers and wage and salaried workers in total youth employment population (%)
Source: SWTSs, 2012–13 (see table 2.1 for reference year by country).
75.3 77.7
86.478.4
49.3
74.3 74.5
57.6
71.7
11.6 11.7 13.020.8
48.1
14.5
24.6
39.0
22.9
0
10
20
30
40
50
60
70
80
90
100
%
Self-employed workers Wage and salaried workers
23
Table 5.2 Youth employment by status in employment and sex (%)
Status Benin Liberia Madagascar Malawi Tanzania Togo Uganda Zambia Average
Source: SWTSs, 2012–13 (see table 2.1 for reference year by country).
5.3.1 Wage and salaried employment (young employees)
Types of contractual arrangements
Wage or salaried employment is considered ideal, but results from the SWTSs show that even young workers in this status are not guaranteed secure employment. By contrast, a majority of young paid employees in the eight countries are in precarious situations regarding their contract type and access to benefits. Only one-quarter (26.8 per
24
cent, on average) of young wage and salaried workers are employed on the basis of a written contract (table 5.3). The remaining three-quarters of paid workers are bound to their employers by verbal contracts. Nevertheless, in Benin, Liberia and Madagascar, one-third benefit from a written contract.
The analysis of contract types indicates that despite the prevalence of oral contracts, a certain level of stability exists among young people in paid employment. In fact, in Malawi, the country with the lowest share of written contracts, 43.3 per cent of young wage and salaried workers are employed on the basis of a permanent contract. On average, more wage and salaried young workers hold a permanent than temporary contract (Malawi is the only exception). The situation is particularly favourable in the United Republic of Tanzania and Uganda where almost three of four young wage earners are hired with permanent contracts (table 5.3).
Regarding wage and salaried youth engaged on a temporary contract, more than two-thirds (70.2 per cent, on average) have a contractual arrangement whose length is less than 1 year. An analysis of the reasons behind the temporary nature of the contracts further reflects the insecurity of jobs for young people. A great majority are engaged in seasonal work (26.1 per cent) or occasional daily work (35.6 per cent) (table A9).
Table 5.3 Wage and salaried young workers by type of contract and duration (%)
Country Type of contract Type of contract (by duration) Length of contract (for youth with temporary contracts)
Written Oral Permanent Temporary Less than 1 year
1 year to less than 3 years
More than 3 years
Benin 34.7 65.3 58.4 41.6 45.5 33.4 21.1
Liberia 32.7 67.3 57.4 42.6 69.7 13.3 17.0
Madagascar 33.8 66.2 59.1 40.9 86.4 7.5 6.1
Malawi 14.3 85.7 43.3 56.7 89.0 7.5 3.5
Tanzania 28.1 71.9 70.8 29.2 63.8 25.2 11.0
Togo 25.0 75.0 56.6 43.4 58.7 24.8 16.6
Uganda 21.1 78.9 74.1 25.9 77.0 14.9 8.1
Zambia 24.8 75.2 55.5 44.5 71.5 19.1 9.4
Average 26.8 73.2 59.4 40.6 70.2 18.2 11.6
Source: SWTSs, 2012–13 (see table 2.1 for reference year by country).
An analysis of the access to entitlements associated with employment reflects the precarious nature of most youth’s work in the region. Even though they benefit from paid employment, most of the young wage and salaried workers do not receive additional benefits, such as paid annual leave, sick leave and health insurance. The lack of social protection relates strongly to the prevalence of the informal economy (see section 5.3.6) in the region. The entitlement most frequently granted to young workers is paid sick leave, yet only one-fifth (23.2 per cent, on average) of young employees benefit from it (table 5.4). Even fewer receive paid annual leave, maternity/paternity leave, social security coverage or other employment entitlements.
25
Table 5.4 Wage and salaried young workers by access to employment entitlements/benefits (multiple responses, %)
Entitlement/ benefit
Benin Liberia Mada- gascar
Malawi Tanzania Togo Uganda Zambia Average
Annual paid leave
21.3 17.1 24.3 9.3 22.4 13.8 11.8 13.1 16.6
Paid sick leave
25.0 27.5 34.3 11.8 31.4 16.8 19.9 19.1 23.2
Maternity/ Paternity leave
26.9 7.9 16.1 7.1 18.1 8.9 15.3 13.2 14.2
Medical insurance
17.1 28.8 31.7 5.1 14.1 7.4 8.6 11.4 15.5
Social security
16.4 26.7 13.6 3.1 9.2 6.9 7.7 12.4 12.0
Pension 17.1 8.2 11.3 6.1 12.0 7.0 6.0 9.5 9.7
Severance payment
12.6 22.8 8.7 8.3 15.3 6.1 6.5 8.9 11.2
Source: SWTSs, 2012–13 (see table 2.1 for reference year by country).
Although the conditions of their contractual and working arrangements predispose them to job insecurity, an average of 60.8 per cent of young wage earners in the countries surveyed claim to be satisfied with their contracts. An examination of the reasons for satisfaction shows that 15.3 per cent are satisfied because of the security of their job, 12.2 per cent are pleased with the level of wages and 11.7 per cent consider that their job promotes their personal development (table A.10). The most significant reason for satisfaction with the contract, although differences are slight, is the flexibility of the job (18.2 per cent). Reasons for dissatisfaction with contract situations relate mainly to the insecurity of the job (11.0 per cent) or the inconsistency of benefits (not getting the same benefits as other employees [10.1 per cent]).
5.3.2 Self-employment
In sub-Saharan Africa, self-employment is the dominant status. As seen in figure 5.2, seven in ten young workers in the region are self-employed. A minor share of the category consists of employers (3.1 per cent), the main share comprises own-account workers (41.9 per cent) and 26.7 per cent are contributing family workers. The latter is highest (greater than 30 per cent) in Liberia, Madagascar and Togo (table 5.2).
Young women are more likely to be self-employed than young men. In all countries but the United Republic of Tanzania, the share of young female contributing family workers is higher than that of young males (table 5.2). Similarly, in all countries but Madagascar, more young women are own-account workers than young men.
Self-employment can be taken up voluntarily – for example, to earn a higher income or to gain independence – or involuntarily – due to the inability to find paid work or the requirements set by the family. On average, the involuntary reasons for turning to self-employment slightly outnumber the voluntary reasons, although there are exceptions at the country level. The greater independence offered by self-employment is the reason most cited for adopting self-employment in Benin, Malawi and Togo, while the inability to find paid work was the main reason given in Liberia, the United Republic of Tanzania and Zambia (table 5.5).
26
Table 5.5 Self-employed youth by reason for taking up self-employment (%)
Reason Benin Liberia Mada-gascar
Malawi Uganda Tanzania Togo Zambia Average
Could not find paid employment
15.5 41.2 17.0 23.8 26.6 66.2 23.8 50.4 33.1
Greater independence
57.4 19.4 … 35.5 21.8 11.6 42.7 17.7 29.4
Flexibility in hours of work
2.6 9.2 … 5.0 5.4 7.1 1.1 7.3 5.4
Can earn higher income
11.0 9.2 … 9.7 13.7 9.9 20.1 9.2 11.8
Required by the family
11.5 14.5 77.4 11.7 26.7 2.6 10.6 4.6 20.0
Qualifications too weak for paid work
… … … 11.2 … 2.5 … 5.2 6.3
Other 2.0 6.6 5.7 3.1 5.8 2.5 1.7 5.6 4.1
… = not available
Source: SWTSs, 2012–13 (see table 2.1 for reference year by country).
Table 5.6 Self-employed youth by main challenge to doing business (%)
Challenge Benin Liberia Mada- gascar
Malawi Tanzania Togo Uganda Zambia Average
Insufficient financial resources
63.8 73.0 30.6 20.6 45.7 57.6 23.1 49.8 45.5
Insufficient quality of staff
2.4 0.2 1.4 0.5 2.7 1.7 1.1 2.3 1.5
Insufficient (personal) business expertise
1.0 1.3 1.5 0.9 4.9 3.1 0.4 1.2 1.8
Legal regulations
0.5 1.2 0.5 0.5 4.5 … 0.6 2.6 1.5
Shortages of raw materials (breakdowns in the supply chain)
2.5 4.0 5.4 9.3 7.0 6.3 4.8 7.6 5.9
Labour shortage
1.3 5.1 2.4 1.3 1.8 2.0 7.7 2.4 3.0
Political uncertainties
0.4 … 0.1 … 0.3 0.3 0.4 0.1 0.3
Access to technology
4.9 2.1 2.7 2.3 1.2 1.3 1.1 0.3 2.0
Product development
1.9 1.1 18.2 1.0 0.6 4.8 1.6 1.0 3.8
Competition in the market
16.0 3.9 17.5 8.4 12.4 11.8 10.2 25.9 13.3
Other 5.4 8.0 19.8 55.2 18.9 11.2 48.9 6.8 21.8
… = not available
Source: SWTSs, 2012–13 (see table 2.1 for reference year by country).
27
The analysis of the principal sources of financing for self-employed youth shows that only a small amount of capital is required to launch such activities: between one-fifth and one third of young self-employed workers in the surveyed countries are involved in an activity that does not require any financing (table A.11). This reveals a glimpse of the scale of activities in question and hints at the precariousness of such work in providing a steady income. In most of the SWTS countries, a majority of self-employed youth in all countries start their business using their own savings (exceptions are Liberia and Zambia where a slightly higher share used money from family and friends). Very few receive financial assistance from formal institutions like banks or microfinance institutions. At most, 8.6 per cent of Tanzanian youth received funds from microfinance institutions. In Liberia, 7.8 per cent of self-employed youth received financial assistance from non-governmental organizations (NGOs) or the donor community.
The low level of capital characterizing the activities of young self-employed workers is even more marked when the method of financing working capital is taken into consideration: when working capital is needed, it is generally provided by the meagre savings of young people or through the support of their families. One-half or more of self-employed youth in Benin, Liberia, Togo and Zambia cited the lack of access to financial resources as the principal challenge to doing business (table 5.6). Secondary (and related) challenges relate to the difficulty of competing in the market and shortages of raw materials.
5.3.3 Working hours
In the analysis of working hours, the working student populations are excluded since they would tend to bias the results towards short working time (as they combine work and studies). In sub-Saharan Africa, more non-student youth work more than 30 hours per week (full time) than work less than 30 hours per week (part time) (figure 5.3). Only in Zambia is the distribution of working hours close to even in these categories (with 46.9 per cent in part-time work and 53.1 per cent in full-time work). Excessive hours – working more than 50 hours per week – is a phenomenon that impacts, on average, one-quarter (26.1 per cent) of working youth with the highest shares in the United Republic of Tanzania and Zambia. Long working hours can negatively impact the worker’s health and can increase the risk of accidents.
Figure 5.3 Share of employed non-student youth by category of weekly working hours (%)
Note: Malawi is not shown due to a large number of non-respondents. In other countries, non-respondents are excluded from the distribution.
Source: SWTSs, 2012–13 (see table 2.1 for reference year by country).
0102030405060708090
%
Short hours (<10 hrs) Part time (<30 hrs)
Full time (>30 hrs) Long hours (>50 hrs)
28
Few non-student youth work short hours, defined as less than ten hours per week, with the exception of Zambia where the share is 23.0 per cent. Part-time work can be positive when voluntary, offering youth the opportunity to combine work and household duties, for example. (The share of young female workers in part-time employment is higher than males in all countries except Liberia and the United Republic of Tanzania; see table A.12). However, when not voluntary, part-time work can be another expression of the underutilization of young workers. On average, 14.0 per cent of part-time workers state they would like to work more hours (figure 5.4). The share of involuntary part-time workers exceeds 15 per cent in the United Republic of Tanzania, Togo and Zambia.
Figure 5.4 Involuntary part-time employment (share of total youth employment, %)
Source: SWTSs, 2012–13 (see table 2.1 for reference year by country).
5.3.4 Wages
The inequality of wages is another area of concern for young workers. A majority of young workers – the calculation is only for wage and salaried workers and own-account workers – earn a monthly wage that is below the average for the eight countries. Figure 5.5 shows that 65.1 per cent of the working youth earn below-average wages. Shares are higher – approximately three-quarters of young workers – in Liberia, Malawi and Uganda.
Young men earn more than young women almost consistently across the countries in sub-Saharan Africa. On average, the wage premium of the young male wage and salaried worker is 11.8 per cent over that of the wage and salaried young female, and the young male own-account worker earns an average of 12.1 per cent more than the female (figure 5.6). Gender wage differentials (calculated as the male average monthly wage minus the female average monthly wage divided by the male wage * 100) are highest – approximately 25 per cent for the two categories of young workers together – in Benin, Madagascar and Malawi. Liberia shows a strongly negative differential among wage and salaried workers, meaning young women earn more than young men – more than 50 per cent more – and Togo shows a slight wage advantage to young female own-account workers compared to male. In general, though, the gender wage gap prevails among youth in sub-Saharan Africa.
0
2
4
6
8
10
12
14
16
18
20
%
29
Figure 5.5 Share of young workers (wage and salaried workers and own-account workers) earning below-average monthly wages (%)
Source: SWTSs, 2012–13 (see table 2.1 for reference year by country).
Figure 5.6 Gender wage differentials of working youth (average monthly wages of young wage and salaried workers and own-account workers, %)
Note: Gender wage differentials are calculated as the male average monthly wage minus the female average monthly wage divided by the male wage * 100.
Source: SWTSs, 2012–13 (see table 2.1 for reference year by country).
Finally, wages in terms of education are examined to test the hypothesis that investing in education pays off in terms of higher earning potential. The results in figure 5.7 show the average indices of the eight countries only, while the country results appear in table A.13. A clear wage premium comes with the level of education. The young wage and salaried worker with vocational secondary training can earn nearly three times as much as the young person with no education and the young own-account worker earns double with vocational secondary training. The most impressive results are for the young person with tertiary education; here it is clear that staying in school pays off. A young person with a tertiary degree can earn almost three times the wage of a youth without
58.9
73.4
54.0
74.6
65.962.5
77.4
53.8
65.1
0
10
20
30
40
50
60
70
80
90
%
-60
-40
-20
0
20
40
60
Ge
nd
er
wa
ge
dif
fere
nti
al
(%)
Wage and salaried workers Own-account workers All
30
education (more than five times for the wage and salaried youth). Results are more mixed for the own-account worker. There is little difference in the wages of young own-account workers with primary, secondary and even tertiary education; the highest wages for these workers go to those who invested in technical vocational training.
Figure 5.7 Indices of nominal average monthly wages of young workers (wage and salaried workers and own-account workers) by level of completed education (wages of youth with no education = 100)
Source: SWTSs, 2012–13 (see table 2.1 for reference year by country).
5.3.5 Job satisfaction and security
When the specific issue of the desire to change jobs is analysed more deeply, it becomes apparent that the dissatisfaction of young workers in the surveyed countries in sub-Saharan Africa goes beyond their underutilization in relation to working hours. In fact, with the exception of Benin, Madagascar and Uganda, where fewer than four in ten young people want to change jobs, this situation applies to between five and seven young people out of ten in the other sub-Saharan African countries surveyed (table 5.7).
Looking at the reasons for wanting to change jobs provides hints on what young workers want from their work. For example, on average, 41.0 per cent of those who want to change would like to receive higher wages. One-fifth (20.4 per cent) want to change because of the temporary nature of their job, and 23.1 per cent would prefer to have better working conditions. The dissatisfaction over wages is the reason cited the most in Benin, Madagascar, Malawi, the United Republic of Tanzania, Uganda and Zambia. The top reason for wanting to change job in Togo is for better working conditions and in Liberia to change for a more permanent job. The mismatch of qualifications is also shown to be bothersome to many young workers; on average, 7.7 per cent of dissatisfied young workers would change jobs to find a better use of their qualifications/skills.
0 100 200 300 400 500 600
Primary
Secondary
Vocational secondary
Tertiary
Index (no education=100)
All Own-account workers Wage and salaried workers
31
Table 5.7 Share of working youth who want to change their job and reason for wanting to change (%)
Share and reason
Benin Liberia Madagascar Malawi Tanzania Togo Uganda Zambia Average
Share ofworking youth who state a desire to change their job
28.3 65.2 35.9 68.0 75.0 51.5 36.5 76.6 54.6
Reason
Present job is temporary
27.2 36.4 6.5 14.7 20.2 22.1 6.1 30.2 20.4
Fear of losing the present job
1.5 1.2 2.1 1.3 4.6 1.5 0.8 1.8 1.8
To work more hours paid at the current rate
0.6 4.4 2.5 2.8 8.2 0.9 0.5 1.5 2.7
To have a higher pay per hour
34.4 20.5 52.6 53.1 46.6 28.6 55.6 36.8 41.0
To work less hours with a reduction in pay
0.1 0.4 0.8 0.9 1.3 0.7 0.6 0.7 0.7
To better use qualifications/skills
10.0 10.3 7.7 3.6 5.3 10.5 4.5 9.3 7.7
More convenient working time, shorter commuting time
6.0 1.1 2.4 3.4 0.3 3.5 1.8 2.5 2.6
To improve working conditions
20.3 25.8 25.4 20.3 13.4 32.3 30.2 17.3 23.1
Source: SWTSs, 2012–13 (see table 2.1 for reference year by country).
5.3.6 Informal employment
Informal employment11 is the standard condition among most youth in sub-Saharan Africa. At least eight in ten young workers in all eight SWTS countries fall into the category of informal employment (figure 5.8). Informal employment is made up of two subdivisions: workers in the informal (unregistered) sector and paid employees holding informal jobs in the formal sector. The latter do earn a salary but do not receive the other benefits, such as social security contributions or paid annual or sick leave that would
11 Informal employment is measured according to the guidelines recommended by the 17th International Conference of Labour Statisticians. The calculation applied here includes the following sub-categories of workers: (a) paid employees in “informal jobs”, i.e. jobs without a social security entitlement, paid annual leave or paid sick leave; (b) paid employees in an unregistered enterprise with size classification below five employees; (c) own-account workers in an unregistered enterprise with size classification below five employees; (d) employers in an unregistered enterprise with size classification below five employees; and (e) contributing family workers. Sub-categories (b) through (d) are used in the calculation of “employment in the informal sector”, sub-category (a) applies to “informal job in the formal sector” and sub-category (e) can fall in either grouping dependent on the registration status of the enterprises that engages the contributing family worker.
32
normally be associated with a job in the formal sector. Given the dominance of self-employment among youth in the region, it is not surprising to find that a vast majority are informally employed youth because of their engagement in informal, non-registered enterprises. At most, one-third (33.8 per cent) of informally employed youth in the United Republic of Tanzania are engaged in an informal job in the formal sector.
Figure 5.8 Youth informal employment rate and distribution of informal employment by informal workers in the formal sector and workers in the informal sector (%)
Source: SWTSs, 2012–13 (see table 2.1 for reference year by country).
With two exceptions (Liberia and Zambia), youth living in rural areas are more likely to be engaged in informal employment than youth in urban areas. Young female workers are more likely to be in informal employment than young males, this time with only one exception (Togo). Figure 5.9 demonstrates that education offers a means of escaping from informal employment. The share of informally employed youth is considerably lower among young people who have completed university education (tertiary level) than among those with lower levels of education (the United Republic of Tanzania is an exception, with the lowest informal employment rate going to youth with secondary-level education). The gaps in informal employment rates of youth with tertiary education and less than primary education are large; on average, the informality rate of working youth with tertiary education is 76.4 per cent, 16 percentage points below the rate of youth with less than primary education.12
12 For a more in-depth look at youth and informal employment, see Shehu and Nilsson (2014).
89.782.5
94.8 96.487.5 89.1
92.2 94.7
0
10
20
30
40
50
60
70
80
90
100
%
Share in informal job in
formal sector
Share in informal sector
employment
Informal employment rate
33
Figure 5.9 Youth informal employment rate by level of completed education (%)
Note: The vocational category is not available in Malawi and Uganda. Tertiary is the sum of post-secondary vocational training, university and post-graduate.
Source: SWTSs, 2012–13 (see table 2.1 for reference year by country).
5.3.7 Qualifications mismatch
Another job quality measure recommended within the SWTS analytical framework is the skills mismatch. Objectively, the skills mismatch between the job that a person does and their level of educational qualification is measured by applying the normative measure of occupational skills categories from the ISCO (ILO, 2013, p. 44). ISCO-08 includes the categorization of major occupational groups (first-digit ISCO levels) by level of education in accordance with the International Standard Classification of Education (ISCED). Table 5.8 summarizes the ISCO-based educational classification.
Table 5.8 ISCO major groups and education levels
ISCO major group Broad occupation group Education level
Less than primary (including no schooling) Primary Secondary Vocational Tertiary
34
Workers in a particular group who have the assigned level of education are considered well-matched. Those who have a higher (lower) level of education are considered overeducated (undereducated). For example, a university graduate working as a clerk (a low-skilled, non-manual occupation) is overeducated, while someone whose highest education level is secondary school but who is working as an engineer (a high-skilled non-manual occupation) is undereducated.
The results among the surveyed working youth in sub-Saharan Africa show that one-half (53.3 per cent) are undereducated for the job they do (figure 5.10). The undereducation of workers can have a negative impact on worker productivity and thus on the output of the enterprise but also, more personally, on the sense of security of the young worker. The question remains whether on-the-job training is a sufficient substitute for formal education. As many as eight in ten fall into the category of undereducated in Malawi. Overeducation is less of an issue, impacting 8.5 per cent of young workers on average (although the share rises to 25.8 per cent in Zambia) – reflecting the relatively low shares of youth with higher levels of education in the eight SWTS countries (see section 3.2.2). However, the impact of overeducation can be particularly hard on the young person involved. The phenomenon of overeducation tends to take place when an insufficient number of jobs match a certain level of education, which forces some of the degree holders to take up available work that they are subsequently overqualified for. One consequence is that overeducated young people are likely to earn less than they otherwise could have and are not making the most of their productive potential.
Figure 5.10 Share of working youth by overeducation, undereducation or matching qualifications (%)
Note: Shares are of working youth with completed education only.
Source: SWTSs, 2012–13 (see table 2.1 for reference year by country).
Figure 6.1 indicates that unemployment in the surveyed countries of sub-Saharan Africa is mainly an urban phenomenon. Unemployment impacts over 40 per cent of active populations in the urban areas of Liberia and Zambia. At the extreme, in Togo, the urban youth unemployment rate is more than four times higher than that of youth living in rural areas. The urban–rural gaps are also particularly large in Benin and Malawi. Across the eight SWTS countries, male unemployment rates are consistently lower than female rates in both rural and urban areas.
Figure 6.1 Youth unemployment rates (relaxed definition) by area of residence (%)
Note: Due to a problem in the weights, the urban/rural breakdown for the United Republic of Tanzania cannot currently be provided.
Source: SWTSs, 2012–13 (see table 2.1 for reference year by country).
Figure 6.2 illustrates the mixed results in the unemployment rates of youth by level of educational attainment in the surveyed countries of sub-Saharan Africa. On average, young secondary and vocational graduates are those most likely to be unemployed. The hope that earning a higher level degree will mean less time in the jobs queue is diluted by the fact that tertiary unemployment exceeds 20 per cent in five of the eight countries. But higher graduate unemployment is also likely to reflect the increased selectivity of young persons with higher education regarding the characteristics of the job they expect. Having invested in their education, the more highly educated are more likely to wait for a job opportunity with higher wages, higher status and/or better working conditions than the lesser educated young person.
In Liberia, Malawi, the United Republic of Tanzania, Uganda and Zambia, youth with secondary-level education have a higher unemployment rate than youth with tertiary education. In only three of the countries (Benin, Madagascar and Togo) is it the young person with the lowest level of education, that is with only primary education (less than primary is not shown but is available in table A.14), who is least likely to be unemployed.
8.2
29.6
1.4
17.2
11.4
7.7
34.9
15.8
23.2
42.4
5.5
30.4
19.3
30.9
42.4
27.7
0
5
10
15
20
25
30
35
40
45
%
Rural
Urban
36
Figure 6.2 Youth unemployment rates (relaxed definition) by level of completed education (%)
Note: The vocational category is not available in Malawi and Uganda. Tertiary is the sum of post-secondary vocational training, university and post-graduate.
Source: SWTSs, 2012–13 (see table 2.1 for reference year by country).
6.2 The job search
An analysis of the length of unemployment classifies unemployed youth by the length of their job search. As shown in table 6.1, the single largest group is youth who have been looking for jobs for 1 year or longer (long-term unemployed). The long-term unemployed represent 45.7 per cent of unemployed youth, on average. The category is particularly large in Madagascar and Liberia, where it accounts for 59.8 and 57.6 per cent of the surveyed youth in unemployment, respectively. This situation primarily concerns the most educated individuals, regardless of their sex. Long-term unemployment can have negative consequences in terms of skills and financial losses, and damaged self-esteem. The share of unemployed youth who have been searching for less than 3 months accounts for 34.6 per cent of the total.
Table 6.2 shows unemployed youth by the type of job sought. The two most sought-after types of employment are self-employment and public-sector jobs. In Uganda, more than one-half of unemployed young people are trying to establish their own enterprise or farm and Togo is not too far behind at 43.2 per cent. In Benin and Malawi, the share is one-third. In Liberia, the United Republic of Tanzania and Zambia, public employment is
15.7
34.7
1.6
22.3
27.1
9.4
12.8
34.6
19.8
26.1
30.9
2.7
22.6
50.9
13.3
18.4
41.1
25.8
46.5
50.2
12.6
36.8
24.1
37.1
34.6
42.8
25.6
10.8
10.4
22.1
32.4
11.2
28.9
23.0
0 10 20 30 40 50 60
Benin
Liberia
Madagascar
Malawi
Tanzania
Togo
Uganda
Zambia
Average
Unemployment rate (%)
Tertiary Vocational Secondary Primary
37
most sought-after type of job (by 43.7, 38.6 and 54.1 per cent of young jobseekers, respectively). Although the public sector in these countries is unlikely to see any significant expansion of employment in coming years, it remains the preference of many young people due to three factors: status, security and benefits.
Work in the private sector is the third most desired job-type. Only in Madagascar, where unemployment is much lower than in the other countries, does the majority of unemployed youth want to work in that sector. In Liberia, 10.4 per cent of the unemployed would like to work in international NGOs, which still have a large presence in the country following years of armed conflict.
Table 6.1 Unemployed youth by job search duration (%)
Duration Benin Liberia Madagascar Malawi Tanzania Togo Uganda Zambia Average
Less than 1 week
6.3 1.2 3.6 4.2 5.5 6.8 2.4 4.9 4.4
1 week to less than 1 month
3.0 6.8 14.8 14.9 14.3 19.7 8.7 18.5 12.6
1 month to less than 3 months
17.7 19.2 9.5 19.1 25.8 22.6 11.3 15.6 17.6
3 months to less than 6 months
13.9 9.6 4.0 8.0 10.8 6.9 15.5 10.8 9.9
6 months to less than 1 year
16.4 5.5 8.4 10.1 6.0 9.8 13.7 9.0 9.9
1 year or more 42.7 57.6 59.8 43.6 37.7 34.3 48.5 41.1 45.7
Note: Duration of the job search relates to the strict definition of unemployed (those who engaged in an active job search).
Source: SWTSs, 2012–13 (see table 2.1 for reference year by country).
Table 6.2 Unemployed youth by type of job sought (%)
Type of job Benin Liberia Madagascar Malawi Tanzania Togo Uganda Zambia Average
Myself (own business/farm)
37.1 24.6 21.3 33.7 29.8 43.2 54.4 16.1 32.5
Work for the government/public sector
30.0 43.7 13.8 25.4 38.6 25.6 15.0 54.1 30.8
Work for a private company
30.2 16.1 57.1 24.2 27.4 22.8 17.7 17.7 26.7
Work for an international or non-profit organization
2.3 10.4 0.0 1.7 2.7 3.1 2.5 1.8 3.1
Work for family business/farm
0.5 4.3 7.8 15.0 1.3 4.5 3.7 1.7 4.9
Other 0.0 0.9 0.0 0.0 0.4 0.8 6.7 8.6 2.2
Source: SWTSs, 2012–13 (see table 2.1 for reference year by country).
With regard to job search methods, asking informal networks of relatives and friends about employment possibilities is the most popular choice. Approaching family and friends remains the favoured job-search method by a majority of unemployed youth in six of the eight countries (table 6.3). Direct enquiry at factories, farms or other workplaces is the second most popular technique (19.2 per cent). In contrast, formal
38
jobseeking channels are used by a minority of unemployed youth. Fewer than 10 per cent of unemployed young people in the eight SWTS countries have registered at an employment centre as a means of finding work, and only 15.4 per cent use the more formal approach of answering job advertisements. Clearly there is scope to strengthen the capacity of public and private employment services in sub-Saharan Africa as a means to raise their attractiveness as a placement tool for jobseeking young men and women.
Table 6.3 Unemployed youth by job search method (%)
Search method Benin* Liberia Madagascar Malawi Tanzania Togo Uganda Zambia Average
Registered at an employment centre
7.4 7.5 3.9 1.0 44.3 8.8 1.3 1.6 9.5
Placed/answered job advertisement(s)
28.6 10.1 13.2 24.8 11.6 10.8 6.7 17.5 15.4
Inquired directly at factories, farms, markets, shops or other workplaces
20.0 8.1 36.6 9.9 14.6 7.7 24.3 32.6 19.2
Took a test or interview
10.9 4.2 9.0 2.0 0.0 0.9 5.1 9.1 5.2
Asked friends, relatives, acquaintances
62.9 52.6 23.6 27.5 22.3 44.6 43.0 56.8 41.6
Waited on the street to be recruited for casual work
4.0 3.3 0.0 4.6 1.7 3.6 0.8 2.1 2.5
Sought financial assistance to look for work or start a business
11.4 5.7 0.0 22.5 5.4 5.8 5.4 5.9 7.8
Looked for land, building, equipment, machinery to start own business or farming
4.6 1.5 1.2 3.7 0.1 3.7 7.2 2.4 3.1
Applied for permit or licence to start a business
1.1 2.0 0.0 2.4 0.0 11.6 0.7 1.3 2.4
Other 2.3 5.0 12.4 1.6 0.0 2.6 5.6 0.0 3.7
* Multiple responses were possible.
Source: SWTSs, 2012–13 (see table 2.1 for reference year by country).
6.3 Obstacles to finding work
An analysis of the obstacles faced by unemployed young people in finding jobs points to the economies’ low capacity to absorb labour market entrants. The lack of available jobs is the most mentioned obstacle to employment in four of the eight countries (table 6.4). In Madagascar, Malawi, the United Republic of Tanzania and Zambia, the largest perceived barrier is inadequate education and training. Often, national curricula have a low vocational content, and the young jobseekers’ limited work experience (the third most mentioned obstacle by respondents) has not yet allowed them to make up for it. Lack of job search experience is also perceived as a barrier; it is
39
considered the main obstacle to finding employment by one in ten unemployed youth on average.
Table 6.4 Unemployed youth by main obstacle to finding employment (%)
Obstacle Benin Liberia Mada-gascar
Malawi Tanzania Togo Uganda Zambia Average
Requirements for job were higher than education/ training received
5.2 12.7 25.2 56.6 36.5 16.6 24.0 32.0 26.1
Not enough work experience
11.9 17.1 23.7 3.5 12.1 15.0 7.5 16.5 13.4
Not enough jobs available
51.4 34.7 20.8 18.7 16.6 33.8 24.3 28.4 28.6
Considered too young
2.8 8.3 0.8 2.1 3.2 2.3 3.2 3.4 3.3
Being male/female
0.7 0.7 2.0 0.2 0.6 0.0 0.0 0.3 0.6
Discriminatory prejudices (for example, disability, religion, race, appearance, family situation)
2.8 1.3 9.9 3.9 9.8 2.0 2.8 5.2 4.7
Low wages in available jobs
2.4 0.8 4.0 0.5 1.2 6.4 4.1 1.9 2.7
Poor working conditions in available jobs
2.8 0.7 3.1 0.2 1.4 2.0 3.0 1.4 1.8
Did not know how or where to seek work
13.8 18.7 4.4 9.0 11.0 12.4 7.2 5.4 10.2
Other 6.2 5.1 6.0 5.5 7.6 9.5 23.9 5.5 8.7
Source: SWTSs, 2012–13 (see table 2.1 for reference year by country).
The challenges faced by youth in the labour market may generate doubts about the value of education when it comes to securing employment. Table A.15 shows that almost one-third (30.1 per cent) of unemployed youth in the eight countries responded that their level of education is not useful in help them obtain a job. The percentage of youth sharing this view is highest in Malawi, with more than 58 per cent. Still, a majority of unemployed young people stated that their level of education is useful in finding work (32.7 per cent chose “somewhat useful” and 27.5 per cent “very useful”).
6.4 Discouraged youth
Discouragement, a situation in which a young person is available to work but does not search for work for a reason implying discouragement with their employment options, is experienced on average by 22.3 per cent of unemployed youth in the eight
40
countries (figure 6.3). In Malawi and Liberia, the phenomenon is particularly pronounced as it affects at least one-third of the unemployed youth. A majority of young people who have given up the job search in these countries are women. In the total youth labour force, discouragement accounts for 5 per cent of economically active youth. In five of the eight countries, the shares of discouraged youth in the labour force are lower than the average. In Madagascar, discouragement is virtually non-existent. Lower shares of discouragement can be explained by poverty rates. If poverty is widespread, discouragement can be seen as a luxury since it implies dependence on other household members for financial sustenance. In poverty-stricken areas, the young person has a tendency to accept any income-generating activity, however low-paid, low-productive and unprotected.
Figure 6.3 Share of discouraged youth among total unemployed youth and among the total economically active youth population (%)
Source: SWTSs, 2012–13 (see table 2.1 for reference year by country).
7. Labour market transitions in sub-Saharan Africa
7.1 The ILO approach to measuring transitions13
The labour market transition of young people concerns not only the length of time from their exit from education (either upon graduation or early exit without completion) to their first entry into any job, but also relates to qualitative factors, such as whether the job is stable (measured by contract type). The SWTS was designed to apply a stricter definition of “stable employment” than is typically used. By starting from the premise that a person has not “transited” until settled in a job that meets very basic criteria of stability, as defined by the duration of the employment contract, the SWTS analytical framework introduces a new element of quality to the standard definition of labour
13 This section is adapted from ILO (2013), Chapter 5.
0
5
10
15
20
25
30
35
40
45
% Discouraged/ Unemployed
(Relaxed)
Discouraged/ Labour force
(relaxed)
41
market transition. However, as seen in section 5, only a small share of youth in developing economies attain stable employment and, if the “end goal” does not fit reality, then perhaps the statistics are not framed widely enough. Thus job satisfaction was added as a component and built into the concept of labour market transition.
More specifically, labour market transition14 is defined as the passage of a young person (aged 15–29) from the end of schooling (or entry to first economic activity) to the first stable or satisfactory job. Stable employment is defined in terms of the employment (written or oral) contract and the duration of the contract (greater than 12 months). Introducing the issue of a contract automatically excludes the employment status of self-employed, where the employment relationship is not defined by a contract. The opposite of stable employment is temporary employment, or wage and salaried employment of limited duration. Satisfactory employment is a subjective concept, based on the self-assessment of the jobholder. It implies that respondents consider their jobs to be a good “fit” with their desired employment path at that moment in time. The contrary is termed non-satisfactory employment, implying a sense of dissatisfaction with the job.
Based on this definition of labour market transition, the stages of transition are classified as follows:
I. Transited – A young person who has “transited” is one who is currently employed in:
a) a stable job, whether satisfactory or non-satisfactory; or
b) a satisfactory but temporary job; or
c) satisfactory self-employment.
II. In transition – A young person still “in transition” is one who is currently unemployed (relaxed definition); or
a) employed in a temporary and non-satisfactory job; or
b) in non-satisfactory self-employment; or
c) inactive and not in education or training, with an aim to look for work later.
III. Transition not yet started – A young person whose “transition has not yet started” is one who is currently:
d) still in school and inactive (inactive student); or
e) inactive and not in education or training (inactive non-student), with no intention of looking for work.
14 Avoidance of the term “school-to-work” transition is intentional. Considering only youth who transit from school to the labour market excludes the share of youth with no schooling, which in certain countries is sizeable. The ILO includes this sub-set in transition indicators by taking the young person’s first experience in economic activity as the starting point. To .avoid confusion over the terminology, the authors prefer to use the wording “labour market transition” rather than “school-to-work transition”, which comprises only a sub-set.
42
Two elements of this classification are noteworthy. First, the stages of transition span across the boundaries of economic activity as defined in the standard labour force framework. The “transited” category includes a sub-set of youth classified as employed; the remaining employed fall within the category of “in transition”, which includes those who fall under the strict definition of unemployed and portions of the inactive (namely, those without work, available for work but not actively seeking work15 and inactive non-students who have stated an intention to join the labour force at a later stage). The “transition not yet started” category is the residual of the inactive population.
Second, the stages of transition are not intended to be a normative framework. Because of the inclusion of youth in satisfactory self-employment and satisfactory temporary employment, one cannot say that all young people in the transited category have transited to a “good” job. In fact, a majority of young people in self-employment – the own-account workers and unpaid family workers – are among the poorly paid workers in the informal economy. By definition, they make up the bulk of the SWTS countries’ share of irregularly employed. Yet they have expressed a degree of satisfaction with their job, and they are likely to have finished their transition in the sense that they will remain in the self-employed classification for the remainder of their working lives.
The classification into stages of transition offers a flow concept. A person is in transition until they have reached a fixed position in the labour market, meaning they have a job they are likely to maintain, regardless of whether it is good or bad.
7.2 Stages of transition of sub-Saharan African youth
In the sub-Saharan African countries surveyed, the process of transition has started for a majority of young people – only an average of one-quarter (24.7 per cent) have not yet started their transition – but only a very few (8.2 per cent) have successfully completed their transition to stable employment (figure 7.1). Another 30.3 per cent have also completed their transition but to satisfactory temporary employment or satisfactory self-employment. The remaining 35.5 per cent remain in transition, still searching for a stable or satisfactory job.
A great deal of variation exists across countries in the distribution of youth by stages of transition. Only in Madagascar have a majority of young people (56.4 per cent) completed their labour market transition (to stable or satisfactory employment), reflecting the high employment rates in the country. The share of transited youth approaches 50 per cent in several other countries (Malawi, Togo and Uganda). But in the remaining countries – Benin, Liberia, the United Republic of Tanzania and Zambia – the share of transited youth is much lower (around one-third of the youth population or less). In these countries, a great portion of youth remain in transition, with the exception of Benin which has an usually large percentage of young people who have not yet started the transition (a reflection of the high educational enrolment rates in the country and the low tendency of youth to combine work with studies).
15 This is the portion added to the “strictly” unemployed category to make up the unemployed (relaxed definition).
43
Figure 7.1 Distribution of youth by stages of transition (%)
Source: SWTSs, 2012–13 (see table 2.1 for reference year by country).
An analysis by sex highlights the fact that the completion of the transition process, especially to stable employment, is easier for young men than for young women. With the exception of the United Republic of Tanzania, the share of young men who have completed the transition to stable employment exceeds the share of young women (table 7.1). The shares of youth who transited to satisfactory temporary or self-employment are on average closer between the sexes, with the male share exceeding the female share in Liberia, Malawi, the United Republic of Tanzania and Zambia. Young women are more likely to remain in transition (with a few exceptions).
Youth residing in urban areas have an advantage in terms of obtaining stable employment. In all seven countries (the urban/rural distinction is not available for the United Republic of Tanzania), the shares of young people who have transited into stable employment are higher in urban areas than rural areas (table 7.1). Regionally, the urban average is twice that of the rural. By contrast, the youth who have transited to satisfactory temporary or self-employment are more numerous in rural areas. The distribution of youth remaining in transition by area of residence is more closely divided (33.5 per cent, on average, in rural areas and 34.8 per cent in urban areas).
The likelihood of completing the labour market transition increases with age. On average, young people aged 25–29 are three times more likely to complete their transition into stable employment than those aged 15–19. Conversely, the percentage of young people not having begun the transition process decreases as age increases. The share of youth aged 15–19 in this category is more than six times that of youth aged 25–29 (table A.16).
2.6
4.1
6.5
8.1
13.5
6.7
12.2
11.6
8.2
17.0
30.9
49.9
41.2
10.4
38.8
33.6
20.7
30.3
21.2
47.1
26.0
37.1
45.1
34.0
29.0
44.4
35.5
54.2
17.8
15.9
13.6
30.3
20.5
23.2
22.4
24.7
0% 20% 40% 60% 80% 100%
Benin
Liberia
Madagascar
Malawi
Tanzania
Togo
Uganda
Zambia
Average
Transited to stable employment
Transited to satisfactory self- or
temporary employment
In transition
Transition not yet started
44
Table 7.1 Distribution of youth by stages of transition, sex and area of residence (%)
Note: Due to a problem in the weights, the urban/rural breakdown for the United Republic of Tanzania cannot currently be provided.
Source: SWTSs, 2012–13 (see table 2.1 for reference year by country).
Finally, we look at the transition stages by the level of completed education (thus excluding current students from the denominator and excluding the category of “transition not yet started”, which consists primarily of current students). Two conclusions can be drawn from the average results shown in figure 7.2. (The national results are shown in table A.17.) First, completing higher levels of education does not necessarily imply better results in terms of completing the labour market transition; nearly one-half (49.3 per cent) of youth with secondary (general) education and 39.1 per cent of youth with tertiary education remain in transition. However, investing in higher education does bring a distinct advantage in terms of attainment of stable employment. The share of youth who completed the transition to stable employment increases steadily with each incremental level of education attained. In fact, the young person with a tertiary education is more than 4 times more likely to attain stable employment than the young person with primary education or less. (Tanzania is an exception with nearly equal shares of the least and most educated youth completing the transition to stable employment.) In contrast, the lesser educated youth are much more likely to end up in satisfactory temporary or self-employment.
45
Figure 7.2 Distribution of youth who completed their transition (to stable employment or to satisfactory self- or temporary employment) and youth in transition by level of completed educational attainment, average of eight sub-Saharan African countries (%)
Note: Tertiary is the sum of post-secondary vocational, university and post-graduate in all countries but Malawi and Uganda which do not have a category of post-secondary vocational. Source: SWTSs, 2012-2013 (see table 2.1 for year reference by country).
7.3 The stages of transition
7.3.1 Young people who have not yet started their transition
The SWTSs carried out in sub-Saharan Africa show that on average about one-quarter (24.7 per cent) of young people have not yet begun their transition into working life. Among this group, about one young person in ten is inactive and out of school, with no desire to join the labour market in the future. The remaining nine in ten youth are inactive students. Figure 7.3 shows the percentages of young people in both sub-categories who have not yet started their transition, and confirms the trends seen in educational enrolment and economic participation already mentioned. In all eight countries, young men are more numerous in the inactive student category while young women are more likely than young men to be in the category of inactive non-student.
7.3.2 Young people in transition
Youth remaining in transition can be further broken down into those who are unemployed (relaxed definition), those working in non-satisfactory temporary work and non-satisfactory self-employment, and those who are inactive non-students with a desire to join the labour market in the future. Unemployment affects over one-third (39.7 per cent) on average – although many fewer in Madagascar and Benin, and many more in Liberia, the United Republic of Tanzania and Zambia – and a slightly higher share of youth remain in transition because they are working but not in a job that they consider to be satisfactory (figure 7.4). The category working in non-satisfactory self-employment takes the largest share in Madagascar, Togo and Uganda. In Benin and the United Republic of Tanzania, significant shares of young people (40.9 and 21.3 per cent, respectively) are inactive non-students who intend to join the labour market in the future.
9.215.5
22.7
40.6
43.6 35.3 25.3
20.3
47.1 49.3 52.039.1
0%
10%
20%
30%
40%
50%
60%
70%
80%
90%
100%
Primary or
less
Secondary
general
Secondary
vocational
Tertiary
%
In transition
Transited to satisfactory self-
or temporary employment
Transited to stable
employment
46
Figure 7.3 Youth whose transition has not yet started by sub-category and sex (%)
Source: SWTSs, 2012–13 (see table 2.1 for reference year by country).
Figure 7.4 Youth in transition by sub-category (%)
Source: SWTSs, 2012–13 (see table 2.1 for reference year by country).
90
.6
78
.8
97
.2
90
.6
10
0.0
97
.8
98
.2
86
.3 99
.6
98
.9
99
.1
96
.5
99
.1
96
.1
96
.0
91
.1
97
.5
92
.0
0%
10%
20%
30%
40%
50%
60%
70%
80%
90%
100%
Ma
le
Fe
ma
le
Ma
le
Fe
ma
le
Ma
le
Fe
ma
le
Ma
le
Fe
ma
le
Ma
le
Fe
ma
le
Ma
le
Fe
ma
le
Ma
le
Fe
ma
le
Ma
le
Fe
ma
le
Ma
le
Fe
ma
le
Benin Liberia Madagascar Malawi Tanzania Togo Uganda Zambia Average
Inactive students Inactive non-students with no desire to work in the future
21
.6
61
.3
7.0
41
.8 55
.3
37
.1
33
.5
60
.1
39
.71.2
1.8
6.9
5.6
3.4
2.4 5.5
5.1
4.0
36
.3
28
.5
77
.3
40
.7
20
.2
47
.2
51
.9
20
.2
40
.3
40
.9
8.3
8.9
11
.8
21
.3 13
.3 9.1
14
.5
16
.0
0%
10%
20%
30%
40%
50%
60%
70%
80%
90%
100%
Inactive non-student with
desire to work in the future
Non-satisfactory self-
employment
Non-satisfactory temporary
employment
Unemployed (relaxed
definition)
47
7.3.3 Transition completed
Figure 7.5 shows the distribution of youth who have completed their labour market transition by sub-category: transited to stable employment, transited to satisfactory temporary employment and transited to satisfactory self-employment. In all the countries but the United Republic of Tanzania, between five and eight youth in ten are in the category of satisfactory self-employment, which is not surprising given the dominance of self-employment in the countries. On the other hand, stable employment, the category considered ideal, averages 23.3 per cent of transited youth. This means that although a significant share of young people complete their labour market transition, only a select few attain jobs that provide them with the stability to ensure a productive and stress-free adulthood. The share of transited youth in satisfactory temporary employment remains small – with the highest share at only 9.7 per cent in Zambia. Unlike in European economies, temporary work is not yet a main concern among young people in sub-Saharan Africa.
Figure 7.5 Youth who completed the transition by sub-category (%)
Source: SWTSs, 2012–13 (see table 2.1 for reference year by country).
7.4 Transition paths and length
7.4.1 Transition paths
Another means of examining the transition is through flows and identifying the labour market category held by the youth prior to transiting to stable and/or satisfactory employment. Among the eight countries in sub-Saharan Africa under consideration, a majority of transited youth passed directly to their current position (52.9 per cent on average) (figure 7.6). This means they had no intermediary spell before acquiring their current job, classified as stable in contract terms or satisfactory self- or temporary employment. The shares of direct transitions are especially high in Benin, Liberia, the United Republic of Tanzania and Zambia. In the eight countries, much smaller shares on
13
.3
11
.6
11
.5
16
.4
56
.6
14
.8 26
.7 35
.9
23
.31.8 2.5 3.1
6.7
6.5
3.3
3.3
9.7
4.6
84
.9
85
.9
85
.4 76
.9
36
.9
81
.9 70
.0
54
.5
72
.0
0%
10%
20%
30%
40%
50%
60%
70%
80%
90%
100%
Satisfactory self-
employment
Satisfactory temporary
employment
Stable employment
48
average transited from an alternative status: 3.6 per cent from unemployment, 5.4 per cent from own-account work, 13.0 per cent from unpaid family work (with an especially large share in this category in Madagascar), 12.1 per cent from other employment and 9.9 per cent moved to the current position from inactivity.
Source: SWTSs, 2012–13 (see table 2.1 for reference year by country).
The ILO has also developed a classification system for the length of transition period of youth who have completed the transition.16 Because of the dominance of the category of youth who attained their stable and/or satisfactory post as their first labour market experience (direct transits), most transitions (74.2 per cent) were classified as short. The transition was classified as mid-length for 12.0 per cent of transited youth and lengthy for only 9.0 per cent (figure 7.7). Lengthy transitions were slightly more frequent in Malawi (10.0 per cent), the United Republic of Tanzania (19.5 per cent), Togo (12.1 per cent) and Uganda (12.7 per cent).
16 A short transition is classified as one in which, before obtaining the current satisfactory/stable job, the young person underwent: (1) a direct transition; or (2) a spell (or cumulative spells) of stable or satisfactory employment with no spell of unemployment or inactivity; or (3) a spell (or cumulative spells) of employment of less than or equal to 1 year with no spell of unemployment or inactivity where the job(s) held is(are) classified as non-satisfactory self- or temporary employment; or (4) a spell of unemployment with or without spells of employment or inactivity of less than or equal to 3 months; or (5) a spell of inactivity of less than or equal to 1 year. A mid-length transition is classified as one in which, before obtaining the current satisfactory/stable job, the young person underwent: (1) a spell (or cumulative spells) of non-satisfactory self- or temporary employment of between 1 and 2 years with no spell of unemployment or inactivity; or (2) a spell of unemployment with or without spells of employment or inactivity of between 3 months and 1 year; or (3) a spell of inactivity longer than 1 year. A lengthy transition is classified as one in which, before obtaining the current satisfactory/stable job, the young person underwent: (1) a spell (or cumulative spells) of non-satisfactory self- or temporary employment of 2 years or more with no spell of unemployment or inactivity; or (2) a spell of unemployment with or without spells of employment or inactivity of 1 year or more.
70.8
63.2
44.6
41.5
51.8
45.8
35.1
70.1
52.93.6
5.413.0 12.1 9.9
0% 20% 40% 60% 80% 100%
Benin
Liberia
Madagascar
Malawi
Tanzania
Togo
Uganda
Zambia
Average
Direct transition
From unemployment
From own-account work
From unpaid family work
From other employment
From inactivity
49
Figure 7.7 Youth who completed the transition by length of transition (%)
Source: SWTSs, 2012–13 (see table 2.1 for reference year by country).
Figure 7.8 Average length of transition of youth who completed the transition (months)
Source: SWTSs, 2012–13 (see table 2.1 for reference year by country).
The evidence on transition paths suggests that “shopping around” among labour market experiences is not the norm in sub-Saharan Africa, a clear indicator of the limited number of job opportunities in the region. Examining the length of the transition in sub-Saharan Africa more closely, the results show it lasts on average about 29 months, or slightly longer than 2 years, when persons with direct transitions are taken into consideration (figure 7.8). Excluding the transited youth who move directly to their stable and/or satisfactory job, the average length of transition is much more substantial: 46 months or nearly 4 years. In Benin, Liberia and Madagascar, it took the young person 5 years or more to reach satisfactory or stable employment. Finally, the results show
6.1 4.0 7.2 10.0 19.5 12.1 12.7 0.6 9.0
7.7 3.7
8.1 2
0.7 13
.6
13
.4 21
.1
7.4 12
.0
86
.0
72
.7
84
.6 68
.8
63
.3
72
.1
64
.1
82
.0 74
.2
0%
10%
20%
30%
40%
50%
60%
70%
80%
90%
100%
Lengthy transition Mid-length transition Short transition
0
10
20
30
40
50
60
70
80
Mo
nth
s
Average length of transition -
excluding direct transition
Average length of transition -
including direct transition
Average length of transition to
stable employment - including
direct transition
Average length of transition to
satisfactory self- or temporary
employment - including direct
transition
50
inclusive results regarding whether it takes longer to transit to stable employment compared to satisfactory self-employment or temporary employment. Two countries show identical lengths for the two, three countries show longer transition lengths of youth to stable employment and three countries show longer transition lengths to satisfactory self-employment or temporary employment.
8. Determinants of a successful school-to-work transition
8.1 The models
According to Vernières17, integration into the job market is “the process by which individuals who have never been part of the working population gain access to a stable position in the employment system” (Vernières, 1997, pp. 9–22). In a previous work, Vernières noted: “The emphasis on the stability of the position underlines the fact that working in a productive activity, or holding a job, regardless of its nature, is not sufficient for the period of integration to be regarded as completed. It can only be considered completed when the person in question has obtained enough experience to be totally effective in an activity which he or she expects to be in for the long term” (Vernières, 1994).18
Consequently, three questions remain crucial to understanding the way young people secure employment in sub-Saharan Africa:
• What factors explain the successful transition of some young people while others remain in transition?19
• What underlying factors lead to the long-term integration of some young people into stable paid employment and others into temporary jobs or self-employment?
• Why is the length of transition not identical for each young person? In particular, why do some young people undergo a short transition period while others endure a much longer period of transition?
Section 7 already provides some information that responds to these questions. For example, the data show that young males are more likely to complete the transition than young females and that young people with a higher level of education are more likely to attain stable employment than satisfactory self-employment. But to dig deeper, three alternative models are explored: a binary transition model, a binary model for the transition into stable employment and a binary model of a short transition. In the first model, the dependent variable expresses the “choice” of making the transition {Y=1} or of remaining in transition {Y=0}. In the second, the dependent variable expresses the
17 The quote is translated from French. 18 The quote is translated from French. 19 Because being in school explains to a large extent the fact that transition has not yet begun for many young people, here only the alternative of “those who have completed the transition” and “those who are in transition” is considered.
51
“choice” of making the transition into stable employment {Y=1} or of transitioning into temporary work or self-employment {Y=0}. In the last case, the dependent variable expresses the “choice” of going through a short transition {Y=1} or of attempting a long transition {Y=0}. In the context of the binary logistic model, the dependent variable is the logarithm of the opportunities for choice. The probability of achieving a certain transition outcome can be understood on the basis of the set of variables selected for analysis.
8.2 Selected variables
Transition paths are impacted by four groups of variables: the characteristics of young people, the family’s financial background, the sectors of economic activity and the area of residence.
The characteristics of young people looked at are age, age squared divided by one hundred,20 sex and the level of education completed. The latter variable has been “dichotomized”, with young people with secondary education forming the basis of the analysis. The second group of variables refers to the financial situation of the family (as self-assessed by the young respondent). A family’s social and material wealth can be a determining factor in whether the young person can secure employment. The third set of variables captures the influence of the sectors of economic activity on the transition of young people. Of interest here is whether or not young people achieve the transition with greater or lesser ease in sectors other than agriculture. Lastly, area of residence (urban or rural) can also be a variable explaining disparities observed in the transition of young people.
8.3 The outcomes
8.3.1 Completion of the transition
The outcomes of the binary logistical regression of transition (table A.18) highlight a number of conclusions. With respect to the quality of the regression, the model can satisfactorily explain the factors underlying the completion of the school-to-work transition in the countries in sub-Saharan Africa covered by the SWTS. For example, the variables selected explain between 23.6 per cent in Togo and 45.2 per cent in the United Republic of Tanzania of the variation in the probability that young people will complete their transition, in comparison with those who remain in transition.21
The impact of different characteristics of young people in their transition shows that, all other things being equal, completed transition becomes less likely as the young person increases in age, and young men are more likely to complete their transition than young women. It is clear that the financial situation of a young person’s family has a very definite influence on their entry into the job market. Unsurprisingly, the results
20 Taking account of the age squared allows the quadratic aspect of the function potentially linking age to transition, which is not necessarily linear, to be considered. The division by one hundred offsets any effects of scale. 21 Regressions that explain less than 10 per cent of variation in the probability of transition completion have not been included.
52
show that young people who come from affluent families have a much higher probability of completing the transition than those from poor families, whose transition is much more difficult. With respect to sectors of economic activity, the transition is increasingly being made towards sectors other than agriculture.
8.3.2 The transition to stable employment
This model is of relatively lower quality: it explains between 14 per cent in the United Republic of Tanzania and 21 per cent in Liberia of the variation in the probability that young people will make the transition into stable jobs, as compared to satisfactory temporary jobs or self-employment (table A.19).22 It nevertheless provides some additional information to the findings reported in section 7.
First, the model makes it possible to return to a more typical situation in terms of the correlation between transition and age. As young people, particularly young men, get older, they are more likely to make the transition into stable employment. However, this relationship between transition and age is valid only up to a certain point. The negative value of the coefficient related to the square of age divided by 100 shows that the probability of making the transition increases strongly with age in the early years (15–19), then becomes increasingly less likely with the passage of time and finally disappears altogether, as energy and drive combined with experience act as a stabilizing factor.
Second, as may be expected, a higher level of education offers young people a better chance of securing stable employment. Those who have not attended school or have only completed primary-level education are more likely to fall in the more insecure categories of self- or temporary employment.
Third, finding stable employment is more likely to occur in urban areas, yet the family situation seems to have a mitigated effect on reaching stable employment. One reason the effect may be limited is because affluent families may make the choice to move towards profitable self-employment rather than to engage in stable employment. Young people from poor families with very little financial capital, on the other hand, might be forced to work in insecure and not very capital-intensive employment.
8.3.3 Short transition
Generally, as things stand, the model adopted is not capable of explaining the differences observed in the length of the transition (table A.20). However, this does not seem to be the case in the United Republic of Tanzania, where the model explains 37 per cent of the probability that young people will achieve a relatively short transition as opposed to a lengthy one. The results for this country highlight the fact that the length of transition can be longer for young people from poor households and for those living in urban areas; bearing in mind that youth in urban areas are more likely to be unemployed than youth in rural areas, the longer transition of youth in urban areas is not surprising.
To summarize, the models strengthen the evidence that the transition into stable employment of young people in the sub-Saharan African countries under consideration is more likely with higher educational attainment and with urban residence. Although a
22 Regressions that account for less than 10 per cent of variation in the probability of transition completion have not been included.
53
greater number of young people with lower education have transited, they are less likely to attain stable employment. In addition, young men have an advantage over young women in completing their transition. Furthermore, although not a prerequisite, the social and financial situation of a young person’s family can significantly influence their path of professional integration.
9. Policy implications and good practices in youth employment interventions
9.1 Policy implications
Identifying the nature and extent of the youth employment challenge at the country level is a prerequisite to formulating evidence-based and integrated policies and programmatic interventions. With detailed information on the blockages that are preventing sufficient job creation from absorbing the cohorts of young labour market entrants, governments will be better prepared to design effective policy responses. Facilitating an improved school-to-work transition (or work-to-school transition for youth previously engaged in child labour) is a precondition to helping young people overcome difficulties in finding and maintaining decent jobs.
The analysis of the SWTSs in the eight sub-Saharan African countries highlights issues of low-quality employment, low - but improving - levels of educational attainment, inequalities in labour market transitions, etc. The evidence from the survey clearly demonstrates that the region needs a vision for the future of its labour market and a strategy to improve its labour market outcomes, particularly for youth. Since youth employment is highly dependent on each country’s general employment situation, it is critical to prioritize employment in national policy-making and to centralize employment within economic and social policies. In fact, the governments of all countries covered have shown their policy commitment toward areas of employment promotion and skills development. The 2012–13 SWTS and future datasets for 2014–15 can make a significant contribution to providing policy-makers with information to initiate, monitor and evaluate the numerous policies and programmes outlined above and to move towards implementing a National Action Plan. In particular, the following main areas of action should be followed closely:
1. Design macroeconomic policy to promote job growth, especially within the agricultural sector. Beyond improving the alignment of the educational system to the demands of the labour market, demand-side solutions are needed to generate additional jobs for young people (skilled and unskilled). This requires coordinated policy efforts to support aggregate demand through pro-employment macroeconomic policies and to foster growth engines also in higher value-added services or industries (ILO, 2013, section 6). See box 3 for general approaches in this area.
2. Ensure educational access for all and prevention of early school departures. With educational outcomes shown to be clearly linked to better labour market outcomes for youth and an easier labour market transition, policies and resources should be directed towards keeping young people in school and enhancing the quality of education in academic institutions and vocational training centres. Policy actions in this regards are numerous, including:
– Promote equitable access to basic education, but make sure that quality is not sacrificed in the face of quantity;
54
– Promote literacy among those who did not have previous access to basic education (this can be embedded in skills training programmes);
– Address financial and non-financial access barriers to skills training, including for young girls;
– Reinforce the relevance of technical and vocational education by investment in public TVET systems, including technological upgrades, and bring together government and employers on national skills councils for curriculum development;
– Strengthen career guidance within school;
– Specifically address disadvantaged groups in skills development strategies and remove impediments to participation (e.g. child care for young mothers);
– Improve access to and quality of informal apprenticeship training;
– Establish process for certification of skills, including those gained through informal training;
– Target informal sector workers in specific trades and re-train toward more productive fields.
Box 3. Approaches to boost aggregate demand and promote youth employment
Policies that promote employment-centred and sustainable growth are vital if young people are to be given a fair chance at a decent job. Youth labour market outcomes are closely related to overall employment trends but are more sensitive to the business cycle. A boost in aggregate demand is key to addressing the youth employment crisis as this will create more job opportunities for young people. ILO research shows that macroeconomic policies can influence youth employment by encouraging economic diversification and productive transformation; reducing macroeconomic volatility by engaging in timely and targeted counter-cyclical policies; loosening constraints on private-sector growth, with a particular emphasis on access to finance for micro, small and medium-sized enterprises; focusing on targeted demand-side interventions with particular impact on youth employment (e.g. labour intensive infrastructure works, public employment programmes, wage and training subsidies); and ensuring adequate and predictable funding for targeted youth employment interventions.
Source: ILO (2013) box 8.
3. Improve working conditions by ensuring equal treatment for and rights of young workers. The survey results show that young people continue to suffer from decent work deficits and low-quality jobs. Most working youth are in irregular employment in the informal economy. Labour laws and collective agreements, including through sanctioning mechanisms, can protect young workers and facilitate their transitions into stable and decent employment. In parallel, a system of incentives to encourage the registration of enterprises is to be promoted, while at the same time providing incentives for employers to invest in the improvement of young people’s work conditions. The Government must give clear signals to enterprises that it supports the expansion of the formal sector.
4. Support employers in taking active part in the creation of decent jobs for young people. Employers may take on young people when subsidies are offered in the way of tax breaks or other financial incentives, although the very high levels of informality among enterprises in the country can hamper the effectiveness of such a strategy. Perhaps more can be done to make the business case for employing young people by highlighting how this impacts on organizations’ competitiveness. Helping employers link investment in young people and in the training of their young staff to
55
their business strategy is an area that could be expanded. At the same time, governments are advised to give clear signals to enterprises that it will reward private sector enterprises that respond well to measures inducing job creation for the young people.
5. As very few young people use formal means of finding work, enhance the role of institutions that deal with employment/unemployment issues and improve the collection and dissemination of labour market information. Young people mainly use informal methods to search for jobs. Employers also use informal networking to recruit young persons. Given this situation, increasing labour demand without improving information and access to the labour market will do little to help integrate disadvantaged youth who lack personal connections to the labour market. Greater investment in employment offices and agencies can help to improve the connection between young people and enterprises.
6. Strengthen support mechanisms to informal enterprises. Access to finance is consistently listed as a major constraint for enterprises to expand their capacity via investments that lead to the creation of new jobs. This is particularly important in countries where a majority of establishments are micro and small enterprises. Consequently, measures aiming to improve financial inclusion are likely to stimulate labour demand and thereby to generate new employment opportunities for young people. At the same time, there are a wealth of other support mechanisms which can help to increase the productivity and working conditions of micro and small enterprises where so many young people are engaged, including the following macro- and micro-level areas of intervention:
– Macro-level: rationalize and streamline business registration and licensing regimes; simplify tax administration; review land ownership; create an enabling environment for enterprises; introduce incentives for compliance with the legal and regulatory framework;
– Micro-level: support entrepreneurship training; reduce vulnerability through extension of social safety nets; introduce safety and health training for homeworkers and small enterprises; improve access to markets; support development of peer support mechanisms through organization of business membership organizations and informal workers organizations.
7. Promote bipartite and tripartite cooperation on youth employment to yield better employment outcomes. Establishing an enabling environment for the successful implementation of employment and labour market interventions for young people requires bipartite and tripartite cooperation. This is confirmed by the results of evaluations of youth employment programmes. Governments, employers’ organizations and trade unions have a role to play by fulfilling their own specific mandates and through concerted and joint efforts for the promotion of decent work for youth in the country.
56
9.2 Good practices in youth employment interventions
The following “good practices” were selected for presentation at the Work4Youth Regional Conference on “Labour market transitions of young women and men in sub-Saharan Africa” held in Addis-Ababa on 3-4 December, with the tripartite participation of the eight W4Y countries in sub-Saharan Africa.23
1. Raising returns to agriculture and prospects for rural development (Songhai Centre, Benin)
The Songhai Centre in Benin aims to promote food security and poverty reduction by training vulnerable youth to become agricultural professionals. Young trainees contribute to rural growth and sustainable development in Benin through the establishment of Rural Green Cities. With a holistic approach toward training in incubation centres, Songhai aims to graduate functional entrepreneurs that are supported not only in areas of agricultural production, but also in establishment of agribusiness with accompanying technological services, renewable energy, housing and community infrastructure. The Songhai Centre has proven to be an effective means of creating jobs while slowing the rural exodus of young people. The Songhai Centre has three locations in Benin and one in Nigeria.
For more information, see website: http://b.songhai.org/.
2. Quality improvements in informal apprenticeships (ILO, Zimbabwe)
Informal apprenticeships are widespread and by far the most important source of skills training in Zimbabwe. They are entrenched in local traditions and culture and follow a range of informal rules that are based on reputation and social sanctions. The quality of such systems can be improved through a variety of measures including access to new skills and technologies, improved training standards, provision of basic skills such as literacy and numeracy, improved access of young women to male dominated trades and improved formal recognition of skills acquired in the informal economy.
The Quality improvements in informal apprenticeships (QIA) methodology which has been applied in the Skills for Youth Employment and Rural Development project in Zimbabwe has built the capacity of 1 300 Master crafts persons in its three years of inception, linked them to over 2 000 apprentices and supported the systems and structures on district, provincial and national level in Zimbabwe to address shortcomings in systems of informal apprenticeship. The model is also being applied through technical cooperation projects hosted by the ILO in Benin and the United Republic of Tanzania.
For more information, see website: www.ilo.org/harare and ILO (2012).
23 “Decent jobs for youth should be at the top of African Development agenda, says ILO”, Press release, 3 December 2013; http://www.ilo.org/addisababa/media-centre/news/WCMS_231470/lang--en/index.htm.
The Addis Ababa Tegbare-Id Polytechnic College is the oldest vocational training establishment in the city, supported in part by the German Development Cooperation. The College is unique in its outcome-based training approach which ensures direct links to the labour market. The dual training system involves the following steps, all handled in cooperation with national training advisory boards: development of (1) a Memorandum of Understanding, (2) training plan, (3) training stations, (4) training tools and equipment, and (5) enterprise-based training. Trainees among five fields of occupational training spend 2-3 days per week in classroom vocational training and 2-3 days gaining direct experience in an enterprise.
The outreach of the College extends to students in their regular programmes or extension programmes (through evening courses), the unemployed engaged in short-term training, apprentices in on-the-job training, and over 200 SMEs that receive support in skills gap training of their employees.
For more information, see website: http://www.tegbare-id.edu.et/en/About.html.
4. Business development services and access to finance for young people (Generation Enterprise, Nigeria)
Generation Enterprises is a small business incubator for unemployed youth run entirely by young business school graduates from Nigeria, the United States, Canada, Germany, India and Trinidad. The programme aims to help the most disadvantaged youth (including street youth) in areas of Nigeria (also now in India) overcome the obstacles to successful social entrepreneurship. The model follows the candidate through three primary steps: training (provision of relevant business education and life skills), testing (creation and implementation of a business plan with seed capital and mentoring support) and sustained investment (access to growth capital). Generation Enterprise operates through a network of government partners, NGOs, private sector and microfinance institutions.
For more information, see website: http://www.generationenterprise.org/.
5. “Skilling up” youth in the informal sector: The case of taxi-moto drivers in Togo (Ministry of Labour, Employment and Social Security)
The government of Togo estimates that there are more than 400,000 young taxi-moto drivers in the country. While the industry can be profitable – hence the attraction as to increasing numbers of young men – it is also a dangerous and precarious one, with high risk of accidents or even death, long working hours and long-term exposure to pollution. The government estimated that moto-taxi drivers were involved in more than 6,200 accidents, including 400 deaths, in the first half of 2011 alone.
The “Programme for reintegration of taxi-moto drivers to professional training in Togo” [Programme d’appui à la réinsertion des conducteurs de taxis motos aux corps de métiers professionnels au Togo] was set up to target young taxi-moto drivers with an aim to increase their potential for sustainable, long-term participation in the economic growth of Togo. The Programme is implemented by the National Employment Agency [l’Agence Nationale Pour l’Emploi] with the participation of technical training centres, NGOs and the trade union of taxi-moto drivers. Taxi-moto drivers are classified according to their level of education – from university level to none – and invited to participate in training that is adapted accordingly. University
58
graduates, for example, are provided entrepreneurship training; young school-leavers are offered apprenticeship support; young potential drivers are trained on the rules of the road and supported in earning their driver’s license.
For more information, see website: http://www.anpetogo.org/.
59
References
African Development Bank (AfDB), Organisation for Economic Co-operation and Development (OECD), United Nations Development Programme (UNDP) and United Nations Economic Commission for Africa (ECA). 2013. African economic outlook 2013: structural transformation and natural resources (Paris, OECD Publishing).
Chigunta, F.; Chisup, N.; Elder, S. 2013. “Labour market transitions of young women and men in Zambia”, Work4Youth Publication Series No. 6, November (Geneva, ILO).
de Mel, S.; Elder, S.; Vansteenkiste, M. 2013. “Labour market transitions of young women and men in Liberia”, Work4Youth Publication Series No. 3, October (Geneva, ILO).
Elder, S.; Novkovska, B.; Krsteva, V. 2013. “Labour market transitions of young women and men in the former Yugoslav Republic of Macedonia”, Work4Youth Publication Series No. 1, July (Geneva, ILO).
International Conference of Labour Statisticians (ICLS). 2013. Resolution concerning statistics of work, employment and labour underutilization, Adopted by the 19th ICLS, October.
International Labour Organization (ILO). 2013. Global employment trends for youth: a generation at risk (Geneva).
―; 2012. Upgrading informal apprenticeship: a resource guide for Africa (Geneva, ILO Skills and Employability Department).
Mussa, R. 2013. “Labour market transitions of young women and men in Malawi”, Work4Youth Publication Series No. 4, October (Geneva, ILO).
Shehu, E. Nilsson, B. 2014. “Informal employment among youth: evidence from 20 school-to-work transition surveys”, Work4Youth Publication Series No. 8, February (Geneva, ILO).
Vernières, M. 1994. “L’insertion professionnelle et la formation en cours d’emploi”, Afrique contemporaine, No. 172, pp. 203–215.
―; 1997. “L’integration professionnelle des jeunes, analyses et débats”, Economica (Paris).
United Nations Economic Commission for Africa (ECA). 2013. Economic report on Africa 2013: making the most of Africa’s commodities” (Addis Ababa).
61
Annex I. Definitions of labour market statistics
1. The following units are defined according to the standards of the International Conference of Labour Statisticians:
a. The employed include all persons of 15 years of age or more who during a week of reference: - worked for wage or profit (in cash or in kind) for at least one hour; - were temporarily absent from work (because of illness, leave, studies, a break
of the activity of the firm, for example), but had a formal attachment to their job;
- performed some work without pay for family gain.
b. The unemployed (strictly defined) include all persons of 15 years of age or more who meet the following three conditions during the week of reference: - They did not work (according to the abovementioned definition); - They were actively searching for a job or took concrete action to start their
own business; - They were available to start work within the two weeks following the
reference week.
c. Persons neither included in the employed nor in the unemployed category are classified as not in the labour force (also known as inactive).
2. The International Classification of Status in Employment (ICSE) categorizes the employed population on the basis of their explicit or implicit contract of employment, as follows:
a. Employees (also wage and salaried workers) are all those workers who hold the type of jobs defined as “paid employment jobs”, where the incumbents hold explicit (written or oral) or implicit employment contracts that give them a basic remuneration that is not directly dependent upon the revenue of the unit for which they work.
b. Employers are those workers who, working on their own account or with one or a few partners, hold the type of jobs defined as “self-employment jobs” (i.e. jobs where the remuneration is directly dependent upon the profits derived from the goods and services produced) and, in this capacity, have engaged, on a continuous basis, one or more persons to work for them as employee(s).
c. Own-account workers are those who, working on their own account or with one or more partners, hold the type of jobs defined as “self-employment jobs” and have not engaged, on a continuous basis, any employees to work for them.
d. Contributing (unpaid) family workers are those who hold “self-employment jobs” as own-account workers in a market-oriented establishment operated by a related person living in the same household.
3. The employed are also classified by their main occupation, in accordance with the International Standard Classification of Occupations (ISCO-08).
4. A household is a family or other community of persons living together and jointly spending their income to satisfy the basic necessities of life. The concept of household
62
includes members present in the place where the household resides, as well as individuals who are temporarily absent and living elsewhere, including abroad, for business, education or other, as long as their residence in the foreign country does not exceed 1 year. A person living alone can also qualify as a household (“single household”) if s/he does not already belong to another unit. The single household can reside in a separate or shared apartment, considered as an independent unit as long as the household’s income is not shared with other residents. Collective households, such as prisons and institutions, and their members are not observed in the Labour Force Survey.
5. The reporting period, to which the questions for the economic activity are related, is the week before the week of interview (52 reporting weeks throughout the year).
6. The following units are also defined within the SWTS analysis but are outside the scope of those defined within the international framework of labour market statistics mentioned in item 1 above:
a. Relaxed unemployment – a person without work and available to work (relaxing the jobseeking criteria of item 1b above).
b. Labour underutilization rate – the sum of shares of youth in irregular employment, unemployed (relaxed definition) and youth neither in the labour force nor in education/training (inactive non-students) as a percentage of the youth population.
c. Regular employment – the sum of employees with a contract (oral or written) of 12 months or more in duration and employers; the indicators are therefore a mix of information on status in employment and contract situations.
d. Satisfactory employment – based on self-assessment of the jobholder; implies a job that respondents consider to “fit” to their desired employment path at that moment in time.
e. Stable employment – employees with a contract (oral or written) of 12 months or more in duration.
f. Temporary employment – employees with a contract (oral or written) of less than 12 months in duration.
63
Annex II. Additional statistical tables
The SWTSs implemented between 2012 and 2013 are the source for all tables (see table 2.1 for reference year by country).
Table A.1 Distribution of youth by selected characteristics and sex (%)
Country Sex Age group Area of residence
15–19 20–24 25–29 Rural Urban
Benin Female 50.3 25.1 24.6 56.5 43.5
Male 41.1 26.7 31.9 57.0 43.0
Liberia Female 47.4 28.3 24.3 43.8 56.2
Male 44.6 31.3 24.0 47.2 52.8
Madagascar Female 45.0 30.3 24.5 48.0 52.0
Male 48.0 28.1 23.9 48.2 51.8
Malawi Female 39.1 31.7 29.2 84.2 15.8
Male 47.1 29.6 23.3 87.1 12.9
Tanzania Female 43.8 35.2 21.0 - -
Male 44.8 36.8 18.3 - -
Togo Female 35.7 33.3 31.0 55.8 44.2
Male 42.1 33.0 24.8 61.5 38.5
Uganda Female 42.2 30.3 27.5 73.5 26.5
Male 47.6 28.8 23.7 75.2 24.8
Zambia Female 46.1 32.0 22.0 56.3 43.7
Male 46.7 34.0 19.4 60.6 39.4
Average Female 43.5 30.8 25.7 52.9 32.8
Male 44.9 31.5 23.6 55.5 30.2
Country Sex Marital status
Single Engaged Married Divorced/Separated Widowed
Benin Female 50.0 4.3 44.2 1.2 0.3
Male 79.3 4.7 15.4 0.6 0.1
Liberia Female 73.8 15.6 9.6 0.8 0.2
Male 79.8 13.6 6.5 0.1 0.0
Madagascar Female 51.9 3.1 37 7.6 0.3
Male 67.7 3.2 25.9 2.9 0.3
Malawi Female 38.6 0.0 53.3 7.7 0.4
Male 68.2 0.0 29.5 2.3 0.1
Tanzania Female 74.1 6.4 12.2 6.5 0.7
Male 86.9 6.0 4.4 2.7 0.0
Togo Female 45.4 39.4 14.8 0.4 0.0
Male 81.8 16.1 2.0 0.1 0.0
Uganda Female 48.0 0.0 0.3 6.1 45.5
Male 72.8 0.0 0.2 1.9 25.1
Zambia Female 65.9 2.1 28.4 3.2 0.4
Male 86.3 2.4 10.2 0.9 0.1
Average Female 56.5 9.7 23.3 3.7 6.8
Male 79.3 6.1 9.7 1.2 3.6
Note: Due to a problem in the weights, the urban/rural breakdown for the United Republic of Tanzania cannot currently be provided.
64
Table A.2 Distribution of youth by household financial status and area of residence (%)
Country Area of Household financial status
residence Poor Fairly poor Average Fairly well off Well off
Benin Rural 27.4 40.2 27.0 4.8 0.6
Urban 18.2 32.8 42.1 5.3 1.6
Liberia Rural 25.5 36.1 24.8 11.8 1.9
Urban 6.4 14.9 47.5 21.4 9.8
Madagascar Rural 3.7 5.6 23.4 36.7 30.6
Urban 6.7 7.7 28.8 32.8 24.1
Malawi Rural 42.6 33.8 18.9 4.4 0.3
Urban 13.3 30.0 42.7 11.2 2.9
Togo Rural 21.9 54.7 20.6 2.1 0.7
Urban 8.6 41.0 42.4 6.8 1.2
Uganda Rural 31.3 31.2 31.7 5.2 0.5
Urban 14.0 29.2 42.9 9.3 4.6
Zambia Rural 16.0 29.3 42.2 10.0 2.5
Urban 7.4 17.3 48.3 19.7 7.4
Average Rural 24.1 33.0 26.9 10.7 5.3
Urban 10.7 24.7 42.1 15.2 7.4
Note: Due to a problem in the weights, the urban/rural breakdown for the United Republic of Tanzania cannot currently be provided.
Table A.3 Distribution of youth by level of completed education and sex (%)
Country Sex
Level of completed education
Less than primary level (including no
schooling)
Primary level Secondary
level Tertiary level Other
Benin Female 39.1 20.4 37.0 3.3 0.2
Male 18.8 19.3 53.7 8.1 0.2
Liberia Female 20.7 33.6 41.6 3.7 0.4
Male 9.1 29.5 56.6 4.6 0.1
Madagascar Female 22.1 46.3 30.0 1.0 0.7
Male 20.0 49.8 28.3 0.7 1.1
Malawi Female 41.1 38.9 18.3 1.7 …
Male 27.5 44.4 25.5 2.6 …
Tanzania Female 6.1 24.8 54.2 10.6 4.3
Male 2.7 22.4 66.9 6.7 1.4
Togo Female 23.4 29.6 43.9 2.7 0.5
Male 9.1 20.9 61.8 6.8 1.3
Uganda Female 3.7 50.1 41.1 2.6 2.6
Male 5.8 51.7 37.9 2.7 1.9
Zambia Female 1.0 26.7 71.0 1.3 …
Male 0.4 19.9 77.6 2.1 …
Average Female 19.7 33.8 42.1 3.4 1.1
Male 11.7 32.2 51.0 4.3 0.8
… = not available.
65
Table A.4 Labour market and educational status of youth by sex and age group (%)
Country Sex
Working non-
students
Working students
Inactive non-
students
Inactive students
Unemployed students
Unemployed non-
students
Benin Female 29.7 36.8 29.8 1.6 0.3 1.9
Male 16.3 56.4 21.0 2.9 0.4 3.0
Liberia Female 12.9 28.6 23.5 20.9 6.5 7.7
Male 8.3 27.1 22.6 32.3 5.6 4.1
Madagascar Female 6.4 13.9 73.4 5.1 0.1 1.0
Male 1.6 18.2 72.3 6.9 0.1 0.7
Malawi Female 19.9 13.0 46.8 13.5 1.1 5.6
Male 6.0 16.4 45.7 27.6 1.5 2.9
Uganda Female 13.8 21.4 49.4 11.7 0.6 3.0
Male 4.7 27.2 47.1 18.1 0.6 2.3
Tanzania Female 24.4 26.1 33.2 3.1 4.6 8.6
Male 14.5 39.7 28.9 3.9 1.8 11.2
Togo Female 11.4 19.4 56.1 8.7 1.3 3.2
Male 3.8 31.0 40.9 18.6 2.9 2.8
Zambia Female 26.2 26.6 28.9 9.3 1.0 8.0
Male 14.3 27.1 33.9 15.0 1.8 7.8
Country Age group Working
non-students
Working students
Inactive non-
students
Inactive students
Unemployed students
Unemployed non-
students
Benin 15–19 13.5 73.8 9.0 3.1 0.1 0.5
20–24 28.1 39.3 27.4 1.9 0.7 2.6
25–29 33.5 9.4 50.1 1.2 0.4 5.4
Liberia 15–19 8.4 45.8 8.9 30.2 5.2 1.5
20–24 12.8 17.5 26.7 25.9 7.2 10.0
25–29 12.7 6.5 45.7 18.8 6.4 9.9
Madagascar 15–19 4.0 28.5 55.7 11.1 0.3 0.3
20–24 4.3 3.0 87.5 2.5 0.5 2.2
25–29 4.3 0.6 94.1 0.3 0.0 0.7
Malawi 15–19 10.2 29.5 19.0 37.9 1.4 1.9
20–24 16.4 5.7 58.7 10.8 1.8 6.6
25–29 14.5 0.9 76.2 2.4 0.6 5.5
Tanzania 15–19 25.2 49.9 12.4 2.2 4.1 6.2
20–24 15.6 23.7 37.8 5.3 3.4 14.3
25–29 12.7 12.6 60.6 3.1 0.6 10.4
Togo 15–19 5.1 46.2 24.7 21.3 2.1 0.6
20–24 9.1 21.6 52.5 10.5 2.8 3.5
25–29 10.7 3.8 76.1 2.3 1.6 5.4
Uganda 15–19 4.0 42.7 23.7 27.6 0.8 1.4
20–24 5.7 18.0 63.5 8.7 0.5 3.6
25–29 5.3 2.9 85.1 1.6 0.5 4.6
Zambia 15–19 13.2 13.8 20.3 46.3 2.3 4.2
20–24 25.7 42.8 5.6 13.8 1.0 11.2
25–29 27.5 52.0 4.7 4.8 0.3 10.8
66
Table A.5 Share of youth neither in employment nor in education or training by sex (%)
Sex Benin Liberia Madagascar Malawi Tanzania Togo Uganda Zambia Average
Other branches of services 1.392 26 702.950* 4.022
Education sector 2.093 23 891.843* 8.108
Urban -0.311 1 679.214* 0.733
R² (Cox & Snell) 37.6
-2 Logistic likelihood 1 564 000
% of well-classified 89.5
Chi-squared (Significance) 1 189 705.203 (0.000)
* Significant at 1 per cent.
Sara Elder and Koko Siaka Koné
February 2014
Labour market transitions of young women and men in sub-Saharan Africa
This report presents the results of the School-to-work transition surveys (SWTS) implemented in eight sub-Saharan African countries – Benin, Liberia, Madagascar, Malawi, the United Republic of Tanzania, Togo, Uganda and Zambia – in 2012 or 2013. The indicators resulting from the surveys and analysed in this report provide a detailed picture of the youth in the labour market in a part of the world where labour market information is sparse and sporadic. Results show that unemployment of young people remains a matter of concern, but that issues relating to the quality of work available to young people are of even greater relevance to the design and implementation of policy interventions. The report also draws attention to the path and length of the school-to-work transition for young people who are currently employed and draws some conclusions about the characteristics or experiences that can help to achieve a smoother transition.
The SWTSs are made available through the ILO “Work4Youth” (W4Y) Project. This Project is a five-year partnership between the ILO and The MasterCard Foundation that aims to promote decent work opportunities for young men and women through knowledge and action. The W4Y Publications Series covers national reports, with main survey findings and details on current national policy interventions in the area of youth employment, regional synthesis reports and thematic explorations of the 28 datasets from the target W4Y countries.
No. 9
For more information, visit our website: www.ilo.org/w4yYouth Employment Programme4 route des MorillonsCH-1211 Genève 22Switzerland [email protected]
Publication Series
Youth Employment ProgrammeEmployment Policy Department