Page 1
REM WORKING PAPER SERIES
Labour Productivity in State-Owned Enterprises
António Afonso, Maria João Guedes, Pankaj C. Patel
REM Working Paper 0125-2020
April 2020
REM – Research in Economics and Mathematics Rua Miguel Lúpi 20,
1249-078 Lisboa, Portugal
ISSN 2184-108X
Any opinions expressed are those of the authors and not those of REM. Short, up to two paragraphs can be cited provided that full credit is given to the authors.
Page 2
REM – Research in Economics and Mathematics Rua Miguel Lupi, 20 1249-078 LISBOA Portugal Telephone: +351 - 213 925 912 E-mail: [email protected] https://rem.rc.iseg.ulisboa.pt/
Page 3
1
Labour Productivity in State-Owned
Enterprises*
António Afonso,$ Maria João Guedes,# Pankaj C. Patel
April 2020
Abstract
In the aftermath of the Global and Financial Crisis (GFC), between 2013 and 2015, the
Portuguese government revoked four holidays for both public sector and private employees.
We test whether the revocation had an effect on labour productivity in State-Owned Enterprises
(SOEs) in Portugal. Moreover, we also study whether such effects are different taking into
account the SOEs managed by the Central Government or the Local and Regional
Governments. Our results show that revocation of holidays did not impact labour productivity
for either central or local and regional government managed SOEs. Though revocation of
holidays espoused to improve productivity, the policy seems to have served a ceremonial
purpose, but not an economic one.
JEL: C23; H79; J45; J58; J89; L32.
Keywords: labour productivity; state-owned enterprises; central government; panel data;
Portugal
* The authors acknowledge financial Support from FCT – Fundação para a Ciência e Tecnologia (Portugal),
national funding through research grants UIDB/05069/2020 and UIDB/04521/2020. The opinions expressed
herein are those of the authors and not necessarily those of their employers. $ ISEG, Universidade de Lisboa; REM/UECE. R. Miguel Lupi 20, 1249-078 Lisbon, Portugal. email:
[email protected] . # ISEG, Universidade de Lisboa; ADVANCE/CSG. R. Miguel Lupi 20, 1249-078 Lisbon, Portugal email:
[email protected] . Villanova University, Villanova School of Business. 800 Lancaster Avenue, Villanova, PA 19085, US. E-mail:
[email protected] .
Page 4
2
1. Introduction
As a measure of austerity in the aftermath of the Global and Financial Crisis (GFC), the
Portuguese government revoked four holidays for both public and private employees: two
civilian (Republic Day and Restoration of Independence) and two religious (Corpus Christi and
All Saints Day) holidays. The revocation lasted between 2013 and 2015. The move was
effective starting in 2013 and was presented as a measure to increase productivity among public
employees. However, following the 2011-2014 Troika bailout to Portugal (even though a
reversal of revocation measure was not requested in the Memorandum of Understanding), the
four holidays were restored by the government in January 2016.
Given the wave of austerity in the European Union during this period, the plausible
motivation for canceling the two holidays was to increase the number of working days and
thereby lowering labour costs. For instance, according to the OECD (2017), in Portugal labour
costs were then lower than in most of Western Europe, although still above the majority of the
Eastern European countries. The espoused policy motive of improving labour productivity
remains untested. Whether it served a ceremonial purpose or provided economic benefits to
State-Owned Enterprises (SOEs) remains an open question.
Therefore, in this paper, we assess to what extent the revocation of the four holidays
affected labour productivity of SOEs in Portugal. Moreover, we also study whether such effects
are different by SOEs managed by Central Government and those managed by the Local and
Regional Government. The variations in institutions, differences in local norms and mores of
employees, the flux in the economic vitality of regions and differences in practices between
central and regional government could systematically lead to differences in labour productivity
differentials from revocation of holidays between SOEs managed by the Central Government
versus the Local and Regional Government.
Page 5
3
The remainder of the paper is organized as follows. Section 2 briefly reviews the related
literature. Section 3 provides an analytical framework. Section 4 presents the empirical analysis.
Section 5 is the conclusion.
2. Literature
Labour productivity measures output produced per unit of labour input, a common
measure of single-factor productivity. Whether state ownership of firms is conductive to higher
or lower productivity or better or worse profitability, is a recurrent topic in the literature. A
survey by Syverson (2011) highlights several possible determinants and relevant factors that
directly impact productivity at the micro-level, notably: managerial skills; quality of human
capital; information technology; Productivity Spillovers; Competition; Deregulation or Proper
Regulation; flexibility of input markets. Related literature on firm productivity, notably
González-Páramo and de Cos (2005) also report empirical evidence relating to the hypothesis
that public ownership and competition are determinants of firms' productivity, and mention that
public ownership has a significant negative effect on productivity.
One could envisage the use of total factor productivity to better assess overall firm's
effectiveness. However, that would require a production function per enterprises, which is not
feasible for this study (for instance, Brown et al., 2006, conducted related research considering
a broad set of financial indicators for state-owned production enterprises (SOE) in Russia,
Ukraine, Hungary, and Romania). In addition, several institutional and legal factors can also
play a role in the performance of enterprise ownership and management, both for more central
government related enterprises and for locally active enterprises (see, for instance, La Porta et
al., 1999, on related institutional issues).
Regarding the case of SOE’s productivity, for instance, Abramov et al. (2017) studied
117 of the largest firms in Russia for the period 2006-2014 and reported that increases in the
Page 6
4
size of direct government ownership lead to lower labour productivity and profitability and that
SOE enterprises tend to perform worse on average than private firms.
Related to the Portuguese revocation of the four public holidays the underlying rationale
was to increase labour hour input, resulting from the four additional workdays. Greater expected
production or services provided due to additional workdays were also expected to increase firm
output, and thereby, labour productivity. Revocation could also have spillover and economic
multiplier effects in the economy.
However, it is also plausible that the desired effects also may not be realized. SOEs are
inefficiently managed and that might explain the lower efficiency of SOEs (Vernon and
Aharoni, 2014). Additional four working days may not necessarily lead to meaningful labour
productivity improvements. Behaviourally, employees may resent working four additional days
without additional pay and due to the generally lower competitive pressures faced by SOEs, the
intended gains may not come to fruition. Overall, whether revocation of holidays improved
labour productivity, the much-touted policy change, remains untested.
3. Analytical framework
One can measure labour productivity by computing the output produced per unit of a
labour input used. Typically, producer data do not provide measures of output quantities.
Hence, as a starting point, and to discuss and assess briefly the theoretical underpinning of the
path of labour productivity, Y/L (Y – using sales and services revenues as a proxy for firm output
in our case; L – labour force) one needs to compute the total derivative of Y/L:
(1)
(2)
/ /Y L Y LYd dY dL
L Y L
2
1Y Yd dY dL
L L L
Page 7
5
(3)
which for small changes is,
. (4)
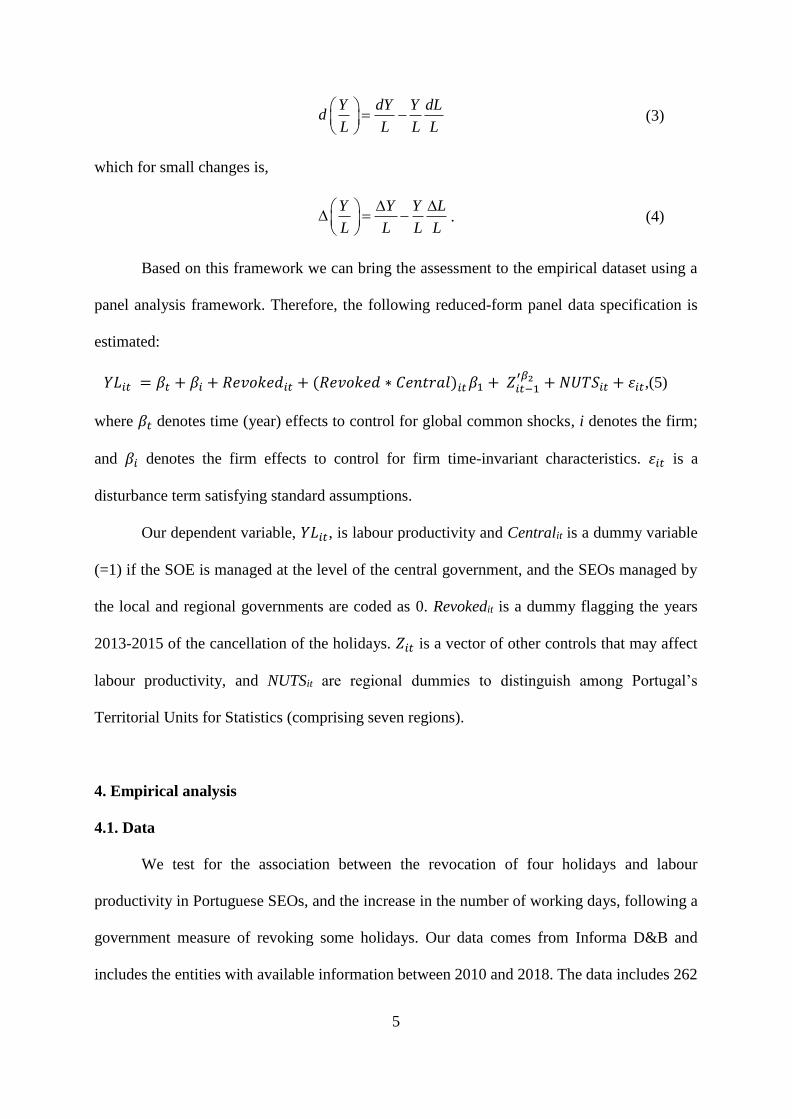
Based on this framework we can bring the assessment to the empirical dataset using a
panel analysis framework. Therefore, the following reduced-form panel data specification is
estimated:
𝑌𝐿𝑖𝑡 = 𝛽𝑡 + 𝛽𝑖 + 𝑅𝑒𝑣𝑜𝑘𝑒𝑑𝑖𝑡 + (𝑅𝑒𝑣𝑜𝑘𝑒𝑑 ∗ 𝐶𝑒𝑛𝑡𝑟𝑎𝑙)𝑖𝑡 𝛽1 + 𝑍𝑖𝑡−1′𝛽2 + 𝑁𝑈𝑇𝑆𝑖𝑡 + 𝜀𝑖𝑡,(5)
where 𝛽𝑡 denotes time (year) effects to control for global common shocks, i denotes the firm;
and 𝛽𝑖 denotes the firm effects to control for firm time-invariant characteristics. 𝜀𝑖𝑡 is a
disturbance term satisfying standard assumptions.
Our dependent variable, 𝑌𝐿𝑖𝑡, is labour productivity and Centralit is a dummy variable
(=1) if the SOE is managed at the level of the central government, and the SEOs managed by
the local and regional governments are coded as 0. Revokedit is a dummy flagging the years
2013-2015 of the cancellation of the holidays. 𝑍𝑖𝑡 is a vector of other controls that may affect
labour productivity, and NUTSit are regional dummies to distinguish among Portugal’s
Territorial Units for Statistics (comprising seven regions).
4. Empirical analysis
4.1. Data
We test for the association between the revocation of four holidays and labour
productivity in Portuguese SEOs, and the increase in the number of working days, following a
government measure of revoking some holidays. Our data comes from Informa D&B and
includes the entities with available information between 2010 and 2018. The data includes 262
Y dY Y dLd
L L L L
Y Y Y L
L L L L
Page 8
6
SOEs of which 158 belong to the local government sub-sector, and the remaining 104 are owned
and managed by the central government.
Table 1 presents the distribution of the SOEs, per sector, using “código das atividades
económicas- CAE”, the broad structure letter-based sections for industries. Among the 262
SOEs, Water supply; Sewerage, Waste Management, and Remediation Activities have among
the largest shares at 17.9% for the sample (n= 47; CAE code letter =E), followed by Human
Health and Social Work Activities at 12.6% of the sample (n=33; CAE code letter =Q) and Art,
Entertainment and Recreation at 12.2% of the sample (n=32, CAE code letter= R). The smallest
share is for Electricity, Gas, Steam and Air Conditioning Supply and Other Service Services at
0.8% of the sample each (n=2; CAE code letter=D and S, respectively) and Wholesale and
Retail Trade; Repair of Motor Vehicles and Motorcycles at 0.4% of the sample (n=1; CAE code
letter= G).
[Table 1]
Table 2 presents the distribution of the SOEs, per Region, using the Nomenclature of
the European Union Territorial Units for Statistics or NUTS 2 (Nomenclatura das Unidades
Territoriais para Fins Estatísticos). The largest share of SOEs is in the Lisbon and Tagus Valley
region with 32.1% of the sample (n=84) followed by the North region with 16.8% of the sample.
The smallest share of SOE is in the islands of Azores and Madeira, with 5.3% (n=14) and 1.1%
(n=3) of the sample, respectively.
[Table 2]
As a starting point, it is useful to take a look at a couple of examples regarding the
development of labour productivity in the context of the initial framework described in section
3. Therefore, Figure 1 illustrates labour productivity for three SOEs. As expected, Figure 1
shows the relevance of both the size of the labour force and the level of output itself for
Page 9
7
productivity. Additionally, it is possible to notice relevant changes around the period 2013-
2015, when several holidays were revoked.
[Figure 1]
Also, in Table 3A we can observe, for instance, the existence of a positive correlation
between labour productivity and the fact that a particular SOE belongs to the central
government sub-sector. This is in line with the illustrations provide in Figure 1 where the
increase in labour productivity is picked up in the SOE more linked to the Central
Administration sub-sector (the example of Portugália Airlines, a subsidiary of TAP Air
Portugal, jointly run by private institutional investors and by public management), while that is
not the case in the SOEs more directly linked to the Local government sub-sector (EPAL, part
of AdP – Águas de Portugal, and APDL, in the example). On the other hand, the occurrence of
the revoked holidays alone does not correlate with labour productivity. Moreover, Tabl3 3B
shows also some heterogeneity in the firm sample, notably in terms of labour productivity.
[Table 3A and Table 3B]
Variables
Dependent variable. The dependent is labour productivity calculated as the natural
logarithm of the ratio of sales and services revenues to employees (labour force), or in other
words, the output produced per unit of a labour input used. This is in line with equation (4) in
the methodological framework.
Independent variables. The variable of interest Revoked holidays, which is a dummy
variable equal to one of the years in the analysis is 2013, 2014 and 2015, and equal to zero the
rest of the period.
Page 10
8
Moderator variable. Central is a dummy variable that equals one if the SOE belongs to
the state´s central administration and equal to zero if it belongs to the local government sub-
sector. This variable will be used as an explanatory variable, to capture a level effect, and also
interacted with the variable “Revoked”, for a possible slope effect.
Control variables. We use a set of control variables: the number of employees, the
natural logarithm of assets, the ratio of salaries per employee and the current ratio. We also add
industry and regional time trends.
For the regression analysis, we run a random effects panel analysis with industry time
trends and region time trends in all specifications. In Model 1, we start by introducing the direct
effect for the Revoked holidays and the moderator effect of being a SOE belonging to the state´s
central administration. Then, in Model 2 we introduce the Region dummies, using the
Nomenclature of Territorial Units for Statistics or NUTS 2 (5 mainland regions and the 2
autonomous regions of Azores and Madeira). In Model 3 we add the remaining set of controls.
Then, in Model 4, and following up on equation 4, we use the difference in labour and the
difference in sales and services revenues. In Model 5 we add the regional dummies and finally,
in model 6 we add the reaming set of control variables.
4.2. Results
We assess the results using random effects regression, with industry time trends and
region time trends, respectively for the enterprises of the central government sub-sector and of
the local government sub-sector. This disaggregation is important since the enterprises managed
by the two sub-sectors are somewhat different, according to some relevant variables such as the
number of employees, liabilities, equity, or net income (see Table 4). Indeed, the SOE from the
central government has on average a larger dimension, both in terms of employees and in terms
Page 11
9
of sales and services revenues (see also the additional information in the Appendix regarding
firm heterogeneity per variable).
[Table 4A and Table 4B]
The results in Table 5 show the effects relative to non-central SEO during the non-
revocation period. During the non-revocation period, there was no substantive labour
productivity difference between central and non-central SEOs (Model 6, b = 0.656) was
significantly higher, in other words, central SOEs were substantially more productive than non-
central SEOs. During the revocation period, the non-central SEO (Revoked = 1, Central SOE =
0) had no meaningful improvement in labor productivity relative to non-revocation period
(Revoked = 1, Central SOE = 0). The central SOE, had a higher labor productivity (=0.691,
mean margins estimate = 11.2985) relative to non-revocation period (=0.656, mean margins
estimate = 11.2637). The difference in productivity for central SEOs before and after the
revocation translates to 0.0348 (11.2985 - 11.2637), or exp(0.03482) = 1.04 Euros per
employee. We consider this effect to be negligible, and it seems that the effects of revoked
holidays were ceremonial and not economically meaningful.
[Table5]
5. Conclusion
During the European debt crisis, leaders in Portugal took a variety of austerity measures.
In this paper we focused on a policy that was initiated and later revoked, allowing us to assess
the effect of revocation on the SOEs during 2013 and 2015. Though most austerity measures
affect the population, treatment groups are difficult to discern. The current design allows us to
exploit the average population differences in treatment between central and non-central SOEs.
Our results show that the effects of the revocation on either SOE types were non-existent.
Page 12
10
The lack of economic benefits does not imply that the policy was a failure. Policymakers
adopt policies for social, psychological and institutional reasons, in addition to the economic
benefit from policies. Perhaps the holiday revocation was one such non-economic policy that
may be a precursor to inducing more discipline among SOE employees in the long-term and
impact work culture in such firms. Our data do not allow us to discern these effects, however,
our findings do make an economic case for the lack of efficacy of this policy during the period
of analysis. We hope that the findings are informative in contemplating related policies on
public employees in SOEs.
References
Abramov, A., Radygin, A., Entov, R., Chernova, M. (2017). "State ownership and efficiency
characteristics", Russian Journal of Economics, 3 (2), 129-157.
Brown, J., Earle, J., Telegdy, A. (2006). “The productivity effects of privatization: Longitudinal
estimates from Hungary, Romania, Russia, and Ukraine”. Journal of Political Economy,
114 (1), 61–99.
González-Páramo, J., de Cos, P. (2005). ”The Impact of Public Ownership and Competition on
Productivity. KYKLOS, 58 (4), 495-517.
La Porta, R., Lopez-de-Silanes, F., Shleifer, A. (1999). “Corporate ownership around the
world”. Journal of Finance, 54 (2), 471–517.
OECD (2017). Economic Surveys, Portugal. February 2017. OECD.
Syverson, C. (2011). “What Determines Productivity?” Journal of Economic Literature, 49 (2),
326–365.
Vernon, R., Aharoni, Y. (Eds.). (2014). State-Owned Enterprise in the Western Economies
(Routledge Revivals). Routledge.
Page 13
11
Figure 1 – Labour productivity
1a: EPAL - EMPRESA PORTUGUESA DAS ÁGUAS LIVRES, S.A.
1a.1 1a.2
1b: PORTUGÁLIA - COMPANHIA PORTUGUESA DE TRANSPORTES AÉREOS, S.A.
1b.1 1b.2
1c: APDL - ADMINISTRAÇÃO DOS PORTOS DO DOURO, LEIXÕES E VIANA DO CASTELO, S.A.
1c.1 1c.2
Source: authors’ calculations.
-10000
-5000
0
5000
10000
15000
2011 2012 2013 2014 2015 2016 2017 2018
Cross effect Var productivity Var Y
180000
200000
220000
240000
260000
640
660
680
700
720
740
760
Sale
s
Lab
ou
r
Labour Y per worker
-20000
0
20000
40000
60000
80000
2011 2012 2013 2014 2015 2016 2017 2018
Cross effect Var productivity Var Y
100000
120000
140000
160000
180000
200000
500
550
600
650
700
20
10
20
11
20
12
20
13
20
14
20
15
20
16
20
17
20
18
Sale
s
Lab
ou
r
Labour Y per worker
-60000
-40000
-20000
0
20000
40000
60000
2011 2012 2013 2014 2015 2016 2017 2018
Cross effect Var productivity Var Y
180000
190000
200000
210000
220000
230000
240000
200
210
220
230
240
250
260
20
10
20
11
20
12
20
13
20
14
20
15
20
16
20
17
20
18
Sale
s
Lab
ou
r
Labour Y per worker
Page 14
12
Table 1 – Firm distribution by industry broad structure letter sections classification
firm distribution
Industry
Letter
Description Number of
firms
% Total
A Agriculture, Forestry, and Fishing 4 1.5%
C Manufacturing 8 3.1%
D
Electricity, Gas, Steam and Air Conditioning
Supply 2 0.8%
E
Water supply; Sewerage, Waste Management,
and Remediation Activities 47 17.9%
F Construction 18 6.9%
G
Wholesale and Retail Trade; Repair of Motor
Vehicles and Motorcycles 1 0.4%
H Transportation and Storage 22 8.4%
I Accommodation and Food Service Activities 3 1.1%
J Information and Communication 5 1.9%
K Financial and Insurance Activities 9 3.4%
L Real State Activities 23 8.8%
M
Professional, Scientific and Technical
Activities 22 8.4%
N Administrative and Support Service Activities 12 4.6%
O
Public Administration and Defence;
Compulsory Social Security 11 4.2%
P Education 8 3.1%
Q Human Health and Social Work Activities 33 12.6%
R Art, Entertainment, and Recreation 32 12.2%
S Other Service Services 2 0.8%
Total 262 100.0%
Table 2 – Firm distribution by Region (NUTS2 classification)
NUTS2 Number of firms % Total % of Total
Population
Alentejo 25 9.5% 6.9%
Algarve 18 6.9% 4.3%
Azores 14 5.3% 2.4%
Madeira 3 1.1% 2.5%
Região de Lisboa 84 32.1% 27.7%
Região do Centro 44 16.8% 21.6%
Região do Norte 74 28.2% 34.8%
Total 262 100.0% 100.0%
Page 15
13
Table 3A – Correlations
1 2 3 4 5 6 7 8 9 10 11 12 13 14
1 Labour productivity 1
2 Revoked Holidays -0.007 1
3 Central 0.339*** 0.016 1
4 Employees -0.003 0.017 0.361*** 1
5 (ln) Assets 0.428*** 0.006 0.575*** 0.375*** 1
6 Salaries per employee 0.151*** 0.01 0.046** -0.011 0.044** 1
7 Current ratio 0.080*** -0.001 0.092*** -0.055** 0.017 -0.004 1
8 PPE 0.083*** 0.003 0.170*** 0.156*** 0.282*** 0.008 -0.023 1
9 Liabilities 0.092*** 0.015 0.193*** 0.179*** 0.341*** 0 -0.008 0.201*** 1
10 Equity 0.018 -0.02 0.018 -0.006 0.052** 0.01 0.012 0.042* 0.055** 1
11 Paid in capital 0.094*** 0.006 0.221*** 0.235*** 0.365*** 0.002 0.001 0.303*** 0.711*** 0.454*** 1
12 Sales and services revenues 0.169*** 0.019 0.374*** 0.750*** 0.442*** 0.049** -0.031 0.179*** 0.593*** 0.196*** 0.551*** 1
13 Net income -0.033 0 -0.090*** -0.083*** -0.123*** 0.005 0.002 0.001 -0.255*** 0.657*** 0.119*** -0.049** 1
14 EBITDA 0.100*** -0.001 0.130*** 0.049** 0.252*** 0.01 -0.006 0.135*** 0.633*** 0.598*** 0.665*** 0.494*** 0.387*** 1
Notes: N = 2,026 observations, representing 262 SOE, * p<0.10, ** p<0.05, ***p<0.01
Page 16
14
Table 3B – Descriptive statistics
Mean SD Min Max
1 Labour productivity 10.90 1.6 1.52 18.54 2 Revoked Holidays 0.35 0.48 0 1 3 Central 0.36 0.48 0 1 4 Employees 301.65 797.52 1 7,829 5 (ln) Assets 16.19 2.34 9.64 24.03 6 Salaries per employee 59584.19 1,329,024 0 42,500,000 7 Current ratio 3.97 18.82 0 370.34 8 PPE 28,100,000 14,400,0000 0 336,000,0000 9 Liabilities 148,000,000 942,000,000 4,101.68 24,000,000,000 10 Equity 8,340,000 354,000,000 -4,010,000,000 4,300,000,000 11 Paid in capital 36,900,000 186,000,000 5,000 4,050,000,000 12 Sales and services revenues 21,500,000 59,500,000 96.4 1,320,000,000 13 Net income -2,300,000 33,900,000 -615,000,000 595,000,000 14 EBITDA 4,040,000 30,600,000 -237,000,000 672,000,000
Notes: N = 2,026 observations, representing 262 SOE. All variables are in Euros, except
Employees, that is in units and Central that is a dummy variable.
* p<0.10, ** p<0.05, ***p<0.01
Table 4A – Mean values per Central vs Local SOEs
Means values of…. Central Local T value P-value
Labour productivity 11.63 10.50 -16.197*** 0.000
Employees 688.72 87.80 -17.406*** 0.000
(ln) Assets 18.01 15.19 -31.613*** 0.000
Salaries per employee 14,1439.2 14,360.07 -2.062** 0.039
Current ratio 6.294 2.681 -4.153*** 0.000
PPE 61,000,000 9,919,974 -7.760*** 0.000
Liabilities 392,000,000 13,200,000 -8.834*** 0.000
Equity 17,200,000 3,476,886 -0.832 0.405
Paid in capital 92,100,000 6,409,133 -10.197*** 0.000
Sales and services revenues 51,400,000 4,947,688 -18.134*** 0.000
Net income -6,397,811 -36,985 4.056*** 0.000
EBITDA 9,370,853 1,097,947 -5.882*** 0.000
Page 17
15
Table 4B – Mean values per Central vs Local SOEs, with and without Revoked
Holidays
Means values of…. Central Local
Revoked No Revoked T value Revoked No Revoked T value
Labour productivity 11.68 11.60 -0.595 10.43 10.53 1.280
Employees 729.45 665.47 -0.679 84.05 89.91 0.483
(ln) Assets 18.01 18.00 -0.060 15.17 15.20 0.284
Salaries per employee 185,633.2 116,213 -0.403 15,430.68 13,788.91 -1.209
Current ratio 5.58 6.70 0.613 3.01 2.50 -0.569
PPE 61,600,000 60,700,000 -0.047 9,723,837 10,000,000 0.232
Liabilities 432,000,000 370,000,000 -0.520 14,400,000 12,500,000 -0.443
Equity -6,814,025 30,800,000 0.828 1,829,025 4,356,003 0.681
Paid in capital 94,900,000 90,500,000 -0.189 5,879,923 6,691,461 0.560
Sales and services revenues 54,900,000 49,400,000 -0.766 4,680,910 5,090,011 0.663
Net income -6,123,394 -6,554,449 -0.098 -81,399.32 -13,291.09 0.392
EBITDA 9,109,343 9,520,124 0.105 1,026,204 1,136,221 0.704
Notes: N = 2,026 observations, representing 262 SOE, * p<0.10, ** p<0.05, ***p<0.01
Page 18
16
Table 5– Random effects estimates
Notes: Robust standard errors in parentheses. *** p<0.01, ** p<0.05, * p<0.1.
Nurt2 region base dummy: North of Portugal
(1) (2) (3) (4) (5) (6)
Revoked = 0, Central SOE = 1 (ref. Revoked = 0,
Central SOE = 0) 1.021*** 1.098*** 0.766** 1.084*** 1.101*** 0.656**
(0.200) (0.305) (0.316) (0.204) (0.291) (0.308)
Revoked = 1, Central SOE = 0 -0.046 -0.041 -0.042 -0.056 -0.035 -0.033
(0.044) (0.041) (0.041) (0.044) (0.040) (0.040)
Revoked = 1, Central SOE = 1 1.076*** 1.156*** 0.821*** 1.089*** 1.138*** 0.691**
(0.195) (0.290) (0.296) (0.201) (0.279) (0.290)
Assets 0.107** 0.147***
(0.049) (0.050)
Current ratio -0.003** -0.003**
(0.001) (0.001)
Nuts2 : Centre -64.547 -55.544 -102.099 -90.162
(60.118) (59.820) (65.174) (64.493)
Nuts2 : Lisbon and Tagus valley -20.475 -22.540 -51.803 -52.849
(34.918) (34.490) (41.031) (40.400)
Nuts2: Alentejo -26.562 -29.558 -30.555 -38.379
(49.981) (49.467) (56.758) (57.227)
Nuts2: Algarve -25.376 -26.754 -61.668 -62.796
(58.829) (56.297) (70.918) (66.618)
Nuts2: Azores islands -0.205 20.782 -67.948 -39.973
(55.589) (59.501) (54.203) (52.656)
Nuts2: Madeira Islands -138.073* -107.699 -149.576 -100.095
(79.079) (75.388) (96.315) (86.834)
D. Employees -0.002*** -0.002*** -0.002***
(0.000) (0.000) (0.000)
D. Sales and services revenues 0.000*** 0.000*** 0.000***
(0.000) (0.000) (0.000)
Constant 10.459***
-
1,121.232*
-
1,021.390* 10.449***
-
1,305.726**
-
1,183.231**
(0.116) (669.986) (608.594) (0.117) (626.768) (586.317)
Year cubic Yes Yes Yes Yes Yes Yes
Industry time trends Yes Yes Yes Yes Yes Yes
Region time trends Yes Yes Yes Yes Yes Yes
Observations 2,026 2,026 2,026 1,759 1,759 1,759
Number of SOE 262 262 262 259 259 259
Page 19
17
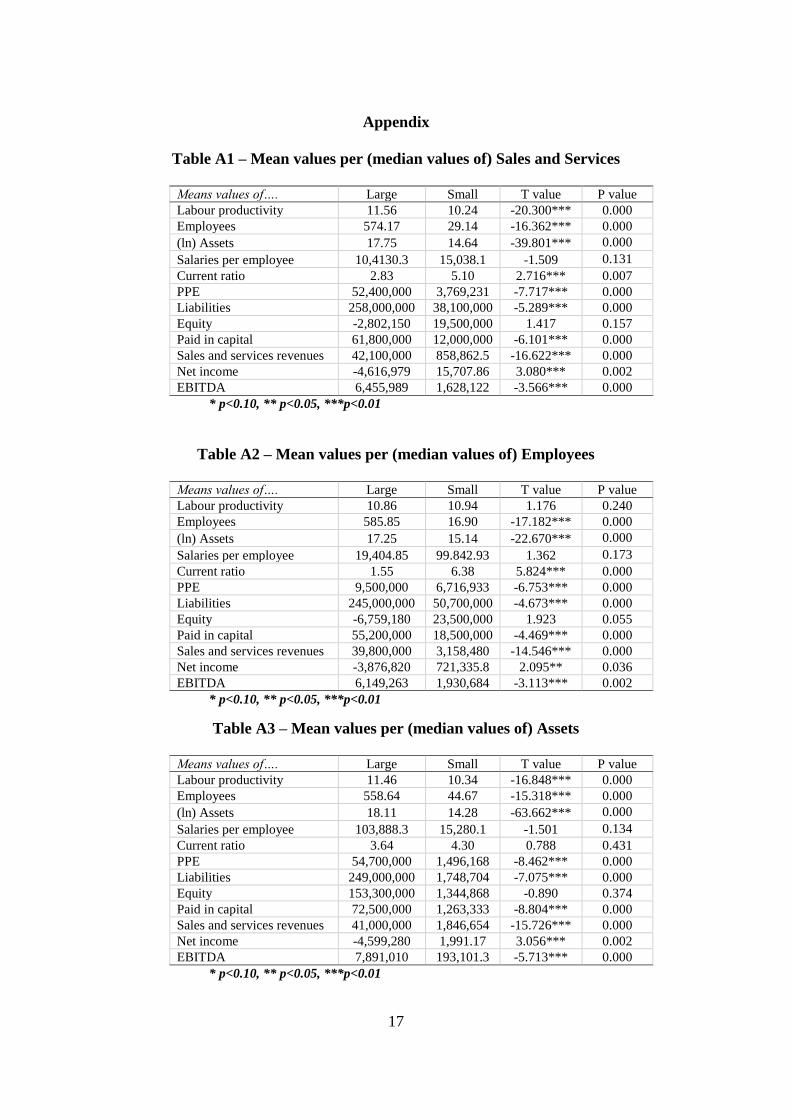
Appendix
Table A1 – Mean values per (median values of) Sales and Services
Means values of…. Large Small T value P value
Labour productivity 11.56 10.24 -20.300*** 0.000
Employees 574.17 29.14 -16.362*** 0.000
(ln) Assets 17.75 14.64 -39.801*** 0.000
Salaries per employee 10,4130.3 15,038.1 -1.509 0.131
Current ratio 2.83 5.10 2.716*** 0.007
PPE 52,400,000 3,769,231 -7.717*** 0.000
Liabilities 258,000,000 38,100,000 -5.289*** 0.000
Equity -2,802,150 19,500,000 1.417 0.157
Paid in capital 61,800,000 12,000,000 -6.101*** 0.000
Sales and services revenues 42,100,000 858,862.5 -16.622*** 0.000
Net income -4,616,979 15,707.86 3.080*** 0.002
EBITDA 6,455,989 1,628,122 -3.566*** 0.000
* p<0.10, ** p<0.05, ***p<0.01
Table A2 – Mean values per (median values of) Employees
Means values of…. Large Small T value P value
Labour productivity 10.86 10.94 1.176 0.240
Employees 585.85 16.90 -17.182*** 0.000
(ln) Assets 17.25 15.14 -22.670*** 0.000
Salaries per employee 19,404.85 99.842.93 1.362 0.173
Current ratio 1.55 6.38 5.824*** 0.000
PPE 9,500,000 6,716,933 -6.753*** 0.000
Liabilities 245,000,000 50,700,000 -4.673*** 0.000
Equity -6,759,180 23,500,000 1.923 0.055
Paid in capital 55,200,000 18,500,000 -4.469*** 0.000
Sales and services revenues 39,800,000 3,158,480 -14.546*** 0.000
Net income -3,876,820 721,335.8 2.095** 0.036
EBITDA 6,149,263 1,930,684 -3.113*** 0.002
* p<0.10, ** p<0.05, ***p<0.01
Table A3 – Mean values per (median values of) Assets
Means values of…. Large Small T value P value
Labour productivity 11.46 10.34 -16.848*** 0.000
Employees 558.64 44.67 -15.318*** 0.000
(ln) Assets 18.11 14.28 -63.662*** 0.000
Salaries per employee 103,888.3 15,280.1 -1.501 0.134
Current ratio 3.64 4.30 0.788 0.431
PPE 54,700,000 1,496,168 -8.462*** 0.000
Liabilities 249,000,000 1,748,704 -7.075*** 0.000
Equity 153,300,000 1,344,868 -0.890 0.374
Paid in capital 72,500,000 1,263,333 -8.804*** 0.000
Sales and services revenues 41,000,000 1,846,654 -15.726*** 0.000
Net income -4,599,280 1,991.17 3.056*** 0.002
EBITDA 7,891,010 193,101.3 -5.713*** 0.000
* p<0.10, ** p<0.05, ***p<0.01