63
LACROSSE FACILITY REPORT AND RECOMMENDATIONS 2013
LACROSSE FACILITY REPORT AND RECOMMENDATIONS
2013

i BCLA FACILITY REPORT AND RECOMMENDATIONS 2013
LACROSSE FACILITY REPORT AND RECOMMENDATIONS
TABLE OF CONTENTS
1. OVERVIEW ................................................................................................................................................. 1
2. INVENTORY OF CURRENT LACROSSE FACILITIES ....................................................................................... 1
2.1 Field Lacrosse Inventory ..................................................................................................................... 2
2.2 Box Lacrosse Inventory ....................................................................................................................... 3
3. FIL NEW COMMON FIELD MARKINGS ....................................................................................................... 5
4. SUCCESSFUL PRACTICES FROM THE LACROSSE COMMUNITY .................................................................. 5
4.1 Successful Practices for Dealing with Facility Owners and Workers .................................................. 5
4.1.1 Building Relationships .................................................................................................................. 5
4.1.2 Strategies for Dealing with Facility Owners ................................................................................. 6
4.1.3 Establish and Maintain the Case For Continued Facility Use ....................................................... 6
4.1.4 Have a Positive Community Presence .......................................................................................... 7
4.2 Successful Practices within the Lacrosse Association ......................................................................... 7
4.2.1 Local Association Contacts and Scope of Responsibility .............................................................. 7
4.2.2 Transfer of Knowledge ................................................................................................................. 8
4.2.3 Ensure Communication and Accountability about Facilities to the Membership ....................... 8
4.2.4 Planning for Upgraded or New Facilities ..................................................................................... 8
4.2.5 Issues Management ..................................................................................................................... 8
4.2.6 Dealing with Other Sports ............................................................................................................ 9
5. BCLA MEMBERSHIP GROWTH PLANS AND FACILITIES .............................................................................. 9
5.1 Lacrosse Membership ......................................................................................................................... 9
5.1.1 Targeted Membership Growth and Facilities .............................................................................. 9
5.1.2 BCLA Membership 2008 - 2013 .................................................................................................. 11
5.2 Growing Facilities Through Aboriginal Programs .............................................................................. 13
5.3 Growing into New Communities ....................................................................................................... 14
5.3.1 New Areas for Growth ............................................................................................................... 14
5.3.2 Growing Within Existing Regions ............................................................................................... 15
5.4 Regional Population Projections ....................................................................................................... 15
6. MUNICIPALITIES AND FACILITY DEVELOPMENT ..................................................................................... 17
6.1 Working with Recreation Departments ............................................................................................ 17
6.2 Being Part of the Municipal Agenda ................................................................................................. 18

ii BCLA FACILITY REPORT AND RECOMMENDATIONS 2013
6.3 Planning for Facilities ........................................................................................................................ 18
6.4 Working with Other Sports ............................................................................................................... 20
6.4.1 Sports That Share Lacrosse Facilities ......................................................................................... 20
6.4.2 Sport Councils ............................................................................................................................ 20
7. HOSTING AT THE INTERNATIONAL, NATIONAL AND PROVINCIAL LEVELS ............................................. 21
7.1 Hosting Grants and Facility Improvements ....................................................................................... 21
7.1.1 Sport Canada .............................................................................................................................. 21
7.1.2 Hosting BC .................................................................................................................................. 22
7.1.3 Municipal Hosting Grants .......................................................................................................... 22
7.2 International Events .......................................................................................................................... 22
7.3 National Championships ................................................................................................................... 23
7.4 Provincial Championships ................................................................................................................. 24
7.5 BC Games .......................................................................................................................................... 25
8. FACILITY DEVELOPMENT EXAMPLES FROM OTHER SPORTS .................................................................. 25
8.1 New South Surrey Pool and BC Diving .............................................................................................. 25
8.2 Rutledge Field and the West Vancouver Field Hockey Club ............................................................. 26
8.3 Tennis Courts .................................................................................................................................... 27
8.4 Delta Sport Development Centre and Delta Gymnastics Society ..................................................... 28
9. COMMUNICATING CHANGES IN FACILITY GAME REQUIREMENTS AND EQUIPMENT STANDARDS ...... 28
10. RECOMMENDATIONS............................................................................................................................ 30
10.1 Facility Inventory ............................................................................................................................. 30
10.2 BC Lacrosse Association Facility Committees ................................................................................. 30
10.3 Local Association Administration and Structure ............................................................................. 30
10.4 Membership And Facilities.............................................................................................................. 31
10.4 Facility and Equipment Information ............................................................................................... 31
10.5 Working with Other Sports ............................................................................................................. 31
10.6 Facility Development ...................................................................................................................... 31
APPENDIX A - 2008 – 2013 ALL Field Lacrosse Registration By Association and Number of Fields in Use. 32
APPENDIX B - 2008 – 2013 Minor Box Lacrosse Registration By Association and Number of Boxes in Use .................................................................................................................................................................... 39
APPENDIX C – 2008-2013 Senior Box Lacrosse Registration – By Area ...................................................... 52
APPENDIX D – British Columbia Development Regions .............................................................................. 57
APPENDIX e – CLA Championship Calendar ................................................................................................ 58
APPENDIX F – Acknowledgements .............................................................................................................. 59
APPENDIX G - Endnotes .............................................................................................................................. 60

1 BCLA FACILITY REPORT AND RECOMMENDATIONS 2013
LACROSSE FACILITY REPORT AND RECOMMENDATIONS
1. OVERVIEW
The BC Lacrosse Association Strategic Plan 2012 -2016 included an Area of emphasis entitled – A Strong Delivery System. The goal for the Strong Delivery System is to “Provide Effective and Efficient Lacrosse Information Resources” for the membership. Under this Strong Delivery System banner, one of the work components is “Facility Access” which has two strategic objectives:
1. Strategize regarding optimal use of facilities and share information with the membership 2. Develop a provincial strategy for lacrosse facilities
The development of this Facility Report and the Strategic Recommendations herein are a direct result of the discussions that took place at the Strategic Planning tables. BC Lacrosse struck an Advisory Group to provide input on the Facility Inventories developed for the project, as well as establishing priorities for information gathering. Staff provided additional input about the lacrosse hosting processes at the provincial and national levels. The report reviews the present facility situation in BC for both Box Lacrosse and Field Lacrosse, as reported by the local associations, and makes recommendations to both optimize the use of the current facilities, and to plan for facility needs based on the strategic plan and projections of the organization. The need for, and requirements of facilities can be looked at in multiple contexts. For the purpose of this report, the emphasis is reviewing facilities within 3 contexts:
1. current facility inventory – what facilities are used and what amenities do they offer - for current participants
2. facility access and requirements embedded into strategic initiatives to align with planned membership growth
3. facility capacity with reference to hosting various levels and types of lacrosse championships
2. INVENTORY OF CURRENT LACROSSE FACILITIES
An inventory data base has been developed for each of box lacrosse and field lacrosse. The information has been compiled in Microsoft Excel as it was deemed most functional for use by staff and with other office systems. The inventory for each playing location and the compiled field or box inventories provide information for league needs or event hosting purposes, as well as acting as a baseline of data for future upgrades or additions as the sports grow. The inventory data collection tool was designed with staff and BCLA Advisory Committee input. The inventory questionnaire requested basic descriptive information about each individual playing location, team support areas, technical and media support systems and surrounding amenities.
2 BCLA FACILITY REPORT AND RECOMMENDATIONS 2013
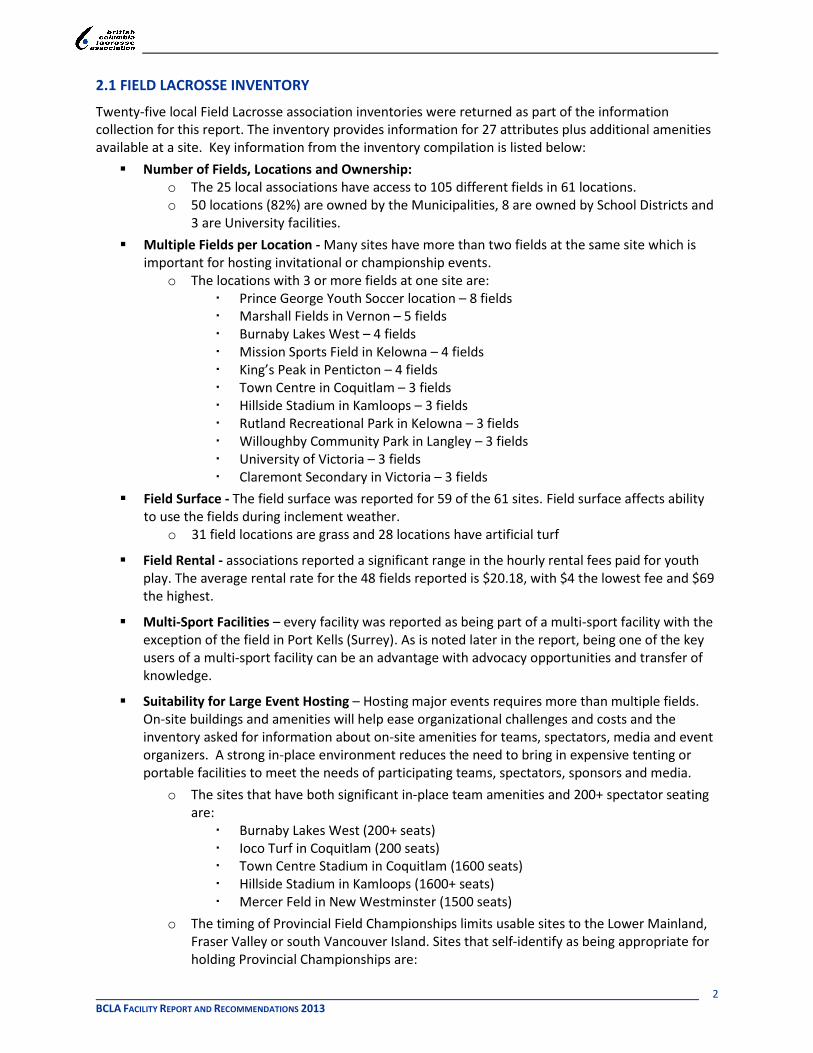
2.1 FIELD LACROSSE INVENTORY
Twenty-five local Field Lacrosse association inventories were returned as part of the information collection for this report. The inventory provides information for 27 attributes plus additional amenities available at a site. Key information from the inventory compilation is listed below:
Number of Fields, Locations and Ownership: o The 25 local associations have access to 105 different fields in 61 locations. o 50 locations (82%) are owned by the Municipalities, 8 are owned by School Districts and
3 are University facilities.
Multiple Fields per Location - Many sites have more than two fields at the same site which is important for hosting invitational or championship events.
o The locations with 3 or more fields at one site are: Prince George Youth Soccer location – 8 fields Marshall Fields in Vernon – 5 fields Burnaby Lakes West – 4 fields Mission Sports Field in Kelowna – 4 fields King’s Peak in Penticton – 4 fields Town Centre in Coquitlam – 3 fields Hillside Stadium in Kamloops – 3 fields Rutland Recreational Park in Kelowna – 3 fields Willoughby Community Park in Langley – 3 fields University of Victoria – 3 fields Claremont Secondary in Victoria – 3 fields
Field Surface - The field surface was reported for 59 of the 61 sites. Field surface affects ability to use the fields during inclement weather.
o 31 field locations are grass and 28 locations have artificial turf
Field Rental - associations reported a significant range in the hourly rental fees paid for youth play. The average rental rate for the 48 fields reported is $20.18, with $4 the lowest fee and $69 the highest.
Multi-Sport Facilities – every facility was reported as being part of a multi-sport facility with the exception of the field in Port Kells (Surrey). As is noted later in the report, being one of the key users of a multi-sport facility can be an advantage with advocacy opportunities and transfer of knowledge.
Suitability for Large Event Hosting – Hosting major events requires more than multiple fields. On-site buildings and amenities will help ease organizational challenges and costs and the inventory asked for information about on-site amenities for teams, spectators, media and event organizers. A strong in-place environment reduces the need to bring in expensive tenting or portable facilities to meet the needs of participating teams, spectators, sponsors and media.
o The sites that have both significant in-place team amenities and 200+ spectator seating are:
Burnaby Lakes West (200+ seats) Ioco Turf in Coquitlam (200 seats) Town Centre Stadium in Coquitlam (1600 seats) Hillside Stadium in Kamloops (1600+ seats) Mercer Feld in New Westminster (1500 seats)
o The timing of Provincial Field Championships limits usable sites to the Lower Mainland, Fraser Valley or south Vancouver Island. Sites that self-identify as being appropriate for holding Provincial Championships are:

3 BCLA FACILITY REPORT AND RECOMMENDATIONS 2013
Burnaby Lakes West Town Centre and Town Centre Stadium in Coquitlam Willoughby Community Park in Langley Merle Logan in Nanaimo Mercer and Queen`s Park East in New Westminster University of Victoria
On-Site Amenities – a few of the facilities being used are municipal fields without access to a community centre or other buildings to provide basic amenities such as washrooms or shelter.
Embedded Lines - 17 of the 25 associations report women’s and/or girl’s play, with 7 sites having embedded lines for both men’s and women’s play. The inclusion of lacrosse as a dedicated sport at a facility bodes well for access, negotiations for amenity improvements and ease of preparation for games and practices.
o The sites with embedded lines for both men and women are: Burnaby Lakes West Burnaby Central Secondary Town Centre in Coquitlam Cowichan Sportsplex in Duncan Willoughby Community Park in Langley Queen’s Park East in New Westminster
2.2 BOX LACROSSE INVENTORY
Thirty-one of forty-two local associations submitted the Box Facility inventories during the April to June 2013 collection period. The BCLA is strongly encouraged to continue to request the information to complete the information. Although there are some trends indicated, definitive information about all facilities can’t be provided at this time. The 11 associations that have not submitted facility information as of the end of 2013 are Alberni Valley, Delta, Kelowna, Langley, MacKenzie, Mission, Quesnel, Ridge Meadows, Vanderhoof, Victoria, Vancouver and West Kootenay. From the 31 associations participating in the inventory submission, the following key information has been gleaned from the compilation.
Number of Boxes, Location and Ownership – o Within the 31 reporting associations, information has been collected for 114 box
lacrosse surfaces at 96 different facility sites. Seventy-five (75) of the boxes are indoor and 39 outdoor. Only 1 outdoor box is covered. (Creekside Park in Vernon)
o 90 of the facilities are owned by Municipalities, 1 by a Club / Association, 2 are privately owned and 3 owned by “other”. One of the “other owner” facilities is on the Lower Nicola Valley Indian Reserve.
o The 31 reporting associations provide programming at facilities in 37 different communities.
Multiple Boxes per Location – Ten locations have 2 playing surfaces at the same site: o Porier Sport & Leisure Centre in Coquitlam o Sports Centre in Courtenay o Pomoroy Sports Centre in Fort St John o Westshore Parks & Recreation in Victoria (Juan de Fuca Association) o Nanaimo Ice Centre o Panorama Recreation Centre in Central Saanich

4 BCLA FACILITY REPORT AND RECOMMENDATIONS 2013
o Port Coquitlam Recreation Centre o Soccer Centre in Prince George o Shaw Centre in Salmon Arm o Cariboo Memorial in Williams Lake o The Westshore Parks & Recreation facility in Victoria is the only site that has 2 outdoor
boxes
Field Rental – there was a wide range of rental fees reported, with no rental fee at all for a number of the outdoor boxes.
o The lowest rental rate of 48 reported for indoor is $23.44 and the highest $69. The median is $46.50 and the average rate $46.40.
o Campbell River, Courtenay, Coquitlam, New Westminster, Parksville and White Rock specifically reported a zero fee for their outdoor boxes.
o Of the 11 outdoor boxes that reported a rental fee, the low is 6.61 and the high $56. The average is $30.37 and the median $16.32.
Use of Facilities – the majority of the boxes are used for all age groups, with outdoor boxes being used mainly as practice boxes for younger age groups.
o Outdoor boxes are used for league play in Duncan, Esquimalt, Victoria, New Westminster, Central Saanich and Port Moody.
Multi-Sport Facilities – 81 box lacrosse sites are part of multi-sport facilities. Most of the stand-alone facilities are outdoor boxes. A number of indoor facilities not reported as multi-sport are in fact “multi-use” as they can be configured for a number of different types of activities.
Suitability for Large Event Hosting – Indoor box lacrosse facilities have the advantage of being in buildings designed for hockey, lacrosse and other sporting activities. Necessary amenities such as change rooms, tea areas, a room for officials and some spectator seating is common. As facilities vie for rental income and community economic activity from hosting larger tournaments or championships, they are upgrading their facilities to better meet the needs of event media and sponsors.
o 33 facilities were identified by the association respondents as being suitable for Provincial Championships. Multiple indoor sites in close proximity are located in:
Burnaby (3 locations, 2000 + 500 + 500 spectators) Chilliwack (2 locations, 3000 + 300 spectators) Fort St John (1 location, 2 boxes) Juan de Fuca - Victoria (1 location, 2 boxes, 2300 spectators) Kamloops, (2 locations, 3 boxes, 1000 + 1500 + 2500 spectators) Nanaimo (2 locations, 3 boxes, 750 + 2500 spectators) New Westminster (2 locations, 2 boxes, 3500 + 200 spectators) Port Moody / Port Coquitlam (2 locations, 3 boxes, 500 + 384 + 380 spectators) Prince George (2 locations, 3 boxes, 173 + 1772 + 1200 spectators) Richmond (1 location, 2 sites, 2 boxes, 2000 + 200 spectators) Vernon (4 locations, 4 boxes, 2000 + 100 + 100 + 250 spectators)
On-Site Amenities – the multi-sport and multi-use complexes have many if not all of the amenities needed for practice and league play. Tournament needs may exceed capacity in some cases.
o the indoor sites all have from 2 to 8 Team Change Room , plus a separate Officials room. o the outdoor boxes do not have indoor change rooms or washrooms unless they are part
of a larger complex. o the majority of the indoor sites also have food concessions available during prime time
use or tournaments.

5 BCLA FACILITY REPORT AND RECOMMENDATIONS 2013
Facility Issues – information was requested that is useful in assessing a facility’s best use for competition.
o A number of the outdoor boxes were reported as having inadequate lighting.
o A handful of indoor arenas were noted as also having concerns with lighting along with issues raised at some sites about inadequate ceiling heights. The opinion of a senior official should be sought before major tournaments are assigned to any site to ensure alignment with technical requirements and expectations.
3. FIL NEW COMMON FIELD MARKINGS
At their 2012 General Assembly, the Federation of International Lacrosse (FIL) approved “Common Field Markings” for Men’s and Women’s Field Lacrosse1. The FIL is introducing the common or unified lines for the 2015 U19 Women’s World Championship, the 2017 Women’s World Cup, the 2018 Men’s World Championship with unified dimensions 2019 and beyond for all events. The 2016 U19 Men’s World Championship being hosted in Coquitlam will use traditional lines. The FIL is asking that changes to domestic fields be made as soon as is practical. Associations and BCLA should be advising municipalities and institutions about these changes as soon as possible, so that field surfaces with embedded lines that are being upgraded or new facilities being built can have the proper lines in place. The new dimensions and the their application to various field sizes will be in the 2015-16 Men’s Rule book and the 2015-2018 Women’s Rule book.
4. SUCCESSFUL PRACTICES FROM THE LACROSSE COMMUNITY
Several Box and Field Lacrosse local association contacts were identified by BCLA for interviews regarding their facility-related activity. Interviewees spoke about their current practices around facility use and administration, and provided their best advice regarding optimizing local facility use and access. The procedural workings and relationships between facility owner / manager and the local lacrosse association create a unique dynamic within each community. The involvement of other sport users with the majority of facilities listed in the two inventories adds another layer of complexity to discussions. However, through the interviews, successful trends became apparent. The compilation of useful practices is presented below.
4.1 SUCCESSFUL PRACTICES FOR DEALING WITH FACILITY OWNERS AND WORKERS
4.1.1 Building Relationships
The underlying advice from every interview was the importance of building and maintaining positive relationships with the facility owners and facility workers. That over-riding necessity will impact every request, every issue raised and every solution sought. Relationships do depend on the people involved. Every time there is a change in contacts for either the association or the facility, a new relationship has to be forged. It takes purposeful and deliberate work on the part of the associations.
6 BCLA FACILITY REPORT AND RECOMMENDATIONS 2013
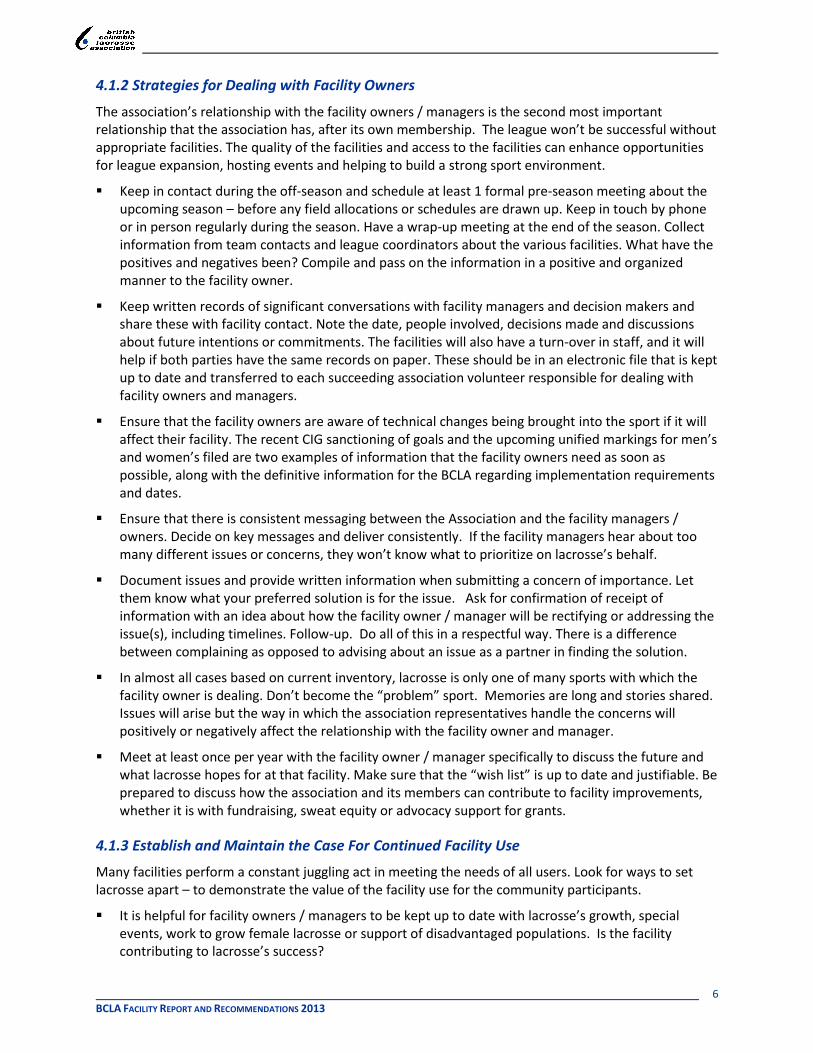
4.1.2 Strategies for Dealing with Facility Owners
The association’s relationship with the facility owners / managers is the second most important relationship that the association has, after its own membership. The league won’t be successful without appropriate facilities. The quality of the facilities and access to the facilities can enhance opportunities for league expansion, hosting events and helping to build a strong sport environment.
Keep in contact during the off-season and schedule at least 1 formal pre-season meeting about the upcoming season – before any field allocations or schedules are drawn up. Keep in touch by phone or in person regularly during the season. Have a wrap-up meeting at the end of the season. Collect information from team contacts and league coordinators about the various facilities. What have the positives and negatives been? Compile and pass on the information in a positive and organized manner to the facility owner.
Keep written records of significant conversations with facility managers and decision makers and share these with facility contact. Note the date, people involved, decisions made and discussions about future intentions or commitments. The facilities will also have a turn-over in staff, and it will help if both parties have the same records on paper. These should be in an electronic file that is kept up to date and transferred to each succeeding association volunteer responsible for dealing with facility owners and managers.
Ensure that the facility owners are aware of technical changes being brought into the sport if it will affect their facility. The recent CIG sanctioning of goals and the upcoming unified markings for men’s and women’s filed are two examples of information that the facility owners need as soon as possible, along with the definitive information for the BCLA regarding implementation requirements and dates.
Ensure that there is consistent messaging between the Association and the facility managers / owners. Decide on key messages and deliver consistently. If the facility managers hear about too many different issues or concerns, they won’t know what to prioritize on lacrosse’s behalf.
Document issues and provide written information when submitting a concern of importance. Let them know what your preferred solution is for the issue. Ask for confirmation of receipt of information with an idea about how the facility owner / manager will be rectifying or addressing the issue(s), including timelines. Follow-up. Do all of this in a respectful way. There is a difference between complaining as opposed to advising about an issue as a partner in finding the solution.
In almost all cases based on current inventory, lacrosse is only one of many sports with which the facility owner is dealing. Don’t become the “problem” sport. Memories are long and stories shared. Issues will arise but the way in which the association representatives handle the concerns will positively or negatively affect the relationship with the facility owner and manager.
Meet at least once per year with the facility owner / manager specifically to discuss the future and what lacrosse hopes for at that facility. Make sure that the “wish list” is up to date and justifiable. Be prepared to discuss how the association and its members can contribute to facility improvements, whether it is with fundraising, sweat equity or advocacy support for grants.
4.1.3 Establish and Maintain the Case For Continued Facility Use
Many facilities perform a constant juggling act in meeting the needs of all users. Look for ways to set lacrosse apart – to demonstrate the value of the facility use for the community participants.
It is helpful for facility owners / managers to be kept up to date with lacrosse’s growth, special events, work to grow female lacrosse or support of disadvantaged populations. Is the facility contributing to lacrosse’s success?

7 BCLA FACILITY REPORT AND RECOMMENDATIONS 2013
Many facilities want to be part of hosting planning in the very early stages – before a bid is submitted. Hosting an event is a boost for the community and the facility, and may be a way to get on-site upgrades prioritized.
Use the times that the association is allocated. Don’t try to protect times so that another sport can’t use the facility. Frequent empty timeslots may result in the facility revisiting the amount of time given to lacrosse. Demonstrate that lacrosse needs and makes good use of the time that is booked.
There may be times when a facility makes a special request on behalf of another sport to “borrow” lacrosse time for a special event. If at all possible, consider the request and perhaps negotiate a release of time for lacrosse events as a trade-off.
Be a good citizen at each facility used. Pick up garbage, use re-cycling bins and collect articles left behind after games or practices. Teach the participants, coaches and spectators that their use of the facilities is a privilege and they need to conduct themselves accordingly.
4.1.4 Have a Positive Community Presence
Most of the lacrosse facilities are municipally owned with a mandate to serve their community. The municipalities support sport, the arts, many social activities and community events. Find opportunities for lacrosse to show that the association is a good community partner.
Be visible in supporting community endeavors
Say thank you to both those who make decisions and the workers who are on-site at facilities
Invite local politicians to events. Publicly thank them for their support of community sport and lacrosse.
Instil a sense of pride and respect for the community and the facilities in players, coaches, officials and parents.
4.2 SUCCESSFUL PRACTICES WITHIN THE LACROSSE ASSOCIATION
4.2.1 Local Association Contacts and Scope of Responsibility
Designate a position that is the primary liaison on behalf of the lacrosse association with facility managers and other facility contacts. If possible, this person should be the liaison for all facilities used by the association. The designated person could be the President, a Vice President, the league scheduler or a separate Facility Liaison.
o Meet the key people for each facility in person. Get to know, by name, the people responsible for facility set-up, maintenance, repairs and equipment.
o Provide contact information (email and phone)
Name a secondary contact who also meets the individuals responsible for facility bookings, management and maintenance. This individual must be kept up to date about facility discussions and issues so that they can step in as necessary for vacation or work coverage.
Create the volunteer job descriptions for both the primary and secondary contacts, and make these available on the association website and/or policy manual. The descriptions need to specify what decisions they can and cannot make on their own authority.
If the Facility Liaison is not on the Board of Directors, they still must regularly report to the Executive or Board and keep them informed about issues, changes, future plans or pressures that may impact lacrosse now and in the future.

8 BCLA FACILITY REPORT AND RECOMMENDATIONS 2013
4.2.2 Transfer of Knowledge
Plan for succession within the association for facility contacts and planning. Ensure that people coming into the role know who the various facility contacts are, what their roles are, and what discussions have recently taken place about facility costs, use and access.
Ensure that formal association information is kept and transferred from volunteer to volunteer. This should include the recent history for rent levels, scheduling decisions, hosting projections, facility improvements, notes from meetings with the facility owners / managers and any conversations about future facility plans.
4.2.3 Ensure Communication and Accountability about Facilities to the Membership
At the end of each year, develop a one page summary of issues, actions, decisions and steps to be taken in the next 2 – 3 years as a report to the membership.
Consider facilities as part of the recruitment and retention strategies for the association. Accommodate children and youth first with time allocations for practices and games. Make the sport accessible for recruiting and retaining younger participants.
Ensure that the youth and adult leagues build a good relationship around facility use.
4.2.4 Planning for Upgraded or New Facilities
The association Board should include a discussion about facility needs and required action as part of their strategic planning for the year and future years.
Build a case for future facility needs. For example - what are the trends and demographic information for the community and the sport? How will another turf or 10 more hours per week on the dry floor help the sport? What is the capacity for the association with the current facilities and hours available?
Stay in touch with the planners and senior decision-makers in municipalities regarding facility plans. Minor facility upgrades such as new goals may be fairly straight-forward to negotiate if the facility owners are given as much time as possible to budget for the change. Other, more significant changes in an existing facility or development of a new facility will take many years to bring about so planning and demonstration of need must be done well ahead of time. A new facility could take 10 or more years from initial discussions to completion.
It is always useful for association Directors to get to know the parents of participants as a positive strategy for managing many aspects of the association. In the case of facility planning, there may be individuals whose professions or sphere of influence can help with a campaign for facility development.
4.2.5 Issues Management
Difficulty with access to facilities was identified by one association representative as an issue that affected growth opportunities. This particular facility is used by multiple sports with conflicting seasons and lacrosse is the smallest of the groups. Inroads are slowly being made as relationships are being built but it is a year to year challenge. All association representatives agreed that tenuous circumstances do occur every few years affecting access and use. Examples that have been experienced include lengthy closures for maintenance or improvements, additional sports being added as users thus putting pressure on time availability for the current sports, extension of ice into the spring for events or prolonged poor weather limiting field play.

9 BCLA FACILITY REPORT AND RECOMMENDATIONS 2013
Not every issue can be solved immediately and practices and games may be affected. The relationships with facility owners and other users will be key to ensuring that good solutions are found.
4.2.6 Dealing with Other Sports
The majority of the lacrosse facilities are multi-use, with the exceptions being a handful of outdoor boxes. Every association shares facilities with other sport users. As with the facility owners and managers, the relationships with other users are important to nurture. Although it may seem so at times, the other sports are not competitors, and allocation of facility time is not a strict win or lose situation. An adversarial attitude will not help with negotiations facility managers.
Ensure that the association Facility Liaison gets to know their counter-part for the sports that share the facility.
Be aware of major events that the other sports may be hosting that will affect use of a facility.
Speak with the other sports about their plans or needs for facility development – multiple sports approaching a municipality demonstrate strength and collegiality.
Discuss the needs of shared use sports for minor upgrades or improvements at current sites. There may be improvements that can be funded by sports to enhance the facility and sport experience for users, but aren’t necessarily high priority investment areas for facility owners. Examples of this type of potential joint investment are shelters for outdoor team benches and technical areas, display boards or cases at indoor facilities and score boards or storage containers for equipment.
5. BCLA MEMBERSHIP GROWTH PLANS AND FACILITIES
5.1 LACROSSE MEMBERSHIP
Member growth is a high priority in the 2012 – 2016 Strategic Plan, to be addressed through increasing the retention rate of current players, and conducting successful targeted recruitment activities. Registration numbers by age group from 2008 through to 2013 for all Field and Minor Box Lacrosse can be found in Appendices A and B, sorted by Association or Club. Also listed are the number and type of facilities used in 2013 for each age group. Bar graph representations by age group and year are also presented. Senior Box registration information can be found in Appendix C.
5.1.1 Targeted Membership Growth and Facilities
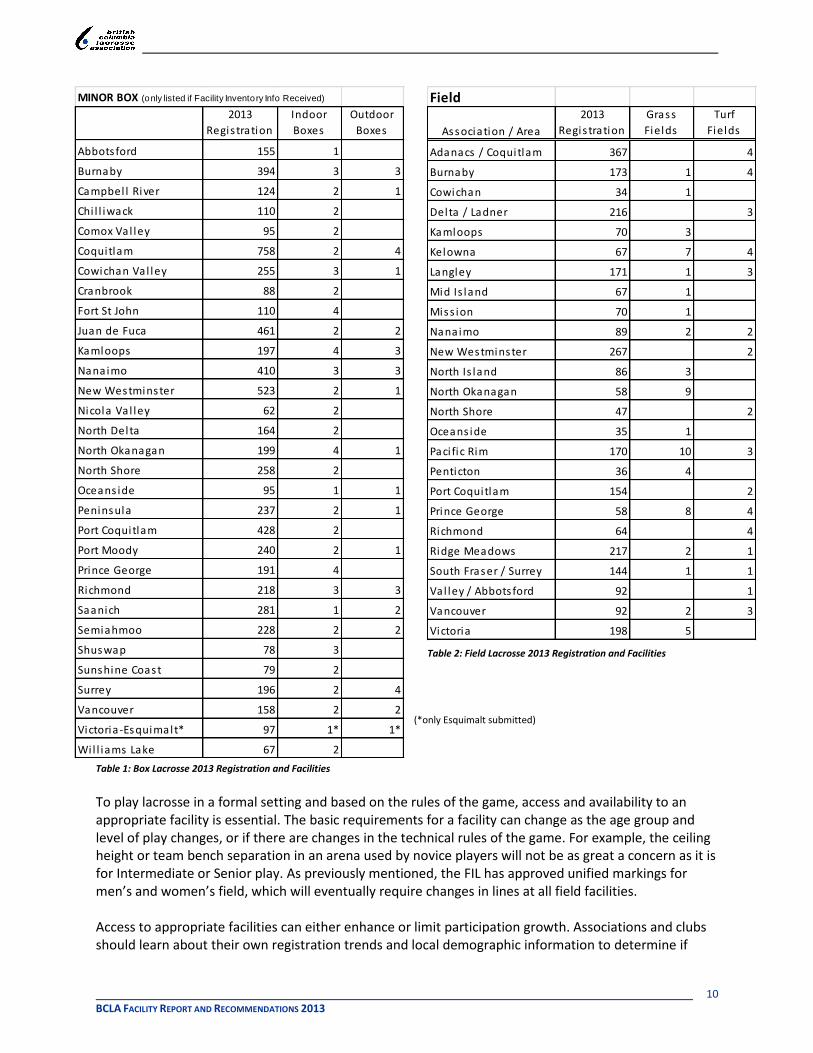
Membership growth targets for the 2012 to 2016period are for a 10% increase at each age and level of play, for both box and field. Membership capacity is directly tied to facilities capacity. Facility availability, access and location have to accommodate the numbers playing the game as well as any new participants entering the sport through recruitment endeavours. Tables 1 and 2 are quick views of the reported 2013 registration for each association, and the numbers of boxes or field reported as being used for practices, games and tournaments. There is no apparent direct correlation between the number of facilities used by an association and the number of players participating in either field or box lacrosse. Key factors such as hours of access per week at each location, weeks of availability and number of games and practices scheduled are all additional contributors that will determine facility impact on participant numbers. This information is valuable to track over time within each association to ascertain impact and to measure capacity at each facility and for programming over-all.
10 BCLA FACILITY REPORT AND RECOMMENDATIONS 2013
Field
Association / Area
2013
Regis tration
Grass
Fields
Turf
Fields
Adanacs / Coquitlam 367 4
Burnaby 173 1 4
Cowichan 34 1
Delta / Ladner 216 3
Kamloops 70 3
Kelowna 67 7 4
Langley 171 1 3
Mid Is land 67 1
Miss ion 70 1
Nanaimo 89 2 2
New Westminster 267 2
North Is land 86 3
North Okanagan 58 9
North Shore 47 2
Oceans ide 35 1
Paci fic Rim 170 10 3
Penticton 36 4
Port Coquitlam 154 2
Prince George 58 8 4
Richmond 64 4
Ridge Meadows 217 2 1
South Fraser / Surrey 144 1 1
Val ley / Abbots ford 92 1
Vancouver 92 2 3
Victoria 198 5
MINOR BOX (only listed if Facility Inventory Info Received)
2013
Regis tration
Indoor
Boxes
Outdoor
Boxes
Abbotsford 155 1
Burnaby 394 3 3
Campbel l River 124 2 1
Chi l l iwack 110 2
Comox Val ley 95 2
Coquitlam 758 2 4
Cowichan Val ley 255 3 1
Cranbrook 88 2
Fort St John 110 4
Juan de Fuca 461 2 2
Kamloops 197 4 3
Nanaimo 410 3 3
New Westminster 523 2 1
Nicola Va l ley 62 2
North Delta 164 2
North Okanagan 199 4 1
North Shore 258 2
Oceans ide 95 1 1
Peninsula 237 2 1
Port Coquitlam 428 2
Port Moody 240 2 1
Prince George 191 4
Richmond 218 3 3
Saanich 281 1 2
Semiahmoo 228 2 2
Shuswap 78 3
Sunshine Coast 79 2
Surrey 196 2 4
Vancouver 158 2 2
Victoria-Esquimalt* 97 1* 1*
Wil l iams Lake 67 2
Table 2: Field Lacrosse 2013 Registration and Facilities
(*only Esquimalt submitted)
Table 1: Box Lacrosse 2013 Registration and Facilities
To play lacrosse in a formal setting and based on the rules of the game, access and availability to an appropriate facility is essential. The basic requirements for a facility can change as the age group and level of play changes, or if there are changes in the technical rules of the game. For example, the ceiling height or team bench separation in an arena used by novice players will not be as great a concern as it is for Intermediate or Senior play. As previously mentioned, the FIL has approved unified markings for men’s and women’s field, which will eventually require changes in lines at all field facilities. Access to appropriate facilities can either enhance or limit participation growth. Associations and clubs should learn about their own registration trends and local demographic information to determine if

11 BCLA FACILITY REPORT AND RECOMMENDATIONS 2013
additional facility time is needed. The following questions should be considered by each association in order to ascertain facility requirements for current and planned membership numbers:
1. What is the minimum and maximum number on a team – per age group – that can be properly accommodated (eg: the appropriate number to be coached, a reasonable number for drills and scrimmages in practice, be able to offer reasonable playing time for each team member)
a. What is the current participation numbers for each team, and what have the trends been for the past 3 years
b. If there is room for additional participants on teams, how many can be accommodated before a new team should be formed
2. What are the appropriate number of practice hours per week that should be available to each team – by age group and Lacrosse’s Long-term Athlete Development model?
3. What is the number of hours required to accommodate the league schedule, per week and per age group?
4. What is the appropriate split in use for each team and age group if the association uses grass and turf fields, or indoor and outdoor boxes?
5. What effect does adding or deleting a team have – per age group – on the number of hours needed at each facility?
6. The location of facilities can affect participant rates if they are difficult to get to, have little public transit or inadequate parking.
a. How accessible are current facilities to all neighbourhoods in the community? b. Is there planned residential development that will bring significant numbers of sport
entry age children into the community?
5.1.2 BCLA Membership 2008 - 2013
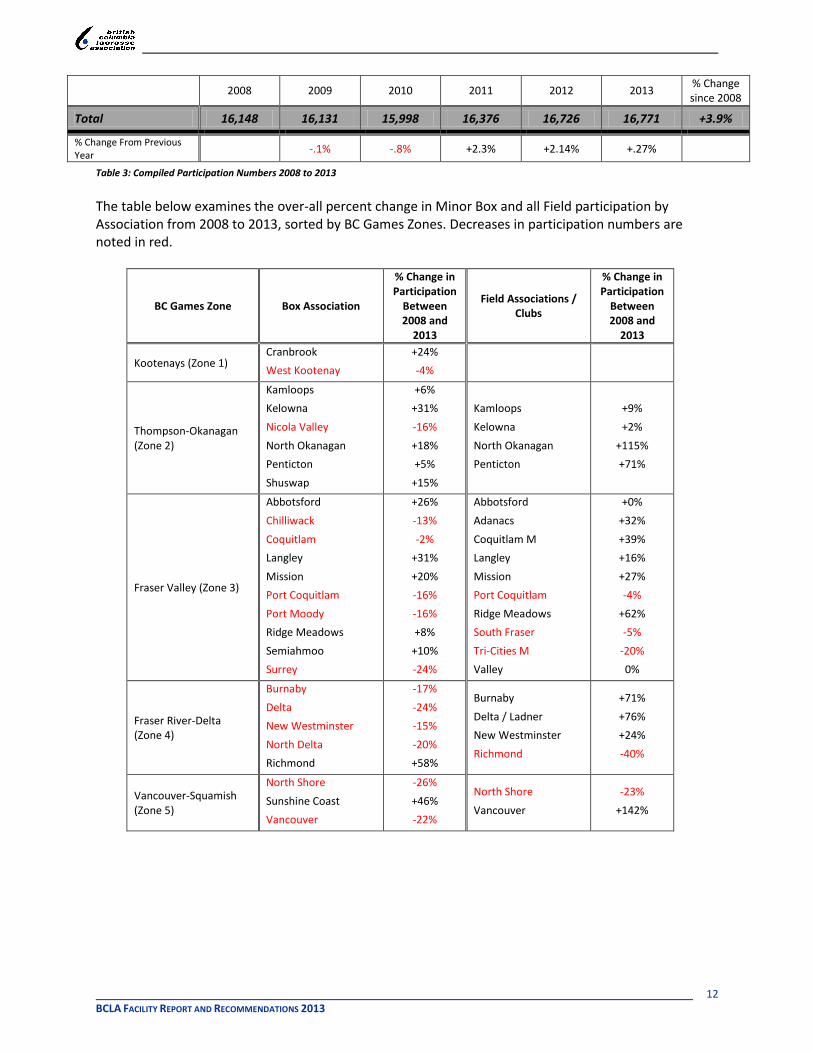
The participation trends demonstrated over time are an important component of any campaign to have current facilities improved or new facilities built. The table below shows the over-all membership gains and losses from 2008 to 2013. Box Lacrosse registration has decreased by about 4% during this period, while field registration has increased by over 46%. As a proportion of membership, in 2008, box lacrosse represented almost 85% of the participants. In 2013, box lacrosse accounted for about 78% of the membership.
2008 2009 2010 2011 2012 2013 % Change since 2008
Minor Boys Box 8,836 8,366 8,116 8,089 7,938 7,972 -9.8%
Minor Girls Box 777 850 834 880 872 913 +17.5%
Senior Box 2,783 3,014 3,028 2,995 3,001 2,775 -.3%
Sub-Total – Box Registration
12,396 12,230 11,978 11,954 11,811 11,660 -5.9%
Recreation / Development
1,279 1,200 1,200 1,200 1,300 1,450 +13.37%
All Box Lacrosse 13,675 13,430 13,178 13,164 13,111 13,100 -4.2%
Youth & HS Field 1,974 2,065 2,246 2,608 2,985 3,064 +55.22%
Men’s Field 256 254 228 230 214 178 -30.5%
Women’s Field 243 382 346 374 416 419 +72.4%
All Field Lacrosse 2,575 2,810 2,937 3,328 3,721 3,769 +46.4%
12 BCLA FACILITY REPORT AND RECOMMENDATIONS 2013
2008 2009 2010 2011 2012 2013 % Change since 2008
Total 16,148 16,131 15,998 16,376 16,726 16,771 +3.9%
% Change From Previous Year
-.1% -.8% +2.3% +2.14% +.27%
Table 3: Compiled Participation Numbers 2008 to 2013
The table below examines the over-all percent change in Minor Box and all Field participation by Association from 2008 to 2013, sorted by BC Games Zones. Decreases in participation numbers are noted in red.
BC Games Zone Box Association
% Change in Participation
Between 2008 and
2013
Field Associations / Clubs
% Change in Participation
Between 2008 and
2013
Kootenays (Zone 1) Cranbrook
West Kootenay
+24%
-4%
Thompson-Okanagan (Zone 2)
Kamloops
Kelowna
Nicola Valley
North Okanagan
Penticton
Shuswap
+6%
+31%
-16%
+18%
+5%
+15%
Kamloops
Kelowna
North Okanagan
Penticton
+9%
+2%
+115%
+71%
Fraser Valley (Zone 3)
Abbotsford
Chilliwack
Coquitlam
Langley
Mission
Port Coquitlam
Port Moody
Ridge Meadows
Semiahmoo
Surrey
+26%
-13%
-2%
+31%
+20%
-16%
-16%
+8%
+10%
-24%
Abbotsford
Adanacs
Coquitlam M
Langley
Mission
Port Coquitlam
Ridge Meadows
South Fraser
Tri-Cities M
Valley
+0%
+32%
+39%
+16%
+27%
-4%
+62%
-5%
-20%
0%
Fraser River-Delta (Zone 4)
Burnaby
Delta
New Westminster
North Delta
Richmond
-17%
-24%
-15%
-20%
+58%
Burnaby
Delta / Ladner
New Westminster
Richmond
+71%
+76%
+24%
-40%
Vancouver-Squamish (Zone 5)
North Shore
Sunshine Coast
Vancouver
-26%
+46%
-22%
North Shore
Vancouver
-23%
+142%
13 BCLA FACILITY REPORT AND RECOMMENDATIONS 2013
BC Games Zone Box Association
% Change in Participation
Between 2008 and
2013
Field Associations / Clubs
% Change in Participation
Between 2008 and
2013
Vancouver Island – Central Coast (Zone 6
Alberni Valley
Campbell River
Comox Valley
Cowichan Valley
Juan de Fuca
Nanaimo
Oceanside
Peninsula
Saanich
Victoria - Esquimalt
+69%
-1%
-31%
-2%
+3%
+13%
-47%
+22%
-20%
-25%
Cowichan
Mid Island
Nanaimo
North island
Oceanside
Pacific Rim
Victoria
-32%
+43%
-11%
+54%
-3%
+56%
-14%
North West (Zone 7)
Cariboo - Northeast (Zone 8)
Fort St John
MacKenzie
Prince George
Quesnel
Vanderhoof
Williams Lake
+1%
-20%
-15%
-42%
+20%
-27%
Prince George +142%
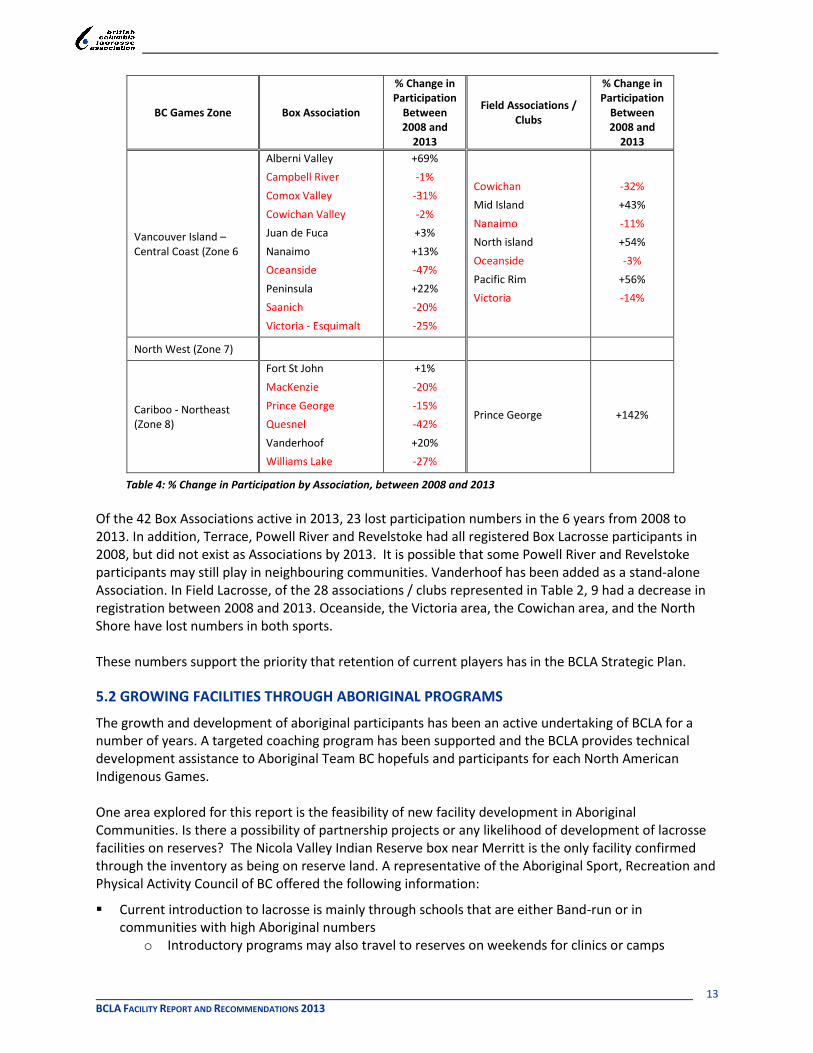
Table 4: % Change in Participation by Association, between 2008 and 2013
Of the 42 Box Associations active in 2013, 23 lost participation numbers in the 6 years from 2008 to 2013. In addition, Terrace, Powell River and Revelstoke had all registered Box Lacrosse participants in 2008, but did not exist as Associations by 2013. It is possible that some Powell River and Revelstoke participants may still play in neighbouring communities. Vanderhoof has been added as a stand-alone Association. In Field Lacrosse, of the 28 associations / clubs represented in Table 2, 9 had a decrease in registration between 2008 and 2013. Oceanside, the Victoria area, the Cowichan area, and the North Shore have lost numbers in both sports. These numbers support the priority that retention of current players has in the BCLA Strategic Plan.
5.2 GROWING FACILITIES THROUGH ABORIGINAL PROGRAMS
The growth and development of aboriginal participants has been an active undertaking of BCLA for a number of years. A targeted coaching program has been supported and the BCLA provides technical development assistance to Aboriginal Team BC hopefuls and participants for each North American Indigenous Games. One area explored for this report is the feasibility of new facility development in Aboriginal Communities. Is there a possibility of partnership projects or any likelihood of development of lacrosse facilities on reserves? The Nicola Valley Indian Reserve box near Merritt is the only facility confirmed through the inventory as being on reserve land. A representative of the Aboriginal Sport, Recreation and Physical Activity Council of BC offered the following information:
Current introduction to lacrosse is mainly through schools that are either Band-run or in communities with high Aboriginal numbers
o Introductory programs may also travel to reserves on weekends for clinics or camps
14 BCLA FACILITY REPORT AND RECOMMENDATIONS 2013
o At this time, there is no system in place to track whether or not Aboriginal participants from clinics are transitioning into local leagues
Boys Box lacrosse is in the 2014 North American Indigenous Games. The inclusion of girls may happen in future years when more development has taken place.
On reserves, the federal funding that supports physical infrastructure doesn’t general provide for recreational facilities. However, it is possible that a Band with its own economic development opportunities may consider supporting recreation facilities.
More than half of BC’s Aboriginal people live in urban settings and sport participants will use schools or community recreation facilities.
5.3 GROWING INTO NEW COMMUNITIES
Both field and box lacrosse use fairly standard facility types that are available in many community inventories. To accommodate lacrosse, communities will have to meet the minimum standards for on-site lines, team areas, floor or field surface, goals and other equipment. Even if that physical facility need can be met, of greater importance for the growth of the game is sufficient technical knowledge of the sport and some proximity to a critical mass of lacrosse activity to sustain participation.
5.3.1 New Areas for Growth
BCLA has had interest expressed from, or has targeted the development of new programs in specific communities.
1. In the North
a. North-east - Chetwynd
i. The Chetwynd & District Rec Centre is a multi-sport complex that does include 1 arena, currently home to hockey, speed skating and figure skating. The town has several soccer fields available for a short spring – summer season.
b. North-Central - Vanderhoof
i. Vanderhoof recently formed a lacrosse association and currently has 42 boys playing Box Lacrosse from Tyke up to Midget.
2. In the Kootenays
a. Contacts have already been made by BCLA in the Trail, Castlegar and Nelson areas. There is a strong lacrosse history in the area with the Rossland Redman being stalwarts of the senior leagues in the 1940’s and 50’s. They are installed in the Trail Home of Champions.
i. Trail has one large and one small rink at the trail Memorial Arena. Both are available for non-ice events after April. This is a large facility that houses several other sports and fitness areas.
ii. Nelson has an active Regional Sports Council that represents programming concerns to the city. There is an arena at the Nelson & District Community Complex, and several soccer fields in town.
iii. Castlegar has 2 arenas. The Community Complex arena has ice from August to March and the dry floor is available from April through July for rentals. The Pioneer Arena has ice October through March. The town has several soccer fields in the Pass Creek Regional Park and at schools.
b. BCLA is considering expansion into 3 East Kootenay communities (including Cranbrook) to facilitate formation of a Commission. Fernie, Sparwood and Kimberley are the closest communities to Cranbrook.

15 BCLA FACILITY REPORT AND RECOMMENDATIONS 2013
i. Fernie has both an Arena and access several soccer fields. The recreation department advertises box lacrosse at the arena on the dry floor. Field lacrosse is not currently a community activity but the town owns a soccer fields and shares other fields with local schools. Fernie has a Community Plan Update draft (November 2013)2 that includes references to an expansion of indoor recreation facilities and activities. There may be opportunities to outfit existing fields and the arena with basic lacrosse equipment as part of the plan implementation.
ii. Sparwood commissioned a Master Plan for its Leisure Centre Grounds, published in February 20133. An outdoor “Sport Court” is to be added and is listed as being suitable for lacrosse, ball hockey and basketball. It will become an outdoor rink in the winter. There also is a soccer field at the same facility that is listed as being in good condition and well-used.
iii. Kimberley has four soccer fields, and does have dry floor rentals available at the local arena.
3. In the Northwest a. Terrace and Kitimat both have had Box lacrosse activity within the past 4 years and have local
facilities suitable for use. Terrace last registered Novice, PeeWee, Bantam and Midget boys in 2010. Kitimat registered an U16 team om 2010.
5.3.2 Growing Within Existing Regions
1. Geographical Expansion: It is often easier to grow a sport through targeted geographical “stretching” rather than trying to “sell” to a new community and uneducated audience. Consider increasing participation by introducing age group segments of programming in small communities that already have some of their children and youth participating in lacrosse in neighbouring, larger centres. A worthwhile exercise is to identify the numbers registered from outlying areas through their postal code, and then investigate the feasibility of starting entry level programs in their own small communities. This strategy is particularly relevant when the distance between communities may limit some parent’s ability or interest in registering their child in the program, and when the entry level ages can be accommodated in more basic facilities. It can also have a positive effect on retention as the young children are now playing with their friends and school mates. 2. University and College Field Lacrosse Teams: The University of British Columbia, the University of Victoria and the University of Alberta all have club teams playing out of their main campuses. Although sport clubs receive minimal financial contribution from the universities, there is an opportunity to use campus facilities and access some organizational support. The majority of schools in the Canadian University Field Lacrosse Association are currently from Ontario and Quebec. With the addition of 2 or 3 BC / Alberta universities or colleges, there may be an opportunity for a western division or league and increased retention of 18 – 22 year olds in the sport.
5.4 REGIONAL POPULATION PROJECTIONS
BC Stats projects population changes for 25 years in the future. Communities use these projections as well as many other pieces of information to anticipate and plan for service requirements for their area. Using the BC Development Regions as a geographical base (see Appendix D), the following populations projections are provided, to the year 2030 and in the age groups most serviced by BC Lacrosse. The 2012 figure is a projection based on the 2011 census.
YEAR AGE Vancouver
Island - Coast
Mainland/ Southwest
Thompson Okanagan
Kootenay Cariboo North Coast
Nechako Northeast BC TOTALS
2012 5 – 9 34,519 137,660 25,229 7,694 8,935 3,673 2,522 4,748 224,980

16 BCLA FACILITY REPORT AND RECOMMENDATIONS 2013
YEAR AGE Vancouver
Island - Coast
Mainland/ Southwest
Thompson Okanagan
Kootenay Cariboo North Coast
Nechako Northeast BC TOTALS
2020 5 – 9 37,419 147,501 27,336 7,126 8,361 3,331 2,314 5,789 239,177
2030 5 – 9 29,897 136,521 22,141 5,380 6,389 2,498 1,796 4,099 273,081
2012 10 - 14 36,763 141,649 26,601 8,038 9,103 3,869 2,587 4,417 233,027
2020 10 - 14 39,916 151,629 29,624 8,375 9,244 3,659 2,512 5,381 250,340
2030 10 - 14 41,200 174,644 30,630 7,076 8,583 3,187 2,309 5,452 278,299
2012 15 - 19 44,100 171,141 31,654 8,472 10,761 4,163 2,850 5,017 278,158
2020 15 - 19 38,807 157,339 28,246 7,980 8,604 3,695 2,411 4,746 251,813
2030 15 - 19 43,994 173,090 32,023 7,828 8,529 3,321 2,236 5,914 276,935
2012 20 - 24 49,888 216,776 34,365 7,473 11,430 3,880 2,315 6,232 332,509
2020 20 - 24 44,843 180,253 28,924 7,860 9,206 3,583 2,455 4,546 281,670
2030 20 - 24 47,657 191,203 31,788 8,199 8,999 3,518 2,235 5,406 299,005
2012 25 - 29 47,737 219,456 32,365 7,603 10,632 3,604 2,224 6,282 328,903
2020 25 - 29 50,787 238,319 35,255 8,200 10,945 3,994 2,486 5,950 355,966
2030 25 - 29 45,843 219,704 31,118 7,932 8,846 3,646 2,218 5,171 324,478
Table 5: BC Stats Population Projections for 2012, 2020 and 2030, by BC Development Regions
The highest population figure for each projected year and within Region is highlighted
o Green – 2012 o Pink – 2020 o Turquoise – 2030
For most people, key sport entry years are ages 5 through 10, with additional opportunities to introduce a sport through recreational and school programs. On the Island, in the Mainland / Southwest, Thompson Okanagan and the Northeast, BC Stats is projecting population increases in these critical entry ages for 2020, and then a significant decrease by 2030. These projections have four immediate impacts on lacrosse.
1. Lacrosse should roll out recruitment initiatives in fairly short order. Children born between 2008 and 2016 will be the best opportunity to grow the sport through recruitment, strictly based on the number of children in the critical sport entry years.
2. Break down recruitment initiatives by community to best target resources, and consider additional data such as projected birth rates, immigration rates and projected migration from other provinces.
3. There will be an impact from an aging population on the type of recreation and sport facilities being developed.
4. The importance of retaining current participants in the sport becomes more critical to achieving the BCLA growth targets. Retention will be more important in keeping the sport strong and vibrant. Within a few short years, lacrosse will not be able to depend on a large influx of new children every year. Rather than replace 10 – 15% of children each year when they leave the sport, work to provide a better experience and retain larger numbers in the sport.

17 BCLA FACILITY REPORT AND RECOMMENDATIONS 2013
6. MUNICIPALITIES AND FACILITY DEVELOPMENT
Staff members from several recreation departments in lacrosse communities were interviewed to provide information about working with sport groups, and the ways in which the Municipality plans and facility decisions are made. Each municipality has different rules and regulations about the use of facilities and the ways in which they determine priorities. Each recreation department is also most interested in getting community members engaged in programs and activities that make use of their facilities and resources. In general, that is the main objective for the departments. The larger communities (cities, towns, regional Districts) have more specific development plans and associations should be able to access them. Small towns or villages sometimes include recreation in larger departments with multiple responsibilities.
6.1 WORKING WITH RECREATION DEPARTMENTS
Community sport is most often managed by volunteer groups outside of the Municipality’s recreation department. Community sport exists under the Canadian sport system from National Sport Organization to Provincial Sport Organization to local Association or Club. This hierarchy has resulted in challenges with horizontal partnerships at the community level – specifically with schools and recreation departments. Community sport is a user of municipal facilities but not seen as a delivery partner in programming. However, this is changing as all parties realize that they need to work together.
Recreation departments want to be able to work well with the individuals who represent their client groups. Good relationships and strong communication are critical to the success of the departments. It is important for the recreation staff to know who their main contacts are with sport groups.
A passive relationship will exist when the sport groups wait for the recreation departments to call annual pre-season meetings and then advise the sports as to what allocations decisions have been made. A more robust relationship, as described in section 3, will ensure that the recreation staff members are aware of the lacrosse associations’ needs, plans and priorities, even if not every decision is to lacrosse’s benefit.
Every municipality is different and local associations should learn about how their own municipal recreation department makes decisions. The queries below can be a starting point to gather relevant information:
o How many years ahead is the department planning for facilities? What is the capital improvement plan (upgrading, retrofits, major maintenance) What is the plan for new facility development Are recreation and sport facilities part of the requirements for land use in new
neighbourhoods? If yes, how does that work?
o What are the expectations of funding from other sources (local associations, clubs, other levels of government, community groups, sponsors) for community facilities
o How are decision made and who tends to be most influential (staff, management, Councillors, Mayor etc)
o What are the department’s current and known future priorities?
o What are the priorities and policies around the citizens being serviced (ie: children and youth, seniors, residency requirements)
Start any conversation with the recreation contact assigned to the sport. Make sure that they are kept up to date with what is happening in lacrosse in the community and don’t go over their head to management with trivial requests or concerns.
18 BCLA FACILITY REPORT AND RECOMMENDATIONS 2013
o Also use opportunities to ensure that management and key politicians are aware of major concerns and major accomplishments. These key messages should be short, simple and consistent from all association leaders.
Association contacts should keep up to date with reports and analyses that are made public by the Department. That work often reflects or affects priority issues and decisions.
6.2 BEING PART OF THE MUNICIPAL AGENDA
Municipalities have priority projects based on a wide range of factors, including community demographics, neighbourhood development or expansion, facility replacement or improvement schedules, shared-use agreements with School Districts and a host of other considerations.
If an association is thinking about the need for new facilities or significant upgrades to current facilities, have conversations with management, the key planners and politicians. Get the project on the radar of decision makers, even if a decision is several years down the road.
If a request is being made, sports will be expected to present a needs analysis and business case to the department. Be prepared by knowing what has happened, what is happening and what is projected to happen in lacrosse.
o Use Canadian Sport for Life and the Lacrosse for Life model to demonstrate what is required through lacrosse development guidelines regarding practice and game times. Recreation departments are using the CSL model for their own work, and they want to be able to anchor programming or allocation choices to the model.
o It is difficult for recreation departments to make too many decisions based on projections. Associations need hard numbers from their registration and other outreach programs. The trends can then lead to discussions about future needs.
o Know what the local participant capacity is based on current facilities, and time allocated to the sport. This will lead to much easier discussions if an arena wants to extend ice time into April or a field needs maintenance done during the field lacrosse playing season.
o Advise the municipality if children are being turned away because the association is at capacity. What is needed to accommodate all children who want to play?
o Know where the participants come from – what percentage are residents in the community that owns the facilities? Many recreation departments have a mandate to serve their own citizens first and may have minimum residency requirements for leagues to pay certain rental rates.
o If a request is being made to change or improve game equipment, why is it needed and what is the impact if it doesn’t happen.
Numbers aren’t always enough to tell the important stories – what is the human interest aspect?
o are there disadvantaged neighbourhoods that are being serviced with positive impact on the children?
o Are players from the community advancing to higher levels of competition, university or college play or the professional levels?
o Is the lacrosse association contributing to the community is some other special way?
6.3 PLANNING FOR FACILITIES
Planning time for capital projects ranged from 5 to 25 years within the various community and sport examples examined for this report. The larger the project, the longer the planning and preparation time needed.

19 BCLA FACILITY REPORT AND RECOMMENDATIONS 2013
Field development tends to have a shorter planning timeframe and requires a smaller investment
than most buildings. o Artificial turf is the surface choice in most communities with up to 8 times more use than
grass. Lights will be added if possible as this also extends the playing time at facilities.
o Facility owners need to be informed about the new FIL common markings required for men’s and women’s fields
Every facility has a life expectancy cycle to it and department capital improvement or replacement planning takes this into account. The discussion about each facility will include:
o Current use, capacity and costs
o Does it get replaced with something new
o Does it need upgrading or expansion
o Does a facility need to be eliminated because of under-use or operating costs that are excessive
It is critical for sports to be involved as a project is being contemplated so that the sports are included early in the design phase. Municipalities are looking for highest possible use, and that will determine what features are included.
o Sports have to keep recreation departments up to date with all technical requirements for all levels of play, so that decisions can be made early about requirements that pertain to certain age groups.
o Planners and designers need to know what the standards are for the floor or field surface, lighting and air quality as well as other requirements
It is now common practice for any public community facility to be multi-use. The cost of land is high and facility use has to warrant the investment.
Municipalities will often try to partner with provincial and federal development initiatives to support facility development with a ⅓ / ⅓ / ⅓ split. Many municipalities have “shovel-ready projects” that can be launched when and if funding becomes available. It is important for the BCLA and associations to be aware of what is currently open and available for community organization or municipal application. Examples of opportunities in recent years include:
o the federal Western Economic Diversification Program has contributed significant dollars to support facilities upgrades and construction. Programs such as the Community Infrastructure Improvement Fund, the Municipal Rural Infrastructure Fund and the Recreational Infrastructure Canada program were accessed by many BC communities for a portion of project costs. None of these programs are currently open, but most budget cycles brings different opportunities. Within the BC Government, the Municipal Engineering Services Branch in the Ministry of Community, Sport & Cultural Development was responsible for administrative support for these federal contribution programs.
o There are a variety of British Columbia government grants available to local governments through the Ministry of Community, Sport & Cultural Development. For example, between 2009 and 2012, a $30M Community Recreation Program was available to support recreational infrastructure projects. Again, each budget cycle has its own priorities and grant opportunities.
Municipalities do not necessarily require financial contributions from a sport group to give a green light to projects that will service multiple activities and sports. However, a financial contribution may help speed up a project, and result in negotiations for priority use of the facility (eg: priority bookings, office space, equipment storage, trophy case).

20 BCLA FACILITY REPORT AND RECOMMENDATIONS 2013
Municipalities are less likely to build a facility that can only be used by one or two sports unless there are a large number of participants that will use the facility to a high capacity (ie: dedicated soccer fields, indoor tennis courts).
With a facility that will only service one or two smaller sports, there will more likely have to be a financial contribution from that sport community. Internal fundraising initiatives can take years to bring in enough money to impact a facility. Associations are encouraged to start as early as possible. This step may be the catalyst to get a project onto the long-term planning table.
Sport groups might consider underwriting the cost of a feasibility study in order to create the business case to move a project forward.
Municipalities will often conduct public consultations about potential new facilities or proposed changes in use at an existing facility. Lacrosse associations should be prepared to take part in that process even if it doesn’t directly impact the league. There is always some learning and take-aways from being at public meetings like this.
There has been an interest expressed by government officials for the purposeful regionalization of large, expensive facilities to service a larger area of the province. Facilities such as 50M pools with competition diving boards, competition ground tracks with competitive field space, or facilities with significant spectator seating requiring a larger footprint all fall into this category.
There has been an increase in sharing facility development between post-secondary institutes and municipalities, with the institution contributing land and gaining some access priorities. This may be an appropriate approach for lacrosse if also partnering with other sports that can share facilities.
Some municipalities have development and shared use agreements with their local School Districts. Schools are given priority access during school time, but this strategy can provide augmented amenities for field sites.
6.4 WORKING WITH OTHER SPORTS
6.4.1 Sports That Share Lacrosse Facilities
Every municipality contact interviewed discussed the increasing importance of sports working together in the community. This is particularly pertinent with sports that share facilities and have similar amenity needs. Box Lacrosse associations and clubs should be talking to all users of arenas and outdoor boxes, including ice hockey, figure skating, short track speed skating, sledge hockey, ball hockey and inline hockey. Field lacrosse has potential partners with soccer, field hockey, football and rugby and other field based sports. The municipality may bring together shared facility users for allocation and information meetings, but it is also beneficial for lacrosse to meet with potential partner sports without the municipality setting the agenda. Find out what the shared interests are, and determine if there is potential for shared facility development work to be done.
6.4.2 Sport Councils
A growing number of communities are forming Sport Councils. The Councils bring together representatives from a variety of minor sports to discuss issues, plans in the community and priorities. Facility needs are often a topic of conversation, and the Council will be one of the first community groups brought into any sport facility development discussions.

21 BCLA FACILITY REPORT AND RECOMMENDATIONS 2013
Every Council works differently. Some have a direct connection to the recreation department that provides administrative support and has significant impact on discussions. Other Sport Councils are more independent, and take on more of an advocacy role toward the municipality, on behalf of all community sport. In both models, municipalities use the Sport Councils to gather input for plans and priorities. As with any representative body, actually being at the table is often an advantage to receiving post meeting reports or updates. Lacrosse associations are strongly encouraged to become active in their local Sport Councils. As of the writing of this report, the following councils are active:
o Abbotsford Sport Council o Central Cariboo Recreation Commission o Delta Sport Council o Fort St. John Sport Council o Kamloops Sport Council o Kelowna o Langley Outdoor Sports Group o Maple Ridge/Pitt Meadows Sport and Outdoor Recreation Council o Nanaimo Field Sport Committee o Nelson Regional Sports Council o North Vancouver Community Sport Advisory Council o Port Coquitlam Sport Alliance o Prince George Sport Council o Richmond Sport Council o Surrey Outdoor Sport Advisory Committee o West Kelowna Sport Council o Vancouver Sport Network
7. HOSTING AT THE INTERNATIONAL, NATIONAL AND PROVINCIAL LEVELS
The discussion about Facilities should connect with the Hosting Strategy for the BCLA and for individual Associations. Hosting can be used as a tool to accomplish a number of objectives, including promotion of the sport in the community, opportunities for local players to see higher level competition or financial savings against travelling to the other side of the country. Hosting can also provide opportunity for facility improvement to accommodate the event.
There may be funding opportunities attached from the facility owner or external sources that can support facility or equipment improvements and provide a legacy for post-event users.
Hosting an event, because of the local economic impact and publicity for a community, may also accelerate planned expenditures for facility improvements.
An event financial legacy may support future improvements at a facility
7.1 HOSTING GRANTS AND FACILITY IMPROVEMENTS
7.1.1 Sport Canada
Sport Canada has a Hosting Policy and Program which provides support to “International Single Sport Events” (ISSE) at the senior and junior level. However, sports must on the program of an “International Major Multi-Sport Games” to be eligible. Neither field nor box lacrosse qualify as they are not part of the Olympic, Commonwealth Games nor Pan American Games programs.

22 BCLA FACILITY REPORT AND RECOMMENDATIONS 2013
7.1.2 Hosting BC
The Hosting BC grant program is funded by the British Columbia Government, and managed through ViaSport. The grant is for operational costs of the event, and grants normally a period of time from 4 – 18 months post-application intake. One of the assessment and priority considerations in reviewing grant applications is that “the event leaves a sport legacy through facility or equipment upgrades, new program or partnerships.” (Hosting BC Grant Guidelines October 2013)
This opens the door to including minor facility improvements in the hosting budget where there is a sustainable legacy for users. (eg: shot clocks, score clocks, shelters, goals and nets). The current Hosting BC grant maximums are: World Championship – up to $35,000 National Championship – up to $15,000 Provincial Championship – up to $10,000
7.1.3 Municipal Hosting Grants
Many BC communities have Sport Tourism or Hosting Grants available to local sport organizations who host Regional, Provincial, Western Canadian or National events. The municipalities are supporting community events that will bring people into hotels, restaurants, shopping areas and make an impact on their local economy. The grants are usually small ($1,000 - $2,000) but can sometimes be used to support small facility or equipment improvements needed for the event. The grant programs are usually managed by the Parks, Recreation & Culture Department, or through the local Sport Tourism office.
7.2 INTERNATIONAL EVENTS
The Federation of International Lacrosse (FIL) oversees world championship and world cup competition for Men’s U19 and Women’s U19 Field Lacrosse Championships, a senior Men’s Field Lacrosse Championships, a Men’s senior Indoor Championships and a Women’s Field Lacrosse World Cup. Canada is hosting the Men’s Field Lacrosse U19 World Cup in July 2016. Championships are bid on and awarded about 5 – 5½ years prior. Canada is hosting the Men’s U19 Field Lacrosse World Championships in Coquitlam, in July 2016. Currently, FIL has awarded events up to the Men’s World Championship in 2018 (Manchester, England). The BC Lacrosse Association may wish to consider investigating the feasibility of hosting the Men’s Indoor World Championship in 2023. Canada hosted the first two events in 2003 and 2007. The next location is Syracuse and Buffalo, New York in 2015 with the 2019 host to be named in January 2014. 2023 could be celebrated with the tag-line “over 90 years of Box Lacrosse in BC” with the recorded start-up of the game dating back to the early 1930’s. BC has the critical mass of strong indoor facilities available in the south-west part of the province, along with a rich local history for the sport. The Langley Event Centre and surrounding amenities are suitable for such an event. Hosting a world championship provides an opportunity to work with local facility owners to activate and possibly accelerate facility improvements. The profile and economic impact of international events should provide a catalyst for legacy programs and sustainable improvements for the benefit of local lacrosse.

23 BCLA FACILITY REPORT AND RECOMMENDATIONS 2013
7.3 NATIONAL CHAMPIONSHIPS
National championships are owned by the Canadian Lacrosse Association (CLA), and are conducted in accordance with the National Event Hosting Guide and CLA Operations Manual. The Masters, Senior, Junior and Intermediate Championships are designated by the CLA as “Major Championships”, and the Midget, Bantam and PeeWee events are designated as “Minor Competitions”. The CLA has a provincial host rotational system in place, but an Application to Host must still be submitted by the Member Association to the Sector AGM, in the year prior to the scheduled event. A copy of facility information and an agreement in principle with the facility owner has to be included as part of the Host Application. The Championship age groups, bid or rotation stipulation and pertinent deadlines can be found in Appendix E. The CLA National Event Hosting Guide lists the facility attributes that must be confirmed as part of the Host Application. The technical requirements for the playing area must adhere to the Rule of the Game, but the Guide does not specific minimum standards for the number and types of amenities and services available to the teams and public for the event.
Page 17 of the Guide lists the following information: Minimum Venue Requirements
o Each venue must have the following minimum requirements to be considered for hosting privileges: o Changing facilities for players o Changing facilities for referees o Meeting rooms o Fully functioning washroom facilities for patrons and players o Emergency procedures and policies in place o Wheel chair accessibility o Adequate benches for both home and visitor teams o Fully functioning score board o A 30 sec shot clock for applicable tournaments o Nets and floor/field lines in accordance with all current regulations and restrictions set by the CLA o Appropriate signage o Floor and turf standards met o A media room or press box (for applicable tournaments) o Food services available to spectators and participants during tournament All venues will be approved through the application process on the bases that these standards have been met, or that the appropriate renovation(s) and/ or construction will take place to ensure that these standards are met by the date of the tournament, and will continue to be met for the duration of the tournament.
Additionally, the CLA Operation Manual provides additional information for the tournament hosts on facility expectations. From page 172 of the CLA Operations Manual: 24.29. FACILITIES AND EQUIPMENT
24.29.1. Meeting Facilities 24.29.1.1. The Host Committee must ensure that there are facilities readily available for required meetings. These meetings shall include the pre-competition meeting, discipline and appeal committee meetings.
24.29.2. Fields for Men’s Field: 24.29.2.1. Field markings shall be up to date and accurately applied on each field being used. 24.29.2.2. Adequate dressing rooms for all participants shall be provided by the host when necessary.

24 BCLA FACILITY REPORT AND RECOMMENDATIONS 2013
24.29.2.3. Washroom facilities shall be made available for participants and spectators during the championships 24.29.2.4. Every effort shall be made to make available food services to participants and spectators during the championships. 24.29.2.5. The Host is responsible to provide a certified trainer on site for the teams attending the National Championships. The teams shall provide their own tape and supplies if required for the training staff to look after their players.
24.29.3. Equipment 24.29.3.1. Sound system, time keeper’s watches, scoring table materials and weather covering, field chalking materials and two nets with proper dimensions for the age category playing shall be made available at each field.
24.30. INTERNET SERVICES 24.30.1. Website
24.30.1.1. National Championships and Competitions will have a website linked to the CLA website prior to or before the commencement of the SAGM in the year prior to competition.
Full descriptions of the facilities and amenities are required in the hosting applications.
7.4 PROVINCIAL CHAMPIONSHIPS
The BCLA accepts applications to host Provincial Championships in August for the following calendar year’s box and field championships. The association has a Tournament Manual for each of Box and Field Championships. The Manuals provide a very good overview of operational requirements and expectation for a championship under the jurisdiction of the BCLA. The references to facilities and venue requirements are limited to those found in the CLA Rule Book, which provides the descriptions requirements for the playing area of the game. There is an opportunity for BCLA to take the hosting of the Provincial Championships to another level and set out minimum expectations of the tournament facility or facilities, for each level of play. Setting out such standards, and allowing tentative hosting commitments to be made up to 5 years ahead of time will provide opportunities and time for municipalities, facility developers and local associations to consider hosting requirements and hosting preferences when they are making their capital improvement plans, or finalizing their design work. This re-positioning of the Championships fits with the growing importance that Municipalities are placing on event hosting. A municipality that understands the implications of hosting opportunities through the eyes of the sport governing bodies when making decisions about upgrades or design inclusions for a development is better placed to attract events. If such improvements will meet the needs of multiple sports, then the case is stronger and the local lacrosse association has a better facility for hosting events. A facility that is well-equipped to host multiple provincial sport championships or larger events throughout the year provides a strong return for the facility owner. BCLA should list consider establishing base requirements for Provincial Championships in the following areas: Spectator seating (permanent and/ or room for portable seating) Parking On-site internet access Change rooms with hooks, attached washrooms and locks on the doors Hot water in team change rooms and officials’ change rooms

25 BCLA FACILITY REPORT AND RECOMMENDATIONS 2013
On-site meeting room area On-site room / area for a medical area Lighting
7.5 BC GAMES
One of the most compelling legacies for any community hosting the BC Games is that of facility improvements and upgrades. Both Box and Field Lacrosse are in the Games, which put BCLA in a unique position to advocate on behalf of two types of facilities. Each sport has minimum standards established for facility requirements. The BC Games CEO reports that there are “no extra points” earned in the review process if those standards are exceeded in a bid proposal. This is to avoid the “one-upmanship” that may occur between communities. The minimum standards set by a PSO for the games also have to reasonable so that the sport doesn’t challenge inclusion by demanding more than can be offered by most communities. There are two ways for lacrosse to benefit from the BC Games in terms of facilities. The first is if the preferred arenas or fields are in need of and receive reasonable upgrades or replacement of on-site amenities as part of the Games bid and implementation. These upgrades will serve all sports that use those facilities after the games. The second benefit is that the local association or clubs are often the recipients of post-Games equipment and games supplies. These may help to stock a “hosting kit” that can be used for local or provincial tournaments. The community Host Society will often establish a post-Games legacy fund. These funds have been used in a variety of ways and often support coaching or officiating training. After the 2012 Surrey Summer Games, some of the legacy money was invested in a “Multi-purpose Sport Tournament Mobile Trailer” that is now available to local sport organizations who are hosting events. Participation in the BC Games enables a PSO and the local associations to put a different lens on facility discussions. Be aware of which communities are discussing a bid, and have local lacrosse people at the table to ensure that lacrosse facility requirements are closely examined. BCLA should also make sure that the Games facility standards are at an appropriate level.
8. FACILITY DEVELOPMENT EXAMPLES FROM OTHER SPORTS
Sport representatives who have been involved in facility development projects for sports other than lacrosse were asked about their experience and what they could provide as their best advice to lacrosse associations that become involved in facility development projects.
8.1 NEW SOUTH SURREY POOL AND BC DIVING
Surrey is one of the fastest growing communities in BC, and it is aggressively pursuing business and community development, including new sport and recreation facilities. They published a 10 year Parks, Recreation & Culture Plan in 2008, and approved a 2009 Sport Tourism Plan and Strategy. Both of these Plans drive facility development and hosting support in the city. Amongst a long list of capital projects is a 50M Pool being built in the South Surrey (168th and 24th) area, scheduled to open in late 2014. This is an area of the city that is under significant residential development, and the community infrastructure and support services are part of the community
26 BCLA FACILITY REPORT AND RECOMMENDATIONS 2013
planning. The BC Diving office is located in the same general area of Surrey, along with the White Rock Diving Club. (The Diving Club is currently based at, and uses the White Rock Gymnastics Club facility for dryland training) This new pool development was the focus of a 2 year campaign by BC Diving to have the pool designed and outfitted to accommodate not only local Diving club training, but competitive diving meets. This would require the addition of a warm up pool, dry land training area and equipment storage to the project. The advocacy work was primarily done by the BC Diving Technical Director and did not involve fundraising or major committee work. The city’s decision was to build a pool with 4 board heights (1M, 3M, 76.5M and 10M), but the facility does not include the requested amenities for competitions. The next closest pool only has two boards The PSO and club are now considering the pursuit of a multi-sport dryland training facility in the area of the new pool. Best Advice Critical to build relationships with the City staff who influence the project
Get involved as early as possible with the planners and developers. The sport has to have input at the design stage. Make it clear as to what standards are required for different levels and types of participation and competition.
Find out who the decision-making city championship is for the project and make sure they understand the opportunities and possibilities, as well as the consequences of providing less than is being requested
Look at the demographic projections for the areas that the project will service – are these areas a good fit for the sport, and if yes, what is the need to be met
8.2 RUTLEDGE FIELD AND THE WEST VANCOUVER FIELD HOCKEY CLUB
Field Hockey in West Vancouver was for many years centred at Hugo Ray Park, sharing the two grass field facility with cricket. The club worked with the District to raise money to build a pavilion at that site in 1986, which is still in use today. By the early 90’s, artificial turf was the playing standard for and negotiations started with the District for a turf field at Hugo Ray. The Club started fundraising in 2007 following public consultation and approval by the District for 2 turf fields to move ahead. But after a 2008 election and staff changes, the project was scaled back and then postponed by the District. Eventually, Council decided not proceed with the Hugo Ray project because of the cost, but looked at Ambleside Park as an alternative. There were already 3 soccer turfs, a baseball diamond and tennis courts at this location. Ambleside Park was the base for the West Vancouver Soccer Club. The project was accelerated in 2010 with a federal / provincial grant of $3M for an international standard field hockey pitch, and warm-up pads for field hockey and soccer. The funding came through one of the “economic stimulus” infrastructure initiatives so while financial approval was quick, there was a very tight timeline to finish the project and spend the money. A 3-way MOU was signed between the District, the Field Hockey Club and the Soccer club with field hockey contributing $370,000 and Soccer $100,000 at the beginning of the project. The Rutledge Field Hockey Pitch opened in September 2011, and can be used by both field hockey and soccer. The next part of the project is a Clubhouse, originally planned for 2011, but not yet off the drawing board. The two clubs have now contributed almost $750,000 and pledged $1.5M in total. Both have registered projects managed by the West Vancouver Community Foundation which enables donees to receive tax receipts.

27 BCLA FACILITY REPORT AND RECOMMENDATIONS 2013
Best Advice The Field Hockey Club created a separate West Vancouver Field Hockey Fundraising Society with its
own Board of Directors. The two groups liaise but the Fundraising Society is independent. The Club Board concentrates on the development of the game and member activities, instead of fundraising.
o Fundraising doesn’t stop – they just look at the next project and priority There is still a $10 / player annual fundraising levy (almost 3,000 members) A large lottery is held each year that brings in about $50,000
There continues to be an MOU with the Soccer Club for use of the facilities (3 soccer turfs upgraded in 2003 and the field hockey pitch 2011). The development of the Club House will be a joint activity
A local Independent School became involved in the project to be able to access to the field for their programs, and brought in significant donors.
The FH Club worked very closely with the city in the design of the facility. It is international standard (water-based) and can host certain levels of events.
Treat the project as a business project. Understand the financial impact of the facility, the community economic contribution of the club and the impact of decisions made in the design for development and operational costs (ie: maintenance cost, and life expectancy (replacement) cost, site footprint, spectator seating etc) as well as hosting opportunities.
The long years of work with the District for a turf field was an advantage when “shovel-ready” projects were needed to access the federal and provincial economic stimulus programs.
Fundraising efforts brought club members together through the consistent messaging and vision for the project and club.
Work with the local Community Foundation to see what assistance they can provide with fundraising efforts, tax receipts and local promotion
From the experience, the club drafted a guideline document for facility development for other field hockey clubs.
8.3 TENNIS COURTS
Tennis BC has been involved in the development of a number of public and public / private tennis facilities around the province, including the UBC Tennis Centre which was initiated in 2004 and opened in 2011 (the largest public tennis facility in Vancouver) and the Kitsilano Beach Courts. Best Advice Make sure that due diligence is done to establish need and best use for the facility
o Have to be accurate and credible o Speak with the experts
Have to have a business case that demonstrates sustainability
Tennis BC and Tennis Canada funded a Feasibility Study for public courts in Vancouver. This became the basis of a business proposal.
Establishing the need for a facility can’t be an emotional plea – it needs to be logical. How does the project meet the vision and needs of the decision-makers, owner, funders and users
Municipalities and institutions prefer multiple sport partners if possible. Should also be different levels of user within each sport to get as broad a user base as possible
Many times amenities will not make it to the final stage in order to keep costs down. Know what is required and what is only wanted. Understand the difference in opportunities for facility use as design factors change.

28 BCLA FACILITY REPORT AND RECOMMENDATIONS 2013
Be prepared to find multiple funders, including the club membership and other or sport partnerships
Look at hosting opportunities to leverage improvements
8.4 DELTA SPORT DEVELOPMENT CENTRE AND DELTA GYMNASTICS SOCIETY
The club moved into a facility housed at a Recreation Centre in 1993, quickly outgrew the space and by 1996, started advocating for expanded space. In 2009, the club took part in a feasibility study to look at a new site in Ladner for a purpose-built facility. An agreement was struck between the Corporation of Delta and the Delta Gymnastics Society with the building opening in April 2011. The Club agreed to contribute over $1.6M of the expected $3.3M costs, with the other $750K coming for the federal Recreation Infrastructure Canada program and $938K from the Corporation of Delta. The club had been fundraising for 9 years towards a new facility and was able to immediately contribute $800K as part of the agreement. The remaining $830K was raised over 3 years through the Club’s “Kids Come First” Campaign. Funding went to both construction costs ($400K) and the cost of outfitting the facility ($430,000). Best Advice The Kids Come First project and plan was professionally developed and the campaign led by a hand-
selected group of volunteers who became the “Campaign Cabinet” under the oversight of the club Board of Directors.
The Campaign Cabinet, senior staff and many campaign volunteers were the first contributors to the campaign
98% of the funds raised came from a small group of donors specifically targeted to give 4 “principal gifts” and 24 “major gifts”
Donees were able to pledge gifts that were paid over a 3 year period, as well as convertible donations such as stocks.
The club worked closely with Corporation of Delta staff in all phases of the project and were very involved in the design phase
The club sought out and learned from other gymnastics facilities that have been built around the province in the past few years.
The municipality requested that multi-sport athletic training be offered to other sport clubs in the community through the gymnastics club. Each year, a number of coaches book sessions with the club gymnastics coaches for different types of athleticism training and has developed good relationships with a number of other local sport connections.
The club has established a capital replacement schedule and fund for equipment and has on-going fundraising efforts to meet this need
9. COMMUNICATING CHANGES IN FACILITY GAME REQUIREMENTS AND EQUIPMENT STANDARDS
Decisions about major changes in standards for equipment, including goalie gear, balls, sticks, uniforms, or footwear and facility standards will most often come from either the international or national lacrosse organization. In 2009, the Canadian Lacrosse Association announced new manufacturing approval and standards for Box lacrosse goals, with implementation by January 2012.

29 BCLA FACILITY REPORT AND RECOMMENDATIONS 2013
In June 2012, the FIL Congress approved unified markings for the men’s and women’s field game, which will be phased in between 2013 and 2019, and be placed into the rule books next being published in 2015. One of the challenges at the provincial and local association level is the implementation of these new requirements. The BCLA has “Equipment Updates” as a menu item on the Box Lacrosse Page, but the “Equipment Updates” heading on the Field Lacrosse page is hidden under “General Information”. These two placements should be consistent, as stand-alone menu items on each sports main page. The field and floor markings and technical are specifications are found in the CLA or FIL Rule Books. This is useful information that can be easily positioned on the BCLA website as part of an expanded “Equipment and Facility Information and Updates” for both sports. If and when there are changes in the equipment and/or technical requirements that affect what happens within a facility, a communication scheme should be developed to ensure that implementation of the change can happen as smoothly as possible. The following steps are suggested:
1. Clarify exactly what the change will be, what level of jurisdiction is directing the change, what age groups and genders are affected, and if the change is a recommendation or a technical requirement of the game.
a. if it is a requirement, what age groups and genders are affected, and at what point does the change go into full implementation. Is there a grace period and what are the expectations during that time?
b. if it is a recommendation, what are the options, what level of decision-makers decides to adopt or not adopt the recommendation, and what are the game consequences with either choice (ie: facility not suitable for certain age groups if a change is not made or it can no longer host events that include other provinces if they have adopted the change in rules)
2. lay out a communication process for the membership and for facility owners a. what are the responsibilities of the local associations in communicating the change, and
ensuring adherence b. what are the responsibilities of BCLA in communicating the change, and ensuring
adherence (BCLA should have a role, even if it is to reinforce what the local associations are doing – the facility owners should be aware of BCLA)
3. determine the key messages and specify what the changes are, what the timelines are and what the ramifications are for non-compliance
4. decide if there will be any financial support available to make the changes, and make that information available
5. use the website and all communication vehicles to get information out about changes, timelines and implications to the sport
6. determine how checks for compliance will be made at all facilities being used in the BCLA.

30 BCLA FACILITY REPORT AND RECOMMENDATIONS 2013
10. RECOMMENDATIONS
The following recommendations are made based on the successful practices collected from lacrosse associations, municipal contacts and contacts from other sports. These recommendations are not about the actual construction of a facility, but how to best position the BCLA and local lacrosse associations most advantageously to drive campaigns for facility development and take advantage of opportunities as they arise.
10.1 FACILITY INVENTORY
1. The Box Lacrosse Associations that did not provide their inventory information this year should be asked again prior to the 2014 Box season, in order to complete the initial baseline information for the project. 2. Local Associations should be asked to update their full facility inventory at regular intervals, to ensure that information is kept up to date.
10.2 BC LACROSSE ASSOCIATION FACILITY COMMITTEES
3. The BCLA should strike two Facility and Equipment Committees – one for Box and one for Field. These are small committees of 2 or 3 people (plus the BCLA Technical Director) and have the following mandate:
to gather and circulate information about facility and equipment requirements to the membership
to become the association experts on facilities and lend advice and counsel to local Associations or facility developers about standards and expectations
to collect and distribute information about standards and expectations that are in addition to the requirements of the playing areas (ie: lighting, environment)
10.3 LOCAL ASSOCIATION ADMINISTRATION AND STRUCTURE
4. Local Associations should appoint a designated Facility Liaison and a secondary contact person for each of Box and Field Lacrosse. These are the people responsible for working with the facility owners and managers. 5. Local Associations should consider establishing Facilities Committees to work with facility developers on new projects. 6. Local Associations should adopt the following administrative practices in dealing with the facility contacts
hold one formal pre-season meeting about the upcoming season Keep in touch by phone or in person regularly during the season. Have a wrap-up meeting at the end of the season. Collect information from team contacts and league coordinators about the various facilities and
pass on the information in a positive and organized manner to the facility owner. Keep written records of significant conversations with facility managers and decision makers and
share these with facility contact. Ensure that the facility owners are aware of technical changes being brought into the sport if it
will affect their facility. Ensure that there is consistent messaging between the Association and the facility managers /
owners. Document issues and provide written information when submitting a concern of importance.

31 BCLA FACILITY REPORT AND RECOMMENDATIONS 2013
Ensure that the scope of responsibility and decision-making authority for the contacts, on behalf of the association, has been specified.
Keep key files kept electronically in archives, with recent files transferred each year or through change of position.
10.4 MEMBERSHIP AND FACILITIES
7. Associations and clubs have to understand their own registration trends and local demographic information to know if additional facility time is needed. The BCLA should provide retention reports each year by association. 8. Conduct an analysis of FAS codes (1st three characters of a postal code) for participants in selected communities. Determine if a new community should be targeted and investigate facility opportunities for entry level age groups.
10.4 FACILITY AND EQUIPMENT INFORMATION
9. Key factors such as hours of access per week at each location, weeks of availability and number of games and practices scheduled are all additional contributors that will affect facility impact on participant numbers. The BCLA should work with local Associations to develop a tracking system that can be used at the local association level to ascertain impact over time and to measure capacity within each association. 10. Have a specific sub-section within the Box and Field sections on the website that pertains to facilities and equipment. Include the following information
house basic floor and field specifications technical and bench area requirements timing equipment requirements goals and nets If there is an update based on a rule change (ie: change in goals), notification should go to all
associations and municipal recreation departments with pertinent dates and compliance expectations
Player equipment – sticks, balls, shoes, uniform Goalie equipment and uniform
11. Develop a BCLA Communication process to be followed when a change in facility or equipment specifications is being recommended or required by the FIL or CLA.
10.5 WORKING WITH OTHER SPORTS
12. The BCLA should develop a relationship with major sports that share facilities used by lacrosse to keep up to date about potential new projects or upgrades, determine what shared amenities would benefit all users and learn about facilities standards in other sports that may benefit lacrosse.
10.6 FACILITY DEVELOPMENT
13. The BCLA should become engaged, to the extent necessary, in all developments in which lacrosse will be or could be a facility user. This will require ongoing communication with municipalities and engagement of facility owners in potential growth areas. This does not negate the responsibilities of the local Associations, but provides another level of advocacy with awareness of multiple projects and jurisdictions.

32 APPENDIX A – 2008 – 2013 FIELD LACROSSE REGISTRATION AND NUMBER OF FIELDS IN USE
APPENDIX A - 2008 – 2013 ALL FIELD LACROSSE REGISTRATION BY ASSOCIATION AND NUMBER OF FIELDS IN USE
2008 2009 2010 2011 2012 2013 Gra ss Turf
Adanacs U8 12 13 24 29 28 39 4
Adanacs U10 45 56 38 39 42 42 4
Adanacs U12 35 67 64 68 58 46 4
Adanacs U14 42 46 53 64 85 82 4
Adanacs U16 62 43 39 53 53 62 4
Adanacs U19 21 23 34 16 35 27 4
Adanacs YW 19 27 21 30 12 19 4
Adanacs U15W 18 16 20 21 22 18 4
Adanacs U19W - - - 16 16 - 4
Coquitlam M 23 43 51 51 18 32 4
TOTALS 277 334 344 387 369 367 32%
2008 2009 2010 2011 2012 2013 Gra ss Turf
Burnaby U8 - - 22 12 12 20 1 4
Burnaby U10 15 16 14 21 21 22 1 4
Burnaby U12 20 16 17 17 15 18 1 4
Burnaby U14 33 31 36 16 29 16 1 4
Burnaby U16 15 - 37 42 19 20 1 4
Burnaby U19 18 - - - 23 20 1 4
Burnaby M - - - - 22 - 1 4
Burnaby YW - - - - 17 20 1 4
Burnaby U15W - 11 15 - - 19 1 4
Burnaby U19W - - 9 19 - 18 1 4
TOTALS 101 74 150 127 158 173 71%
2008 2009 2010 2011 2012 2013 Gra ss Turf
Cow ichan YW 28 - 30 27 88 13 1
Cow ichan JR W 5 35 17 14 11 8 1
Cow ichan W 17 21 15 11 10 13 1
TOTALS 50 56 62 52 109 34 -32%
F ields In Use
F ields In Use
F ields In Use% change
since 2008
% change
since 2008
% change
since 2008
0
50
100
2008 2009 2010 2011 2012 2013
Cowichan YW
Cowichan JR W
Cowichan W
0
10
20
30
40
2008 2009 2010 2011 2012 2013
Burnaby U8
Burnaby U10
Burnaby U12
Burnaby U14
Burnaby U16
Burnaby U19
Burnaby M
Burnaby YW
Burnaby U15W
Burnaby U19W
0
10
20
30
40
50
60
70
80
90
2008 2009 2010 2011 2012 2013
Adanacs U8
Adanacs U10
Adanacs U12
Adanacs U14
Adanacs U16
Adanacs U19
Adanacs YW
Adanacs U15W
Adanacs U19W
Coquitlam M
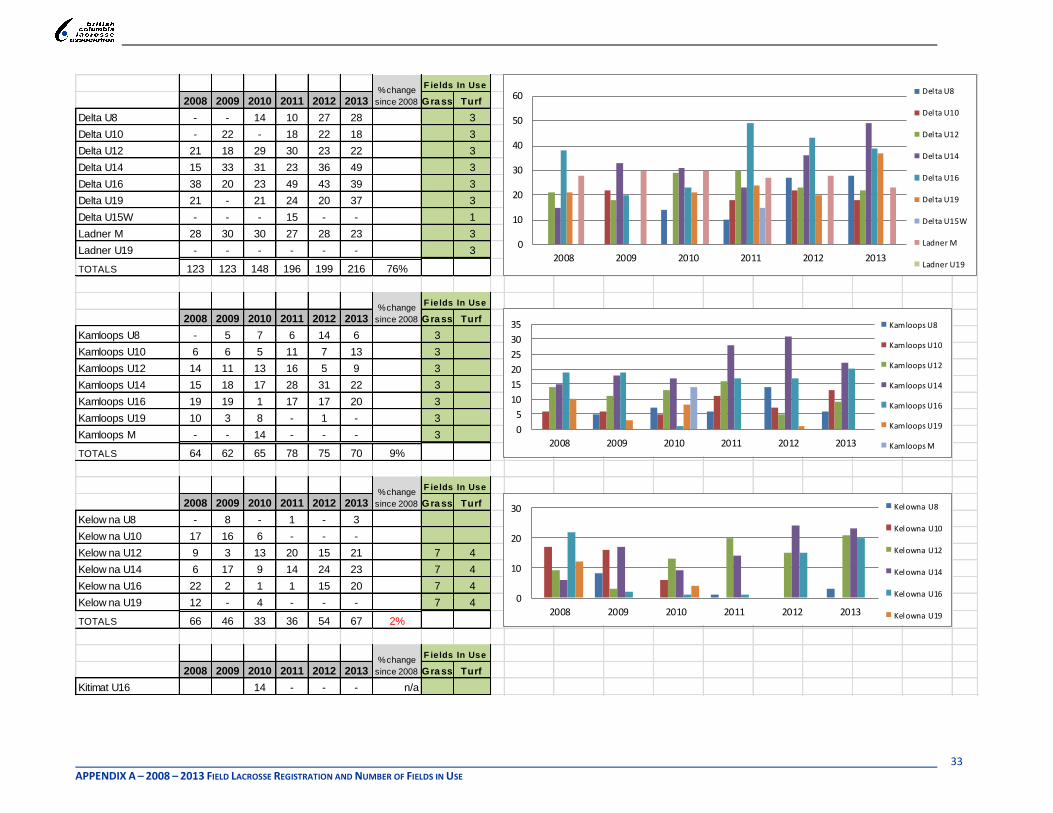
33 APPENDIX A – 2008 – 2013 FIELD LACROSSE REGISTRATION AND NUMBER OF FIELDS IN USE
2008 2009 2010 2011 2012 2013 Gra ss Turf
Delta U8 - - 14 10 27 28 3
Delta U10 - 22 - 18 22 18 3
Delta U12 21 18 29 30 23 22 3
Delta U14 15 33 31 23 36 49 3
Delta U16 38 20 23 49 43 39 3
Delta U19 21 - 21 24 20 37 3
Delta U15W - - - 15 - - 1
Ladner M 28 30 30 27 28 23 3
Ladner U19 - - - - - - 3
TOTALS 123 123 148 196 199 216 76%
2008 2009 2010 2011 2012 2013 Gra ss Turf
Kamloops U8 - 5 7 6 14 6 3
Kamloops U10 6 6 5 11 7 13 3
Kamloops U12 14 11 13 16 5 9 3
Kamloops U14 15 18 17 28 31 22 3
Kamloops U16 19 19 1 17 17 20 3
Kamloops U19 10 3 8 - 1 - 3
Kamloops M - - 14 - - - 3
TOTALS 64 62 65 78 75 70 9%
2008 2009 2010 2011 2012 2013 Gra ss Turf
Kelow na U8 - 8 - 1 - 3
Kelow na U10 17 16 6 - - -
Kelow na U12 9 3 13 20 15 21 7 4
Kelow na U14 6 17 9 14 24 23 7 4
Kelow na U16 22 2 1 1 15 20 7 4
Kelow na U19 12 - 4 - - - 7 4
TOTALS 66 46 33 36 54 67 2%
2008 2009 2010 2011 2012 2013 Gra ss Turf
Kitimat U16 14 - - - n/a
F ields In Use
F ields In Use
F ields In Use
F ields In Use
% change
since 2008
% change
since 2008
% change
since 2008
% change
since 2008
0
10
20
30
2008 2009 2010 2011 2012 2013
Kelowna U8
Kelowna U10
Kelowna U12
Kelowna U14
Kelowna U16
Kelowna U19
0
5
10
15
20
25
30
35
2008 2009 2010 2011 2012 2013
Kamloops U8
Kamloops U10
Kamloops U12
Kamloops U14
Kamloops U16
Kamloops U19
Kamloops M
0
10
20
30
40
50
60
2008 2009 2010 2011 2012 2013
Delta U8
Delta U10
Delta U12
Delta U14
Delta U16
Delta U19
Delta U15W
Ladner M
Ladner U19

34 APPENDIX A – 2008 – 2013 FIELD LACROSSE REGISTRATION AND NUMBER OF FIELDS IN USE
2008 2009 2010 2011 2012 2013 Gra ss Turf
Langley U8 - 13 13 8 - - 1 3
Langley U10 27 14 12 18 15 15 1 3
Langley U12 29 31 30 30 30 25 1 3
Langley U14 33 30 34 35 34 41 1 3
Langley U16 20 38 29 30 29 32 1 3
Langley U19 22 - 20 21 18 25 1 3
Langley YW - - 32 15 - 15 1 3
Langley U15W 17 20 15 15 28 18 1 3
Langley U19W - 25 14 8 19 - 1 3
TOTALS 148 171 199 180 173 171 16%
2008 2009 2010 2011 2012 2013 Gra ss Turf
Mid Island U8 - - - - 5 4 1
Mid Island U10 - 10 18 14 6 6 1
Mid Island U12 16 4 3 16 16 12 1
Mid Island U14 14 13 14 16 25 25 1
Mid Island U16 17 1 2 20 15 19 1
Mid Island U19 1 1
TOTALS 47 28 37 66 67 67 43%
2008 2009 2010 2011 2012 2013 Gra ss Turf
Mission U8 - 12 12 - - 11 1
Mission U10 - 18 18 17 15 - 1
Mission U12 14 16 15 18 20 22 1
Mission U14 - - 14 20 21 21 1
Mission U16 17 - 17 15 18 16 1
Mission U19 24 19 17 15 - 0 1
TOTALS 55 65 93 85 74 70 27%
2008 2009 2010 2011 2012 2013 Gra ss Turf
Nanaimo U8 - - - - 18 - 2 2
Nanaimo U10 - - 6 - 6 21 2 2
Nanaimo U12 18 16 8 - - - 2 2
Nanaimo U14 33 16 23 19 - 23 2 2
Nanaimo U16 24 36 29 18 24 23 2 2
Nanaimo U19 9 18 19 22 17 22 2 2
Nanaimo M 16 21 - - - -
Nanaimo W - 32 - - -
TOTALS 100 139 85 59 65 89 -11%
F ields In Use
F ields In Use
F ields In Use
F ields In Use
% change
since 2008
% change
since 2008
% change
since 2008
% change
since 2008
0
10
20
2008 2009 2010 2011 2012 2013
Mission U8
Mission U10
Mission U12
Mission U14
Mission U16
Mission U19
0
5
10
15
20
25
2008 2009 2010 2011 2012 2013
Mid Island U8
Mid Island U10
Mid Island U12
Mid Island U14
Mid Island U16
Mid Island U19
0
10
20
30
40
50
2008 2009 2010 2011 2012 2013
Langley U8
Langley U10
Langley U12
Langley U14
Langley U16
Langley U19
Langley YW
Langley U15W
Langley U19W
0
10
20
30
40
2008 2009 2010 2011 2012 2013
Nanaimo U8
Nanaimo U10
Nanaimo U12
Nanaimo U14
Nanaimo U16
Nanaimo U19
Nanaimo M
Nanaimo W

35 APPENDIX A – 2008 – 2013 FIELD LACROSSE REGISTRATION AND NUMBER OF FIELDS IN USE
2008 2009 2010 2011 2012 2013 Gra ss Turf
New West U8 15 28 25 15 24 42 2
New West U10 18 15 30 32 36 29 2
New West U12 29 34 30 19 28 35 2
New West U14 35 33 41 46 28 20 2
New West U15W 9 50 20 30 26 23 2
New West U16 40 36 40 40 36 37 2
New West U19 24 26 36 26 21 21 2
New West M 26 - - - 26 24 2
New West YW 20 27 25 21 16 19 2
New West U19W - - 14 14 18 17 2
TOTALS 216 249 261 243 259 267 24%
2008 2009 2010 2011 2012 2013 Gra ss Turf
North Island U8 1 - - - 1 3 3
North Island U10 4 - - - 12 9 3
North Island U12 11 15 14 - 4 22 3
North Island U14 23 4 19 16 8 18 3
North Island U16 15 12 17 14 24 23 3
North Island U19 2 17 9 10 - 11
TOTALS 56 48 59 40 49 86 54%
2008 2009 2010 2011 2012 2013 Gra ss Turf
N Okanagan U8 - - - 2 - -
N Okanagan U10 2 - 10 2 6 5 9
N Okanagan U12 3 16 22 15 15 9 9
N Okanagan U14 14 15 17 27 25 19 9
N OkanaganU16 6 12 19 19 20 25 9
N Okanagan U19 2 - 1 6 21 -
TOTALS 27 43 69 71 87 58 115%
2008 2009 2010 2011 2012 2013 Gra ss Turf
North Shore U8 8 - - 16 - - 2
North Shore U10 - - 14 - 22 - 2
North Shore U12 - 20 - 23 - - 2
North Shore U14 36 19 - - 22 24 2
North Shore U16 17 32 32 20 19 - 2
North Shore U19 0 0 0 21 - 23 2
TOTALS 61 71 46 80 63 47 -23%
F ields In Use
F ields In Use
F ields In Use
F ields In Use
% change
since 2008
% change
since 2008
% change
since 2008
% change
since 2008
0
10
20
30
40
2008 2009 2010 2011 2012 2013
North Shore U8
North Shore U10
North Shore U12
North Shore U14
North Shore U16
North Shore U19
0
5
10
15
20
25
30
2008 2009 2010 2011 2012 2013
N Okanagan U8
N Okanagan U10
N Okanagan U12
N Okanagan U14
N OkanaganU16
N Okanagan U19
0
5
10
15
20
25
2008 2009 2010 2011 2012 2013
North Island U8
North Island U10
North Island U12
North Island U14
North Island U16
North Island U19
0
10
20
30
40
50
2008 2009 2010 2011 2012 2013
New West U8
New West U10
New West U12
New West U14
New West U15W
New West U16
New West U19
New West M
New West YW
New West U19W

36 APPENDIX A – 2008 – 2013 FIELD LACROSSE REGISTRATION AND NUMBER OF FIELDS IN USE
2008 2009 2010 2011 2012 2013 Gra ss Turf
Oceanside U8 - - - - - - 1
Oceanside U10 - - - 4 4 - 1
Oceanside U12 - - - 14 15 16 1
Oceanside U14 19 - - 16 20 19 1
Oceanside U16 17 18 23 - 11 - 1
TOTALS 36 18 23 34 50 35 -3%
2008 2009 2010 2011 2012 2013 Gra ss Turf
Pacif ic Rim U8 1 7 14 - 16 9 10 3
Pacif ic Rim U10 - 15 3 3 - 23 10 3
Pacif ic Rim U12 23 22 25 30 14 32 10 3
Pacif ic Rim U14 20 29 49 37 40 44 10 3
Pacif ic Rim U16 34 32 39 45 40 37 8 3
Pacif ic Rim U19 31 24 22 25 25 25 8 3
TOTALS 109 129 152 140 135 170 56%
2008 2009 2010 2011 2012 2013 Gra ss Turf
Penticton U10 3 4
Penticton U12 5 9 4
Penticton U14 4 2 4
Penticton U16 12 - 4
Penticton U19 22 4
TOTALS 0 0 0 0 21 36 71%
2008 2009 2010 2011 2012 2013 Gra ss Turf
Port Coq U8 13 - - - 21 14 2
Port Coq U10 16 - 20 16 21 14 2
Port Coq U12 35 37 21 20 25 23 2
Port Coq U14 32 39 40 39 34 29 2
Port Coq U16 17 19 24 26 42 45 2
Port Coq U19 3 23 4 17 2 - 2
Port Coq M 23 24 26 31 24 - 2
Port Coq YW 13 15 12 - - 14 2
Port Coq U15W 8 17 12 17 21 15 2
Port Coq U19W - - 13 - - - 2
TOTALS 160 174 172 166 190 154 -4%
F ields In Use
F ields In Use
F ields In Use
F ields In Use
% change
since 2012
% change
since 2008
% change
since 2008
% change
since 2008
0
10
20
30
40
50
2008 2009 2010 2011 2012 2013
Port Coq U8
Port Coq U10
Port Coq U12
Port Coq U14
Port Coq U16
Port Coq U19
Port Coq M
Port Coq YW
Port Coq U15W
Port Coq U19W
0
10
20
2008 2009 2010 2011 2012 2013
Pent icton U10
Pent icton U12
Pent icton U14
Pent icton U16
Pent icton U19
0
10
20
30
40
50
2008 2009 2010 2011 2012 2013
Pacific Rim U8
Pacific Rim U10
Pacific Rim U12
Pacific Rim U14
Pacific Rim U16
Pacific Rim U19
0
10
20
2008 2009 2010 2011 2012 2013
Oceanside U8
Oceanside U10
Oceanside U12
Oceanside U14
Oceanside U16

37 APPENDIX A – 2008 – 2013 FIELD LACROSSE REGISTRATION AND NUMBER OF FIELDS IN USE
2008 2009 2010 2011 2012 2013 Gra ss Turf
Pr George U8 1 2 8 4
Pr George U10 1 6 8 4
Pr George U12 13 7 8 4
Pr George U14 22 12 22 11 15 8 4
Pr George U16 2 8 7 15 2 8 4
Pr George U19 9 2 11 8 4
Pr George U15W 6 8 4
Pr George U19W 9 8 4
Pr George W - - - - 8 4
TOTALS 0 24 20 38 43 58 142%
2008 2009 2010 2011 2012 2013 Gra ss Turf
Richmond U8 - 9 10 3 - 18
Richmond U10 21 14 21 15 - 4 4
Richmond U12 19 20 17 14 17 - 4
Richmond U14 33 28 21 23 16 22 4
Richmond U16 19 30 19 22 21 14 4
Richmond U19 14 - - 23 14 - 2
Richmond U15W - - - - - 6 4
TOTALS 106 101 88 100 68 64 -40%
2008 2009 2010 2011 2012 2013 Gra ss Turf
Ridge Mead U8 13 22 24 39 39 19 2 1
Ridge Mead U10 31 35 20 32 39 39 2 1
Ridge Mead U12 18 23 35 36 28 34 1 1
Ridge Mead U14 32 26 19 20 36 39 1
Ridge Mead U16 40 32 21 36 18 18 1
Ridge Mead U19 - - 21 25 21 22 1
Ridge Mead YW 12 14 2 1
Ridge Mead U15W - - - - - 18 2 1
Ridge Mead U19W - - - - - 14 1 1
TOTALS 134 138 140 188 193 217 62%
2008 2009 2010 2011 2012 2013 Gra ss Turf
South Fraser U8 10 20 14 - 20 16 1 1
South Fraser U10 12 17 14 19 20 19 1 1
South Fraser U12 36 40 29 35 15 23 1 1
South Fraser U14 31 31 47 40 42 22 1
South Fraser U16 23 30 18 19 38 41 1
Surrey U19 - 20 25 - 15 - 1
South Fraser M 27 28 26 18 22 23 1
Surrey YW 13 - - - - -
TOTALS 152 186 173 131 172 144 -5%
F ields In Use
F ields In Use
F ields In Use
F ields In Use
% change
since 2009
% change
since 2008
% change
since 2008
% change
since 2008
05
101520253035404550
2008 2009 2010 2011 2012 2013
South Fraser U8
South Fraser U10
South Fraser U12
South Fraser U14
South Fraser U16
Surrey U19
South Fraser M
Surrey YW
0
10
20
30
40
2008 2009 2010 2011 2012 2013
Ridge Mead U8
Ridge Mead U10
Ridge Mead U12
Ridge Mead U14
Ridge Mead U16
Ridge Mead U19
Ridge Mead YW
Ridge Mead U15W
Ridge Mead U19W
0
5
10
15
20
25
30
35
2008 2009 2010 2011 2012 2013
Richmond U8
Richmond U10
Richmond U12
Richmond U14
Richmond U16
Richmond U19
Richmond U15W
0
5
10
15
20
25
2008 2009 2010 2011 2012 2013
Pr George U8
Pr George U10
Pr George U12
Pr George U14
Pr George U16
Pr George U19
Pr George U15W
Pr George U19W
Pr George W
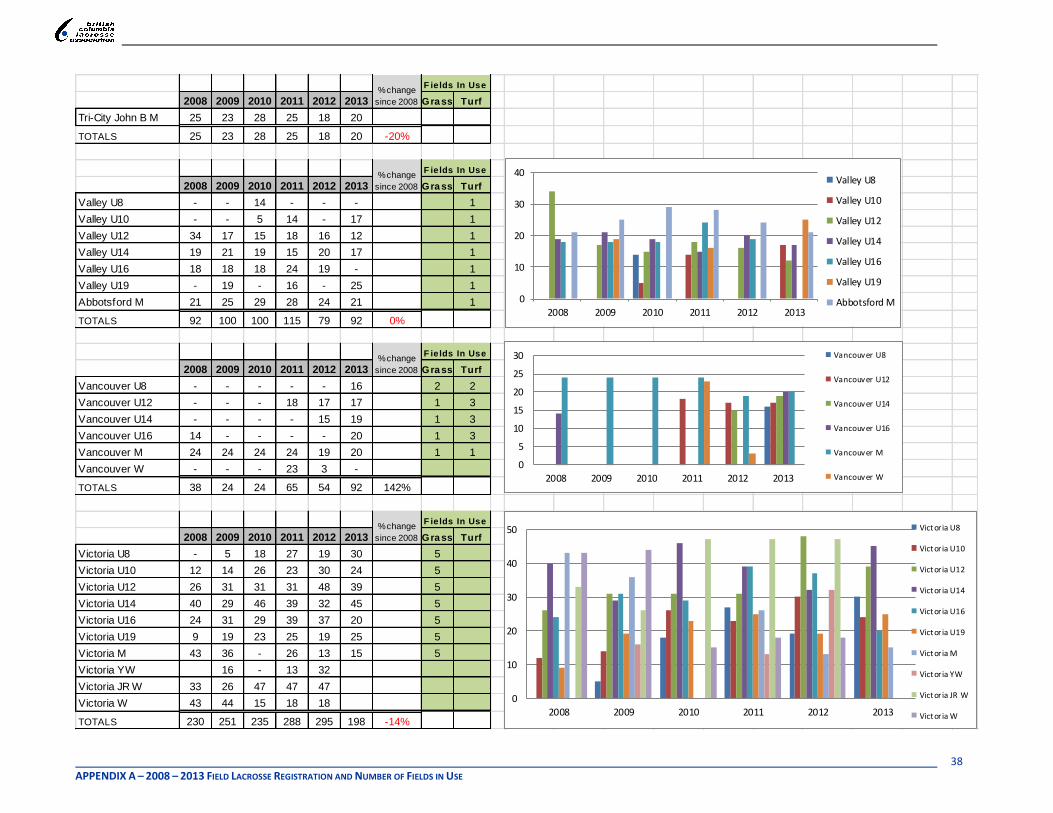
38 APPENDIX A – 2008 – 2013 FIELD LACROSSE REGISTRATION AND NUMBER OF FIELDS IN USE
2008 2009 2010 2011 2012 2013 Gra ss Turf
Tri-City John B M 25 23 28 25 18 20
TOTALS 25 23 28 25 18 20 -20%
2008 2009 2010 2011 2012 2013 Gra ss Turf
Valley U8 - - 14 - - - 1
Valley U10 - - 5 14 - 17 1
Valley U12 34 17 15 18 16 12 1
Valley U14 19 21 19 15 20 17 1
Valley U16 18 18 18 24 19 - 1
Valley U19 - 19 - 16 - 25 1
Abbotsford M 21 25 29 28 24 21 1
TOTALS 92 100 100 115 79 92 0%
2008 2009 2010 2011 2012 2013 Gra ss Turf
Vancouver U8 - - - - - 16 2 2
Vancouver U12 - - - 18 17 17 1 3
Vancouver U14 - - - - 15 19 1 3
Vancouver U16 14 - - - - 20 1 3
Vancouver M 24 24 24 24 19 20 1 1
Vancouver W - - - 23 3 -
TOTALS 38 24 24 65 54 92 142%
2008 2009 2010 2011 2012 2013 Gra ss Turf
Victoria U8 - 5 18 27 19 30 5
Victoria U10 12 14 26 23 30 24 5
Victoria U12 26 31 31 31 48 39 5
Victoria U14 40 29 46 39 32 45 5
Victoria U16 24 31 29 39 37 20 5
Victoria U19 9 19 23 25 19 25 5
Victoria M 43 36 - 26 13 15 5
Victoria YW 16 - 13 32
Victoria JR W 33 26 47 47 47
Victoria W 43 44 15 18 18
TOTALS 230 251 235 288 295 198 -14%
F ields In Use
F ields In Use
F ields In Use
F ields In Use
% change
since 2008
% change
since 2008
% change
since 2008
% change
since 2008
0
10
20
30
40
50
2008 2009 2010 2011 2012 2013
Victoria U8
Victoria U10
Victoria U12
Victoria U14
Victoria U16
Victoria U19
Victoria M
Victoria YW
Victoria JR W
Victoria W
0
5
10
15
20
25
30
2008 2009 2010 2011 2012 2013
Vancouver U8
Vancouver U12
Vancouver U14
Vancouver U16
Vancouver M
Vancouver W
0
10
20
30
40
2008 2009 2010 2011 2012 2013
Valley U8
Valley U10
Valley U12
Valley U14
Valley U16
Valley U19
Abbotsford M

39 APPENDIX B – 2008 – 2013 BOX LACROSSE REGISTRATION AND NUMBER OF BOXES IN USE
APPENDIX B - 2008 – 2013 MINOR BOX LACROSSE REGISTRATION BY ASSOCIATION AND NUMBER OF BOXES IN USE
Abbotsford 2008 2009 2010 2011 2012 2013 Indoor Outdoor
Boys Mini Tyke 16 21 10 10 13 18 1
Tyke 26 32 24 18 21 30 1
Novice 22 24 29 25 32 40 1
PeeWee 34 31 29 32 33 18 1
Bantam 19 31 18 21 25 33 1
Midget 17 19 19 15 0 16 1
TOTALS 134 158 129 121 124 155 16%
Alberni Valley 2008 2009 2010 2011 2012 2013 Indoor Outdoor
Boys Mini Tyke 0 0 0 0 0 0
Tyke 12 15 14 24 15 15
Novice 0 0 15 19 19 16
PeeWee 13 17 15 22 29 22
Bantam 17 16 20 20 15 18
Midget 0 20 17 17 19 0
42 68 81 102 97 71 69%
Burnaby 2008 2009 2010 2011 2012 2013 Indoor Outdoor
Boys B Mini Tyke 31 30 39 35 43 51 3 3
B Tyke 64 61 54 54 61 68 3 3
B Novice 48 58 63 52 52 52 3 3
B PeeWee 68 59 47 52 56 49 3 3
B Bantam 102 76 51 52 34 40 3 3
B Midget 78 77 72 50 38 42 3 3
Girls G Novice 13 13 12 14 19 18 3 3
G PeeWee 19 17 20 22 20 32 3 3
G Bantam 20 21 21 22 20 22 3 3
G Midget 15 21 19 15 17 20 3 3
G Junior 19 18 20 22 20 0 3 3
477 451 418 390 380 394 -17%
%
change
since
2 0 0 8
%
change
since
2 0 0 8
%
change
since
2 0 0 8
Boxes in Use
Boxes in Use
Boxes in Use
0
10
20
30
40
2008 2009 2010 2011 2012 2013
Mini Tyke
Tyke
Novice
PeeWee
Bantam
Midget
0
5
10
15
20
25
30
2008 2009 2010 2011 2012 2013
Mini Tyke
Tyke
Novice
PeeWee
Bantam
Midget
0
20
40
60
80
100
2008 2009 2010 2011 2012 2013
B Mini Tyke
B Tyke
B Novice
B PeeWee
B Bantam
B Midget
G Novice
G PeeWee
G Bantam
G Midget
G Junior

40 APPENDIX B – 2008 – 2013 BOX LACROSSE REGISTRATION AND NUMBER OF BOXES IN USE
Campbell River 2008 2009 2010 2011 2012 2013 Indoor Outdoor
Boys Mini Tyke 0 0 0 0 2 5 2 1
Tyke 13 14 10 19 17 13 2 1
Novice 20 14 19 17 22 24 2 1
PeeWee 27 17 17 28 28 28 2 1
Bantam 35 39 19 20 24 36 2 1
Midget 30 30 21 25 18 18 2 1
125 114 86 109 111 124 -1%
Chilliwack 2008 2009 2010 2011 2012 2013 Indoor Outdoor
Boys Mini Tyke 13 6 12 15 12 14 2
Tyke 12 18 29 30 18 26 2
Novice 16 14 35 18 20 24 2
PeeWee 41 27 30 29 21 11 2
Bantam 30 36 35 29 18 16 2
Midget 14 0 18 50 38 19 2
126 101 159 171 127 110 -13%
Comox Valley 2008 2009 2010 2011 2012 2013 Indoor Outdoor
Boys Mini Tyke 0 13 11 17 2 2 2
Tyke 12 18 14 25 20 13 2
Novice 22 19 13 14 19 20 2
PeeWee 36 22 19 15 16 20 2
Bantam 36 50 39 17 20 19 2
Midget 31 40 22 40 18 21 2
137 162 118 128 95 95 -31%
Coquitlam 2008 2009 2010 2011 2012 2013 Indoor Outdoor
Boys B Mini Tyke 80 70 63 63 88 75 2 4
B Tyke 110 133 123 119 109 120 2 4
B Novice 118 118 110 132 112 99 2 4
B PeeWee 125 110 110 88 88 115 2 3
B Bantam 104 97 94 96 95 83 2 0
B Midget 101 86 92 94 90 81 2 0
Girls G Tyke 0 0 0 0 0 13 2 4
G Novice 27 18 15 16 30 34 2 4
G PeeWee 16 30 29 32 31 32 2 4
G Bantam 32 28 15 22 35 40 2 3
G Midget 38 30 30 22 16 23 2 0
G Junior 25 38 24 41 37 43 2 0
776 758 705 725 731 758 -2%
%
change
since
2 0 0 8
%
change
since
2 0 0 8
%
change
since
2 0 0 8
%
change
since
2 0 0 8
Boxes in Use
Boxes in Use
Boxes in Use
Boxes in Use
0
10
20
30
40
2008 2009 2010 2011 2012 2013
Mini Tyke
Tyke
Novice
PeeWee
Bantam
Midget
0
10
20
30
40
50
2008 2009 2010 2011 2012 2013
Mini Tyke
Tyke
Novice
PeeWee
Bantam
Midget
0
10
20
30
40
50
2008 2009 2010 2011 2012 2013
Mini Tyke
Tyke
Novice
PeeWee
Bantam
Midget
0
20
40
60
80
100
120
140
2008 2009 2010 2011 2012 2013
B Mini Tyke
B Tyke
B Novice
B PeeWee
B Bantam
B Midget
G Tyke
G Novice
G PeeWee
G Bantam
G Midget
G Junior

41 APPENDIX B – 2008 – 2013 BOX LACROSSE REGISTRATION AND NUMBER OF BOXES IN USE
Cowichan Valley 2008 2009 2010 2011 2012 2013 Indoor Outdoor
Boys Mini Tyke 22 14 20 22 19 28 3 1
Tyke 34 32 30 30 44 37 3 1
Novice 43 42 45 35 33 30 3 1
PeeWee 39 46 58 44 45 40 3 1
Bantam 48 48 43 67 64 54 3 1
Midget 74 34 54 39 48 66 3 1
260 216 250 237 253 255 -2%
Cranbrook 2008 2009 2010 2011 2012 2013 Indoor Outdoor
Boys Mini Tyke 0 0 0 0 0 0 1
Tyke 10 15 11 15 12 20 1
Novice 9 10 0 11 16 16 2
PeeWee 17 19 19 15 13 19 2
Bantam 18 21 20 24 18 17 2
Midget 17 4 1 6 6 16 2
71 69 51 71 65 88 24%
Delta 2008 2009 2010 2011 2012 2013 Indoor Outdoor
Boys B Mini Tyke 38 23 23 23 35 33
B Tyke 48 55 40 33 27 38
B Novice 51 45 47 49 36 28
B PeeWee 49 50 51 47 45 44
B Bantam 43 54 48 44 51 50
B Midget 36 35 53 57 55 49
Girls G Novice 0 0 0 0 12 0
G PeeWee 0 0 0 0 0 0
G Bantam 22 20 0 0 0 0
G Midget 10 17 19 18 0 0
G Junior 21 18 15 18 18 0
318 317 296 289 279 242 -24%
Fort St John 2008 2009 2010 2011 2012 2013 Indoor Outdoor
Boys Mini Tyke 10 0 0 0 0 0
Tyke 12 13 7 19 25 40 4
Novice 25 6 6 16 42 35 4
PeeWee 22 22 7 14 21 16 4
Bantam 30 7 13 11 12 15 4
Midget 10 13 0 5 9 4 4
109 61 33 65 109 110 1%
%
change
since
2 0 0 8
%
change
since
2 0 0 8
%
change
since
2 0 0 8
%
change
since
2 0 0 8
Boxes in Use
Boxes in Use
Boxes in Use
Boxes in Use
0
20
40
60
80
2008 2009 2010 2011 2012 2013
Mini Tyke
Tyke
Novice
PeeWee
Bantam
Midget
0
5
10
15
20
25
2008 2009 2010 2011 2012 2013
Mini Tyke
Tyke
Novice
PeeWee
Bantam
Midget
0
10
20
30
40
50
60
2008 2009 2010 2011 2012 2013
B Mini Tyke
B Tyke
B Novice
B PeeWee
B Bantam
B Midget
G Novice
G PeeWee
G Bantam
G Midget
G Junior
0
10
20
30
40
50
2008 2009 2010 2011 2012 2013
Mini Tyke
Tyke
Novice
PeeWee
Bantam
Midget

42 APPENDIX B – 2008 – 2013 BOX LACROSSE REGISTRATION AND NUMBER OF BOXES IN USE
Juan de Fuca 2008 2009 2010 2011 2012 2013 Indoor Outdoor
Boys Mini Tyke 57 51 71 78 57 46 2 2
Tyke 95 112 95 101 103 107 2 2
Novice 84 82 100 96 94 93 2 2
PeeWee 94 83 79 79 88 85 2 2
Bantam 63 66 84 75 72 74 2 2
Midget 56 54 59 50 59 56 2 2
449 448 488 479 473 461 3%
Kamloops 2008 2009 2010 2011 2012 2013 Indoor Outdoor
Boys Mini Tyke 16 29 23 6 13 11 4
Tyke 20 30 31 26 23 26 4
Novice 16 25 33 26 37 45 4 3
PeeWee 38 45 27 34 36 36 4 2
Bantam 50 43 65 65 36 36 4 2
Midget 46 48 36 34 54 43 4 2
186 220 215 191 199 197 6%
Kelowna 2008 2009 2010 2011 2012 2013 Indoor Outdoor
Boys Mini Tyke 13 17 17 18 14 15
Tyke 21 21 24 31 29 27
Novice 26 38 35 34 35 36
PeeWee 22 31 55 47 49 48
Bantam 35 32 31 49 57 41
Midget 38 27 35 34 24 36
155 166 197 213 208 203 31%
Langley 2008 2009 2010 2011 2012 2013 Indoor Outdoor
Boys B Mini Tyke 21 29 21 18 23 24
B Tyke 38 59 45 38 32 53
B Novice 45 32 52 53 40 34
B PeeWee 53 62 63 51 51 65
B Bantam 47 48 54 61 68 64
B Midget 53 54 52 54 37 49
Girls G Novice 0 0 18 15 0 0
G PeeWee 0 14 0 16 20 13
G Bantam 0 0 16 17 13 16
G Midget 0 0 16 16 0 19
G Junior 0 0 0 0 0 0
257 298 337 339 284 337 31%
%
change
since
2 0 0 8
%
change
since
2 0 0 8
%
change
since
2 0 0 8
%
change
since
2 0 0 8
Boxes in Use
Boxes in Use
Boxes in Use
Boxes in Use
0
20
40
60
80
100
120
2008 2009 2010 2011 2012 2013
Mini Tyke
Tyke
Novice
PeeWee
Bantam
Midget
0
10
20
30
40
50
60
70
2008 2009 2010 2011 2012 2013
Mini Tyke
Tyke
Novice
PeeWee
Bantam
Midget
0
10
20
30
40
50
60
2008 2009 2010 2011 2012 2013
Mini Tyke
Tyke
Novice
PeeWee
Bantam
Midget
0
10
20
30
40
50
60
70
2008 2009 2010 2011 2012 2013
B Mini Tyke
B Tyke
B Novice
B PeeWee
B Bantam
B Midget
G Novice
G PeeWee
G Bantam
G Midget
G Junior
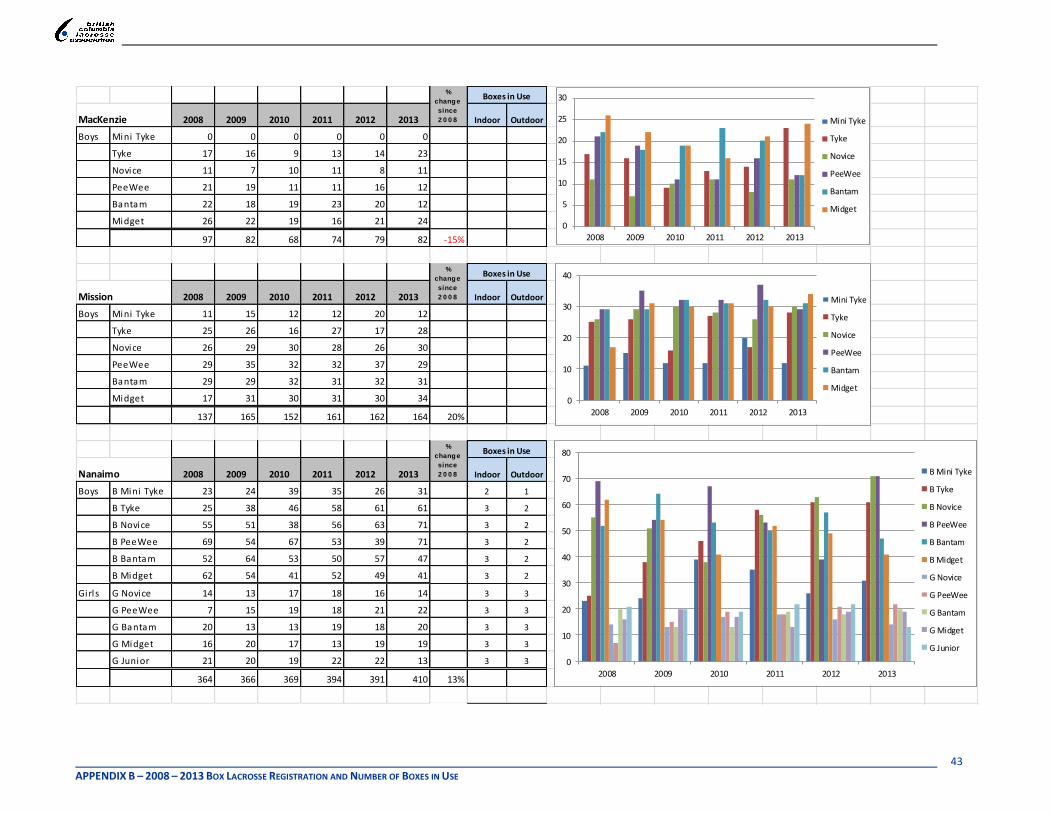
43 APPENDIX B – 2008 – 2013 BOX LACROSSE REGISTRATION AND NUMBER OF BOXES IN USE
MacKenzie 2008 2009 2010 2011 2012 2013 Indoor Outdoor
Boys Mini Tyke 0 0 0 0 0 0
Tyke 17 16 9 13 14 23
Novice 11 7 10 11 8 11
PeeWee 21 19 11 11 16 12
Bantam 22 18 19 23 20 12
Midget 26 22 19 16 21 24
97 82 68 74 79 82 -15%
Mission 2008 2009 2010 2011 2012 2013 Indoor Outdoor
Boys Mini Tyke 11 15 12 12 20 12
Tyke 25 26 16 27 17 28
Novice 26 29 30 28 26 30
PeeWee 29 35 32 32 37 29
Bantam 29 29 32 31 32 31
Midget 17 31 30 31 30 34
137 165 152 161 162 164 20%
Nanaimo 2008 2009 2010 2011 2012 2013 Indoor Outdoor
Boys B Mini Tyke 23 24 39 35 26 31 2 1
B Tyke 25 38 46 58 61 61 3 2
B Novice 55 51 38 56 63 71 3 2
B PeeWee 69 54 67 53 39 71 3 2
B Bantam 52 64 53 50 57 47 3 2
B Midget 62 54 41 52 49 41 3 2
Girls G Novice 14 13 17 18 16 14 3 3
G PeeWee 7 15 19 18 21 22 3 3
G Bantam 20 13 13 19 18 20 3 3
G Midget 16 20 17 13 19 19 3 3
G Junior 21 20 19 22 22 13 3 3
364 366 369 394 391 410 13%
%
change
since
2 0 0 8
%
change
since
2 0 0 8
%
change
since
2 0 0 8
Boxes in Use
Boxes in Use
Boxes in Use
0
5
10
15
20
25
30
2008 2009 2010 2011 2012 2013
Mini Tyke
Tyke
Novice
PeeWee
Bantam
Midget
0
10
20
30
40
2008 2009 2010 2011 2012 2013
Mini Tyke
Tyke
Novice
PeeWee
Bantam
Midget
0
10
20
30
40
50
60
70
80
2008 2009 2010 2011 2012 2013
B Mini Tyke
B Tyke
B Novice
B PeeWee
B Bantam
B Midget
G Novice
G PeeWee
G Bantam
G Midget
G Junior

44 APPENDIX B – 2008 – 2013 BOX LACROSSE REGISTRATION AND NUMBER OF BOXES IN USE
New Westminster 2008 2009 2010 2011 2012 2013 Indoor Outdoor
Boys B Mini Tyke 46 45 48 52 60 50 2 1
B Tyke 85 67 74 73 67 94 2 1
B Novice 78 73 63 63 65 58 2
B PeeWee 79 78 46 54 56 60 2
B Bantam 65 62 81 52 33 45 2
B Midget 79 74 59 69 68 49 2
Girls G Novice 26 31 32 24 18 23 2
G PeeWee 36 44 38 41 43 19 2
G Bantam 59 54 35 40 44 47 2
G Midget 38 40 49 37 30 37 2
G Junior 23 33 27 37 45 41 2
614 601 552 542 529 523 -15%
Nicola Valley 2008 2009 2010 2011 2012 2013 Indoor Outdoor
Boys Mini Tyke 0 0 0 9 0 0 2
Tyke 11 9 10 13 8 16 2
Novice 11 15 13 12 10 0 2
PeeWee 16 15 19 17 15 17 2
Bantam 15 13 11 19 15 15 2
Midget 21 21 18 14 13 14 2
74 73 71 84 61 62 -16%
North Delta 2008 2009 2010 2011 2012 2013 Indoor Outdoor
Boys Mini Tyke 27 29 35 26 16 21 2
Tyke 44 47 42 41 40 32 2
Novice 18 35 42 42 43 35 2
PeeWee 31 20 19 21 35 38 2
Bantam 46 38 28 19 19 18 2
Midget 39 38 35 34 22 20 2
205 207 201 183 175 164 -20%
North Okanagan 2008 2009 2010 2011 2012 2013 Indoor Outdoor
Boys Mini Tyke 0 9 9 9 12 22 4 1
Tyke 20 12 9 9 23 24 4 1
Novice 36 25 14 20 42 32 4 1
PeeWee 28 27 33 51 34 39 4 1
Bantam 48 32 35 33 49 52 4 1
Midget 37 43 36 34 48 30 4 1
169 148 136 156 208 199 18%
%
change
since
2 0 0 8
%
change
since
2 0 0 8
%
change
since
2 0 0 8
%
change
since
2 0 0 8
Boxes in Use
Boxes in Use
Boxes in Use
Boxes in Use
0
10
20
30
40
50
60
70
80
90
100
2008 2009 2010 2011 2012 2013
B Mini Tyke
B Tyke
B Novice
B PeeWee
B Bantam
B Midget
G Novice
G PeeWee
G Bantam
G Midget
G Junior
0
5
10
15
20
25
2008 2009 2010 2011 2012 2013
Mini Tyke
Tyke
Novice
PeeWee
Bantam
Midget
0
10
20
30
40
50
2008 2009 2010 2011 2012 2013
Mini Tyke
Tyke
Novice
PeeWee
Bantam
Midget
0
10
20
30
40
50
60
2008 2009 2010 2011 2012 2013
Mini Tyke
Tyke
Novice
PeeWee
Bantam
Midget
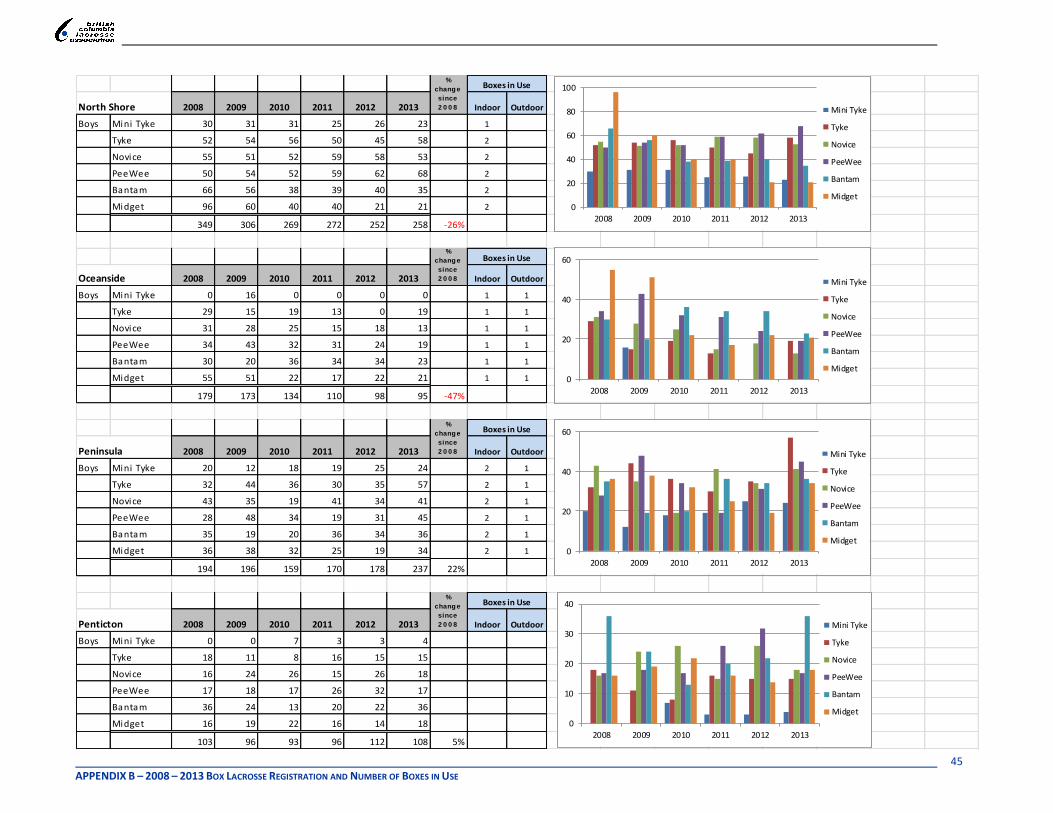
45 APPENDIX B – 2008 – 2013 BOX LACROSSE REGISTRATION AND NUMBER OF BOXES IN USE
North Shore 2008 2009 2010 2011 2012 2013 Indoor Outdoor
Boys Mini Tyke 30 31 31 25 26 23 1
Tyke 52 54 56 50 45 58 2
Novice 55 51 52 59 58 53 2
PeeWee 50 54 52 59 62 68 2
Bantam 66 56 38 39 40 35 2
Midget 96 60 40 40 21 21 2
349 306 269 272 252 258 -26%
Oceanside 2008 2009 2010 2011 2012 2013 Indoor Outdoor
Boys Mini Tyke 0 16 0 0 0 0 1 1
Tyke 29 15 19 13 0 19 1 1
Novice 31 28 25 15 18 13 1 1
PeeWee 34 43 32 31 24 19 1 1
Bantam 30 20 36 34 34 23 1 1
Midget 55 51 22 17 22 21 1 1
179 173 134 110 98 95 -47%
Peninsula 2008 2009 2010 2011 2012 2013 Indoor Outdoor
Boys Mini Tyke 20 12 18 19 25 24 2 1
Tyke 32 44 36 30 35 57 2 1
Novice 43 35 19 41 34 41 2 1
PeeWee 28 48 34 19 31 45 2 1
Bantam 35 19 20 36 34 36 2 1
Midget 36 38 32 25 19 34 2 1
194 196 159 170 178 237 22%
Penticton 2008 2009 2010 2011 2012 2013 Indoor Outdoor
Boys Mini Tyke 0 0 7 3 3 4
Tyke 18 11 8 16 15 15
Novice 16 24 26 15 26 18
PeeWee 17 18 17 26 32 17
Bantam 36 24 13 20 22 36
Midget 16 19 22 16 14 18
103 96 93 96 112 108 5%
%
change
since
2 0 0 8
%
change
since
2 0 0 8
%
change
since
2 0 0 8
%
change
since
2 0 0 8
Boxes in Use
Boxes in Use
Boxes in Use
Boxes in Use
0
20
40
60
80
100
2008 2009 2010 2011 2012 2013
Mini Tyke
Tyke
Novice
PeeWee
Bantam
Midget
0
20
40
60
2008 2009 2010 2011 2012 2013
Mini Tyke
Tyke
Novice
PeeWee
Bantam
Midget
0
20
40
60
2008 2009 2010 2011 2012 2013
Mini Tyke
Tyke
Novice
PeeWee
Bantam
Midget
0
10
20
30
40
2008 2009 2010 2011 2012 2013
Mini Tyke
Tyke
Novice
PeeWee
Bantam
Midget

46 APPENDIX B – 2008 – 2013 BOX LACROSSE REGISTRATION AND NUMBER OF BOXES IN USE
Port Coquitlam 2008 2009 2010 2011 2012 2013 Indoor Outdoor
Boys B Mini Tyke 43 35 47 43 41 39 2
B Tyke 90 70 56 58 74 78 2
B Novice 62 65 60 65 54 48 2
B PeeWee 73 61 56 58 57 63 2
B Bantam 78 87 71 62 50 51 2
B Midget 72 60 72 86 82 58 2
Girls G Novice 19 14 17 26 0 0 2
G PeeWee 19 18 29 17 35 37 2
G Bantam 16 21 17 31 22 15 2
G Midget 16 16 15 19 15 17 2
G Junior 23 22 22 25 21 22 2
511 469 462 490 451 428 -16%
Port Moody 2008 2009 2010 2011 2012 2013 Indoor Outdoor
Boys B Mini Tyke 16 22 10 17 14 23 2 1
B Tyke 58 42 37 29 39 43 2 1
B Novice 68 46 47 43 32 19 2 1
B PeeWee 35 62 64 50 43 33 2 1
B Bantam 37 36 35 50 56 34 2 1
B Midget 38 22 35 35 23 39 2 1
Girls G Novice 0 14 0 9 0 0
G PeeWee 16 19 20 19 16 10 2 1
G Bantam 0 0 17 18 15 18 2 1
G Midget 0 0 0 0 20 21 2 1
G Junior 17 22 22 0 0 0 2 1
285 285 287 270 258 240 -16%
Powell River 2008 2009 2010 2011 2012 2013 Indoor Outdoor
Boys Mini Tyke 0 7 6 0 0
Tyke 13 11 9 12 0
Novice 0 15 12 11 0
PeeWee 48 0 0 0 0
Bantam 44 44 32 21 0
Midget 28 26 21 17 0
133 103 80 61 0 n/a
%
change
since
2 0 0 8
%
change
since
2 0 0 8
%
change
since
2 0 0 8
Boxes in Use
Boxes in Use
Boxes in Use
0
20
40
60
80
100
2008 2009 2010 2011 2012 2013
B Mini Tyke
B Tyke
B Novice
B PeeWee
B Bantam
B Midget
G Novice
G PeeWee
G Bantam
G Midget
G Junior
0
10
20
30
40
50
60
70
2008 2009 2010 2011 2012 2013
B Mini Tyke
B Tyke
B Novice
B PeeWee
B Bantam
B Midget
G Novice
G PeeWee
G Bantam
G Midget
G Junior

47 APPENDIX B – 2008 – 2013 BOX LACROSSE REGISTRATION AND NUMBER OF BOXES IN USE
Prince George 2008 2009 2010 2011 2012 2013 Indoor Outdoor
Boys B Mini Tyke 20 7 7 11 17 18 3
B Tyke 22 21 32 20 26 25 3
B Novice 36 33 37 34 41 36 4
B PeeWee 49 44 46 42 39 45 4
B Bantam 44 36 41 36 49 37 4
B Midget 36 25 26 26 21 18 4
Girls G Novice 0 0 0 0 0 0
G PeeWee 0 1 2 0 0 0
G Bantam 4 2 0 5 0 4 4
G Midget 8 6 7 1 0 8 4
G Junior 5 4 8 8 7 0 4
224 179 206 183 200 191 -15%
Quesnel 2008 2009 2010 2011 2012 2013 Indoor Outdoor
Boys Mini Tyke 0 0 0 0 2 2
Tyke 9 7 8 6 1 4
Novice 20 22 12 4 5 4
PeeWee 17 19 21 20 10 3
Bantam 18 13 16 15 21 21
Midget 20 11 20 9 14 18
84 72 77 54 53 52 -38%
Revelstoke 2008 2009 2010 2011 2012 2013 Indoor Outdoor
Boys Mini Tyke 0 0 0 0 0
Tyke 5 7 0 0 0
Novice 0 0 0 0 0
PeeWee 12 11 0 0 0
Bantam 17 0 18 14 0
Midget 0 15 18 0 16
34 33 36 14 16 n/a
Richmond 2008 2009 2010 2011 2012 2013 Indoor Outdoor
Boys Mini Tyke 0 19 16 19 32 26 3 3
Tyke 19 15 19 21 36 70 3 3
Novice 24 23 32 30 29 44 3 3
PeeWee 27 31 33 29 31 35 3 3
Bantam 36 36 32 35 29 22 3 3
Midget 34 33 36 20 18 21 3 3
140 157 168 154 175 218 56%
%
change
since
2 0 0 8
%
change
since
2 0 0 8
%
change
since
2 0 0 8
Boxes in Use
Boxes in Use
Boxes in Use
Boxes in Use
0
10
20
30
40
50
2008 2009 2010 2011 2012 2013
B Mini Tyke
B Tyke
B Novice
B PeeWee
B Bantam
B Midget
G Novice
G PeeWee
G Bantam
G Midget
G Junior
0
5
10
15
20
25
2008 2009 2010 2011 2012 2013
Mini Tyke
Tyke
Novice
PeeWee
Bantam
Midget
0
10
20
30
40
50
60
70
2008 2009 2010 2011 2012 2013
Mini Tyke
Tyke
Novice
PeeWee
Bantam
Midget

48 APPENDIX B – 2008 – 2013 BOX LACROSSE REGISTRATION AND NUMBER OF BOXES IN USE
Ridge Meadows 2008 2009 2010 2011 2012 2013 Indoor Outdoor
Boys B Mini Tyke 67 53 54 64 62 65
B Tyke 59 76 102 107 86 81
B Novice 65 53 65 98 94 92
B PeeWee 68 63 66 49 68 82
B Bantam 70 68 49 53 52 51
B Midget 81 62 72 60 49 42
Girls G Tyke 0 0 0 0 0 12
G Novice 15 17 0 0 16 16
G PeeWee 18 0 21 0 16 15
G Bantam 16 31 20 21 19 33
G Midget 24 21 16 21 18 12
G Junior 0 0 26 22 20 22
483 444 491 495 500 523 8%
Saanich 2008 2009 2010 2011 2012 2013 Indoor Outdoor
Boys Mini Tyke 32 27 30 25 25 29 2
Tyke 75 60 55 62 57 46 2
Novice 73 60 63 75 65 62 1 2
PeeWee 46 64 56 53 66 64 1 2
Bantam 66 59 36 40 44 39 1 2
Midget 59 52 56 53 20 41 1 2
351 322 296 308 277 281 -20%
Semiahmoo 2008 2009 2010 2011 2012 2013 Indoor Outdoor
Boys B Mini Tyke 16 14 16 16 13 7 2 2
B Tyke 18 19 15 23 32 32 2 2
B Novice 42 38 34 35 17 32 2 2
B PeeWee 43 52 48 46 38 35 2 2
B Bantam 51 51 53 51 65 48 2 2
B Midget 37 37 38 42 35 39 2 2
Girls G Novice 0 0 0 0 0 0
G PeeWee 0 0 0 18 18 18 2 2
G Bantam 0 0 0 0 12 17 2 2
G Midget 0 17 0 0 0 0
G Junior 0 0 0 15 0 0
207 228 204 246 230 228 10%
%
change
since
2 0 0 8
%
change
since
2 0 0 8
%
change
since
2 0 0 8
Boxes in Use
Boxes in Use
Boxes in Use
0
20
40
60
80
100
120
2008 2009 2010 2011 2012 2013
B Mini Tyke
B Tyke
B Novice
B PeeWee
B Bantam
B Midget
G Tyke
G Novice
G PeeWee
G Bantam
G Midget
G Junior
0
20
40
60
80
2008 2009 2010 2011 2012 2013
Mini Tyke
Tyke
Novice
PeeWee
Bantam
Midget
0
10
20
30
40
50
60
70
2008 2009 2010 2011 2012 2013
B Mini Tyke
B Tyke
B Novice
B PeeWee
B Bantam
B Midget
G Novice
G PeeWee
G Bantam
G Midget
G Junior

49 APPENDIX B – 2008 – 2013 BOX LACROSSE REGISTRATION AND NUMBER OF BOXES IN USE
Shuswap 2008 2009 2010 2011 2012 2013 Indoor Outdoor
Boys Mini Tyke 0 0 6 0 4 0
Tyke 0 0 0 18 14 9 3
Novice 17 17 14 0 6 16 3
PeeWee 21 21 25 18 14 15 3
Bantam 14 22 16 21 18 18 3
Midget 16 17 13 17 19 20 3
68 77 74 74 75 78 15%
Sunshine Coast 2008 2009 2010 2011 2012 2013 Indoor Outdoor
Boys Mini Tyke 0 0 0 0 0 8 2
Tyke 11 0 0 20 34 15 2
Novice 0 0 0 8 25 14 2
PeeWee 14 0 0 0 0 11 2
Bantam 0 15 0 15 18 14 2
Midget 29 0 20 20 11 17 2
54 15 20 63 88 79 46%
Surrey 2008 2009 2010 2011 2012 2013 Indoor Outdoor
Boys Mini Tyke 28 20 19 17 23 36 2 4
Tyke 36 46 43 25 39 31 2 4
Novice 44 47 25 38 43 35 2 4
PeeWee 53 49 48 34 33 44 2 4
Bantam 40 37 46 34 35 16 2 4
Midget 57 0 34 38 38 34 2 4
258 199 215 186 211 196 -24%
Terrace 2008 2009 2010 2011 2012 2013 Indoor Outdoor
Boys Mini Tyke 0 0 6
Tyke 15 9 0
Novice 14 12 6
PeeWee 33 19 14
Bantam 30 30 21
Midget 31 23 23
123 93 70 n/a
%
change
since
2 0 0 8
Boxes in Use
Boxes in Use
%
change
since
2 0 0 8
%
change
since
2 0 0 8
Boxes in Use
Boxes in Use
0
5
10
15
20
25
30
2008 2009 2010 2011 2012 2013
Mini Tyke
Tyke
Novice
PeeWee
Bantam
Midget
0
10
20
30
40
2008 2009 2010 2011 2012 2013
Mini Tyke
Tyke
Novice
PeeWee
Bantam
Midget
0
20
40
60
2008 2009 2010 2011 2012 2013
Mini Tyke
Tyke
Novice
PeeWee
Bantam
Midget

50 APPENDIX B – 2008 – 2013 BOX LACROSSE REGISTRATION AND NUMBER OF BOXES IN USE
Vancouver 2008 2009 2010 2011 2012 2013 Indoor Outdoor
Boys Mini Tyke 13 15 20 20 14 20 2 2
Tyke 28 26 32 35 27 28 2 2
Novice 33 34 35 34 32 34 2 2
PeeWee 33 31 41 34 30 29 2 2
Bantam 58 36 32 32 41 24 2 2
Midget 37 42 41 25 20 23 2 2
202 184 201 180 164 158 -22%
Vanderhoof 2008 2009 2010 2011 2012 2013 Indoor Outdoor
Boys Mini Tyke 0 0 0 0
Tyke 0 0 0 0
Novice 0 0 0 7
PeeWee 19 19 13 14
Bantam 16 16 0 9
Midget 0 0 16 12
35 35 29 42 20%
Victoria-Esquimalt 2008 2009 2010 2011 2012 2013 Indoor Outdoor
E / V E / V
Boys Mini Tyke 17 14 24 22 10 16 1 /
Tyke 19 21 25 34 28 14 1 /
Novice 23 16 17 20 29 35 1 / 1 /
PeeWee 19 17 18 17 14 19 1 /
Bantam 22 32 17 19 17 13 1 /
Midget 30 20 32 22 20 0 1 /
130 120 133 134 118 97 -25%
%
change
since
2 0 0 8
Boxes in Use
%
change
since
2 0 0 8
Boxes in Use
%
change
since
2 0 10
Boxes in Use
0
20
40
60
2008 2009 2010 2011 2012 2013
Mini Tyke
Tyke
Novice
PeeWee
Bantam
Midget
0
5
10
15
20
2008 2009 2010 2011 2012 2013
Mini Tyke
Tyke
Novice
PeeWee
Bantam
Midget
0
10
20
30
40
2008 2009 2010 2011 2012 2013
Mini Tyke
Tyke
Novice
PeeWee
Bantam
Midget

51 APPENDIX B – 2008 – 2013 BOX LACROSSE REGISTRATION AND NUMBER OF BOXES IN USE
West Kootenay 2008 2009 2010 2011 2012 2013 Indoor Outdoor
Boys Mini Tyke 0 0 0 0 1 0
Tyke 0 5 4 7 9 6
Novice 10 8 7 13 12 11
PeeWee 18 17 0 15 22 12
Bantam 24 30 19 17 19 24
Midget 20 18 26 35 25 16
72 78 56 87 88 69 -4%
Williams Lake 2008 2009 2010 2011 2012 2013 Indoor Outdoor
Boys Mini Tyke 0 0 9 0 8 1 2
Tyke 12 14 5 12 8 8 2
Novice 14 18 13 12 18 10 2
PeeWee 34 26 13 15 14 11 2
Bantam 17 29 21 13 18 21 2
Midget 15 0 0 12 12 16
92 87 61 64 78 67 -27%
%
change
since
2 0 0 8
Boxes in Use
%
change
since
2 0 0 8
Boxes in Use
0
10
20
30
40
2008 2009 2010 2011 2012 2013
Mini Tyke
Tyke
Novice
PeeWee
Bantam
Midget
0
10
20
30
40
2008 2009 2010 2011 2012 2013
Mini Tyke
Tyke
Novice
PeeWee
Bantam
Midget

52 APPENDIX C – 2008 – 2013 SENIOR BOX LACROSSE REGISTRATION
2008 2009 2010 2011 2012 2013% change
since 2008
Masters 16 Teams @ 25/team 400 400 400 400 400 400 0%
2008 2009 2010 2011 2012 2013% change
since 2008
Senior C Assault 14 18 21 22 23 18
Senior C Bandits 16 17 24 24 25 25
Senior C Bobcats 21 18 20 - - -
Senior C Devils 21 14 20 20 21 25
Senior C Stylers 21 19 22 29 25 19
93 86 107 95 94 87 -6%
2008 2009 2010 2011 2012 2013% change
since 2008
Senior C Armstrong 22 26 25 25 24 26
Junior B (Okanagan) Armstrong 24 27 26 25 24 24
46 53 51 50 48 50 9%
2008 2009 2010 2011 2012 2013% change
since 2008
Senior C Burnaby 9
Junior B (Mainland) Burnaby 22 20 22 23 18 18
Intermediate A Burnaby 27 26 26 22 23 23
Intermediate B - LM Burnaby 29 21 24 22 20 -
Women's Box Lacrosse Burnaby 13 13 26 19 21 21
Senior B Burnaby (Vancouver) 29 27 31 - - -
Senior A Burnaby Lakers 26 29 31 30 29 28
Junior A Burnaby Lakers 25 27 31 31 24 23
171 163 191 147 135 122 -29%
2008 2009 2010 2011 2012 2013
Junior B (Island) Campbell River 25 19 26 22 20 -
2008 2009 2010 2011 2012 2013
Senior B Chill iwack - 21 23 29 - -
2008 2009 2010 2011 2012 2013% change
since 2008
Intermediate B - ISLAND Comox Valley 25 - - - - 15 -40%
2008 2009 2010 2011 2012 2013% change
since 2008
Junior B (Mainland) Coquitlam 28 27 21 25 32 24
Intermediate A Coquitlam 27 28 27 26 29 25
Intermediate B - LM Coquitlam 24 23 25 25 25 23
Women's Box Lacrosse Coquitlam - - 24 20 23 23
Senior A Coquitlam Adanacs 25 34 29 29 27 24
Junior A Coquitlam Adanacs 22 22 32 30 22 31
Senior C Coquitlam Cobras - 32 27 28 28 26
126 166 185 183 186 176 40%
APPENDIX C – 2008-2013 SENIOR BOX LACROSSE REGISTRATION – BY AREA

53 APPENDIX C – 2008 – 2013 SENIOR BOX LACROSSE REGISTRATION
2008 2009 2010 2011 2012 2013
Junior B (Island) Cowichan Valley 28 26 26 25 24 -
Intermediate B - ISLAND Cowichan Valley #1 24 22 21 - - -
Intermediate B - ISLAND Cowichan Valley #2 - 21 - - - -
52 69 47 25 24 0
2008 2009 2010 2011 2012 2013
Junior B (Other) Cranbrook 18 19 25 18 14 -
2008 2009 2010 2011 2012 2013% change
since 2008
Junior B (Mainland) Delta 22 25 26 19 24 29
Intermediate A Delta 25 25 25 25 25 22
Intermediate B - LM Delta 22 23 19 24 26 26
Junior A Delta Islanders 21 25 24 28 26 22
Senior C Ladner - 20 25 25 25 22
Senior B Ladner Pioneers 31 26 32 23 30 27
121 144 151 144 156 148 22%
2008 2009 2010 2011 2012 2013% change
since 2008
Intermediate B - LM Fraser-Surrey 22 - - - - 25 14%
2008 2009 2010 2011 2012 2013% change
since 2008
Senior C Greater Victoria Firefighters - - - 19 19 20
Intermediate B - ISLAND Juan de Fuca 16 26 26 28 23 25
Masters Justice League - 28 28 14 5 5
16 54 54 42 28 30 88%
2008 2009 2010 2011 2012 2013% change
since 2008
Senior C Kamloops 25 22 25 18 22 19
Junior B (Okanagan) Kamloops Rattlers 25 21 25 24 - -
Junior B (Okanagan) Kamloops Venom 24 24 24 26 22 25
74 67 74 68 44 44 -41%
2008 2009 2010 2011 2012 2013% change
since 2008
Senior C Kelowna Raiders 27 25 28 24 25 24
Junior B (Okanagan) Kelowna Warriors 25 25 25 - - -
Junior B (Okanagan) Rutland Raiders (Kelowna) 25 25 25 26 21 23
77 75 78 50 46 47 -39%
2008 2009 2010 2011 2012 2013% change
since 2008
Senior B Langley - 16 24 28 26 25
Junior B (Mainland) Langley 24 19 14 15 27 22
Intermediate A Langley 23 24 33 24 29 23
Intermediate B - LM Langley 21 23 21 23 20 23
Junior A Langley Stickmen 27 27 23 29 27 29
Senior A Langley Thunder 31 32 27 29 32 33
126 125 118 120 135 130 3%

54 APPENDIX C – 2008 – 2013 SENIOR BOX LACROSSE REGISTRATION
2008 2009 2010 2011 2012 2013% change
since 2011
Masters Lower Mainland 89 125 125 40%
2008 2009 2010 2011 2012 2013
Junior B (Other) Mackenzie 16 - - - - -
Senior C Mackenzie Lumberjacks - - 12 20 25 -
16 0 12 20 25 0
2008 2009 2010 2011 2012 2013% change
since 2008
Intermediate A Maple Ridge 24 25
Senior A Maple Ridge Burrards 24 24 27 26 29 27
24 24 27 26 53 52 117%
2008 2009 2010 2011 2012 2013% change
since 2008
Junior B (Island) Nanaimo 27 25 22 21 23 26
Intermediate A Nanaimo 25 22 21 25 24 24
Intermediate B - ISLAND Nanaimo - - 24 22 - 22
Senior A Nanaimo Timbermen 33 31 32 29 25 25
Senior B Nanaimo Timbermen 32 29 29 29 35 31
Junior A Nanaimo Timbermen 24 29 25 23 24 24
141 136 153 149 131 152 8%
2008 2009 2010 2011 2012 2013% change
since 2008
Senior A New West Salmonbellies 29 33 27 31 32 30
Junior A New West Salmonbellies 26 26 29 29 30 29
Junior B (Mainland) New Westminster 18 18 25 27 26 22
Intermediate A New Westminster 25 28 26 25 26 26
Intermediate B - LM New Westminster 23 25 26 23 23 26
Women's Box Lacrosse New Westminster 22 22 21 18 20 20
143 152 154 153 157 153 7%
2008 2009 2010 2011 2012 2013
Intermediate B - LM Nicola Valley - - - 12 - -
2008 2009 2010 2011 2012 2013% change
since 2008
Intermediate B - LM North Delta 18 21 24 20 22 23 28%
2008 2009 2010 2011 2012 2013% change
since 2008
Senior C North Shore 24 30 - - - -
Junior B (Mainland) North Shore 20 19 - 14 26 24
Intermediate B - LM North Shore 23 25 26 25 28 25
Women's Box Lacrosse North Shore 15 15 22 23 20 20
Senior B North Shore Indians 20 22 33 29 34 29
Senior C West Vancouver 28 30 - - 30 -
130 141 81 91 138 98 -25%
2008 2009 2010 2011 2012 2013
Intermediate B - ISLAND Oceanside - 21 25 22 24 -

55 APPENDIX C – 2008 – 2013 SENIOR BOX LACROSSE REGISTRATION
2008 2009 2010 2011 2012 2013% change
since 2008
Junior B (Island) Peninsula - 24 25 26 28 28
Intermediate B - ISLAND Peninsula 27 28 17 18 22 -
27 52 42 44 50 28 4%
2008 2009 2010 2011 2012 2013% change
since 2008
Senior C Poco Hitmen 24 31 34 29 29 30
Junior A Poco Saints 24 26 28 23 25 24
Junior B (Mainland) Pt. Coquitlam 27 24 19 24 25 26
Intermediate A Pt. Coquitlam 22 23 25 25 20 23
Intermediate B - LM Pt. Coquitlam 25 26 21 25 23 24
Women's Box Lacrosse Pt. Coquitlam 14 - -
Intermediate B - LM Pt. Coquitlam Gold - - 22 - - -
Senior B Tri-City 33 26 35 31 28 25
155 156 184 171 150 152 -2%
2008 2009 2010 2011 2012 2013
Intermediate B - ISLAND Port Alberni 19 -
2008 2009 2010 2011 2012 2013% change
since 2008
Senior B Port Moody 23 27
Senior C Port Moody 26 26 33 30 24 25
Junior B (Mainland) Pt. Moody - 22 21 23 28 19
Intermediate B - LM Pt. Moody 26 24 29 15 24 21
52 72 83 68 99 92 77%
2008 2009 2010 2011 2012 2013
Junior B (Other) Powell River - 27 - - - -
Intermediate B - ISLAND Powell River 22 27 16 18 - -
22 54 16 18 0 0
2008 2009 2010 2011 2012 2013
Junior B (Other) Prince George Posse 22 17 - - - -
2008 2009 2010 2011 2012 2013% change
since 2008
Senior C Quesnel - - - - 24 18
Junior B (Other) Quesnel 17 12 - - - -
17 12 0 0 24 18 6%
2008 2009 2010 2011 2012 2013% change
since 2008
Senior C Richmond 22
Junior B (Mainland) Richmond - 17 23 26 28 23
Intermediate A Richmond - - 24 21 24 23
Intermediate B - LM Richmond 23 27 24 22 23 -
Women's Box Lacrosse Richmond-Delta 14 14 21 19 21 21
37 58 92 88 96 89 141%

56 APPENDIX C – 2008 – 2013 SENIOR BOX LACROSSE REGISTRATION
2008 2009 2010 2011 2012 2013% change
since 2008
Senior C Ridge Attack 18 22 23 22 27 21
Junior B (Mainland) Ridge Meadows 26 27 26 25 26 24
Intermediate B - LM Ridge Meadows 27 24 25 25 25 26
Women's Box Lacrosse Ridge Meadows 18 18 23 15 - -
89 91 97 87 78 71 -20%
2008 2009 2010 2011 2012 2013% change
since 2008
Senior B Royal City 30 30 27 26 29 28 -7%
2008 2009 2010 2011 2012 2013% change
since 2008
Junior B (Island) Saanich - - - 21 26 25
Intermediate B - ISLAND Saanich 26 28 25 19 27 24
Senior C Saanich Thunderbirds - 19 13 13 5 -
26 47 38 53 58 49 88%
2008 2009 2010 2011 2012 2013
Intermediate B - LM Semiahmoo - 21 25 20 - -
2008 2009 2010 2011 2012 2013% change
since 2008
Junior B (Okanagan) South Okanagan 21 27 20 21 19 18 -14%
2008 2009 2010 2011 2012 2013% change
since 2008
Junior B (Mainland) Surrey 20 27 27 24 26 24
Intermediate B - LM Surrey 25 25 25 21 15 -
45 52 52 45 41 24 -47%
2008 2009 2010 2011 2012 2013% change
since 2008
Senior B Valley Rebels 28 26 31 28 27 25 -11%
2008 2009 2010 2011 2012 2013% change
since 2008
Senior C Vancouver Burrards 28 21 27 23 27 32 14%
2008 2009 2010 2011 2012 2013% change
since 2008
Senior C Vernon 28 22 25 23 23 -
Junior B (Okanagan) Vernon 25 25 24 24 23 26
53 47 49 47 46 26 -51%
2008 2009 2010 2011 2012 2013% change
since 2008
Intermediate A Victoria 24 22 24 26 25 24
Women's Box Lacrosse Victoria 18 18 17 25 20 20
Senior C Victoria Blazers - - - 21 15 23
Senior C Victoria Jokers 23 17 17 21 19 22
Senior C Victoria Luckies 22 20 20 19 15 18
Senior A Victoria Shamrocks 28 28 29 26 29 27
Junior A Victoria Shamrocks 23 25 28 29 24 24
Senior C Victoria Tugmen 19 21 18 20 16 17
Junior B (Island) Victoria-Esquimalt 28 26 - 22 - -
Intermediate B - ISLAND Victoria-Esquimalt - 17 21 - - -
Junior B (Island) West Shore 25 25 24 25 25 26
210 219 198 234 188 201 -4%
2008 2009 2010 2011 2012 2013
Junior B (Other) West Kootenay 22 12 - - - -

57 APPENDIX D – BC DEVELOPMENT REGIONS
APPENDIX D – BRITISH COLUMBIA DEVELOPMENT REGIONS
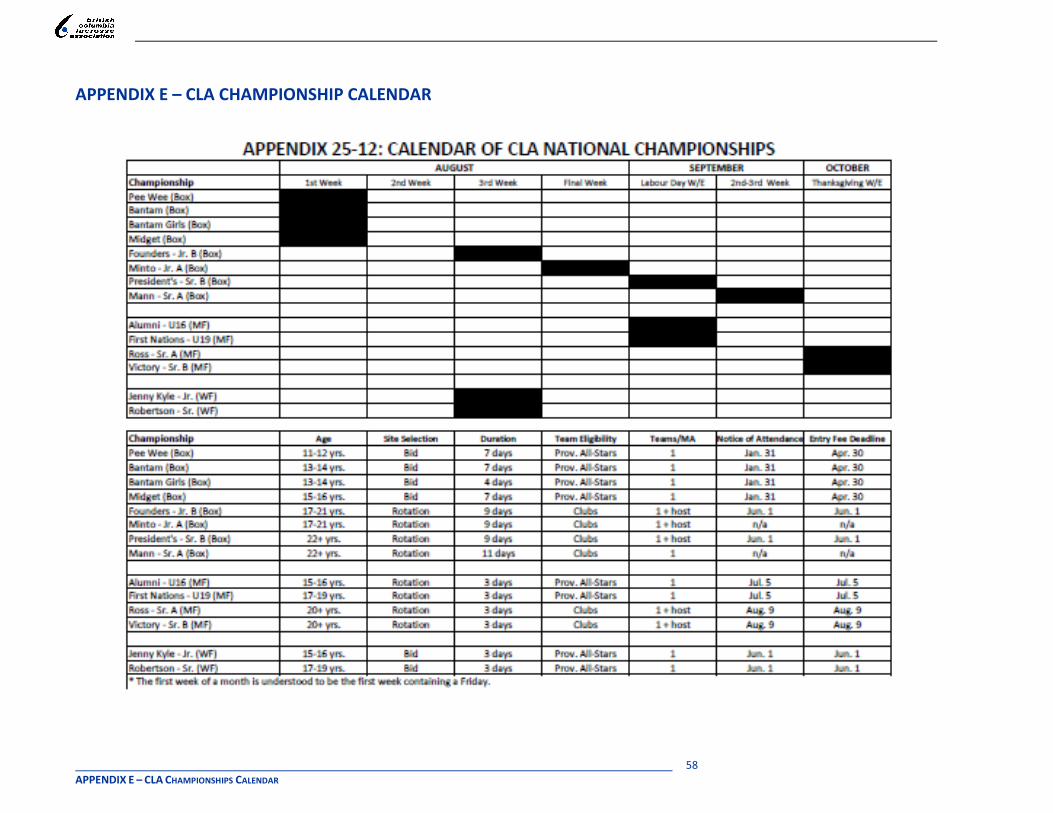
58 APPENDIX E – CLA CHAMPIONSHIPS CALENDAR
APPENDIX E – CLA CHAMPIONSHIP CALENDAR

59 APPENDIX F - ACKNOWLEDGEMENTS
APPENDIX F – ACKNOWLEDGEMENTS
Thank you to the following individuals who took the time to lend their expertise and opinions to this report. BCLA Advisory Group: Myrna Cable, BCLA Executive Harold Corbett, Senior Directorate Jeff Gombar, BCLA Marketing Director Wes Landels, Field Directorate Tyson Leies, Field Directorate Ron McQuarrie, BCLA Executive Terry Mosdell. BCLA Executive Dirk Rachfall, Field Directorate Darcy Rhodes, BCLA Technical Director Angie Schwan, Minor Directorate Rochelle Winterton, BCLA Executive Director Lacrosse Association Contacts: Myrna Cable, Prince George Marnie Evans, Campbell River Debbie Heard, Burnaby Gord McIntosh, Port Coquitlam Jamie Stewart, New Westminster Municipal Recreation Contacts: Linda Stride, Kamloops Keith Miller, Langley Ron Booth, New Westminster Glenn Mitzel, Port Coquitlam Malcolm Bromley, Vancouver Eric Stepura, White Rock Other Sport Contacts: Ana Arciniega, Delta Gymnastics, re: the Delta Sport Development Centre Ian Baggott, Field Hockey Canada, re: West Vancouver Field Hockey and Routledge Field Bev Boys, BC Diving re: the South Surrey Pool Rick Brant, Aboriginal Sport, Recreation & Physical Activity Partners Council (BC) Ryan Clark, formerly with Tennis BC, re: UBC Tennis Centre Kelly Mann, BC Games Project Contractor:

60 APPENDIX G - ENDNOTES
APPENDIX G - ENDNOTES
1 http://filacrosse.com/rules-field-dimensions/
2 https://fernie.civicweb.net/Documents/DocumentList.aspx?ID=17108
3 http://www.sparwood.ca/sites/default/files/Sparwood%20Leisure%20Centre%20Landscape%20Master%20Plan_0.pdf


