+ All Categories
Home > Documents > Lafarge Africa Plc - fmdqgroup.com · aggregates, ready mix concrete (“RMC”) and fly ash. 1H...

Lafarge Africa Plc - fmdqgroup.com · aggregates, ready mix concrete (“RMC”) and fly ash. 1H...

Date post: 18-Oct-2019
Category:
Upload: others
View: 8 times
Download: 0 times
Share this document with a friend
12
Nigeria Corporate Analysis | Public Credit Rating Lafarge Africa Plc Nigeria Corporate Analysis October 2017 Financial data: (USD’m Comparative) 31/12/15 31/12/16 N/USD (avg.) 193.1 253.2 N/USD (close) 197.0 305.0 Total assets 2,284.9 1,642.4 Total debt 752.7 418.1 Total capital 886.3 811.1 Cash & equiv. 83.7 63.2 Turnover 1,383.6 867.8 EBITDA 348.4 101.9 NPAT 140.6 66.7 Op. cash flow 357.6 (2.9) Market cap. ° USD925.7m Market share* c.25% Central Bank of Nigeria exchange rates. °As at 22/09/2017 @ N305.35/USD. *Estimated percentage market share of 2016 cement sales in Nigeria Rating history: Initial rating (July 2010) Long-term: A(NG) Short-term: A1(NG) Rating outlook: Stable Last rating ( October 2016) Long-term: A+(NG) Short-term: A1(NG) Rating outlook: Stable Series 1 Fixed Rate Bond: A+(NG) Series 2 Fixed Rate Bond: A+(NG) Rating Outlook: Stable Related methodologies/research: Global master criteria for rating corporate entities, updated February 2017 Glossary of terms/ratios, February 2017 Lafarge Africa Plc (“Lafarge Africa” or “LAP” or “the Group”), rating reports 2010-16; LAP bond rating report, October 2016 GCR contacts: Primary Analyst Adekemi Adebambo Senior Credit Analyst [email protected] Committee Chairperson Dave King [email protected] Analyst location: Lagos, Nigeria +234 1 462 2545 Website: http://www.globalratings.com.ng Summary rating rationale Lafarge Africa’s strong domestic market position is underpinned by an established international brand, effective distribution network, and operational support from its parent, LafargeHolcim. The recent completion of the new 2.5mtpa cement line at Mfamosing, Cross River State, has increased its production capacity to 14.1mtpa and further enhanced earnings potential. LAP’s cement sales volumes reduced by 16% in FY16, due to disruptions in gas supply and scarcity of foreign currency, which impeded productivity. Coupled with pricing pressures (in the first eight months of 2016), this drove an 18% decline in revenue to N219.7bn in FY16. The significant escalation in energy costs and the effect of a weaker Naira saw EBITDA margin contract sharply to 11.7% in FY16 (FY15: 25.2%), albeit this had corrected by 1H FY17. Increased productivity and operating efficiencies are expected to support an EBITDA margin of 29% for the full year. 1H FY17 cash generation rebounded N30.7bn, from the weak performance reported in FY16, to match historical trends. This was, however, offset by the accumulation of higher value inventory and debtors absorption, which drove an N8.4bn operating cash outflow (FY16: N725m outflow; five year average: N33.9bn inflow). While debt service and liquidity ratios are set to normalise by FY17, GCR will continue to monitor performance over the rating horizon, with an interest cover ratio of approximately 4x required to support stronger ratings (inter alia). In September 2016, LAP restructured USD493m (N139bn) of shareholder loans into a hybrid instrument, repayable at its discretion. Following the introduction of the dynamic Nigerian Inter-Bank Foreign Exchange Fixing (“NIFEX”) market it hedged its USD shareholder loan exposure and thus reclassified the quasi-equity to debt in 1H FY17. Borrowings therefore nearly doubled to N244.7bn in 1H FY17 (FY16: N127.5bn), with shareholder loans accounting for 52% of the total (FY16: 22%). Net gearing increased from 58% at FY14 to peak at 117% at 1H FY17 (FY16: 44%) while net debt to EBITDA deteriorated materially from 145% at FY14 to 420% at FY16, before improving to 300% in 1H FY17. LAP is planning a N131.7bn Rights Issue in 4Q FY17. Through the offer, LafargeHolcim, will subscribe to its rights by converting c.70% of dollar denominated shareholders loans into equity. According to management, the parent is also willing to extend the tenor of the remaining shareholder debt by three years. While, the high short-term debt exposure at 1H FY17 (78%) is concerning, this will be addressed by the Rights Issue, which should see net gearing and net debt to EBITDA managed to around 50% and 200% respectively. Factors that could trigger rating action may include Positive change: Upward rating migration in the medium term would depend on stabilisation/normalisation of the Group’s earnings and free cash flows, together with gearing and debt service metrics within guidance. Negative change: Slower than anticipated economic growth, delays in rolling out public infrastructure projects, foreign currency scarcity, and competitive pressures may constrain demand and/or pricing flexibility. These factors could adversely affect earnings and result in liquidity strain, increased gearing metrics and impede debt service, placing downward pressure on the ratings. Rating class Rating scale Rating Rating outlook Expiry date Long term National A+ (NG) Stable August 2018 Short term National A1(NG) Series 1 Fixed Rate Bond National A+ (NG) Stable August 2018 Series 2 Fixed Rate Bond National A+ (NG) Stable August 2018
Transcript

Nigeria Corporate Analysis | Public Credit Rating

Lafarge Africa Plc

Nigeria Corporate Analysis October 2017

Financial data:

(USD’m Comparative) ‡

31/12/15 31/12/16

N/USD (avg.) 193.1 253.2

N/USD (close) 197.0 305.0

Total assets 2,284.9 1,642.4

Total debt 752.7 418.1

Total capital 886.3 811.1

Cash & equiv. 83.7 63.2

Turnover 1,383.6 867.8

EBITDA 348.4 101.9

NPAT 140.6 66.7

Op. cash flow 357.6 (2.9)

Market cap. ° USD925.7m

Market share* c.25% ‡ Central Bank of Nigeria exchange rates.

°As at 22/09/2017 @ N305.35/USD.

*Estimated percentage market share of 2016

cement sales in Nigeria

Rating history:

Initial rating (July 2010)

Long-term: A(NG)

Short-term: A1(NG)

Rating outlook: Stable

Last rating ( October 2016)

Long-term: A+(NG)

Short-term: A1(NG)

Rating outlook: Stable

Series 1 Fixed Rate Bond: A+(NG)

Series 2 Fixed Rate Bond: A+(NG)

Rating Outlook: Stable

Related methodologies/research:

Global master criteria for rating corporate

entities, updated February 2017

Glossary of terms/ratios, February 2017

Lafarge Africa Plc (“Lafarge Africa” or “LAP”

or “the Group”), rating reports 2010-16; LAP

bond rating report, October 2016

GCR contacts:

Primary Analyst

Adekemi Adebambo

Senior Credit Analyst

[email protected]

Committee Chairperson

Dave King

[email protected]

Analyst location: Lagos, Nigeria

+234 1 462 – 2545

Website: http://www.globalratings.com.ng

Summary rating rationale

Lafarge Africa’s strong domestic market position is underpinned by an

established international brand, effective distribution network, and operational

support from its parent, LafargeHolcim. The recent completion of the new

2.5mtpa cement line at Mfamosing, Cross River State, has increased its

production capacity to 14.1mtpa and further enhanced earnings potential.

LAP’s cement sales volumes reduced by 16% in FY16, due to disruptions in gas

supply and scarcity of foreign currency, which impeded productivity. Coupled

with pricing pressures (in the first eight months of 2016), this drove an 18%

decline in revenue to N219.7bn in FY16. The significant escalation in energy

costs and the effect of a weaker Naira saw EBITDA margin contract sharply to

11.7% in FY16 (FY15: 25.2%), albeit this had corrected by 1H FY17. Increased

productivity and operating efficiencies are expected to support an EBITDA

margin of 29% for the full year.

1H FY17 cash generation rebounded N30.7bn, from the weak performance

reported in FY16, to match historical trends. This was, however, offset by the

accumulation of higher value inventory and debtors absorption, which drove an

N8.4bn operating cash outflow (FY16: N725m outflow; five year average:

N33.9bn inflow). While debt service and liquidity ratios are set to normalise by

FY17, GCR will continue to monitor performance over the rating horizon, with

an interest cover ratio of approximately 4x required to support stronger ratings

(inter alia).

In September 2016, LAP restructured USD493m (N139bn) of shareholder loans

into a hybrid instrument, repayable at its discretion. Following the introduction

of the dynamic Nigerian Inter-Bank Foreign Exchange Fixing (“NIFEX”)

market it hedged its USD shareholder loan exposure and thus reclassified the

quasi-equity to debt in 1H FY17. Borrowings therefore nearly doubled to

N244.7bn in 1H FY17 (FY16: N127.5bn), with shareholder loans accounting

for 52% of the total (FY16: 22%). Net gearing increased from 58% at FY14 to

peak at 117% at 1H FY17 (FY16: 44%) while net debt to EBITDA deteriorated

materially from 145% at FY14 to 420% at FY16, before improving to 300% in

1H FY17.

LAP is planning a N131.7bn Rights Issue in 4Q FY17. Through the offer,

LafargeHolcim, will subscribe to its rights by converting c.70% of dollar

denominated shareholders loans into equity. According to management, the

parent is also willing to extend the tenor of the remaining shareholder debt by

three years. While, the high short-term debt exposure at 1H FY17 (78%) is

concerning, this will be addressed by the Rights Issue, which should see net

gearing and net debt to EBITDA managed to around 50% and 200%

respectively.

Factors that could trigger rating action may include

Positive change: Upward rating migration in the medium term would depend on

stabilisation/normalisation of the Group’s earnings and free cash flows, together

with gearing and debt service metrics within guidance.

Negative change: Slower than anticipated economic growth, delays in rolling out

public infrastructure projects, foreign currency scarcity, and competitive pressures

may constrain demand and/or pricing flexibility. These factors could adversely

affect earnings and result in liquidity strain, increased gearing metrics and impede

debt service, placing downward pressure on the ratings.

Rating class Rating scale Rating Rating outlook Expiry date Long term National A+ (NG)

Stable August 2018

Short term National A1(NG)

Series 1 Fixed Rate Bond National A+ (NG) Stable August 2018

Series 2 Fixed Rate Bond National A+ (NG) Stable August 2018

Nigeria Corporate Analysis | Public Credit Rating Page 2

Background and recent developments

Incorporated in 1959, Lafarge Africa Plc1, is one of the

leading cement producers on the continent, with operations

in Nigeria and South Africa. It is a subsidiary of

LafargeHolcim, a global leader in cement, aggregates,

concrete and related services. LafargeHolcim operates in

80 countries (across 2,300 plants) and combined installed

cement capacity of 353.3mtpa. Lafarge Africa has five

subsidiaries namely AshakaCem Plc (“AshakaCem”);

Atlas Cement Company Limited (“Atlas”); United Cement

Company Nigeria Limited (“UniCem”); Lafarge Ready

Mix Nigeria Limited (“LRMN”) and Lafarge South Africa

Holdings (Pty) Limited (“LSAH”). LAP holds 86.5% stake

in AshakaCem while all other subsidiaries are wholly-

owned. (During 2Q 2017, the application for the voluntary

delisting of AshakaCem was approved by the Nigerian

Stock Exchange (“NSE”). Subsequently, the subsidiary has

been successfully delisted from the daily official list of

NSE).

Following the commissioning of additional 2.5mtpa

capacity at UniCem in 4Q FY16, LAP’s total production

capacity expanded to 14.1mtpa, and is expected to increase

in the medium term. The new line produced 338,000 tonnes

of cement in 2016, representing 6% of LAP’s Nigeria

cement volumes. At FY16, LAP had spent N82.3bn on the

project. The Group also has market leading positions in

aggregates, ready mix concrete (“RMC”) and fly ash.

1H FY16 was very challenging in view of increased

competitive pressures, and production challenges across its

domestic plants during the period, as pipeline vandalism

led to widespread disruption in gas supply. A total of two

months of gas shortage were recorded at the Ewekoro and

Sagamu plants, while the Mfamosing plant (UniCem) lost

12 working days. Accordingly, LAP’s Nigerian operations

could not fully meet customer demand during the period, as

production volumes declined 13% y/y in 1H 2016.

Domestic cement producers including LAP had to utilise

more Low Pour Fuel Oil (“LPFO”) to sustain production,

which is 2.5x more expensive than gas (per tonne of

cement). Consequently, industry players witnessed overall

contraction in margins during FY16, exacerbated by gas

shortages, currency devaluation and economic recession.

There was a 45% price increase effective September 2016,

which resulted in firmer profitability for 4Q 2016, albeit

that the impact on full year performance was limited.

Following three market price increases in Nigeria during

1H 2017, LAP reported strong turnover growth and

improved earnings margins from the materially subdued

performance in 1H FY16.

In March 2016, Lafarge Africa Plc secured approval from

Securities and Exchange Commission (“SEC”) to issue

bonds into the Nigerian capital market, under a N100bn

programme (“the Programme). In June 2016, the Issuer

raised an initial N60bn in two tranches of N26.4bn and

N33.6bn respectively. The net proceeds from both Issues

1 formerly Lafarge Cement WAPCO Nigeria Plc

(totalling N58.9bn) were applied towards part refinancing

of UniCem’s local currency and USD denominated bank

loans. At the June 2017 Annual General Meeting,

shareholders approved a N140bn Rights Issue proposal. In

the immediate term, LAP is planning a N131.7bn Rights

Issue in 4Q FY17, expected to conclude by November.

Through the offer, LafargeHolcim, will subscribe to its

rights by converting c.70% of dollar denominated

shareholders loans into equity. The inflow from minority

shareholders (if fully subscribed) will be utilised for

working capital and capital expenditure. The Rights Issue

is expected to reduce LAP’s foreign currency exposure by

around 50%.

Corporate governance and shareholding

Table 1: Corporate governance summary

Board Composition

Number of directors 11

Independent non-executives 2

Non-independent non-executives 8 (including the Chairman)

Executives 1 (the Managing Director)

Separation of the chairman Yes, Chairman is separate from MD

Frequency of meetings Minimum of quarterly. The Board met six times

during FY16

Board committees

Finance and Strategic Planning; Nomination and

Remuneration; Risk Management and Ethics; and

Property Optimisation

Internal control and compliance Yes, reports to the Board Risk Management and

Ethics Committee

External auditor

Ernst & Young. Unqualified audit opinion on the

2016 financial statements. Erstwhile auditor,

Akintola Williams Delloite also issued clean audit

opinions over the preceding four years under

review.

LAP’s corporate governance structure complies with the

relevant requirements of the Companies and Allied Matters

Act, Securities and Exchange Commission (“SEC”) Code

of Corporate Governance for Public Companies in Nigeria,

as well as NSE regulations. There were few changes in the

size and composition of LAP’s board of directors in 2016

and 1Q 2017, owing to resignations of the CFO, Mr. Anders

Kristiansson (to take another role within LafargeHolcim)

and Mrs. Adepeju Adebajo (who was appointed the

Commissioner of Agriculture by the Ogun State

Government). The board appointed Mr. Bruno Bayet as

Group CFO, effective September 30, 2016. He has worked

with the Group since September 2014 and has over 16

years’ experience in the materials and construction

industry. LAP’s board members are from diverse

backgrounds, with extensive experience in cement

manufacturing, engineering, marketing, law, banking and

finance (amongst others).

Table 2: Shareholder profile as at FY16 Holdings Holdings

(N’m) (%)

Associated International Cement Ltd. 1,204.5 21.9

Financiere Lafarge SAS 797.2 14.5

Lafarge Nigeria Ltd 776.6 14.1

Lafarge Nigeria (UK) Ltd 427.5 7.8

Lafarge Cement International BV 318.1 5.8

Holcibel S.A 454.5 8.3

LafargeHolcim Group 3,978.4 72.5

Odua Investment Company Limited 166.8 3.0

Stanbic Nominees Nigeria Limited 266.9 4.9

Others 1,078.4 19.6

Total 5,490.5 100.0

Nigeria Corporate Analysis | Public Credit Rating Page 3

Listed on the SIX Swiss Exchange and Paris Stock

Exchange, LafargeHolcim reported net sales of CHF26.9bn

(EUR25.1bn) in FY16 (FY15: CHF23,584; EUR, with a

market capitalisation of EUR35.7bn at 25/09/2017.

LafargeHolcim is rated BBB by Standard & Poor’s (stable

outlook) and Baa2 by Moody’s, with a negative outlook.

Although LAP’s long term, national scale rating is not

directly notched against that of LafargeHolcim, it is

reflective of the strong competitive position gained by the

capital and technical support provided by the parent. LAP

pays LafargeHolcim a technical fee for the provision of

technical and operational support, in line with terms of an

Industrial Franchise Agreement.

Table 3: LafargeHolcim

financial profile (CHF'bn) FY15 FY16 1H FY17

Revenue 23.6 26.9 12.5

EBITDA 3.7 5.2 2.5

Operating profit (0.7) 2.8 1.4

Operating cash flow 2.5 3.3 (0.1)

Net interest (0.9) (0.9) (0.3)

Debt 22.8 19.7 19.4

net debt 18.4 14.8 15.8

equity* 17.5 17.8 16.3

Net int. cover (x) n.a 3.1 4.8

Net debt to Equity (%) 105.2 83.1 96.9

Net debt to EBITDA (%)^ 499.7 282.3 316.9

*net tangible basis

^annualised

Operating environment

The Nigerian economy remained subdued throughout

2016, owing to a marked reduction in crude production,

amidst low and unstable international oil prices. This has

severely affected the country’s foreign reserve levels and

fiscal planning capacity. Specifically, international crude

oil prices declined from c.USD110/bbl in June 2014 to

USD30/bbl in January 2016, and averaged USD43 in 2016

(on the back of a rebound towards year-end, which saw

prices climb to USD53/bbl in December). The negative

economic trend was exacerbated by the resurgence of

disturbances in the Niger Delta region (which affected

crude oil production outputs) and the impact of reduced

foreign exchange earnings on the economy. The significant

fall in the value of the Naira against the US dollar further

heightened uncertainty. The country’s real gross domestic

product (“GDP”) contracted by 1.5% in 2016 (compared to

2.8% and 6.2% growth recorded in 2015 and 2014

respectively), placing the country in a recession. In 2Q

2017, Nigeria’s GDP recorded a 0.6% y/y growth (and 2%

q/q), indicating the nation’s exit from recession, following

five consecutive quarters of contraction since 1Q 2016.

Inflation climbed from 9.5% at end-December 2015 to

18.6% at end-December 2016, before easing to 16.1% at

end-August 2017, the seventh consecutive decline since

January 2017.

Despite Central Bank of Nigeria’s (“CBN”) restrictive

policy that denied access to forex (from the official CBN

window) for 41 items and removal the exchange rate peg to

the USD in favour of a flexible exchange rate policy in June

2 Benchmark interest rate 3 MPR has been left unchanged since July 2016

2016, the Naira remained under pressure, with the

inadequate forex supply from the official CBN window

driving much weaker exchange rates in the parallel market.

The NGN/USD exchange rate rose above N500/USD in

February 2017, remaining above N450/USD till mid-

March 2017. CBN established the Investors & Exporters

FX window in April 2017, to boost liquidity in the FX

market and to ensure timely execution and settlement for

eligible transactions. The recent intervention has increased

the dollar liquidity in the market with exchange rates

remaining below N400/USD since end-April. At its last

sitting in August 2017, the Monetary Policy Committee left

the monetary policy rate2 (“MPR”) unchanged at 14%3,

while the cash reserve ratio and liquidity ratio for banks

were also maintained at 22.5% and 30% respectively, in

line with efforts to combat inflation and maintain price

stability.

Given the current macroeconomic challenges, prospects for

growth remain mixed over the short to medium term. Both

the International Monetary Fund and World Bank expect

the economy to record a modest rebound in 2017 (of 0.8%

and 1.2% respectively). To stabilise the economy, the FGN

has maintained an expansionary policy for the 2017 fiscal

year, with a budget of N7.44trn4 (2016: N6.08tn, 2015:

N4.49tn). The budget is based on an oil benchmark of

USD44.5/bbl and a daily production output of 2.2mb/d,

inter alia. The Ministry of Budget and National Planning

has recently released the Economic Recovery and Growth

Plan (“ERGP”) 2017-2020. Based on the ERGP, the FGN

anticipates that accelerated infrastructural spend and the

diversification of earnings would drive an increase in

economic activities, thereby, resulting in an overall GDP

growth in 2017.

Industry overview - Nigeria

Nigeria, LAP’s main market, has strong potential for

traction in cement consumption, on the back of a population

of 180 million, a burgeoning middle class, and considerable

infrastructural deficiencies. The country also presents

substantial limestone reserves. Per capita consumption is

low at around 125kg (global average: 570kg) implying

significant potential for further growth, although this has to

be considered against the backdrop of high levels of FGN

indebtedness, and is also dependent upon strong economic

and FGN revenue growth and sustained improvement in per

capita income levels. The significant decline in crude oil

prices and shortfall in production placed material strain on

government revenue and expenditure. Government

expenditure is a critical growth driver in the construction

sector. In addition, the protracted delay in passing the

national budget, high inflation, reduced consumer

spending, higher lending rates and inadequate funding all

contributed to a 6% contraction in the construction sector

GDP in 2016 (2015: 4.4% growth). According to industry

sources, overall domestic demand for cement of c.22.6mt

in 2016 was flat (a departure from the five-year CAGR of

4 Signed into law in June 2017.

Nigeria Corporate Analysis | Public Credit Rating Page 4

c.9% to 2015) and is estimated to grow slightly to 24.4mt

in 2017 (1H 2017: 10.2mt).

DCP and Lafarge Africa Plc5 (“LAP”), controlled 90% of

industry volumes and revenues in 2016. BUA Group

accounted for around 9% of the industry while a few small

players, including Ibeto Group accounted for the balance.

The cement industry is highly capital intensive, posing a

significant barrier to entry. The anticipated recovery in the

Nigerian economy during 2H 2017 bodes positively for the

cement sector, albeit that the impact will likely be more

evident during 1H 2018 (especially with 2018 being a pre-

election year, with a lot of pending projects expected to be

completed. In this regard, the FGN committed to

investment in public infrastructure (in the ERGP), with the

capital spending retained at around 31% of 2017 budget

(2016: 31%; 2015: 12%).

Table 4: Competitive position - Lafarge Africa Plc vs Dangote Cement Plc

FY16 (N'm) LAP DCP

Revenue 219,714 615,103

EBITDA 25,804 256,778

Op. Income 9,927 182,028

Net interest income/(expense) (11,829) (42,719)

NPAT 16,899 186,624

Equity 247,389 793,200

Total debt 127,530 372,775

Cash and equiv. 19,265 115,693

Current assets 98,344 303,164

Total assets 500,927 1,573,741

Current liabilities 175,987 512,247

Cement Capacity in Nigeria 11mtpa 29.3mtpa

Total Cement Capacity 14.1mtpa 45.8mtpa

Ratios (%)

Market share (%) 25.0 65.0

Revenue growth (17.8) 25.1

EBITDA margin 11.7 41.7

Operating margin 4.5 29.6

Net gearing 43.8 32.4

Net debt :EBITDA 419.6 100.1

South Africa operating environment

The South African economy achieved real growth of just

0.3% in 2016, behind significantly revised expectations of

0.5% (2015: 1.3%). Weaker growth stemmed from the

curtailed agricultural performance due to a severe drought,

and a beleaguered mining sector, amidst weak commodity

prices. While manufacturing regained some of the ground

lost in an especially challenging 2015, the sector remains

depressed due to weak demand, with local goods poorly

positioned to compete with aggressively priced Asian

products both home and abroad. South Africa entered into

a technical recession in 2017, as GDP shrank by 0.7% in

1Q 2017 following a 0.3% contraction in 4Q 2016. SA has

reported a 2.5% q/q and 1% y/y growth in 2Q 2017, (IMF

2017: 1%) underpinned by the recovery in agricultural

productivity.

The fortunes of the cement industry are tied to those of the

construction sector, which itself remains constrained by the

scarcity of large public sector projects and private sector

infrastructure projects, which typically provide work across

the value chain. The construction sector reported a

5 Inclusive of revenues of subsidiaries (AshakaCem and UniCem)

slowdown in real growth y/y from 4.6% in 2013 to 0.7% in

2016, while a 1.3% QoQ contraction was evidenced in 1Q

2017 (4Q 2016: 0.4%). The construction sector contracted

further by 0.5% q/q in line with declining residential and

non-residential activities. The burgeoning fiscal deficit,

compounded by the rising cost of funding from the recent

sovereign rating downgrades could further slow

progression on potential major infrastructural

developments in the short term.

While the South African Government increased cement

import duties/tariffs in 2016 to protect local cement

producers, the relatively cheaper cost of transporting

cement and clinker has made Asian producers (especially

from China and Pakistan) a continuing threat to

manufacturers. Selling prices remained under pressure in

2016 due to oversupply (which increased the bargaining

power of retailers) and intense competition for market share

(including price wars). According to industry sources,

Market demand in SA is forecast to remain fairly flat at

13.2mt in 2017 (2016 estimate: 12.6mt) in line with

economic outlook while national capacity should register a

low 2% growth. Competition amongst local producers will

also intensify amidst weak demand, and could further

elevate pricing pressures. LAP is not likely to draw much

mileage from its SA business in the immediate term. Major

players in the South Africa cement industry include PPC

Limited, Afrisam, LAP, Cimpor, Mamba Cement and

Sephaku Cement (64% owned by Dangote Cement Plc).

There is the likelihood of consolidation between Sephaku

Cement and PPC Limited, albeit that negotiations are

presently at preliminary stages.

Operations and earnings diversification

Table 5: financial

highlights by

Segment (N'bn)

2015 2016 1H FY17

Nigeria South

Africa Nigeria

South

Africa Nigeria

South

Africa

Revenue 191.7 75.6 152.4 67.3 111.4 43.4

EBITDA* 61.3 6.0 26.0 3.0 37.7 0.9

Operating profit 47.6 4.0 9.3 0.6 26.9 (1.0)

Equity 155.7 20.4 227.3 21.6 154.1 35.8

Total Assets 411.9 41.1 458.6 43.9 519.5 88.0

Capex 57.7 2.4 38.0 3.5 5.5 0.3

Capacity (mtpa) 3.6 8.5 3.6 11.0 3.6 11.0

Sales vols (Mt) 6.3 n.a 5.3 n.a 2.5 n.a

EBITDA margin (%) 32.0 8.0 17.0 4.4 33.8 2.1

Op. margin (%) 24.8 5.4 6.1 0.9 24.1 (2.3)

Asset turnover (x) 0.5 1.5 0.4 1.6 0.5 0.7

*Operating EBITDA adjusted for restructuring and other one-off costs (1H FY17: N1.3bn;

FY2016:N3.1bn; FY15: N 4.6bn)

Cement sales accounted for 79% of the Group’s revenue in

FY16 (FY15: 82%), while aggregates contributed 19%

(FY15: 16%). Nigeria continues to dominate its operations,

and accounted for 69% (FY15: 72%) of revenue and a

much higher 94% of operating profit in FY16 (FY15: 92%).

Given the recent capacity expansion project at UniCem and

the constrained South African environment, this split is

expected to be sustained well into the medium term.

Nigeria Corporate Analysis | Public Credit Rating Page 5

Nigeria

LAP’s business in Nigeria is grouped into South West

operations (“WAPCO”); Southern Nigeria operations

(“Mfamosing operations” or “UniCem”); Ashaka

Operations (Northern Nigeria operations) and Atlas &

ReadyMix (Atlas & LMRN). WAPCO consists of three

cement plants in Ogun State, with a combined production

capacity of 4.5mtpa. UniCem’s installed capacity has

doubled to 5mtpa following the recent capex project.

Ashaka has a production capacity of 1mtpa, with additional

capacity of 3mtpa expected to come online in the medium

term. Part of this will derive from a debottlenecking project

at AshakaCem’s existing plant in Gombe State, which is

expected to be completed by 2020. Atlas is located in Onne

Free Trade Zone, Rivers State and operates a floating unit,

with capacity to pack 500,000 tons of imported cement per

annum. LMRN has six ready mix plants operational, with

flexible capacity.

Table 6:

Nigeria

earnings

perf.

2015 2016 1H FY17

Rev.

(N'bn)

EBD.

(N'bn)

margin

(%)

Rev.

(N'bn)

EBD

(N'bn)

margin

(%)

Rev.

(N'bn)

EBTD

(N'bn)

margin

(%)

WAPCO 114.6 37.7 32.9 87.2 17.4 20.0 52.1 20.9 40.1

UniCem 54.3 19.1 35.2 43.7 6.2 14.3 42.7 13.0 30.6

Ashaka 17.4 3.9 22.4 17.4 2.7 15.3 14.4 3.9 27.1

Atlas &

LMRN 8.6 0.6 7.0 6.2 (0.4) (6.5) 4.0 (0.1) (2.5)

*EBD means EBITDA

Production challenges and pricing pressures saw Nigeria’s

revenue and EBITDA decrease by 21% and 80%

respectively in FY16, with severely constrained margins

reported across all operating segments. WAPCO is the

dominant earnings contributor accounting for 56% and

67% of revenue and EBITDA respectively in FY16 (FY15:

59% and 62%). UniCem accounted for a stable 28% of

revenue in FY16, while its contribution to EBITDA

reduced to 24% (FY15: 31%), as a result of price attrition

and escalated energy costs during 1H FY16. Due to

security challenges in the North-Eastern region over the

past few years, infrastructural developments have been

scarce. This notwithstanding, Ashaka maintained some

stability in revenue during FY16 albeit that reliance on

LPFO during the upgrade of its coal mill adversely affected

earnings. Ashaka contributed 11% and 10% of revenue and

EBITDA respectively in FY16 (FY15: 9% and 6%).

Price increases in Nigeria have supported a 45% y/y topline

growth in 1H 2017. Combined with cost management

initiatives and operating efficiencies, EBITDA increased

by 273% y/y to N37.7bn in 1H FY17 at a 33.8% margin

(1H FY16: 13.2%). Cement selling prices are expected to

remain stable to offset devaluation and inflation impact

during the year. Further savings are expected from the

ongoing cost rationalisation project and EBITDA margins

are expected to be restored to firmer historical levels.

South Africa

Revenue and EBITDA declined 11% and 51% respectively

in FY16 due to constrained economic conditions, weak

demand (stemming from paucity of infrastructural projects)

6 Comprises personnel expenses, by-product costs, inventory write-offs and electrical

energy expenses

and pricing pressures. The EBITDA margin was severely

depressed in FY16. The 42% y/y revenue growth in 1H

FY17 was underpinned by foreign exchange translation

impact as the Rand strengthened against the Naira. The

translation impact also filtered through to the EBITDA line,

combined with cost management initiatives and slightly

better pricing (compared with 1H FY16), EBITDA

increased 78% y/y to N905m in 1H FY17. Management

anticipates a 5% revenue growth for FY17. The

competitive landscape and operating environment is

expected to remain challenging, and as such earnings, are

likely to remain muted over the rating horizon. LAP expects

a recovery for South Africa and intends to pursue a market

strategy of differentiation in key customer segments through

offering solutions that are focused on end-user needs.

Table 7: Operating

performance LSAH

(N’bn)

FY15 FY16 % Δ 1H

FY16

1H

FY17 y/y % Δ

Revenue 75.6 67.3 (10.9) 30.7 43.4 41.6

EBITDA 6.0 3.0 (50.8) 0.5 0.9 77.5

EBITDA margin (%) 8.0 4.4 - 1.7 2.1 -

Financial performance

A five-year financial synopsis and the unaudited interim

results to June 2017 are appended to this report, while

commentary follows. Audited financial statements are

prepared in accordance with IFRS, as well as the

requirements of CAMA and the Financial Reporting

Council of Nigeria Act, 2011.

Table 8: Income

statement (N'bn) FY15 FY16 %Δ

1H

FY16

1H

FY17

y/y

Revenue 267.2 219.7 (17.8) 107.4 154.8 44.2

Gross Profit 82.6 40.7 (50.8) 15.1 44.4 193.6

EBITDA 67.3 25.8 (61.6) 10.6 36.6 246.4

Depreciation (16.1) (15.9) (1.7) (7.6) (10.7) 40.4

Op. Profit 51.1 9.9 (80.6) 2.9 25.9 785.2

Net interest* (8.8) (11.8) 35.2 (4.6) (10.0) 118.4

Other op. inc/exp† 1.4 1.8 29.5 (28.5) 2.2 (107.9)

Forex mvmt. (8.4) (22.7) 169.3 0.0 0.0 n.a

Combination. exp. (6.0) 0.0 (100.0) 0.0 0.0 n.a

NPBT 29.3 (22.8) (177.9) (30.2) 18.2 (160.2)

Key ratios (%)

Gross margin 30.9 18.5 14.1 28.7

EBITDA margin 25.2 11.7 9.8 23.6

Op. margin 19.1 4.5 2.7 16.7

Net int. cover (x) 5.8 0.8 0.6 2.6

*Includes interest income from short term securities and fixed bank deposits. †Includes profit/loss from disposed fixed assets, investments and associates

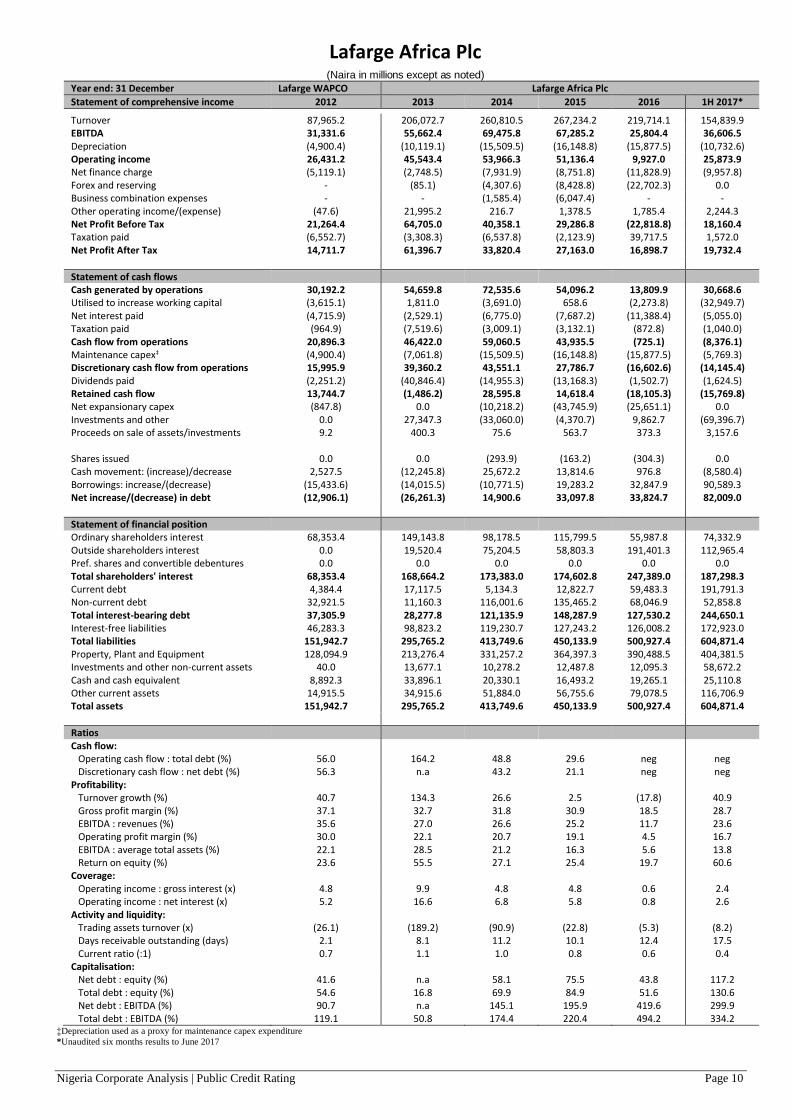
LAP’s cement volumes decreased by 16% in FY16 and

combined with the impact of pricing pressures in Nigeria

and South Africa, revenue fell by 18% to N219.7bn in

FY16, representing 63% of forecast. Fuel costs spiked to

N21.2bn in FY16 (FY15: N9.3bn) and absorbed 10% of

revenue compared with 4% in FY15. In addition, fixed

production costs6 more than trebled to N26.9bn in FY16

(and absorbed 12% of revenue from just 3% in FY15). As

a result, gross margin contracted to a review period low of

18.5% in FY16 (budget: 33.7%), from 30.9% in FY15

while gross profit halved to N40.7bn. Positively, there has

been increased stability in gas supply since September

2016, and most plants can operate on gas, coal and/or

Nigeria Corporate Analysis | Public Credit Rating Page 6

alternative fuels. A 16MW lignite-fired coal power plant is

being built at Ashaka, with commissioning expected for

2018. Combined, selling and administrative costs absorbed

14% of revenue (FY15:12%). The EBITDA margin

declined to an all-time low of 11.7% in FY16 (FY15:

25.2%; five-year average: 25.2%) stemming largely from

pressures from the gross margin line. Consequently,

operating profit plunged to cN10bn, representing less than

20% of initial expectation.

Cement demand was sluggish in Nigeria during 1H FY17

based on the challenging operating environment and delay

in passing the national budget. According to management,

national cement consumption contracted by 28% in 2Q

FY17 y/y, due to prevailing economic realities which

impacted negatively on end-user demand. Consequently,

LAP’s domestic cement sales volumes was 2.5mt in 1H

FY17, compared with 3.1mt in 1H FY16. This was offset

by price increases in Nigeria, which supported 44% y/y

growth in LAP’s revenue to N154.8bn in 1H FY17. Despite

the lower volumes, production costs rose by 20% y/y to

N110.bn in 1H FY17, mainly due to impact of currency

devaluation on maintenance costs, fixed and variable

production costs, as well the increase in the price of gas.

The strong turnover growth bolstered the gross margin to

28.7% (1H FY16: 14.1%), while a correction in the

EBITDA margin to 23.6% (1H FY16: 9.8%) saw a 246%

increase in EBITDA to N36.6bn. Although depreciation

costs increased by 40% y/y, the higher EBITDA margin

and overhead cost rigour supported a 12 percentage-point

correction in the operating margin to 16.7%, leading to a

considerable rise in operating profit to N25.9bn (1H FY16:

N2.9bn; 1H FY15: N32.6bn). Domestic earnings are

typically firmer in the last quarter of the year, due to

increased construction activities in the dry season, which

suggests that FY17 financial performance could supersede

FY15, barring exogenous shocks.

Gross interest costs rose by 45% to N15.5bn in FY16,

mainly due to the impact of cessation of interest

capitalisation on newly commissioned 2.5mtpa line at

UniCem and impact of devaluation in Naira value on USD-

denominated finance costs. Overall, net interest costs rose

by 35% to N11.8bn in FY16. Gross and net interest cover

reduced below 1x due to the depressed operating income,

reflecting marked deterioration in debt serviceability. Net

interest cover rose to 2.6x in 1H FY17 (1H FY16: 0.6x)

despite the 68% increase in net interest expenses, albeit

continuing to track below historical levels. UniCem

accounted for 49% and 53% of gross finance costs in FY16

and 1H FY17 respectively. With the project completed,

gross debt for Nigeria is anticipated to taper below N200bn

at FY17.

LAP reported a significant N22.7bn foreign exchange loss

in 2016, largely the impact of adverse currency movement7

realised on repaying a portion of UniCem’s USD

denominated loans. After accounting for other income, a

7 exacerbated by impact of the 45% devaluation in Naira value

pre-tax loss of N22.8bn was reported in FY16 compared

with a profit of N29.3bn in FY15. The Group reported a

post-tax profit of N16.9bn in FY16, supported by N39.7bn

deferred tax credits from UniCem. After accounting for a

much lower interim tax credit of N1.6bn, net income

increased by an annualised 134% to N19.7 in 1H FY17 (1H

FY16: net loss of N30.2bn), at a 13% net margin (FY16:

8%).

Cash flow Table 9: Working capital (N'bn) FY15 FY16 1H FY17

Inventories 33.0 44.5 57.2

Trade receivables 7.4 7.6 22.1

Trade payables (56.4) (60.4) (42.9)

Operating working capital (15.9) (8.2) 36.4

Other receivables 9.7 17.0 27.3

Prepayments 6.6 9.9 10.1

Other payables and accruals (24.2) (55.3) (82.8)

Current tax payable (0.4) (0.8) (1.0)

Non-operating working capital (8.2) (29.2) (46.4)

Net working capital asset/(liability) (24.1) (37.4) (10.0)

Net working capital movement 0.7 (2.3) (32.9)

Cash generation continues to trend with EBITDA, barring

deviations attributed to one-off restructuring costs, write-

offs and adjustments for fair value and unrealised foreign

currency movements. Cash generation fell sharply in FY16,

registering at N13.8bn (FY15: N54.1bn), which was starkly

at odds with a strong historical trend. Enhanced

profitability saw a correction to N30.7bn in 1H FY17 (1H

FY16: N14.8bn). Working capital requirements have

fluctuated widely over the five and a half years under

review, reflecting the increase in capacity, reorganisation,

and evolving market conditions. That said, pressures

particularly intensified during 1H FY17, with an

unprecedented increase in working capital of N32.9bn (1H

FY16: N2bn decrease). This was partly due to a ramp up of

inventories (both from production and consumables)

attributed to newly commissioned capacity. This was

further exacerbated by slow market uptake of cement

produced, with note also taken of the increased value of

inventories on hand due to the distortive effect of currency

movements. Further distortion came from the inclusion of

advance payments to suppliers related to the UniCem

expansion project. An untapped letter of credit (1H FY17:

N8bn; FY16: N5.6bn; FY15: N4.2bn) related to the Ashaka

project is included in other receivables. The project was

temporarily suspended due to security challenges in North-

Eastern Nigeria.

Historically, trade debtors have had little impact on

working capital movements, as 90% of LAP’s customers

pay before delivery while the other 10% have varying terms

of trade but are usually allowed a 30-day credit period.

However, due to effect of economic recession, customers

that used to pay months in advance, reduced payment

timelines. Trade receivables increased by N14.5bn in 1H

FY17, albeit that trade debtors turnover remained below 20

days. LAP settled around N6bn in outstanding technical

Nigeria Corporate Analysis | Public Credit Rating Page 7

fees during 1H FY17 and N17.3bn in trade creditors while

other payables also increased by N23bn. The net increase

of N5.4bn in creditors was completely offset by the

movement in inventory and debtors’ balances.

The moderate cash generated in FY16 was largely

consumed by the combined interest and tax outlay of

N12.3bn and a N2.3bn, inventory-driven increase in

working capital. Accordingly, LAP reported an operating

cash outflow of N725m in FY16, which was followed by a

much larger interim out flow of N8.4bn in IH FY18.

While no quantified guidance is given regarding LAP’s

dividend policy, management indicated that the dividend

cover is set after taking into account operational and

expansionary capital expenditure requirements as well as

planned investments. The Board proposed a dividend

payment of N1.05 per share on the 2016 results (2015

results: N3 per share), which represented 34.7% (2015:

50%) of net profits. As a result of foreign exchange

liquidity challenges, outstanding dividend balances due to

LafargeHolcim increased from N3.4bn in FY15 to N18.9bn

in 1H FY17 (FY16: N13.2bn). According to management,

around N15bn of the outstanding amount was settled during

3Q FY17.

Since FY14, capex spend has related largely to the

construction of the 2.5mtpa plant at Mfamosing while the

balance was spent on maintenance capex across other

operations. Total capex registered at N41.5bn in FY16

(FY15: 60bn) before tapering to N5.8bn in 1H FY17.

According to management, capex spend will be around

N27bn in FY17, and of this, N17.8bn pertains mainly to the

Ashaka coal fired power plant and UniCem (crusher, line 2

and evacuation road) while N9bn is maintenance and

development capex. The investment inflow of N9.9bn

reported in FY16 is a net movement in receivables due from

related companies (UniCem and NCH). A significant

N69.4bn net investment outflow was reported in 1H FY17

and relates mainly to movement in deferred tax assets and

intercompany receivables. As capex has been mainly

funded by debt, LAP’s net debt increased by a cumulative

N148.9bn in the 30-month period to 1H FY17.

Funding and gearing profile

Underpinned by business combination and capacity

expansion, LAP’s asset base increased fourfold from

N151.9bn at FYE12 to 604.8bn at 1H FY17 (FYE16:

N500.9bn). As is typical of the industry, the Group

evidences a capital-intensive balance sheet, with property,

plant and equipment (“PPE”) having averaged 77% of total

assets over the review period. PPE rose significantly from

N331.3bn in FY14 to N404.4bn in 1H FY17 following the

completion of new 2.5mtpa line. Inventories accounted for

10% of total assets in 1H FY17 (FY16: 9%; five-year

average: 8%). Debtors and prepayments have constituted

around 5% of the asset base since FY13, but increased to

10% of total assets at 1H FY17 (FY16: 7%). Cash balances

have accounted for a stable 4% of the asset base since FY15

and remained robust at N25bn at 1H FY17 (FY16:

N19.2bn). The remainder of the asset base comprised long

term intercompany receivables and deferred tax assets.

For most of the review period, equity has accounted for the

significant portion (over 40%), of funding. Net foreign

currency loans totalled USD595m at July 2016 (USD510m

shareholder loans and USD85m external loans). During 2H

FY16, LAP restructured USD493m (N139bn) of

shareholder loans into a quasi-equity instrument, repayable

at LAP’s discretion (and reported under ‘non-controlling’

interests in the AFS). The loans bear an average interest rate

of 6% p.a. Following the introduction of a dynamic

Nigerian Inter-Bank Foreign Exchange Fixing (“NIFEX”)

market in 2017, LAP saw a better option to repay the

shareholders loans and at the same time hedge its foreign

exchange exposure. It therefore reclassified the quasi-

equity to debt, more than doubling its borrowings to

N244.7bn in 1H FY17 (FY16: N127.5bn) to account for

40% of funding at 1H FY17 (FY16: 26%) while equity and

creditors accounted for 31% and 29% respectively (FY16:

49% and 25%).

Table 10: Bank/Credit

source Loan type FY16 (N'bn)

1H F17

(N'bn) Maturity

Nigeria 125.8 231.2

Intervention loans LT loan 6.3 5.7 2021 - 2023

Intervention loans current portion of

LT loan 2.8 0.0 2017

FirstBank Ltd. Promissory Notes 4.4 1.6 2017

Eight banks Overdrafts 23.0 38.2 2017-2018

Six banks ST and LT loans 2.5 12.7 2017-2018

Bonds LT 59.1 59.1 2019 - 2021

Shareholder loans

Caricement B.V USD0.65m 0.2 0.9 2018

Caricement B.V USD220m 0.0 80.6 2018

Holderfin B.V USD88.4m 27.5 32.4 2017

South Africa 1.8 13.5

Nedbank Pref. share loans 1.8 0.0 2016 - 2017

ABSA Pref. share loans 0.0 0.0 2016

Related party Interco. loans 0.0 13.5 2018 and 2024

Total 127.5 244.7

*ST is short term; LT is long term;

In December 2016, LAP obtained a USD88.4m short term

loan from Holderfin B.V, with maturity date of December

2017. Proceeds from the loan were used to refinance

UniCem’s USD-denominated loans (obtained from

Nigerian banks). In April 2017, LAP secured a USD220m

short term (general purpose) loan from Caricement B.V,

with maturity date of April 2018. Both loans are senior

unsecured obligations of LAP. LAP hedged its exposure on

both the USD88.4m loan and USD220m loan at

N274.5/USD and N375/USD respectively with non-

deliverable futures contract with FMDQ OTC Plc.

The remainder of debt at 1H FY17 comprises overdrafts

(drawn from facilities that are renewed annually) and the

outstanding balances on two intervention loans, obtained in

2011 and 2013 under the aegis of CBN’s Power & Aviation

Intervention Fund, through the Bank of Industry. Bank

overdrafts are unsecured while the term loan is secured by

mortgage debenture on LAP’s assets. For South African

operations, LSAH has had a mix of preference share loans

and overdrafts which were repaid in 2016. According to

Nigeria Corporate Analysis | Public Credit Rating Page 8

management, LSAH’s N13.5bn gross debt at 1H FY17

comprises related party loans (of R254.5m and R327.6m

respectively) which were obtained within the

LafargeHolcim group. Shareholder/intercompany loans

accounted for 52% of LAP’s gross debt at 1H FY17 (FY16:

22%). Nigeria accounts for over 90% of the Group’s

borrowings.

Combined with the impact of the new shareholder loans

and overdrafts, short term debt exposure was significant at

78% of total debt at 1H FY17 (FY16: 47%; FY15: 9%).

Cash coverage of short term debt was just 0.1x at 1H FY17

indicating significant liquidity strain. While GCR is

concerned about the short term debt exposure, the proposed

Rights Issue and debt restructuring should alleviate

liquidity and funding pressures.

Net gearing has increased from 58% at FY14 to peak at

117% at 1H FY17 (FY16: 44%) on the back of the

consolidation of UniCem and recent capex. Net debt to

EBITDA also rose materially to 420% at FY16 (budget:

142%), before improving to 300% in 1H FY17. From a

historical high of 16.6x in FY13, net interest cover declined

to a low of 0.8x in FY16 (FY15: 5.8x), before picking up

to 2.6x at 1H FY17. GCR expects net interest cover to

improve to 4x threshold to support stronger ratings in the

medium term (if achieved with the stabilisation of gearing

at the more conservative targeted levels). Operating cash

flow coverage of debt was negative at both FY16 and 1H

FY17, implying significant strain on LAP’s debt service.

Table 11: Funding profile (N’bn) FY15 FY16 1H FY17

ST debt 12.8 59.5 191.8

LT debt 135.5 68.0 52.9

Total debt 148.3 127.5 244.7

Cash (16.5) (19.3) (25.1)

Net Debt 131.8 108.3 219.5

Equity 174.6 247.4 187.3

Key ratios (%):

Total debt: equity 84.9 51.6 130.6

Net debt: equity 75.5 43.8 117.2

Total debt: EBITDA 220.4 494.2 334.2

Net debt: EBITDA 195.9 419.6 299.9

Cash: ST debt (x) 1.3 0.3 0.1

Review of the Series 1 and Series 2 Fixed Rate Bonds

The N26.4bn Series 1 Bonds and N33.6bn Series 2 Bonds

(“the Bonds”) have similar features, with the main

differences being the size and tenor. The method for

distribution for both Issues was by book building. (Please

see the GCR’s Lafarge Africa Bond Plc Rating Report

dated October 2016 for full details). Salient features of the

Bonds are as follows:

The Bonds are direct, unconditional, senior and unsecured

obligations, ranking pari passu with all other senior and

unsecured obligations of the Issuer.

Tenor of the Series 1 Bond will be 3 years, with legal

maturity in June 2019.

The Series 2 Bond has a 5 year tenor, with legal maturity

in June 2021.

Interest on the Bonds will accrue from issue date and will

be payable semi-annually in arrears.

The Series 1 and Series 2 Bonds bear fixed annual interest

rates of 14.25% and 14.75% respectively.

Net proceeds from the Series 1 and Series 2 Issues

amounted N25.9bn and N33bn respectively.

The transaction documents anticipate a bullet principal

repayment structure for both Issues.

Per Clause 10 of the Programme Trust Deed, the Bonds

bear a negative pledge; whereby as long as any of the

Bonds remain outstanding, the Issuer is restricted from

encumbering its property or assets to secure debt, without

the prior written consent of the Trustees. Where the

Trustee’s consent is obtained, the same security (as that

intended for the indebtedness) would be granted to the

Trustee for the bondholders’ benefit. However, this

restriction does not apply to Permitted Security.

The Bonds will be repaid from LAP’s operational cash

flows.

The Bonds are exempt from taxation in Nigeria.

The Bonds have been listed on NSE and FMDQ OTC Plc

trading boards.

GCR has reviewed the bond performance reports from the

joint Trustees (ARM Trustees Limited, FBN Trustees and

Zenith Trustees Limited) and notes that the first coupon

payments on the Series 1 and Series 2 Fixed Rate Bonds,

amounted to N1.9bn and N2.5bn and were paid on due date

of 15 June 2017. The next coupon payment is due on 15

December 2017. The Trustees did not report any breach of

negative pledge or covenants by the Issuer.

Outlook and rating rationale

In view of the challenging operating conditions, the five-

year forecasts provided to GCR in FY16 are no longer

deemed to be attainable, although management is yet to

provide revised projections.

LAP anticipates double digit revenue growth in 2017 which

will be underpinned by increased volumes from further

ramp up at UniCem’s new plant and higher demand from

the individual home builder segment. According to

management, earnings will be enhanced by benefits of

stable pricing, cheaper fuel mix and sustained operating

efficiencies. Overall, LAP’s EBITDA margin is expected

to improve to 29% in FY17 (1H FY17: 23.6%), in line with

historical trend (five-year average: 25.2%). While the

additional capacity will help to curtail the variability in

earnings seen in FY16 going forward, much stronger

capacity rollout will be needed to maintain the Group’s

strong position in its key markets when demand strengthens

in the medium term.

GCR noted that LAP’s operations remain susceptible to

exogenous pressures (including gas and foreign currency

shortages), vagaries of the economy and intense

competitive pressures. GCR has taken note of initiatives

taken by management to support a recovery in earnings,

and will continue to monitor progress going forward.

Cognisance is also taken of LAP’s medium term fuel

flexibility plan, which aims to achieve 50% reliance of

alternative fuels.

Nigeria Corporate Analysis | Public Credit Rating Page 9

According to management, total capex spend will be more

moderate at N27bn in FY17 (FY16: N41.5bn), with the

bulk of the investment relating to the construction of

Ashaka’s coal fired plant. Gearing metrics are anticipated

to have moderated by FY17 with net gearing expected to

trend below 50% and net debt to EBITDA meant to be

managed below 200%. Net interest cover for Nigeria

should rise above 6x in FY17. These targets are deemed to

be attainable if earnings continue to improve and the

planned capital raising activities are completed timeously.

In the interim, liquidity pressure and the significantly

distorted debt maturity profile present a ratings pressure

point. In the interim, GCR has considered LAP’s strong

banking relationships and sizeable credit facilities (over

N60bn limit) available at eight commercial banks,

indicating financial flexibility. The legacy parental support also lends LAP some headroom with respect to funding in

addition to the planned Rights Issue.

Rating considerations for Series 1 and Series 2 Bonds

GCR has considered those factors impacting the general

creditworthiness of Lafarge Africa Plc, in performing its

analysis. Being senior unsecured debt, the Bonds bear the

same probability of default as the Issuer and would reflect

similar recovery prospects to senior unsecured creditors in

the event of a default. As such, the Series 1 and Series 2

Bonds will garner the same long term rating as that

accorded to the Issuer. In light of the above, and given that

the Bonds constitute senior unsecured obligations of the

Issuer, GCR has accorded final national scale ratings of

A+(NG) to the Series 1 bonds and Series 2 bonds

respectively. Accordingly, any change in the Issuer rating

would impact the Bond ratings.

Meaning of the Rating of the Series 1 Bonds and Series 2 Bonds

The ratings accorded to the Series 1 Bonds and Series 2 Bonds

are final, public national scale ratings. National scale credit

ratings are an assessment of credit quality relative to the rating of

the lowest credit risk in a country. This lowest risk will normally,

although not always, be accorded to financial commitments

issued or guaranteed by the relevant sovereign state.

The final, public ratings accorded to the Bonds relate to ultimate

payment of interest and principal (as opposed to timely, akin to

an expected loss rating, which is a function of probability of

default and loss severity). The ratings exclude an assessment of

the Issuer’s ability to pay any (early repayment) penalties.

Being senior unsecured debt, the Bonds reflect similar recovery

prospects to senior unsecured creditors in the event of a default.

As such, the Series 1 and Series 2 Bonds reflect the same long

term rating as that accorded to the Issuer. Should the rating of the

Issuer change, the ratings of the Series 1 Bonds and Series 2

Bonds will also change, but not necessarily in the same quantum.

The suffix code identifies to which country the rating relates;

‘NG’ means Federal Republic of Nigeria. A Rating outlook

indicates the potential direction of a rating over the medium term,

typically a one or two year period.

Nigeria Corporate Analysis | Public Credit Rating Page 10

Lafarge Africa Plc

(Naira in millions except as noted)

Year end: 31 December Lafarge WAPCO Lafarge Africa Plc

Statement of comprehensive income 2012 2013 2014 2015 2016 1H 2017* Turnover 87,965.2 206,072.7 260,810.5 267,234.2 219,714.1 154,839.9 EBITDA 31,331.6 55,662.4 69,475.8 67,285.2 25,804.4 36,606.5 Depreciation (4,900.4) (10,119.1) (15,509.5) (16,148.8) (15,877.5) (10,732.6) Operating income 26,431.2 45,543.4 53,966.3 51,136.4 9,927.0 25,873.9 Net finance charge (5,119.1) (2,748.5) (7,931.9) (8,751.8) (11,828.9) (9,957.8) Forex and reserving - (85.1) (4,307.6) (8,428.8) (22,702.3) 0.0 Business combination expenses - - (1,585.4) (6,047.4) - - Other operating income/(expense) (47.6) 21,995.2 216.7 1,378.5 1,785.4 2,244.3 Net Profit Before Tax 21,264.4 64,705.0 40,358.1 29,286.8 (22,818.8) 18,160.4 Taxation paid (6,552.7) (3,308.3) (6,537.8) (2,123.9) 39,717.5 1,572.0 Net Profit After Tax 14,711.7 61,396.7 33,820.4 27,163.0 16,898.7 19,732.4

Statement of cash flows Cash generated by operations 30,192.2 54,659.8 72,535.6 54,096.2 13,809.9 30,668.6 Utilised to increase working capital (3,615.1) 1,811.0 (3,691.0) 658.6 (2,273.8) (32,949.7) Net interest paid (4,715.9) (2,529.1) (6,775.0) (7,687.2) (11,388.4) (5,055.0) Taxation paid (964.9) (7,519.6) (3,009.1) (3,132.1) (872.8) (1,040.0) Cash flow from operations 20,896.3 46,422.0 59,060.5 43,935.5 (725.1) (8,376.1) Maintenance capex‡ (4,900.4) (7,061.8) (15,509.5) (16,148.8) (15,877.5) (5,769.3) Discretionary cash flow from operations 15,995.9 39,360.2 43,551.1 27,786.7 (16,602.6) (14,145.4) Dividends paid (2,251.2) (40,846.4) (14,955.3) (13,168.3) (1,502.7) (1,624.5) Retained cash flow 13,744.7 (1,486.2) 28,595.8 14,618.4 (18,105.3) (15,769.8) Net expansionary capex (847.8) 0.0 (10,218.2) (43,745.9) (25,651.1) 0.0 Investments and other 0.0 27,347.3 (33,060.0) (4,370.7) 9,862.7 (69,396.7) Proceeds on sale of assets/investments 9.2 400.3 75.6 563.7 373.3 3,157.6

Shares issued 0.0 0.0 (293.9) (163.2) (304.3) 0.0 Cash movement: (increase)/decrease 2,527.5 (12,245.8) 25,672.2 13,814.6 976.8 (8,580.4) Borrowings: increase/(decrease) (15,433.6) (14,015.5) (10,771.5) 19,283.2 32,847.9 90,589.3 Net increase/(decrease) in debt (12,906.1) (26,261.3) 14,900.6 33,097.8 33,824.7 82,009.0

Statement of financial position Ordinary shareholders interest 68,353.4 149,143.8 98,178.5 115,799.5 55,987.8 74,332.9 Outside shareholders interest 0.0 19,520.4 75,204.5 58,803.3 191,401.3 112,965.4 Pref. shares and convertible debentures 0.0 0.0 0.0 0.0 0.0 0.0 Total shareholders' interest 68,353.4 168,664.2 173,383.0 174,602.8 247,389.0 187,298.3 Current debt 4,384.4 17,117.5 5,134.3 12,822.7 59,483.3 191,791.3 Non-current debt 32,921.5 11,160.3 116,001.6 135,465.2 68,046.9 52,858.8 Total interest-bearing debt 37,305.9 28,277.8 121,135.9 148,287.9 127,530.2 244,650.1 Interest-free liabilities 46,283.3 98,823.2 119,230.7 127,243.2 126,008.2 172,923.0 Total liabilities 151,942.7 295,765.2 413,749.6 450,133.9 500,927.4 604,871.4 Property, Plant and Equipment 128,094.9 213,276.4 331,257.2 364,397.3 390,488.5 404,381.5 Investments and other non-current assets 40.0 13,677.1 10,278.2 12,487.8 12,095.3 58,672.2 Cash and cash equivalent 8,892.3 33,896.1 20,330.1 16,493.2 19,265.1 25,110.8 Other current assets 14,915.5 34,915.6 51,884.0 56,755.6 79,078.5 116,706.9 Total assets 151,942.7 295,765.2 413,749.6 450,133.9 500,927.4 604,871.4

Ratios Cash flow: Operating cash flow : total debt (%) 56.0 164.2 48.8 29.6 neg neg Discretionary cash flow : net debt (%) 56.3 n.a 43.2 21.1 neg neg Profitability: Turnover growth (%) 40.7 134.3 26.6 2.5 (17.8) 40.9 Gross profit margin (%) 37.1 32.7 31.8 30.9 18.5 28.7 EBITDA : revenues (%) 35.6 27.0 26.6 25.2 11.7 23.6 Operating profit margin (%) 30.0 22.1 20.7 19.1 4.5 16.7 EBITDA : average total assets (%) 22.1 28.5 21.2 16.3 5.6 13.8 Return on equity (%) 23.6 55.5 27.1 25.4 19.7 60.6 Coverage: Operating income : gross interest (x) 4.8 9.9 4.8 4.8 0.6 2.4 Operating income : net interest (x) 5.2 16.6 6.8 5.8 0.8 2.6 Activity and liquidity: Trading assets turnover (x) (26.1) (189.2) (90.9) (22.8) (5.3) (8.2) Days receivable outstanding (days) 2.1 8.1 11.2 10.1 12.4 17.5 Current ratio (:1) 0.7 1.1 1.0 0.8 0.6 0.4 Capitalisation: Net debt : equity (%) 41.6 n.a 58.1 75.5 43.8 117.2 Total debt : equity (%) 54.6 16.8 69.9 84.9 51.6 130.6 Net debt : EBITDA (%) 90.7 n.a 145.1 195.9 419.6 299.9 Total debt : EBITDA (%) 119.1 50.8 174.4 220.4 494.2 334.2

‡Depreciation used as a proxy for maintenance capex expenditure

*Unaudited six months results to June 2017

Nigeria Corporate Analysis | Public Credit Rating Page 11

This page is intentionally left blank

Nigeria Corporate Analysis | Public Credit Rating Page 12

SALIENT POINTS OF ACCORDED RATINGS

GCR affirms that a.) no part of the rating was influenced by any other business activities of the credit rating agency; b.) the rating was based solely on the merits of the rated entity, security or financial instrument being rated; c.) such rating was an independent evaluation of the risks and merits of the rated entity, security or financial instrument; and d.) The Issuer and Bonds ratings expire in August 2018. Lafarge Africa Plc participated in the rating process via face-to-face management meetings, teleconferences and other written correspondence. Furthermore, the quality of information received was considered adequate and has been independently verified where possible. The credit rating/s has been disclosed to Lafarge Africa Plc with no contestation of the ratings. The information received from Lafarge Africa Plc and other reliable third parties to accord the credit rating included: - the 2016 audited annual financial statements and audited comparative results for the preceding four years, - 2017 budget for Nigerian operations - unaudited management accounts to June 2017, - a completed rating questionnaire containing additional information on Lafarge Africa Plc, - breakdown of facilities available and related counterparties The ratings above were solicited by, or on behalf of, the rated client, and therefore, GCR has been compensated for the provision of the ratings.

ALL GCR CREDIT RATINGS ARE SUBJECT TO CERTAIN LIMITATIONS, TERMS OF USE OF SUCH RATINGS AND DISCLAIMERS. PLEASE READ THESE LIMITATIONS, TERMS OF USE AND DISCLAIMERS BY FOLLOWING THIS LINK:HTTP://GLOBALRATINGS.COM.NG/UNDERSTANDINGRATINGS. IN ADDITION, RATING SCALES AND DEFINITIONS ARE AVAILABLE ON GCR’S PUBLIC WEB SITE AT HTTP://GLOBALRATINGS.COM.NG/RATINGS-INFO. PUBLISHED RATINGS, CRITERIA, AND METHODOLOGIES ARE AVAILABLE FROM THIS SITE AT ALL TIMES. GCR'S CODE OF CONDUCT, CONFIDENTIALITY, CONFLICTS OF INTEREST, COMPLIANCE, AND OTHER RELEVANT POLICIES AND PROCEDURES ARE ALSO AVAILABLE FROM THE UNDERSTANDING RATINGS SECTION OF THIS SITE.

CREDIT RATINGS ISSUED AND RESEARCH PUBLICATIONS PUBLISHED BY GCR, ARE GCR’S OPINIONS, AS AT THE DATE OF ISSUE OR PUBLICATION THEREOF, OF THE RELATIVE FUTURE CREDIT RISK OF ENTITIES, CREDIT COMMITMENTS, OR DEBT OR DEBT-LIKE SECURITIES. GCR DEFINES CREDIT RISK AS THE RISK THAT AN ENTITY MAY NOT MEET ITS CONTRACTUAL AND/OR FINANCIAL OBLIGATIONS AS THEY BECOME DUE. CREDIT RATINGS DO NOT ADDRESS ANY OTHER RISK, INCLUDING BUT NOT LIMITED TO: FRAUD, MARKET LIQUIDITY RISK, MARKET VALUE RISK, OR PRICE VOLATILITY. CREDIT RATINGS AND GCR’S OPINIONS INCLUDED IN GCR’S PUBLICATIONS ARE NOT STATEMENTS OF CURRENT OR HISTORICAL FACT. CREDIT RATINGS AND GCR’S PUBLICATIONS DO NOT CONSTITUTE OR PROVIDE INVESTMENT OR FINANCIAL ADVICE, AND CREDIT RATINGS AND GCR’S PUBLICATIONS ARE NOT AND DO NOT PROVIDE RECOMMENDATIONS TO PURCHASE, SELL OR HOLD PARTICULAR SECURITIES. NEITHER GCR’S CREDIT RATINGS, NOR ITS PUBLICATIONS, COMMENT ON THE SUITABILITY OF AN INVESTMENT FOR ANY PARTICULAR INVESTOR. GCR ISSUES ITS CREDIT RATINGS AND PUBLISHES GCR’S PUBLICATIONS WITH THE EXPECTATION AND UNDERSTANDING THAT EACH INVESTOR WILL MAKE ITS OWN STUDY AND EVALUATION OF EACH SECURITY THAT IS UNDER CONSIDERATION FOR PURCHASE, HOLDING OR SALE. Copyright © 2017 Global Credit Rating Company Limited. THE INFORMATION CONTAINED HEREIN MAY NOT BE COPIED OR OTHERWISE REPRODUCED OR DISCLOSED , IN WHOLE OR IN PART, IN ANY FORM OR MANNER OR BY ANY MEANS WHATSOEVER, BY ANY PERSON WITHOUT GCR’S PRIOR WRITTEN CONSENT. The ratings were solicited by, or on behalf of, the issuer of the instrument in respect of which the rating is issued, and GCR has been compensated for the provision of the ratings. Information sources used to prepare the ratings are set out in each credit rating report and/or rating notification and include the following: parties involved in the ratings and public information. All information used to prepare the ratings is obtained by GCR from sources reasonably believed by it to be accurate and reliable. Although GCR will at all times use its best efforts and practices to ensure that the information it relies on is accurate at the time, GCR does not provide any warranty in respect of, nor is it otherwise responsible for, the accurateness of such information. GCR adopts all reasonable measures to ensure that the information it uses in assigning a credit rating is of sufficient quality and that such information is obtained from sources that GCR, acting reasonably, considers to be reliable, including, when appropriate, independent third-party sources. However, GCR cannot in every instance independently verify or validate information received in the rating process. Under no circumstances shall GCR have any liability to any person or entity for (a) any loss or damage suffered by such person or entity caused by, resulting from, or relating to, any error made by GCR, whether negligently (including gross negligence) or otherwise, or other circumstance or contingency outside the control of GCR or any of its directors, officers, employees or agents in connection with the procurement, collection, compilation, analysis, interpretation, communication, publication or delivery of any such information, or (b) any direct, indirect, special, consequential, compensatory or incidental damages whatsoever (including without limitation, lost profits) suffered by such person or entity, as a result of the use of or inability to use any such information. The ratings, financial reporting analysis, projections, and other observations, if any, constituting part of the information contained herein are, and must be construed solely as, statements of opinion and not statements of fact or recommendations to purchase, sell or hold any securities. Each user of the information contained herein must make its own study and evaluation of each security it may consider purchasing, holding or selling. NO WARRANTY, EXPRESS OR IMPLIED, AS TO THE ACCURACY, TIMELINESS, COMPLETENESS, MERCHANTABILITY OR FITNESS FOR ANY PARTICULAR PURPOSE OF ANY SUCH RATING OR OTHER OPINION OR INFORMATION IS GIVEN OR MADE BY GCR IN ANY FORM OR MANNER WHATSOEVER.


Recommended