20
Lafarge Africa Plc Quarter 1 2017 Results Analyst Presentation: April 26 th , 2017 Lekki-Ikoyi Bridge, Lagos Nigeria

Lafarge Africa Plc
Quarter 1 2017 Results
Analyst Presentation: April 26th , 2017 Lekki-Ikoyi Bridge, Lagos Nigeria

Lagos , Nigeria
Overview of Q1 2017 Results
Michel Puchercos, Chief Executive Officer

Building on accelerated earnings momentum
3
Improvement of the domestic cement demand compared to last quarter (+6% q-o-q), thanks to favorable seasonality.
Overall contraction in cement consumption in Q1 vs. LY by -18%*
Cement prices increased by 9% in Q1 to account for cost inflation & devaluation impacts
Robust financial performance, largely driven by stable pricing environment & fuel flexibility
Operating EBITDA of N17.7 Billion, +2.5x higher than Q1 2016
Operating EBITDA margin of 21.8%, up 12% versus LY
Nigeria EBITDA margin of 30.2%, up 16.8% from Q1 2016
Turnaround plan in Nigeria continues to deliver solid operational performance
Stable plant operations, with Kiln reliability of approx. 90%
Fuel flexibility in place to compensate for gas supply shortages
Ewekoro I achieved record alternative fuel substitution performance of 46% YTD
Mfamosing new line ramping up, through a learning curve
Unaudited Quarter 1 2017 Analyst Presentation
*Lafarge Africa Internal Estimates

Solidifying our Turnaround Plan to deliver 2017
4
Re-organisation
Pricing
Key Indicators
Volume &
Market share
Industrial
Performance
Fuel Flexibility
FX impact on
Cost
Light Asset
Model
Turnaround Enablers Impact compared
to Q1 LY
+N25 Billion
Gained market
share +1%
~90% reliability Stable plant operations, with high reliability factors across all
plants
In spite of lower gas availability, all plants operated smoothly,
thanks to fuel flexibility achieved
Sale of Elephant Cement House Lagos, proceeds invested
Higher reliance on coal & AF reduced correlation to the dollar
SAP implementation
+1.7 Billion
-3% of costs vs.
end of Dec 2016
N3.1Billion
On track
Price adjustment of Sept. 2016, followed by 2 similar
adjustments in the quarter compensated for cost inflation
Route to market initiative on track
Logistics improvement plan, truck rotation & development of
fleet
Unaudited Quarter 1 2017 Analyst Presentation
Financial Results & Performance Analysis
Senate, Abuja Bruno Bayet, Chief Financial Officer

Key Financial Figures for Q1 2017
6 Unaudited Quarter 1 2017 Analyst Presentation
Q1 2017
2016 2017 Variance
NGN Million
Net Sales 52,421 81,311 55%
Operating EBITDA 5,065 17,731 250%
Operating EBITDA margin 9.7% 21.8% 12.1pps
EBIT (180) 13,394
EBIT Margin -0.3% 16.5% 16.8pps
Before tax Profit (2,216) 9,446
After tax Profit (1,873) 5,161
Earnings per Share (in Kobo) (19) 92
Operating Cash flow 10,981 7,709
Net Debt 79,556 106,981
Capex 11,163 9,093 -18.5%
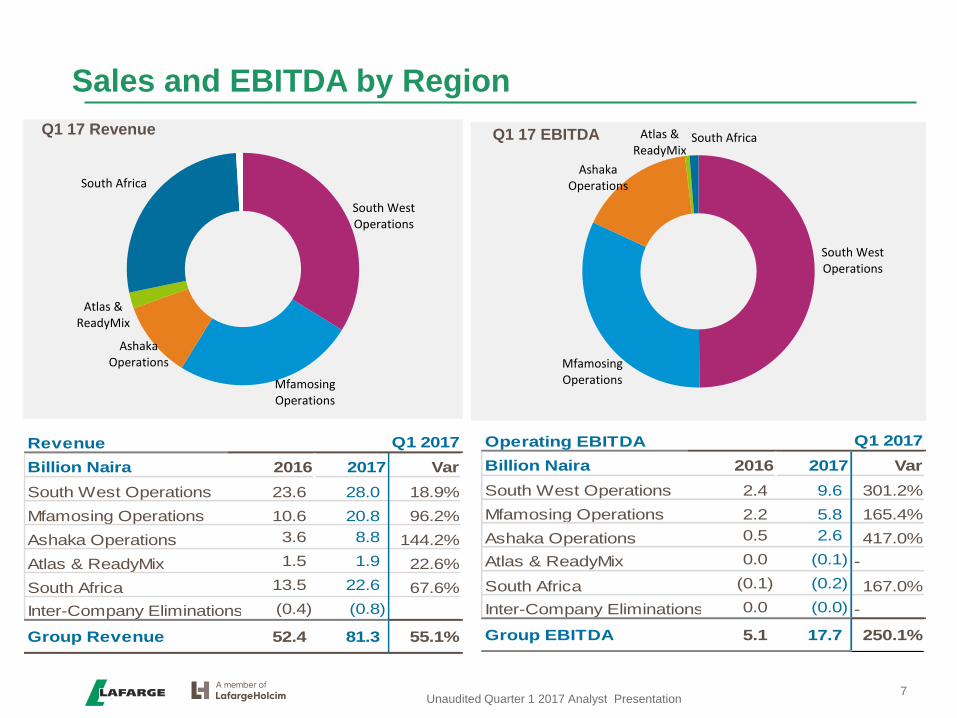
Sales and EBITDA by Region
7
South West Operations
Mfamosing Operations
Ashaka Operations
Atlas & ReadyMix
South Africa Q1 17 EBITDA
Revenue Q1 2017
Billion Naira 2016 2017 Var
South West Operations 23.6 28.0 18.9%
Mfamosing Operations 10.6 20.8 96.2%
Ashaka Operations 3.6 8.8 144.2%
Atlas & ReadyMix 1.5 1.9 22.6%
South Africa 13.5 22.6 67.6%
Inter-Company Eliminations (0.4) (0.8)
Group Revenue 52.4 81.3 55.1%
South West Operations
Mfamosing Operations
Ashaka Operations
Atlas & ReadyMix
South Africa
Q1 17 Revenue
Operating EBITDA Q1 2017
Billion Naira 2016 2017 Var
South West Operations 2.4 9.6 301.2%
Mfamosing Operations 2.2 5.8 165.4%
Ashaka Operations 0.5 2.6 417.0%
Atlas & ReadyMix 0.0 (0.1) -
South Africa (0.1) (0.2) 167.0%
Inter-Company Eliminations 0.0 (0.0) -
Group EBITDA 5.1 17.7 250.1%
Unaudited Quarter 1 2017 Analyst Presentation

Nigeria Operations
8
Lafarge Africa Staff
Slight improvement in domestic cement demand compared to Q4 (+6%), but impacted by recession
Overall sales up 51.4% to N59.4 Billion, from strong contribution across all plants
Strong EBITDA contribution in Nigeria operations, thanks to stable operations and fuel flexibility
ReadyMix Concrete operations impacted by macro-economic slow down, major construction projects were delayed due to shortage of funds
A 2nd ReadyMix plant commissioned in Abuja (in November 2016), to support the demand in the region has stabilized well
Unaudited Quarter 1 2017 Analyst Presentation
Q1 2017
NGN Million 2016 2017 Variance
Volumes
Cement (kt) 1,663 1,373 -17.5%
ReadyMix (km3) 49 49 0.0%
Net Sales 39,297 59,482 51.4%
Operating EBITDA 5,134 17,939 249%
Operating EBITDA margin 13.1% 30.2% 17.1pps
Before tax Profit (735) 10,714
After tax Profit (739) 6,179

Nigeria Operating EBITDA Q1 2017 vs. LY
9
17,9
2,5
4,0 1,7 0,9
1,9
25,6
5,2
5,1
EBIT
DA
- Q
1-2
01
6
Vo
lum
e Ef
fect
Pri
ce E
ffec
t
Fre
igh
t
Ener
gy
Raw
Mat
eria
ls &
Oth
ers
Fixe
d C
ost
s
Fx E
ffec
t
EBIT
DA
- Q
1-2
01
7
In N’ B
Unaudited Quarter 1 2017 Analyst Presentation

South Africa Operations
10
Lafarge Africa Staff
South African economy shrunk by 0.3% q-o-q in Q4 2016
Cement prices are stabilizing after 3 competitors applied price increase
South African operations fully migrated to SAP in the quarter, systems are being stabilized but had an impact on Q1 2017
Aggregate & Concrete operations slowed from systems stabilization challenges and unseasonably high rainfall in February
Challenges at the packing plant, expected to be stabilized in April when the new packing line will be commissioned
Q1 2017
NGN Million 2016 2017 Variance
Net Sales 13,504 22,626 68%
Operating EBITDA (78) (207)
Operating EBITDA margin -0.6% -0.9% -0.3pps
Before tax Profit (1,481) (1,268)
After tax Profit (1,103) (1,020)
Unaudited Quarter 1 2017 Analyst Presentation
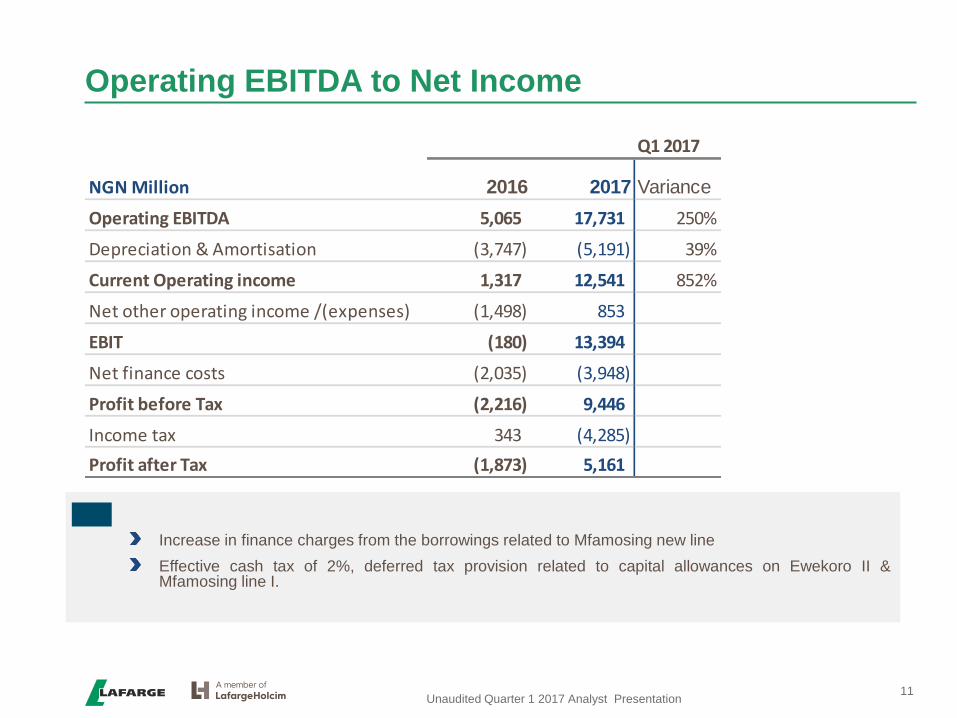
Operating EBITDA to Net Income
11
Q1 2017
NGN Million 2016 2017 Variance
Operating EBITDA 5,065 17,731 250%
Depreciation & Amortisation (3,747) (5,191) 39%
Current Operating income 1,317 12,541 852%
Net other operating income /(expenses) (1,498) 853
EBIT (180) 13,394
Net finance costs (2,035) (3,948)
Profit before Tax (2,216) 9,446
Income tax 343 (4,285)
Profit after Tax (1,873) 5,161
Unaudited Quarter 1 2017 Analyst Presentation
Increase in finance charges from the borrowings related to Mfamosing new line
Effective cash tax of 2%, deferred tax provision related to capital allowances on Ewekoro II & Mfamosing line I.

Net Financial Debt Dec 2016 to March 2017
12
Net Debt (N’B)
Unaudited Quarter 1 2017 Analyst Presentation
107,0
7,7 1,8 9,1
1,3
0,4
108,3
Net
De
bt
- D
ec 2
01
6
Cas
h F
low
fro
m O
pe
rati
on
s
Cap
ital
Exp
end
itu
re
Dis
po
sal o
f as
sets
( N
et
po
siti
on
)
Net
bo
rro
win
gs
Oth
ers
Net
De
bt
- M
arch
20
17

Outlook
Abuja Senate Michel Puchercos, Chief Executive Officer

Outlook
14
Market demand to gradually recover in second semester 2017, driven largely by incremental government revenue, spending especially on infrastructure and improved confidence in the private sector
Nigeria cement market growth expectation remain between 0% to 2%
South Africa cement market expected to slow down, given the macroeconomic context
Pricing environment in Nigeria & South Africa expected to remain stable, on account of economic realities
Build on turnaround plan in Nigeria to improve cost structure
Commercial transformation & Route-to-market on track
Logistics performance improvement on track
Increase local sourcing to reduce correlation to FX
Sustain fuel flexibility achievement
Cost management measures in place
South Africa operations embark on cost reduction measures to counter the economic situation
Resolution of challenges linked to SAP migration to be completed
New packing plant to be commissioned in South Africa
Unaudited Quarter 1 2017 Analyst Presentation

Ewekoro Plant
Appendix

Q1 Sales volumes by Business Units
16
2017 2016 Variation
Cement - tons k
Wapco 666 1,017 -35%
Ashaka 215 162 32%
Unicem 511 498 3%
IC Elimination (19) (14) -36%
Nigeria Operations 1,373 1663 -17%
Ready-Mix - m3 k
Nigeria 19 49 -61%
Aggregates - tons k
Nigeria 0 62 -100%
Unaudited Quarter 1 2017 Analyst Presentation
Q1 2017
2016 2017 Variance
Volumes
Cement (kt) -31.0%
ReadyMix (km3) -7.6%
Aggregate (kt) -2.1%
Fly Ash -16.0%
South Africa Operations

Condensed Statement of Financial Position
17 Unaudited Quarter 1 2017 Analyst Presentation
NGN Million 2017 2016 2017 2016
Property, plant and equipment 404,781 390,489 Total Equity 263,384 248,953
Intangible assets 1,955 1,563
Investment in Joint venture 89 90 Borrowings 74,894 68,047
Available for sale financial assets 10 6 Provisions 5,739 2,448
Other assets 801 4,183 Deferred revenue 717 1,555
Deferred tax assets 2,561 7,641 Employee benefits obligation 2,229 3,780
Restricted cash - 176 Other long-term liabilities 1,919 1,721
Non Current Assets 410,196 404,147 Non Current Liabilities 85,498 77,551
Inventories 50,578 44,531 Trade and other payables 89,919 100,808
Trade and other receivables 24,553 25,801 Borrowings 30,878 36,488
Other assets 3,522 2,510 Provisions & Others 4,243 2,236
Other financial assets 212 6,236 Dividends 13,459 13,459
Cash and bank balances 34,700 19,265 Bank Overdraft 36,378 22,995
Total Current Assets 113,564 98,344 Total Current Liabilities 174,878 175,987
Total Assets 523,760 502,491 Total Equitiy & Liabilities 523,760 502,491

Condensed Cash Flow Statement
18 Unaudited Quarter 1 2017 Analyst Presentation
NGN Million Mar-17 Dec-16
Operating EBITDA 17,731 17,265
Total other non cash items 3,055 (3,455)
Change in net working capital (13,078) 3,489
7,709 17,299
Income tax paid - (873)
Employee benefits paid - (5,762)
Cash flow from operating activities 7,709 10,663
Capital Expenditure (9,093) (41,529)
Investment income 39 3,676
Proceed from disposal of assets 1,792 373
Cash flow from Investing activities (7,261) (37,479)
Cash flow from financing activities 2,075 6,178
Net (decrease) / increase in cash and equivalents 2,523 (20,638)
Net foreign exchange difference (471) 3,749
Cash and cash equivalents at 1 January (3,730) 13,159
Cash and cash equivalents at end of period (1,679) (3,730)

Disclaimer
19
This presentation is based on Lafarge Africa Plc’s unaudited financial results for the 1th quarter ended March 2017 consistent with IFRS reporting standards and these figures are for illustrative purposes. Lafarge Africa Plc (“Lafarge Africa” or the “Company”) has obtained information in this presentation from sources it believes to be reliable. Although Lafarge Africa has taken all reasonable care to ensure that the information herein is correct and accurate, Lafarge Africa makes no representation or warranty, express or implied, as to the accuracy, completeness or correctness of such information. Furthermore, Lafarge Africa makes no representation or warranty, express or implied, that its future operating, financial or other results will be consistent with results implied, directly or indirectly, by information contained herein or with Lafarge Africa’s past operating, financial or other results. Any information herein is as of the date of this presentation and may change without notice. Lafarge Africa undertakes no obligation to update the information in this presentation. In addition, some of the information in this presentation may be condensed or incomplete, and this presentation may not contain all material information in respect of the Company. This presentation also contains “forward-looking statements” that relate to, among other things, Lafarge Africa’s plans, objectives, goals, strategies, future operations and performance. Such forward-looking statements may be characterized by words such as “estimates,” “aims,” “expects,” “projects,” “believes,” “intends,” “plans,” “may,” “will” and “should” and similar expressions but are not the exclusive means of identifying such statements. Such forward-looking statements involve known and unknown risks, uncertainties and other important factors that could cause Lafarge Africa’s operating, financial or other results to be materially different from the operating, financial or other results expressed or implied by such statements. These factors should be considered carefully and undue reliance should not be placed on the forward-looking statements. For additional information with respect to certain risks or factors, reference should be made to Lafarge Africa’s continuous disclosure materials filed from time to time with the Nigerian Stock Exchange and other relevant regulatory authorities. Although Lafarge Africa believes the basis for such forward-looking statements to be fair and reasonable, Lafarge Africa makes no representation or warranty, express or implied, as to the fairness or reasonableness of such forward-looking statements. Furthermore, Lafarge Africa makes no representation or warranty, express or implied, that the operating, financial or other results anticipated by such forward looking statements will be achieved. Such forward-looking statements represent, in each case, only one of many possible scenarios and should not be viewed as the most likely or standard scenario. Lafarge Africa undertakes no obligation to update the forward-looking statements in this presentation.
Not for distribution directly or indirectly into the United States, Canada, Australia or Japan or to US persons.
Unaudited Quarter 1 2017 Analyst Presentation


