51
LAKE-EFFECT SNOW Greg Byrd Cooperative Program for Operational Meteorology, Education and Training
| Date post: | 17-Dec-2015 |
| Category: |
Documents |
| Upload: | virgil-anthony-randall |
| View: | 217 times |
| Download: | 1 times |

LAKE-EFFECT SNOW
Greg Byrd
Cooperative Program for Operational Meteorology, Education and Training
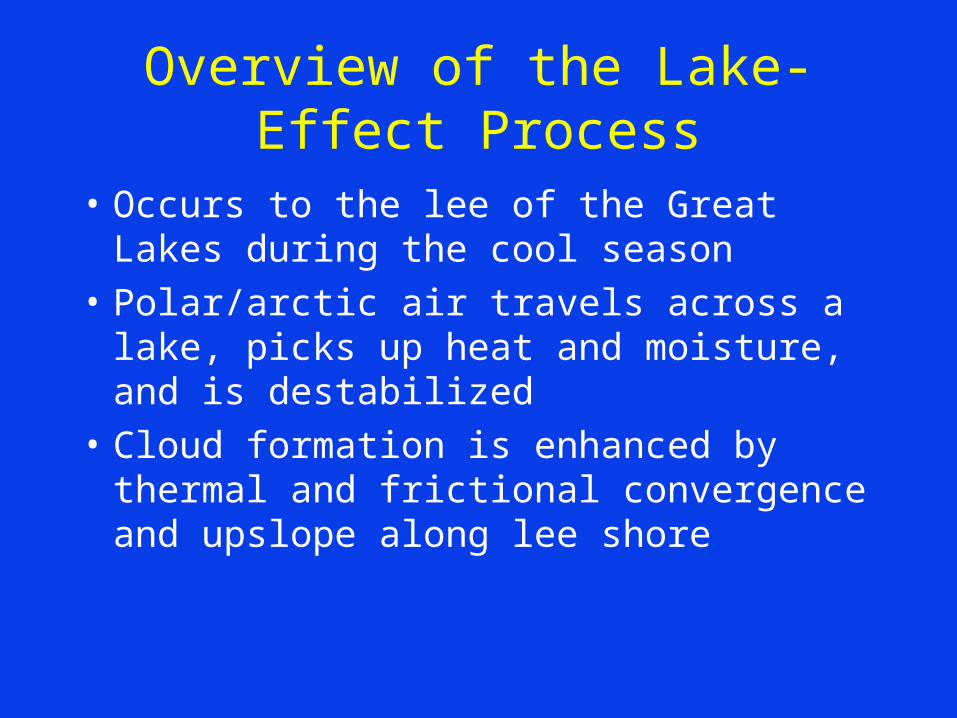
Overview of the Lake-Effect Process
• Occurs to the lee of the Great Lakes during the cool season
• Polar/arctic air travels across a lake, picks up heat and moisture, and is destabilized
• Cloud formation is enhanced by thermal and frictional convergence and upslope along lee shore

Lake-Effect-type Phenomena in Other Regions
• Lake-effect (Great Salt Lake)
• Lake-effect (Finger Lakes, NY)
• Bay-effect (Chesapeake, Delaware, Massachusetts Bays)
• Ocean-effect (Gulf Stream, Sea of Japan)

Lake-Effect vs. Lake-Enhanced
• Lake-effect: precipitation which results from cold polar air flowing over warm lake water after passage of a synoptic cyclone
• Lake-enhanced: the additional precipitation resulting from a boundary layer fetch over a lake during a synoptic cyclone (e.g., overunning) event

LAKE-EFFECT
from Eichenlaub (1979)
Occurs during the unstable season when mean lake temperatures exceed mean land temperatures
Mean annual snowfall exceeds 100 inches in the snowbelts to the lee of the lakes, and exceeds 200 inches in the Tug Hill Plateau in New York, to the lee of Lake Ontario and on the Keweenaw Peninsula of northern Michigan, to the lee of Lake Superior.

Notable Snowfall Statistics
• 5-10 in (13-25 cm) per hour documented
• 68 in (172 cm) at Adams, NY on 1/9/76
• 102 in (259 cm) at Oswego, NY 1/27-31/66
• 149 in (378 cm) at Hooker, NY in 1/77
• 466.9 in (1186 cm) at Hooker, NY, 1976-77

Conceptual Model of Lake-Effect
Heat and moisture from lake + frictional convergence + upslope flow = clouds and lake-effect precipitation

Formation Regions
from LaDue (1996)
Downwind of concave coastline, bays, etc.

Ingredients Determining Lake-EffectCharacteristics
• Instability• Fetch• Wind shear• Upstream moisture• Upstream lakes• Synoptic (large)-scale forcing• Orography/topography• Snow/ice cover on the lake

Instability
• Depth of instability: relates to depth of mixed layer. Difficult to get heavy snow if depth of mixed layer < 1.0-1.5 km
• Degree of instability: Tlake-T850>13 C gives absolute instability/vigorous heat and moisture transport (10 C/synoptic forcing)

from Reinking et al. (1993)
Intense single band deep, but marginal instability; winds aligned with long axis of lake.
Weak multiple bands shallow, but strong instability; winds normal to long axis of lake.

Fetch
• Distance air travels over water--relates to wind direction (850 mb)
• Small changes in wind direction can significantly change the fetch e.g., Lake Erie: 250 deg wind--225 mi fetch 230 deg wind-- 80 mi fetch
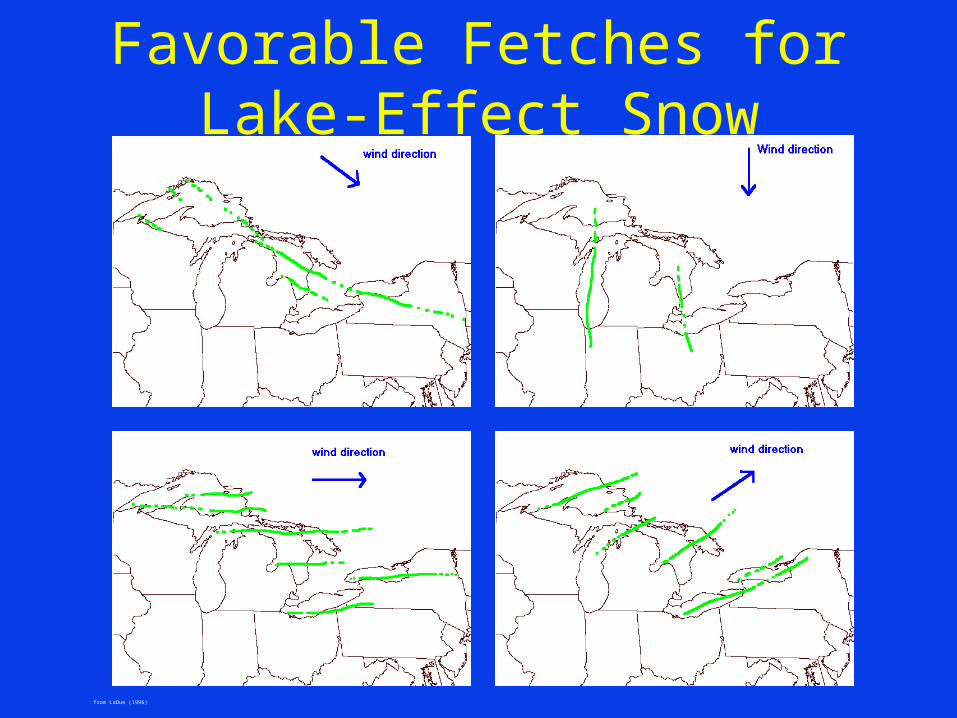
Favorable Fetches for Lake-Effect Snow
from LaDue (1996)

Wind Shear
• Directional turning: significantly impacts charactersfc-700 mb dir chg character 0-30 deg strong, well organized bands 30-60 degweaker bands >60 deg
nothing/poss. flurries
• Wind speed: strong winds may carry bands far inland; but bands may be “sheared off” if wind is too strong

Upstream Moisture
• Impacts precipitation potential
• Low RH: difficult to get condensation, clouds, and precipitation
• High RH: more precipitation

Upstream Lakes
• Impact snowfall to the lee of downwind lakes, e.g.,
In northwest flow, Lake Huron snowbands re-form/intensify over
Lake Ontario and Lake Erie.
• Upstream lakes may not always bring an increase in snowfall to downwind lakes!
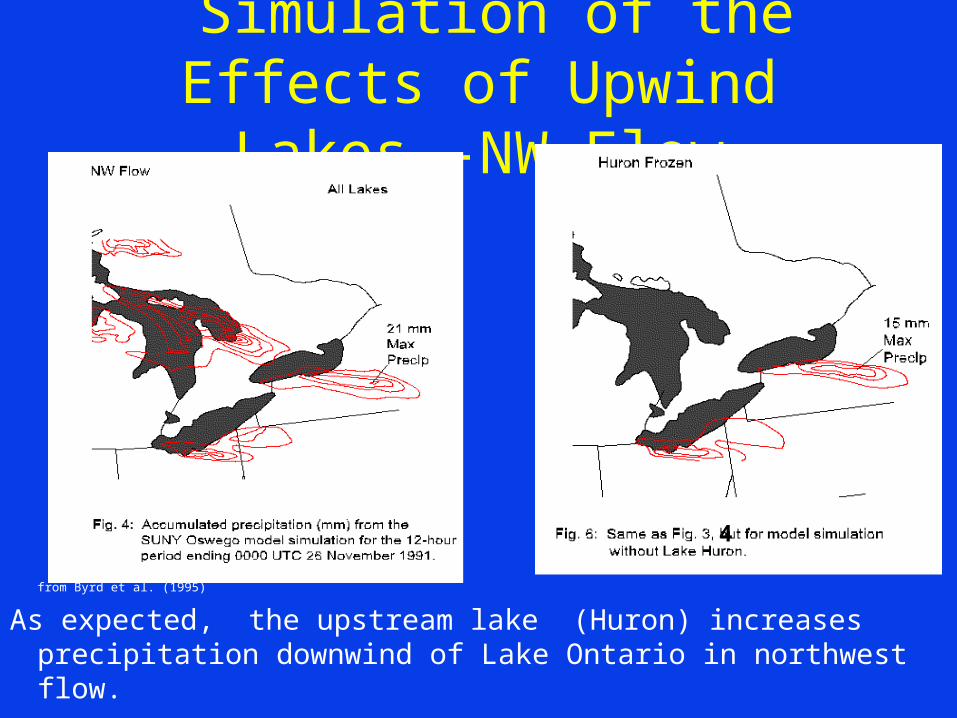
Simulation of the Effects of Upwind Lakes--NW Flow
from Byrd et al. (1995)
As expected, the upstream lake (Huron) increases precipitation downwind of Lake Ontario in northwest flow.
4

Simulation of the Effects of Upwind Lakes--West Flow Case
from Byrd et al. (1995)
Precipitation downwind of Lake Ontario actually increases when upwind lakes are frozen.

Synoptic-Scale Forcing
• Cyclonic vorticity advection aloft may enhance lake-effect by lifting the capping inversion
• Cold advection may enhance lake-effect by increasing the instability

Favorable Synoptic Setting
Niziol (1987)
Sfc-850: Broad WSW trof extension from parent low over Maritimes.
500: Closed low south of James Bay; Deep (>3 km) layer of instability.
Result is prolonged, unidirectional fetch over long axes of Erie, Ontario.

Orography/Topography
• Lake-effect increases with elevation to the lee of the lakes (e.g., Tug Hill Plateau)
• Annual snowfall increases by 8-12 inches per 100 ft increase in elevation

Snow/Ice Cover on the Great Lakes
• Diminishes or ends the lake-effect season
• Lake Erie season often ends late January or early February
• Lake Ontario season continues into March as it doesn’t freeze completely
• A frozen lake doesn’t preclude a significant lake-effect event

Types of Lake-Effect Snowbands
• Single Bands
• Multiple Bands
• Multiple-Lake Bands

Single Band Development• Absolutely unstable lapse rate (Tlake-T850>13C) =>
vigorous vertical transport of heat/moisture• Cu and precipitation formation release latent heat. This is
significant for warm (T>-10C) cases• Sensible and latent heating warm the air, causing meso-low
formation. The deeper the clouds, the stronger the low (warm core)
• Horizontal thermal convergence into the low below cloud base and diffluence aloft leads to strong mesoscale ascent within the snowband

Intense single snowbands exhibit strong confluence in the lower part of the mixed layer and diffluence near the top of the mixed layer.

Single Bands (cont.)
The Role of Frictional Convergence e.g. lake effect snowbands are much more likely to occur along the south shore of Lake Ontario

Single Bands (cont.) Thermal
Convergence
The warm core of the snowband is stretched out over land by the prevailing synoptic wind. Pronounced convergence occurs near the edge of the elongated band, with the strongest pressure gradient on the south side of the band.
from LaDue (1996)

Multiple Snowbands (1-20 km wide)
from NWS Marquette (1996)
• Weaker than single bands,shallower mixed layer
• Horizontal roll convection
• Occur when mean boundary layer wind is more normal to the long axis of the lake
• Little thermodynamic difference with environment
• Oriented parallel to the mean boundary layer wind direction

Multiple-Lake Bands
May be single or multiple, commonly initiate off Lake Huron/Georgian Bay in northwest flow and re-intensify over the lower lakes (Erie, Ontario).

Satellite Applications
Data from different GOES channels can be used in combination with other data sources for diagnostic studies and nowcasting/short-term forecasting applications.

Water Vapor Imagery
Water vapor (6.7 micron) imagery may be used to infer large scale flow patterns and track important features such as upper-level short waves

VIS and IR Imagery
The IR (10.7 micron) imagery shows the higher, colder cloud tops resulting from forcing due to the upper level trough, and also shows where lake-effect convection may be occurring. Visible imagery can readily depict lake-effect snowbands during daylight hours.
VISIR

3.9 micron imagery
During the day, ice crystal clouds are poorer reflectors than clouds composed of water droplets. Therefore, ice clouds appear darker, and liquid water clouds appear brighter. The location where clouds become glaciated or anvils are observed is an area where heavy snowfall may be occurring.

Reflected Energy Product
• Differencing the 10.7 and daytime 3.9 micron radiances gives a reflected energy product that more clearly distinguishes ice and liquid water clouds. (Caution: bare ground may be difficult to distinguish from low water clouds, and snow cover may appear similar to thin ice clouds.)

IR Cloud Top Temperatures
The 10.7 micron cloud top temperatures can be used to infer lake-effect intensity. Temperatures colder than -15 C imply efficient precipitation production, and the coldest cloud tops infer areas of relatively deep convection.

Distinguishing Snow Cover
Snow cover (outlined in yellow) shows up as white ground in the visible, but very dark in the reflected energy product.
Reflected Energy Visible

Distinguishing Ice Clouds
Opaque ice clouds (outlined in yellow) appear bright in the visible and dark in the 3.9 micron and reflected energy products. The existence of cold IR cold cloud tops confirms the existence of ice clouds.
RE Product VIS IR

Distinguishing Open Water
Open water (outlined in yellow) appears dark in the visible, relatively warm in the IR, and poorly reflective in the 3.9 channel imagery.
3.9 IR VIS

Distinguishing Liquid Water Clouds
Liquid water clouds (outlined in yellow) appear bright in the visible and are highly reflective in both the 3.9 channel and reflected product imagery.
RE Product VIS
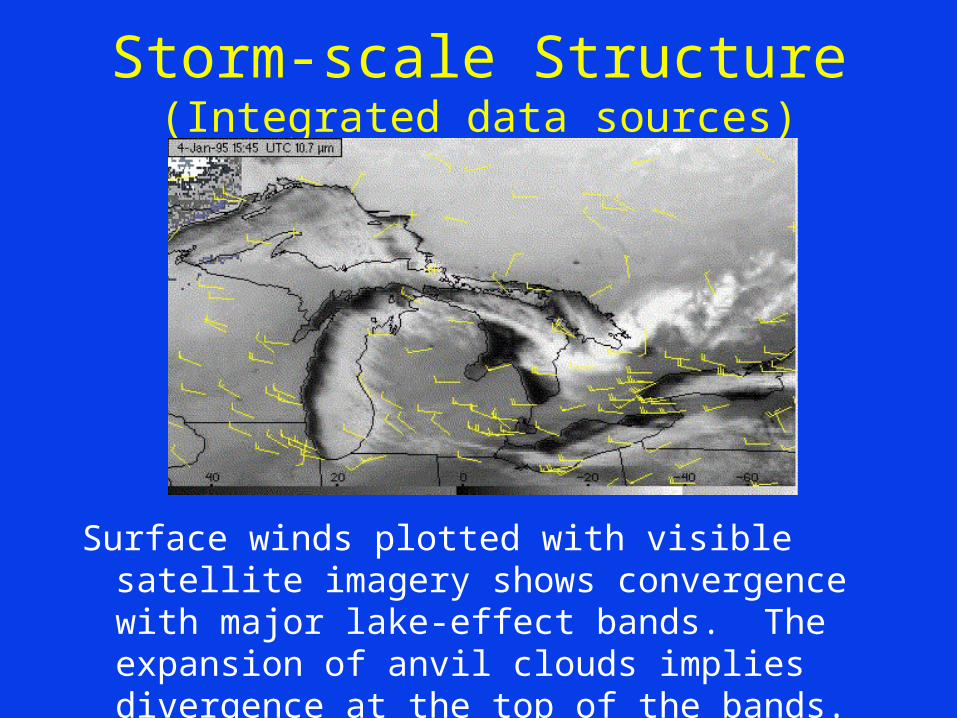
Storm-scale Structure(Integrated data sources)
Surface winds plotted with visible satellite imagery shows convergence with major lake-effect bands. The expansion of anvil clouds implies divergence at the top of the bands.

Storm-scale Structure (cont.)
At the east end of Lake Ontario, the 3.9 micron data shows darkness indicating ice crystal clouds, where the 10.7 micron imagery indicates cloud tops <-30 C. Doppler radar shows divergence where the satellite shows glaciated cloud tops.

IR satellite cloud top temperatures may be correlated with radar reflectivities and surface obs to infer snowfall intensity. The IR data is especially helpful over regions lacking adequate radar coverage.

FORECASTING LAKE-EFFECT
Lake-effect snowstorms are difficult to observe and forecast for the following reasons:
• They are shallow systems (depth often < 3 km); andthe lowest elevation radar scans overshoot the tops.
• The onset, intensity, orientation, and exact location are very sensitive to wind shear/direction and thermal stratification in the lower troposphere.
• Lake-effect difficult to distinguish from orographic influences in some locations (e.g., Gt. Salt Lake)
• Conventional rawindsondes measure profiles at times and locations which are not optimum for monitoringthe atmosphere over the lakes.
• Operational models do not have sufficient resolution
to resolve the scales of lake-effect snowbands.

Lake-Effect Decision Tree from Niziol (1987) 1) Is Tlake - T 850 13 deg C or more? YES
NO Lake-effect not likely. 2) Is the direction in the b.l. and 850 mb between: a) Lake Erie...230 to 340 deg?
b) Lake Ontario....230 to 80 deg? YESNO Lake-effect not likely over W. and Central NY.
3) Is the directional shear between b.l. and 700 mb <30 deg? YESNO Is the shear between 30-60 deg? NO
YESInstability exists, but shear detrimental to formation. Bands spread out, are less intense and may be cut off.
4) Lake-effect snow likely. PVA will enhance snowfall, esp. in SW flow. Inversion height/strength limits snowfall rate. Large fetches and instability will allow snowfall >1 in/hr. Locator charts will pinpoint area.
5) Lake-effect snow possible. Directional shear makes location difficult to pinpoint and will limt intensity. Inversion height/strength limits snowfall. PVA will enhance activity. Locator chart only gives ballpark estimate of location.

Use of Numerical Models
Current operational models do not
adequately resolve lake-effect.
Eta precip fcst

Higher Resolution Mesoscale Models
• Higher resolution models (5-15 km grid spacing) will resolve some lake-effect circulations
• Proper initialization and parameterization are major challenges
• Initial results show considerable promise
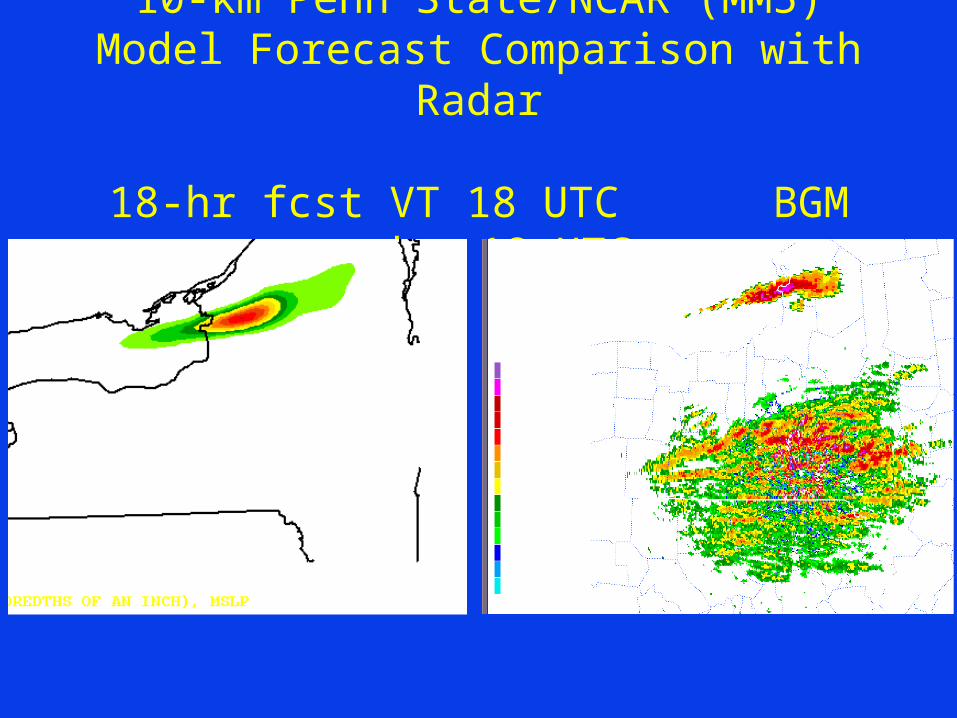
10-km Penn State/NCAR (MM5) Model Forecast Comparison with Radar
18-hr fcst VT 18 UTC BGM radar 18 UTC
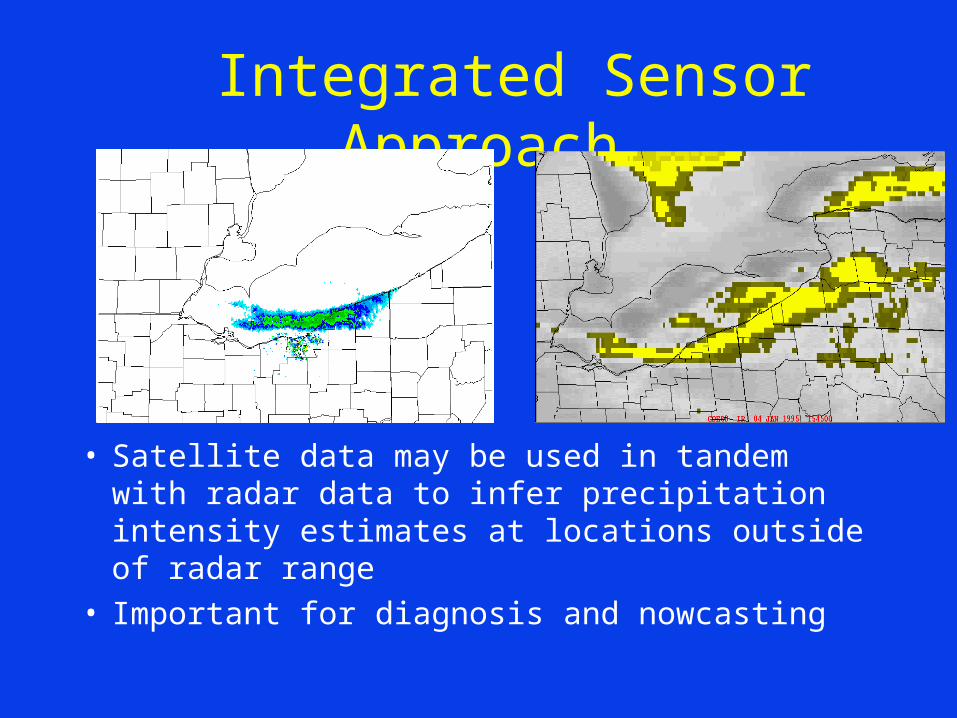
Integrated Sensor Approach
• Satellite data may be used in tandem with radar data to infer precipitation intensity estimates at locations outside of radar range
• Important for diagnosis and nowcasting

BUFKIT AUTOMATED GUIDANCE PACKAGE
Guidance product from NWS Buffalo which incorporates hourly model sounding data

Concluding Remarks
• Lake-effect processes are fairly well understood, but forecasting remains a challenge
• New observing systems (e.g., WSR-88D, GOES) and mesoscale models (e.g., MM5) will greatly enhance the ability to forecast lake-effect

References
Byrd, G. P. , R. A. Anstett, J. E. Heim, and D. M. Usinski, 1991: Mobile sounding observations of lake-effect snowbands in western and central New York. Mon. Wea. Rev., 119, 2323-2332.
Byrd, G. P. and R. S. Penc, 1992: The Lake Ontario snow event of 11-14 January 1990. Proc. Fifth Conf. on Mesoscale Processes, Atlanta, GA, Amer. Meteor. Soc, J59-J66.
Byrd, G. P., D.E. Bikos, D.L. Schleede, and R.J. Ballentine, 1995: The influence of upwind lakes on snowfall to the lee of Lake Ontario. Preprints, 14th Conf. on Weather Analysis and Forecasting, Dallas, TX, Amer. Meteor. Soc., 204-206.
Eichenlaub, V. L., 1979: Weather and Climate of the Great Lakes Region, University of Notre Dame Press, 335 pp.
Kelly, R. D., 1984: Horizontal roll and boundary layer interrelationships observed over Lake Michigan. J. Atmos. Sci., 41, 1816-1826.
LaDue, J., 1996: COMET course notes and satellite meteorology modules.
Niziol, T. A., 1987: Operational forecasting of lake-effect snow in western and central New York. Wea. Forecasting, 1, 311-321.
Niziol, T.A., W.R. Snyder, and J. S. Waldstreicher, 1995: Winter weather forecasting throughout the eastern United States. Part IV: Lake effect snow. Wea Forecasting, 10, 61-77.
NWS/Buffalo, various forecast products.
NWS/Marquette, 1996: Web homepage.
Reinking, R. et al., 1993: Lake Ontario winter storms (LOWS) project final report. NOAA Tech. Memo. ERL WPL-216, 147 pp.


