109
LAKE MACQUARIE WATERWAY FLOOD RISK MANAGEMENT STUDY and PLAN LAKE MACQUARIE CITY COUNCIL JUNE 2012

LAKE MACQUARIE WATERWAY
FLOOD RISK MANAGEMENT
STUDY and PLAN
LAKE MACQUARIE CITY COUNCIL
JUNE 2012
Level 2, 160 Clarence Street Sydney, NSW, 2000 Tel: 9299 2855 Fax: 9262 6208 Email: [email protected] Web: www.wmawater.com.au
LAKE MACQUARIE WATERWAY FLOOD RISK MANAGEMENT STUDY AND PLAN
JUNE, 2012
Project
Lake Macquarie Waterway Flood Risk Management
Study and Plan
Project Number 29076
Client Lake Macquarie City Council
Client’s Representative Greg D Jones Greg Giles
Authors Richard Dewar
Prepared by
Date 26 June 2012
Verified by
Revision Description Date
1 1st Draft for Review June 2011
2 2nd
Draft 15 August 2011
3 3rd
Draft 9 September 2011
4 Public Exhibition 14 October 2011
5 Final Draft 24th January 2012
6 FINAL 26 June 2012

LAKE MACQUARIE WATERWAY FLOOD RISK MANAGEMENT STUDY AND PLAN
TABLE OF CONTENTS
PAGE
1. FOREWORD .............................................................................................................. 1
2. LAKE MACQUARIE WATERWAY FLOOD RISK MANAGEMENT PLAN ................. 2
2.1. Introduction ................................................................................................. 2
2.2. Risk Management Measures Considered ................................................... 2
2.3. Foreshore Risk Management Measures in Plan ......................................... 6
3. INTRODUCTION ........................................................................................................ 9
3.1. Background ................................................................................................ 9
3.2. Objectives ................................................................................................. 10
3.3. Floodplain Risk Management Process ...................................................... 11
3.4. History of Flooding .................................................................................... 11
3.5. Causes of Flooding ................................................................................... 12
3.6. Flood Planning Levels .............................................................................. 12
3.6.1. Year 2011 Design Flood Levels ................................................................ 12
3.6.2. Year 2050 and Year 2100 Design Flood Levels ........................................ 17
3.6.3. 0.5 m Freeboard ....................................................................................... 18
3.7. Council’s Flood Policy ............................................................................... 19
3.7.1. Flood Policy .............................................................................................. 19
3.7.2. Related Issues .......................................................................................... 19
3.8. Previous Studies ....................................................................................... 20
3.8.1. Lake Macquarie Waterway Flood Study 2012 (Reference 6) .................... 20
3.8.2. Lake Macquarie Floodplain Risk Management Study and Plan - 2000
(References 1 and 2) ............................................................................. 21
3.8.3. Lake Macquarie Adaptive Response of Estuarine Shores to Sea Level Rise
– 2010 (Reference 9) ............................................................................. 22
4. STUDY AREA .......................................................................................................... 23
4.1. Land Use .................................................................................................. 23
4.2. Building Floors .......................................................................................... 26
4.3. The Entrance Channel .............................................................................. 27
4.4. Regional Development Strategy ............................................................... 28
4.5. Environmental Summary........................................................................... 29

4.6. Community Consultation ........................................................................... 30
4.6.1. Stakeholder Consultation Plan .................................................................. 30
4.6.2. Outline of Plan .......................................................................................... 30
4.6.3. Summary of Responses............................................................................ 31
4.6.4. Conclusions .............................................................................................. 36
5. EXISTING FLOOD ENVIRONMENT ........................................................................ 37
5.1. Flood Behaviour ....................................................................................... 37
5.2. Hydraulic Classification ............................................................................. 37
5.3. Flood Hazard Classification ...................................................................... 38
5.4. Flood Risk and the Social Impacts of Flooding ......................................... 40
5.4.1. Tangible Flood Damages .......................................................................... 42
5.4.2. Intangible Flood Damages ........................................................................ 46
5.5. Flood Awareness and Flood Warning ....................................................... 48
5.6. Impacts of Flooding on Public Infrastructure ............................................. 48
5.7. Impacts of Flooding on Commercial and Industrial Activities ..................... 49
5.8. Environmental Impacts of Flooding ........................................................... 49
5.9. Flood Emergency Response Classification ............................................... 50
5.10. Implications of Climate Change and Sea Level Rise ................................. 51
5.10.1. Background ........................................................................................... 51
5.10.2. Key Developments ................................................................................. 51
5.10.3. How will Climate Change Affect Water Levels in the Lake Macquarie
Waterway?............................................................................................. 52
5.10.4. Implications of Future Development ....................................................... 54
6. RISK MANAGEMENT MEASURES ......................................................................... 55
6.1. General ..................................................................................................... 55
6.1.1. Relative Merits of Management Measures ................................................ 55
6.1.2. Management Matrix .................................................................................. 56
6.2. Measures Not Considered Further ............................................................ 57
6.2.1. Flood Mitigation Dams, Retarding Basins, On-Site Detention ................... 57
6.2.2. Change the Existing Entrance or Construct another Entrance .................. 57
6.2.3. Catchment Treatment ............................................................................... 58
6.2.4. Voluntary Purchase of Buildings ............................................................... 58
6.3. Flood Modification Measures .................................................................... 59
6.3.1. Levees, Flood Gates and Pumps .............................................................. 59

6.3.2. Local Drainage Issues .............................................................................. 62
6.3.3. Assessment of Wave Runup ..................................................................... 63
6.4. Property Modification Measures ................................................................ 65
6.4.1. House Raising and Flood Proofing ........................................................... 65
6.4.2. Strategic Planning Issues ......................................................................... 68
6.4.3. Rezoning .................................................................................................. 71
6.4.4. Modification to the s149 Certificates ......................................................... 72
6.4.5. Provision of Public Services ...................................................................... 74
6.4.6. Minimise the Risk of Electrocution ............................................................ 78
6.5. Response Modification Measures ............................................................. 78
6.5.1. Flood Warning .......................................................................................... 78
6.5.2. Flood Emergency Management ................................................................ 80
6.5.3. Public Information and Raising Flood Awareness ..................................... 81
6.6. Other Management Measures .................................................................. 85
6.6.1. Planning Regulations for Tourist/Caravan Parks ....................................... 85
6.6.2. Mine Subsidence ...................................................................................... 86
6.6.3. Flood Insurance ........................................................................................ 87
7. ACKNOWLEDGMENTS ........................................................................................... 88
8. REFERENCES ......................................................................................................... 89

LIST OF APPENDICES
Appendix A: Glossary of Terms
Appendix B: Flood Extent Mapping
Appendix C: Information on Representation of Property and Floor Level Data
Appendix D: Stakeholder Consultation Plan
LIST OF FIGURES
Figure 1: Study Area
Figure 2: Foreshore Management Areas
Figure 3: Cockle Creek Foreshore Management Area
Figure 4: Warners Bay Foreshore Management Area
Figure 5: Marks Point - Belmont Foreshore Management Area
Figure 6: Swansea – Pelican – Blacksmiths Foreshore Management Area
Figure 7: Dora Creek Foreshore Management Area
Figure 8: Carey Bay – Arcadia Vale Foreshore Management Area
Figure 9: Toronto - Fassifern Foreshore Management Area
Figure 10: Nords Wharf and Wyee Point Foreshore Management Area
Figure 11: Surveyed Building Floor Levels
Figure 12: Summary of Design Lake Levels and Profiles
Figure 13: Building Footprints Affected
Figure 14: Extent of Permanent Inundation and Flooding
Figure 15: Properties Affected
Figure 16: Percent of Land Area affected on each Property
LIST OF ACRONYMS
AEP Annual Exceedance Probability
AHD Australian Height Datum
ARI Average Recurrence Interval
ALS Airborne Laser Scanning
BOM Bureau of Meteorology
CFERP Community Flood Emergency Response Plan
CSIRO Commonwealth Scientific and Industrial Research Organisation
DECCW Department of Environment, Climate Change and Water (now OEH)
FPL Flood Planning Level
GIS Geographic Information System
HWC Hunter Water Corporation
IFD Intensity, Frequency and Duration of Rainfall
IPCC Intergovernmental Panel on Climate Change
LGA Local Government Area
LIDAR Light Detecting and Ranging (ALS and LIDAR refer to exactly the same process of
obtaining survey)
m metre
m3/s cubic metres per second
NASA US National Aeronautical and Space Administration
OEH Office of Environment and Heritage
PMF Probable Maximum Flood
SES State Emergency Service
SQID Stormwater Quality Improvement Device
SWW Severe Weather Warning
TUFLOW one-dimensional (1D) and two-dimensional (2D) flood and tide simulation software
program (hydraulic computer model)
WBNM Watershed Bounded Network Model (hydrologic computer model)
WSUD Water Sensitive Urban Design
WTP Water Treatment Plant
1D One dimensional hydraulic computer model
2D Two dimensional hydraulic computer model
LIST OF TABLES
Table 1: Summary of Management Measures Investigated in Study .......................................... 3
Table 2: Main Features of Lake Macquarie Waterway................................................................ 9
Table 3: Foreshore Management Areas ................................................................................... 10
Table 4: Flood Events .............................................................................................................. 11
Table 5: Design Event Scenarios ............................................................................................. 13
Table 6: Summary of Flood Levels on the Lake Macquarie Foreshore ..................................... 14
Table 7: Lake Macquarie Waterway Levels Relating to Sea Level Rise ................................... 15
Table 8: Land Use for Lake Macquarie Waterway Foreshore Properties (below 4 mAHD) ....... 24
Table 9: Buildings Located on the Foreshores of Lake Macquarie Waterway (below 4 mAHD) 26
Table 10: History of the Swansea Channel .............................................................................. 27
Table 11: Lower Hunter Regional Strategy ............................................................................... 28
Table 12: Summary of Submissions of – Draft Lake Macquarie Waterway Flood Study and
Flood Risk Management Study and Plan .................................................................................. 32
Table 13: Hazard Classification ................................................................................................ 39
Table 14: Flood Damages Categories (excluding damage and losses from permanent
inundation) ................................................................................................................................ 41
Table 15: Summary of Surveyed Building Floors Flooded (from Table 9) ................................. 43
Table 16: Summary of Increase in Surveyed Building Floors Flooded ...................................... 44
Table 17: Summary of Tangible Flood Damages (based on Table 15) ..................................... 45
Table 18: Annual Average Damages ........................................................................................ 46
Table 19: Emergency Response Classification of Communities ............................................... 50
Table 20: Summary of Design Lake Levels .............................................................................. 53
Table 21: Properties Affected – Flood Design Scenarios ......................................................... 54
Table 22: Matrix Scoring System.............................................................................................. 56
Table 23: Risk Management Measures Not Considered Further .............................................. 57
Table 24: Key Features of Levee Systems ............................................................................... 61
Table 25: Factors Influencing Wave Runup Effects .................................................................. 63
Table 26: Wave Runup Effects – 100 year ARI Event and 1 year ARI Event ............................ 64
Table 27: Council Stormwater Assets within Hazard Zones ..................................................... 75
Table 28: Flood Awareness Methods ....................................................................................... 84
Table 29: Tourist Parks on the Lake Macquarie Foreshore likely to be susceptible to Flooding 85

Lake Macquarie Waterway Flood Risk Management Study and Plan
WMAwater
29076:LakeMacFRMS.docx:26 June 2012 1
1. FOREWORD
The State Government’s Flood Prone Land Policy is directed at providing solutions to existing
flooding problems in developed areas and to ensuring that new development is compatible with
the flood hazard and does not create additional flooding problems in other areas.
Under the Policy, the management of flood liable land remains the responsibility of local
Government. The State Government subsidises flood mitigation works to alleviate existing
problems and provides specialist technical advice to assist councils in the discharge of their
floodplain management responsibilities.
The flood management process in NSW has recently been up-dated to incorporate
consideration of the effects of climate change, and particularly the effects of sea level rise, on
mean water levels and on flood levels.
The Policy provides for technical and financial support by the Government through the following
four sequential stages:
1. Flood Study
determine the nature and extent of the flood problem.
2. Floodplain/foreshore Risk Management Study
evaluates management options for the floodplain in respect of both existing
and proposed development.
3. Floodplain/foreshore Risk Management Plan
involves formal adoption by Council of a plan of management for the
floodplain/foreshore.
4. Implementation of the Plan
construction of flood mitigation works to protect existing development,
use of Local Environmental Plans to ensure new development is compatible
with the flood hazard.
This Lake Macquarie Waterway Flood Risk Management Study and Plan constitutes a review of
the second and third stage of the management process, namely the August 2000 Lake
Macquarie Floodplain Management Study and the July 2001 Lake Macquarie Floodplain
Management Plan. This review has been prepared by consultant WMAwater for Lake
Macquarie City Council and was undertaken following a review of the 1998 Lake Macquarie
Flood Study, to include the June 2007 long weekend storm/flood event and incorporation of the
implications of climate change. The results of this Waterway Flood Risk Management Study
and Plan Review will provide the basis for the future management of flood liable foreshores
areas surrounding the Lake Macquarie waterway. The study concentrates on those areas of the
foreshore within the boundaries of Lake Macquarie City Council, with no investigation of land
within the Wyong local government area.

Lake Macquarie Waterway Flood Risk Management Study and Plan
WMAwater
29076:LakeMacFRMS.docx:26 June 2012 2
2. LAKE MACQUARIE WATERWAY FLOOD RISK MANAGEMENT PLAN
2.1. Introduction
The Lake Macquarie Waterway Flood Risk Management Plan has been prepared in accordance
with the NSW Floodplain Development Manual (April 2005) and the August 2010 Flood Risk
Management Guide – Incorporating sea level rise benchmarks in flood risk assessment and:
Is based on a comprehensive and detailed evaluation of factors that affect and are
affected by the use of flood prone land;
Represents the considered opinion of the local community on how to best manage its
flood risk and its flood prone land; and
Provides a long-term path for the future development of the community.
The Lake Macquarie waterway (the lake itself) has a catchment area of approximately 700
square kilometres to the Pacific Ocean. Of this approximately 110 square kilometres (16%) is
the area of the lake. The lake is approximately 22 kilometres in length and up to 8 kilometres
wide, with a perimeter of 170 kilometres.
The lake is surrounded by bushland, parkland, and residential developments that value its
scenic quality as well as its commercial and recreational value. The entrance to the Pacific
Ocean is by the narrow and shallow 4 kilometre long Swansea Channel. The lake level is
normally at 0.10 mAHD and tidal fluctuations are generally only ±0.05m. Elevated ocean levels
(high tides and storm surge) as well as intense rainfall over the catchment cause the lake level
to rise.
The highest recorded lake water level is 1.25 mAHD in 1949 (at Marks Point), with 1.05 mAHD
reached in the June 2007 long weekend storm/flood event and 1.00 mAHD in February 1990.
The June 2007 long weekend storm/flood event, and the February 1990 flood event were of the
order of a 30 year Average Recurrence Interval (ARI) design event.
Flooding causes significant hardship (tangible and intangible damages) to the community, and
the impacts will increase as sea levels rise, and for this reason Lake Macquarie City Council has
undertaken a program of studies to address the management of flood risks.
The present review was initiated by Lake Macquarie City Council to reassess flood risk
management options and incorporate the NSW Government’s sea level rise benchmarks, based
on predictions by the Intergovernmental Panel on Climate Change (IPCC) and the CSIRO
Technical Review for Australia, and also the potential increase in rainfall intensities due to
climate change, and evaluate suitable adaptation measures.
2.2. Risk Management Measures Considered
A matrix of possible management measures was prepared and evaluated in this Waterway
Flood Risk Management Study taking into account a range of parameters. This process

Lake Macquarie Waterway Flood Risk Management Study and Plan
WMAwater
29076:LakeMacFRMS.docx:26 June 2012 3
eliminated a number of flood risk management measures (refer Section 6.2) including:
Flood mitigation dams and retarding basins: - on the basis of high cost, large footprint,
and environmental impact,
Modifying the existing Swansea entrance channel or constructing a new entrance at
another location: - on the basis of high cost, may exacerbate flooding, and
environmental impact,
Catchment treatment, to increase soil infiltration and storage of rainfall in the
catchment: on the basis of minimal reduction in flood levels,
Voluntary purchase of flood affected buildings, as it is uneconomic and has a high
social impact.
The full range of measures was evaluated in Section 6 and the outcomes are summarised in
Table 1. Community opinion on the full range of options was canvassed during the public
exhibition period in October and November 2011. However it should be noted that these
outcomes may change in time if community expectations change and/or as an outcome of the
proposed local area adaptation plans. The final options documented in the Lake Macquarie
Waterway Flood Risk Management Plan reflect the current community input.
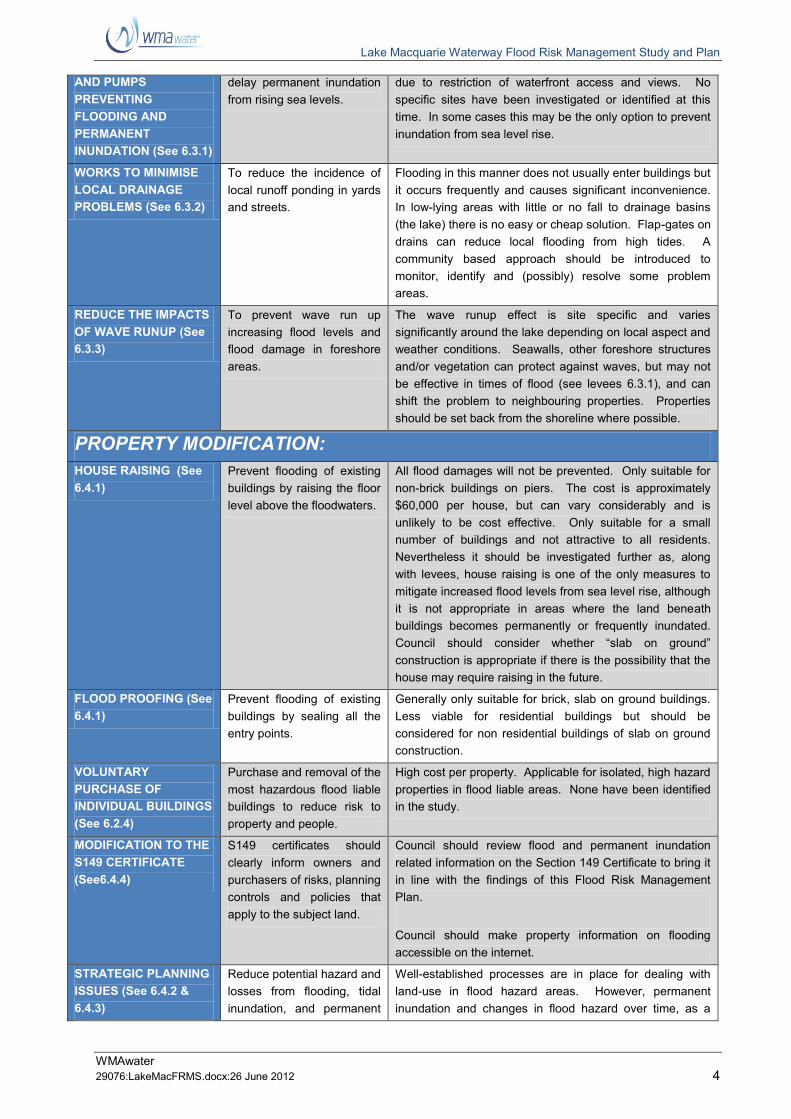
Table 1: Summary of Management Measures Investigated in Study
MEASURE
PURPOSE
COMMENT
FLOOD MODIFICATION: FLOOD MITIGATION
DAMS, RETARDING
BASINS, ON-SITE
DETENTION (See 6.2.1)
Reduce the peak flow from
the catchment into the lake
by increasing the volume of
flood storage in the
catchment.
Not considered further as these measures have negligible
impact on lake flooding. The size of storages required to
make a difference to lake floods are very large, making
them impractical on environmental, social and economic
grounds. Smaller on-site detention can help water quality
and local drainage, but has little impact on lake flooding. ENLARGE OR
DUPLICATE THE
ENTRANCE (See 6.2.2)
Increase the flow rates and
volumes of exchange
between the ocean and the
lake.
Not considered further as it will exacerbate the peak height
of most lake floods due to increased penetration into the
lake of ocean tides, storm surge and wave set up. May
make tidal inundation from sea level rise worse by
increasing tidal range in the lake. MANAGEMENT OF THE
ENTRANCE (See 6.2.2)
Ensure changes in Swansea
channel due to sea level
rise, dredging, silting up, or
erosion do not exacerbate
flooding.
Currently dredging is undertaken to maintain a navigable
channel and has minimal or no effect on normal lake levels
or flood levels. Channel condition and function is
monitored regularly. Management of the entrance by
constructing barriers or locks will not be a viable means of
reducing flooding or preventing sea level rise in the lake. CATCHMENT
TREATMENTS (See
6.2.3)
Reduce volume of runoff
from catchment by
maximising water retention
and absorption, and
minimising impervious
surfaces such as roofs and
roads.
These measures can be effective in small catchments, to
protect local creeks, and to improve water quality, but are
not effective in larger catchments or in reducing lake flood
levels.
EARTHEN OR
CONCRETE LEVEE
BANKS, FLOODGATES,
Prevent or reduce the
frequency of flooding of
protected areas. Prevent or
Relatively expensive for larger structures but may be
economically feasible for smaller structures on the lake.
May cause local drainage problems and social problems
Lake Macquarie Waterway Flood Risk Management Study and Plan
WMAwater
29076:LakeMacFRMS.docx:26 June 2012 4
AND PUMPS
PREVENTING
FLOODING AND
PERMANENT
INUNDATION (See 6.3.1)
delay permanent inundation
from rising sea levels.
due to restriction of waterfront access and views. No
specific sites have been investigated or identified at this
time. In some cases this may be the only option to prevent
inundation from sea level rise.
WORKS TO MINIMISE
LOCAL DRAINAGE
PROBLEMS (See 6.3.2)
To reduce the incidence of
local runoff ponding in yards
and streets.
Flooding in this manner does not usually enter buildings but
it occurs frequently and causes significant inconvenience.
In low-lying areas with little or no fall to drainage basins
(the lake) there is no easy or cheap solution. Flap-gates on
drains can reduce local flooding from high tides. A
community based approach should be introduced to
monitor, identify and (possibly) resolve some problem
areas. REDUCE THE IMPACTS
OF WAVE RUNUP (See
6.3.3)
To prevent wave run up
increasing flood levels and
flood damage in foreshore
areas.
The wave runup effect is site specific and varies
significantly around the lake depending on local aspect and
weather conditions. Seawalls, other foreshore structures
and/or vegetation can protect against waves, but may not
be effective in times of flood (see levees 6.3.1), and can
shift the problem to neighbouring properties. Properties
should be set back from the shoreline where possible.
PROPERTY MODIFICATION: HOUSE RAISING (See
6.4.1)
Prevent flooding of existing
buildings by raising the floor
level above the floodwaters.
All flood damages will not be prevented. Only suitable for
non-brick buildings on piers. The cost is approximately
$60,000 per house, but can vary considerably and is
unlikely to be cost effective. Only suitable for a small
number of buildings and not attractive to all residents.
Nevertheless it should be investigated further as, along
with levees, house raising is one of the only measures to
mitigate increased flood levels from sea level rise, although
it is not appropriate in areas where the land beneath
buildings becomes permanently or frequently inundated.
Council should consider whether “slab on ground”
construction is appropriate if there is the possibility that the
house may require raising in the future. FLOOD PROOFING (See
6.4.1)
Prevent flooding of existing
buildings by sealing all the
entry points.
Generally only suitable for brick, slab on ground buildings.
Less viable for residential buildings but should be
considered for non residential buildings of slab on ground
construction. VOLUNTARY
PURCHASE OF
INDIVIDUAL BUILDINGS
(See 6.2.4)
Purchase and removal of the
most hazardous flood liable
buildings to reduce risk to
property and people.
High cost per property. Applicable for isolated, high hazard
properties in flood liable areas. None have been identified
in the study.
MODIFICATION TO THE
S149 CERTIFICATE
(See6.4.4)
S149 certificates should
clearly inform owners and
purchasers of risks, planning
controls and policies that
apply to the subject land.
Council should review flood and permanent inundation
related information on the Section 149 Certificate to bring it
in line with the findings of this Flood Risk Management
Plan.
Council should make property information on flooding
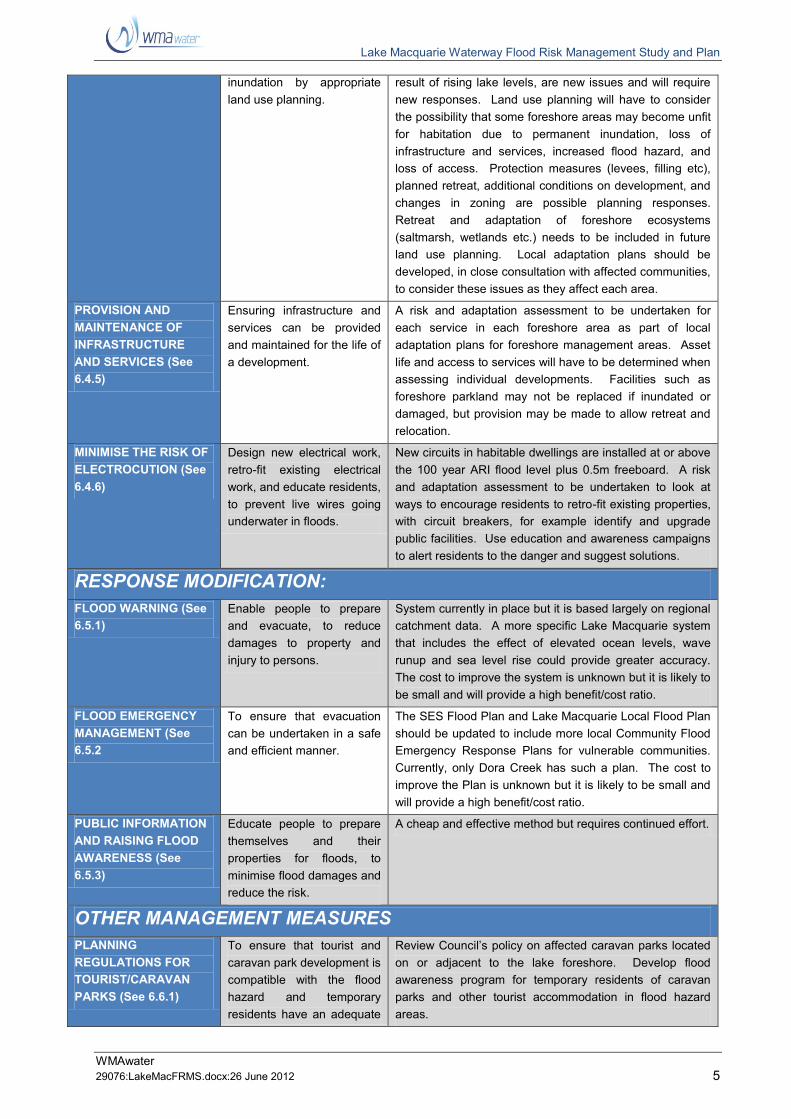
accessible on the internet. STRATEGIC PLANNING
ISSUES (See 6.4.2 &
6.4.3)
Reduce potential hazard and
losses from flooding, tidal
inundation, and permanent
Well-established processes are in place for dealing with
land-use in flood hazard areas. However, permanent
inundation and changes in flood hazard over time, as a
Lake Macquarie Waterway Flood Risk Management Study and Plan
WMAwater
29076:LakeMacFRMS.docx:26 June 2012 5
inundation by appropriate
land use planning.
result of rising lake levels, are new issues and will require
new responses. Land use planning will have to consider
the possibility that some foreshore areas may become unfit
for habitation due to permanent inundation, loss of
infrastructure and services, increased flood hazard, and
loss of access. Protection measures (levees, filling etc),
planned retreat, additional conditions on development, and
changes in zoning are possible planning responses.
Retreat and adaptation of foreshore ecosystems
(saltmarsh, wetlands etc.) needs to be included in future
land use planning. Local adaptation plans should be
developed, in close consultation with affected communities,
to consider these issues as they affect each area. PROVISION AND
MAINTENANCE OF
INFRASTRUCTURE
AND SERVICES (See
6.4.5)
Ensuring infrastructure and
services can be provided
and maintained for the life of
a development.
A risk and adaptation assessment to be undertaken for
each service in each foreshore area as part of local
adaptation plans for foreshore management areas. Asset
life and access to services will have to be determined when
assessing individual developments. Facilities such as
foreshore parkland may not be replaced if inundated or
damaged, but provision may be made to allow retreat and
relocation. MINIMISE THE RISK OF
ELECTROCUTION (See
6.4.6)
Design new electrical work,
retro-fit existing electrical
work, and educate residents,
to prevent live wires going
underwater in floods.
New circuits in habitable dwellings are installed at or above
the 100 year ARI flood level plus 0.5m freeboard. A risk
and adaptation assessment to be undertaken to look at
ways to encourage residents to retro-fit existing properties,
with circuit breakers, for example identify and upgrade
public facilities. Use education and awareness campaigns
to alert residents to the danger and suggest solutions.
RESPONSE MODIFICATION: FLOOD WARNING (See
6.5.1)
Enable people to prepare
and evacuate, to reduce
damages to property and
injury to persons.
System currently in place but it is based largely on regional
catchment data. A more specific Lake Macquarie system
that includes the effect of elevated ocean levels, wave
runup and sea level rise could provide greater accuracy.
The cost to improve the system is unknown but it is likely to
be small and will provide a high benefit/cost ratio. FLOOD EMERGENCY
MANAGEMENT (See
6.5.2
To ensure that evacuation
can be undertaken in a safe
and efficient manner.
The SES Flood Plan and Lake Macquarie Local Flood Plan
should be updated to include more local Community Flood
Emergency Response Plans for vulnerable communities.
Currently, only Dora Creek has such a plan. The cost to
improve the Plan is unknown but it is likely to be small and
will provide a high benefit/cost ratio. PUBLIC INFORMATION
AND RAISING FLOOD
AWARENESS (See
6.5.3)
Educate people to prepare
themselves and their
properties for floods, to
minimise flood damages and
reduce the risk.
A cheap and effective method but requires continued effort.
OTHER MANAGEMENT MEASURES PLANNING
REGULATIONS FOR
TOURIST/CARAVAN
PARKS (See 6.6.1)
To ensure that tourist and
caravan park development is
compatible with the flood
hazard and temporary
residents have an adequate
Review Council’s policy on affected caravan parks located
on or adjacent to the lake foreshore. Develop flood
awareness program for temporary residents of caravan
parks and other tourist accommodation in flood hazard
areas.

Lake Macquarie Waterway Flood Risk Management Study and Plan
WMAwater
29076:LakeMacFRMS.docx:26 June 2012 6
level of flood awareness.
MINE SUBSIDENCE
(See 6.6.2)
The Mines Subsidence
Board has indicated that
parts of Lake Macquarie
waterway are within, or may
become within, a mine
subsidence area.
Current practice is to manage mining to prevent longwall
extraction beneath foreshore areas. The extent of these
management areas needs to be reviewed with the relevant
State agencies to make allowance for sea level rise. If
already mined areas are likely to experience continued
subsidence, further detail is required to define the likely
extent and magnitude of mine subsidence and an
appropriate allowance, over and above the 0.5m freeboard,
should be included in the flood development assessment
process. FLOOD INSURANCE
(See 6.6.3)
To spread the risk of
individual financial loss
across the whole community
through insuring against
flood damage.
Does not reduce damage, but spreads the cost. Insurance
against catchment (rainfall-induced) flooding is
commercially available at a price, and governments are
currently considering universal or subsidised schemes.
Insurance against storm surge, tidal inundation, and
permanent inundation from sea level rise (ocean-induced)
is not available.
2.3. Foreshore Risk Management Measures in Plan
The recommended measures are described below (in no particular order within each priority
group). The measures will be further refined and assessed by development of detailed local
area adaptation plans for each foreshore management area.
HIGH Priority
1. Undertake a detailed assessment (Local Area Adaptation Plans) for each
foreshore management area, in consultation with each affected community, of
the implications and adaptation measures available to plan for and mitigate the
effects of sea level rise (flooding and tidal inundation).
Cost: moderate
Responsibility: Lake Macquarie City Council
Timeframe: begin 2012 and aim to complete priority areas by the year 2015
2. Undertake a detailed review of the provision and maintenance of services and
infrastructure in the foreshore areas in the year 2050 and 2100.
Cost: moderate
Responsibility: Lake Macquarie City Council and other service providers
Timeframe: by the year 2015 and/or in conjunction with development of plans
in 1 above
3. Establish criteria to define when land becomes “unsuitable” for current or
proposed future use due to permanent inundation.
Cost: moderate
Responsibility: Lake Macquarie City Council
Timeframe: by the year 2013 and/or in conjunction with development of local
area adaptation plans in 1 above

Lake Macquarie Waterway Flood Risk Management Study and Plan
WMAwater
29076:LakeMacFRMS.docx:26 June 2012 7
4. Review the wording on the Section 149 certificates, development restriction
certificates and flood control lot certificates to incorporate revised flood
planning levels and new permanent inundation planning level.
Cost: low
Responsibility: Lake Macquarie City Council
Timeframe: by the year 2012
5. Review strategic land use planning to accommodate adaptation to changed
flooding and inundation due to sea level rise. The review should include
suitable development densities and types, possible need for retreat areas,
future protection and adaptation of foreshore ecosystems, foreshore access
and recreation, foreshore community facilities, and land required for
infrastructure and protection works.
Cost: moderate
Responsibility: Lake Macquarie City Council and NSW Government
Timeframe: by the year 2013
6. Develop or adopt financial models to prepare for future costs of possible
protection works, infrastructure up-grades, relocations, and other adaptation
options
Cost: moderate
Responsibility: Lake Macquarie City Council and other service providers
Timeframe: by the year 2014
MEDIUM Priority
1. Undertake a review of the suitability of slab on ground construction in the
foreshore areas and whether other forms of building construction can be
undertaken that would reduce flood hazard and/or allow future adaptation such
as house raising.
Cost: low - moderate
Responsibility: Lake Macquarie City Council and NSW Government
Timeframe: by the year 2014
2. Undertake a review of the flood warning system and if necessary update.
Cost: low - moderate
Responsibility: Lake Macquarie City Council and the Bureau of Meteorology
Timeframe: by the year 2013
3. Review Council’s policy “Caravan Parks on Flood Prone Lands Surrounding
Lake Macquarie Waterway (2005)” for caravan and cabin parks in the foreshore
area.
Cost: low
Responsibility: Lake Macquarie City Council and caravan park owners
Timeframe: by the year 2012

Lake Macquarie Waterway Flood Risk Management Study and Plan
WMAwater
29076:LakeMacFRMS.docx:26 June 2012 8
LOW Priority
1. Assess the possible implications of mine subsidence in the area for flood
related development controls.
Cost: low
Responsibility: Lake Macquarie City Council and Mines Subsidence Board
Timeframe: by the year 2013
2. Inform the SES of the outcomes of this Plan and the possible implications for
flood evacuation. If necessary the SES should update their Flood Plan.
Cost: low
Responsibility: Lake Macquarie City Council and SES
Timeframe: by the year 2013
3. Evaluate whether a house raising scheme or similar will be supported by the
community and is a practical adaptation measure for sea level rise and if so
establish such a scheme.
Cost: low to evaluate. Approximately $60,000 to raise a non brick house, but
highly variable
Responsibility: Lake Macquarie City Council and local community
Timeframe: ongoing
4. Ensure that ongoing local drainage problems are monitored and addressed, in
accordance with Council’s ability to fund such works.
Cost: moderate
Responsibility: Lake Macquarie City Council and local residents
Timeframe: ongoing
5. Monitor any changes to the sedimentation and erosion regime in the Swansea
channel.
Cost: no cost to Council – NSW Maritime conduct quarterly bathymetric
surveys of the main channel
Responsibility: Lake Macquarie City Council and NSW Government
Timeframe: ongoing

Lake Macquarie Waterway Flood Risk Management Study and Plan
WMAwater
29076:LakeMacFRMS.docx:26 June 2012 9
3. INTRODUCTION
3.1. Background
Lake Macquarie is a saline tidal lake with a permanently open entrance in the Hunter Region of
New South Wales, 95 kilometres north of Sydney and 20 kilometres south of Newcastle (Figure
1). The main features of the lake are provided in Table 2.
Table 2: Main Features of Lake Macquarie Waterway
Total Catchment Area 700 km2
Area of Lake 110 km2 (16% of the total catchment area)
Length of Lake 22 km in a north-south direction
Width of Lake varying from 2 km to 8 km in an east-west direction
Perimeter Length 170 kilometres
Average Water Depth 8 to 9 metres
Maximum Water Depth 11 metres (near Pulbah Island)
Contributing Catchments Dora Creek (230 km2)
Cockle Creek (111 km2)
Stoney Creek (36 km2)
Each of the other contributing catchments has a
catchment area of less than 30 km2.
The Lake Macquarie waterway is the largest coastal lake in eastern Australia and is surrounded
by extensive residential, commercial and industrial developments. The lake is a valuable natural
resource for the region, providing commercial and recreational usage, as well as being of high
scenic value. The outlet of the Lake Macquarie waterway to the Pacific Ocean is by the narrow
and shallow entrance channel at Swansea (Swansea Channel). Today it has a permanently
open entrance which has been extensively modified by man made structures (filling of the
northern embankment, dredging and construction of sea walls).
The water level in the lake is typically at 0.1 mAHD but can rise to 0.4 mAHD following a period
of high ocean levels. Australian Height Datum (AHD) is the common national plane
approximating to mean sea level. Under normal circumstances, the ocean tide (±0.5 m) has
little impact (±0.05 m) on the water level in the lake. Intense rainfall over the catchment
combined with elevated ocean levels can raise the water level in less than 24 hours causing
significant flooding of the foreshore areas and hardship to the community.
For the purposes of this investigation, the study area was subdivided into seven foreshore
management areas as shown on Table 3 and on Figure 2. These areas are defined as
generally land below the 4 mAHD contour and are shown on Figures 3 to 10.

Lake Macquarie Waterway Flood Risk Management Study and Plan
WMAwater
29076:LakeMacFRMS.docx:26 June 2012 10
Table 3: Foreshore Management Areas
Figure Suburbs Area Total Surveyed Buildings
Surveyed Residential Buildings
Surveyed Commercial
Buildings
Surveyed Industrial Buildings
3 Boolaroo, Edgeworth, Glendale, Speers Point, Teralba
Cockle Creek
240 233 3 4
4 Croudace Bay, Eleebana, Valentine, Warners Bay
Warners Bay
267 261 6 0
5 Belmont, Belmont South, Marks Point
Marks Point - Belmont
905 897 8 0
6 Blacksmiths, Pelican, Swansea
Swansea – Pelican -
Blacksmiths
2087 2030 56 1
7 and 10
Balcolyn, Bonnells Bay, Brightwaters, Dora Creek, Mirrabooka, Morisset, Morisset Park, Nords Wharf, Silverwater, Sunshine, Windermere Park, Wyee Point
Dora Creek 707 704 3 0
8 Arcadia Vale, Balmoral, Buttaba, Carey Bay, Coal Point, Fishing Point, Kilaben Bay, Rathmines, Wangi Wangi
Carey Bay – Arcadia
Vale
228 227 1 0
9 Blackalls Park, Bolton Point, Booragul, Fassifern, Fennell Bay, Marmong Point, Toronto
Toronto - Fassifern
365 347 5 13
Total 4799 4699 82 18
Note: The above table is based on the database of surveyed floor levels of buildings, mostly on lots below 2 mAHD,
provided by Lake Macquarie City Council. It is likely that buildings on lots above 2 mAHD and below 4 mAHD are not included. The surveyed buildings represent less than half the total building stock in the study area.
Table 3 indicates that the majority of residential, commercial and industrial buildings that are
likely to be affected by flooding are on the eastern shore (Figures 5 and 6) and near Dora Creek
(Figure 7).
3.2. Objectives
Lake Macquarie City Council engaged WMAwater (formerly Webb, McKeown & Associates) to
review the 2000 Lake Macquarie Floodplain Risk Management Study and 2001 Plan
(References 1 and 2) in light of the NSW Government’s benchmarks for sea level rise as well as
guidelines for rainfall intensity increases (Flood Risk Management Guide - Reference 3 and
Floodplain Risk Management Guideline – Practical Consideration of Climate Change –
Reference 4).
The objectives of the Study are to identify and compare various management options, including
an assessment of their social, economic and environmental impacts, together with opportunities
to enhance the foreshore environments. The primary aim of the Plan is to reduce the flood
hazard and risk to people and property in the existing community and to ensure future
development is controlled in a manner consistent with the flood hazard and risk at this time and
as a result of climate change (sea level rise). This review combines and updates the previous
Lake Macquarie Floodplain Risk Management Study (2000 – Reference 1) and Plan (2001 –
Reference 2) into one document.
A glossary of flood related terminology is provided in Appendix A.

Lake Macquarie Waterway Flood Risk Management Study and Plan
WMAwater
29076:LakeMacFRMS.docx:26 June 2012 11
3.3. Floodplain Risk Management Process
As described in the 2005 NSW Government’s Floodplain Development Manual (Reference 5),
the Floodplain Risk Management Process entails four sequential stages:
Stage 1: Flood Study.
Stage 2: Floodplain/Foreshore Risk Management Study.
Stage 3: Floodplain/Foreshore Risk Management Plan.
Stage 4: Implementation of the Plan.
The 2012 Lake Macquarie Waterway Flood Study (Reference 6) undertook a review of the first
stage of the management process, namely the 1998 Lake Macquarie Flood Study Part 1 and
Part 2 (References 7 and 8), to include the June 2007 long weekend flood event and incorporate
the implications of climate change.
This document provides a review of the August 2000 Lake Macquarie Floodplain Risk
Management Study and July 2001 Plan (References 1 and 2) which constitutes the second and
third stages in the process. It has been termed a “waterway” management study rather than a
“floodplain” management study as the former term is more widely understood to represent the
areas subject to flooding around the Lake Macquarie waterway.
3.4. History of Flooding
Historical records (dating back to 1927) show that periodically the level of the lake has risen in
response to heavy rainfall over the catchment and/or elevated ocean levels. This has resulted
in the flooding of land and occasionally of building floors. The dates and approximate peak lake
levels of all known significant floods since 1926 are shown in Table 4.
Table 4: Flood Events
Date
(in order of severity)
Approximate Peak Lake Level (mAHD)
18 June 1949 1.25
Easter 1946 1.20
11 June 1930 1.10
9 June 2007 1.05
2 May 1964 1.00
4 February 1990 1.00
1953 0.90
1926/27 0.80
25 February 1981 0.80
May 1974 0.80
4 March 1977 0.70
Notes: Data obtained from the 1998 Lake Macquarie Waterway Flood Study - Reference 7.
Levels may be an average of several recorded heights. It is likely that several floods prior to 1970 may not have been recorded.

Lake Macquarie Waterway Flood Risk Management Study and Plan
WMAwater
29076:LakeMacFRMS.docx:26 June 2012 12
The records show that the highest recorded flood level was 1.25 mAHD in 1949 (observed at
Marks Point) with the most recent major floods occurring in June 2007 (1.05 mAHD) and in
February 1990 (1.00 mAHD). Accurate recording of lake levels has only been available since
installation of the NSW State Government operated gauges at Marks Point and Belmont in
1986.
3.5. Causes of Flooding
Flooding of the foreshore areas of Lake Macquarie may occur as a result of a combination of
factors including:
an elevated ocean level due to an ocean storm surge, wave setup at the entrance
and/or a high astronomic tide,
rainfall over the lake and the catchments (Dora Creek, North Creek, South Creek etc.)
entering Lake Macquarie,
wind wave action causing wind setup and runup on the foreshore within the lake,
a permanent rise in ocean and lake levels due to climate change.
Flood levels on the Lake Macquarie foreshore are affected by runoff from the surrounding
catchments into the lake as well as inflows from the Pacific Ocean due to elevated ocean levels.
Elevated ocean levels occur due to a combination of tides (the high tide varies from
approximately 0.5 m to 1.1 mAHD during the year) and what are known as ocean anomalies.
The main components of ocean anomalies (difference between the predicted and the recorded
tide) are storm surge and wave setup at the entrance to the Lake Macquarie waterway.
Together these components can raise ocean levels by up to 1 m.
3.6. Flood Planning Levels
3.6.1. Year 2011 Design Flood Levels
One of the key considerations in modelling coastal systems is the probability of occurrence of a
combined ocean and rainfall event and the relative magnitude of both. It is considered to be
overly conservative to assume a 100 year ARI (1% AEP) ocean event will occur concurrently
with a 100 year ARI (1% AEP) rainfall event, however there are no data available to accurately
define a suitable approach.
As part of the updating of the flood study (2012 Lake Macquarie Waterway Flood Study -
Reference 6) ocean anomalies were investigated and two runoff/ocean design scenarios were
adopted. A design ocean event in conjunction with a similar or smaller magnitude rainfall event
(termed an ocean dominated event) and a design rainfall event in conjunction with a similar or
smaller magnitude ocean event (termed a rainfall dominated event).

Lake Macquarie Waterway Flood Risk Management Study and Plan
WMAwater
29076:LakeMacFRMS.docx:26 June 2012 13
A summary of the adopted design scenarios is provided in Table 5.
Table 5: Design Event Scenarios
OCEAN DOMINATED DESIGN
EVENT
(ARI)
RAINFALL DOMINATED
Peak Design Ocean
Level + Wave Setup
(m AHD)
Co incident Design
Rainfall Event
(ARI)
Co incident Design
Ocean Event
(ARI)
Co incident Design
Ocean Level + Wave
Setup (m AHD)
2.18 100 year PMF 100 year 1.70
1.80 100 year 500 year 100 year 1.70
1.75 100 year 200 year 100 year 1.70
1.70 20 year 100 year 20 year 1.63
1.67 20 year 50 year 20 year 1.63
1.63 20 year 20 year 20 year 1.63
1.41 10 year 10 year 10 year 1.41
1.38 5 year 5 year 5 year 1.38
1.30 2 year 2 year 2 year 1.30
The following conditions were adopted for the design year 2011 flood analysis:
0.1 mAHD initial (average normal) water level in the Lake Macquarie waterway,
48 hour critical rainfall storm duration inflows (for all design events except the PMF)
in conjunction with the respective ocean tides as shown in Table 5,
design ocean levels based on the design levels in Fort Denison/Sydney Harbour
plus a wave setup component,
all design tides assume the “shape” of the tidal hydrograph of the May 21st to 27th
1974 event (approximately 160 hours with the peak at 110 hours) as recorded at
Fort Denison in Sydney Harbour. This tidal hydrograph approximates the 100 year
ARI design ocean event,
the peak ocean level was coincided with the peak rainfall burst in the 48 hour
duration rainfall event.
An envelope approach was adopted which assumed the maximum of an ocean dominated event
and a rainfall dominated event. The results indicated that downstream of the bridge the ocean
dominated event produces the higher level but upstream the rainfall dominated event produces
the higher level. The adopted design flood levels for the lake are provided in Table 6 together
with a comparison with those adopted previously.
The main reason that the levels have changed (notably in the PMF) is because of different
assumptions regarding the peak ocean levels and the joint co-incidence of ocean and rainfall
events. Changes to the 100 year, 50 year and 20 year ARI levels range from increases of 0.1 m
to 0.3 m but in the PMF a reduction of 0.2 m. Re-modelling of design events will always
produce minor changes to flood levels due to the different approaches and models employed.

Lake Macquarie Waterway Flood Risk Management Study and Plan
WMAwater
29076:LakeMacFRMS.docx:26 June 2012 14
Table 6: Summary of Flood Levels on the Lake Macquarie Foreshore
Event
(ARI)
Still Water Level on the Lake
Macquarie foreshore
(excludes wave runup in the lake)
Still Water Level downstream of
Swansea Bridge
Year 2011 OLD
(mAHD)
Year 2011 NEW
(mAHD)
Year 2011 Difference
(m)
Year 2011 OLD
(mAHD)
Year 2011 NEW
(mAHD)
Year 2011 Difference
(m)
PMF/extreme 2.63 2.45 -0.18 2.01 2.06 +0.05
500 year n/c 1.87 n/c 1.69
200 year n/c 1.69 n/c 1.64
100 year 1.38 1.50 +0.12 1.67 1.57 -0.10
50 year 1.24 1.38 +0.14 1.64 1.54 -0.10
20 year 0.97 1.23 +0.26 1.49 1.50 +0.01
10 year n/c 0.94 n/c 1.27
5 year n/c 0.82 n/c 1.24
2 year n/c 0.65 n/c 1.15
Notes: n/c = not calculated previously
Underlined levels have been derived by interpolation from model results rather than actual modelling
In addition to flooding due to runoff/ocean levels there is another form of flooding resulting from
waves running up the foreshore (wave runup). This is where waves (caused by wind acting on
the water surface of the lake) break and “runup” the foreshore. Part 2 of the 1998 Lake
Macquarie Flood Study (Reference 8) investigated the effects of wave runup at 48 locations.
The results indicate that wave runup may increase the still water design lake levels by up to 1m
(average of 0.3m) for the 100 year ARI event.
Table 7 provides a summary of key flood related levels for the Lake Macquarie waterway
(upstream of the Swansea Bridge).

Lake Macquarie Waterway Flood Risk Management Study and Plan
WMAwater
29076:LakeMacFRMS.docx:26 June 2012 15
Table 7: Lake Macquarie Waterway Levels Relating to Sea Level Rise
Level Measure Basis of Calculation Planning & Development
Conditions
Property Certificate
0.10 mAHD Year 2011 lake mean still water
level
Approx 30 years lake tide gauge
average (Flood Study – Reference 6)
< =1.00 mAHD Below Year 2100 lake mean still
water level
Hazard to land use, infrastructure,
buildings, and services from
progressive rise in permanent lake
levels to Year 2100
High hazard permanent lake
inundation area and high hazard
lake flood area (flood fringe)
Properties shown as
“Progressive inundation –
sea level rise” (or similar)
on 149(2) Certificate
1.00 mAHD Year 2100 lake mean still water
level
Year 2011 lake level + 0.9 m sea
level rise
1.23 mAHD Year 2011 20 ARI year flood Flood Study – Reference 6
< =1.50 mAHD Below Year 2011 100 year ARI
flood
Assessment of depth/velocity of Year
2100 100 year ARI flood and other
hazard factors
High hazard lake foreshore area
(flood fringe)
1.50 mAHD Year 2011 100 year ARI flood Flood Study – Reference 6
1.61 mAHD Year 2050 20 year ARI flood level Flood Study – Reference 6 Flood planning level for non-
habitable buildings with Year
2050 asset life
1.50 mAHD –
2.32 mAHD
Between high hazard flood level
and Year 2100 100 year ARI flood
level
Low hazard lake foreshore area
(flood fringe)
1.86 mAHD Year 2050 100 year ARI flood level Flood Study – Reference 6 – includes
0.4 m sea level rise
2.10 mAHD Year 2100 20 year ARI flood level Flood Study – Reference 6 – includes
0.9 m sea level rise
Flood planning level for non-
habitable buildings with Year
2100 asset life
2.32 mAHD Year 2100 100 year ARI flood level Flood Study – Reference 6 – includes
0.9 m sea level rise

Lake Macquarie Waterway Flood Risk Management Study and Plan
WMAwater
29076:LakeMacFRMS.docx:26 June 2012 16
Level Measure Basis of Calculation Planning & Development
Conditions
Property Certificate
2.36 mAHD Year 2050 Flood Planning Level Year 2050 100 year ARI flood level +
0.5 m freeboard
Flood planning level for
habitable buildings with Year
2050 asset life
2.45 mAHD Year 2011 PMF Flood Study – Reference 6
2.81 mAHD Year 2050 PMF Flood Study – Reference 6 – includes
0.4 m sea level rise
2.82 mAHD Year 2100 Flood Planning Level Year 2100 100 year ARI flood level +
0.5 m freeboard
Flood planning level for
habitable buildings with Year
2100 asset life
<=3.00 mAHD Year 2100 Flood Planning Level
“rounded up”
Year 2100 100 year ARI flood level +
0.5 m freeboard “rounded up” to allow
for plus-or-minus 0.15 m margin in
aerial survey
Nominated as “flood control lot”
for purposes of Exempt and
Complying Development Codes
SEPP
Properties shown as “Lake
flooding” (or similar) on
149(2) Certificate
3.27 mAHD Year 2100 PMF Flood Study – Reference 6– includes
0.9 m sea level rise
Flood planning level for
“sensitive development” such as
hospitals, aged-care facilities
Lake Macquarie Waterway Flood Risk Management Study and Plan
WMAwater
29076:LakeMacFRMS.docx:26 June 2012 17
3.6.2. Year 2050 and Year 2100 Design Flood Levels
Design flood levels for the year 2050 and year 2100 have been modelled in the current 2012
Lake Macquarie Waterway Flood Study (Reference 6) and are provided in Tables 6 and 7.
The criteria for establishing these are:
The NSW Government’s benchmarks in the 2010 Flood Risk Management
Guide (Reference 3) for sea level rise by the year 2050 (+0.4 m) and the
year 2100 (+0.9 m) were adopted and included in the hydraulic modelling
undertaken in the 2012 Lake Macquarie Waterway Flood Study (Reference
6).
The 2012 Lake Macquarie Waterway Flood Study (Reference 6) undertook
an assessment of a 10%, 20% and 30% potential climate change increase
in design rainfall intensities. However no increase in rainfall intensity has
been included at this time as there is no certainty that such an increase will
occur. The Bureau of Meteorology is undertaking on-going research in this
field and once definitive advice is provided this should be considered with a
view to amending the year 2050 and year 2100 design flood levels (either
upwards or downwards). The results from the 2012 Lake Macquarie
Waterway Flood Study (Reference 6) indicate that a 10% increase would
raise the 100 year ARI flood levels by 0.12 m.
Climate change may also increase the ocean storm surge and wave setup
components incorporated in establishing the design ocean levels adopted
in the 2012 Lake Macquarie Waterway Flood Study (Reference 6). These
issues have also been investigated in that study and conclude that ocean
storm surge, wave setup and associated factors may increase design flood
levels in Lake Macquarie by 0.15 m. This potential increase in design flood
levels has not been included in estimation of the year 2050 or year 2100
design flood level estimation as there is no certainty that such an increase
will occur.
Wind setup on Lake Macquarie (the effect of wind pushing water into a
bay) may raise water levels in a local area and was investigated in the 2012
Lake Macquarie Waterway Flood Study (Reference 6). Wind setup has
been estimated to raise local water levels by less than 0.1 m. The effect of
climate change on wind setup may potentially increase this by 0.05 m.
Wind setup has not been included in establishing design flood levels for
year 2011, year 2050 or year 2100 conditions as it is a local condition, of
relatively small magnitude and will affect (if it occurs during the design
event) only a small percentage of the foreshore area.
Wave runup (waves break and runup the foreshore reaching a higher level
than the static water level) was investigated in the 2012 Lake Macquarie
Waterway Flood Study (Reference 6). For 47 of the 48 sites investigated
the maximum wave runup level (coincident with the 100 year ARI event)
above the static water level is 0.5 m or less. Wave runup is a very localised
effect that is highly influenced by the local topography and will likely not

Lake Macquarie Waterway Flood Risk Management Study and Plan
WMAwater
29076:LakeMacFRMS.docx:26 June 2012 18
extend beyond 50 m from the foreshore. It can be relatively easily
mitigated by a formal structure (mound or wall) or vegetation (mangroves or
trees). There are no reported occurrences of wave runup causing damage
to property or risk to life in the February 1990 or June 2007 events.
The 0.5 m freeboard above the 100 year ARI design flood level that is used
to establish the minimum floor level of a residential building caters for
uncertainty in design flood estimation, wind and wave action and local
hydraulic effects. The effect of sea level rise cannot be included within this
freeboard as it has been established with a reasonable degree of certainty
that it will occur (2010 Flood Risk Management Guide - Reference 3).
An overriding consideration in establishing the year 2050 and year 2100
design flood levels is that the assumed sea level rise has not yet occurred,
thus there is some additional freeboard allowance in the years leading up to
the year 2050 and 2100 should a large flood event occur prior to these
dates.
3.6.3. 0.5 m Freeboard
A freeboard allowance above the design standard (generally the 100 year ARI flood level) is
to provide reasonable certainty that other hydraulic effects do not compromise the adopted
standard. There is no technical reason that a 0.5 m freeboard and not some other value
(lower or higher) is applicable for Lake Macquarie. A review of the hydraulic effects included
in the freeboard indicates:
Uncertainties in design flood levels: Whilst there is always uncertainty in design
flood estimation the magnitude of any error for the Lake Macquarie waterway is
relatively small compared to river systems (say a maximum of ±0.3 m) due to the
small height difference between a PMF and say a 20 year ARI event (on river
systems there is a much greater range),
the effect of local hydraulics (say flow between buildings raising levels) is not a
factor at Lake Macquarie due to the relatively slow rate of rise of the floodwaters,
wave action (causing wave runup) will generally be 0.5 m or less and there is no
evidence that it has actually occurred. In the majority of the foreshore areas the
existing and proposed developments are outside the potential 50 m impact zone of
wave runup,
Climate change: Sea level rise has been considered separately (not within the
freeboard) as it has been established with a reasonable degree of certainty that it
will occur as stated in the 2010 Flood Risk Management Guide (Reference 3).
Other possible climate change effects are assumed to be included within the
freeboard as there is no certainty that they will occur and possibly some may
reduce flood levels (decrease in rainfall intensities may occur),
the very large area of the lake (110 km2) means that future development in the
catchment or filling of the floodplain will produce no significant increase in the
design flood levels and this component can effectively be ignored for the Lake
Macquarie waterway.

Lake Macquarie Waterway Flood Risk Management Study and Plan
WMAwater
29076:LakeMacFRMS.docx:26 June 2012 19
On the basis of the above assessment a freeboard of 0.5 m is reasonable.
3.7. Council’s Flood Policy
3.7.1. Flood Policy
Lake Macquarie City Council has had a development control policy for flood liable land for
over 30 years. It has varied over those years in response to more information becoming
available and as a reflection of NSW Government policy.
The policy as documented in the Council report of 6 April 1998 states:
• habitable rooms to be a minimum 500 mm above the 1:100 year flood levels for still
water conditions,
• non-habitable rooms to be at or above the 1:20 year flood level,
• commercial rooms to be a minimum 500 mm above the 1:100 year flood level,
• boat sheds to be constructed at the approved filling level if applicable, otherwise at
the natural surface level,
• floors of industrial buildings to be constructed at or above the 1:100 year flood level,
At particular locations, Council requires the applicant to provide a report from an appropriate
Consulting Engineer, showing:
• 1:100 year flood levels allowing for the effects of wind/wave action, at the site of the
proposed development,
• that the proposed development is capable of withstanding the effects of the
wind/wave action associated with a 1:100 year flood.
In 2008 Council applied new flood planning levels to these development criteria, to
incorporate the predicted effects of sea level rise in Lake Macquarie up to the year 2100.
3.7.2. Related Issues
The State Emergency Services has prepared (April 1996) a comprehensive Local
Flood Plan (a sub-plan of the Local Disaster Plan).
Council’s Sea Level Rise Policy and interim development assessment procedure
has been applied to new developments since 2008 with no significant objection from
developers or legal challenges.
Council’s Section 149 Certificate advises landowners if Council has a policy to
restrict development by reason of the likelihood of flooding, sea level rise or tidal
inundation. Since mid-2009 this notice is placed on all foreshore lots where any part
of the land is below the 3 mAHD contour.
Council is not aware of any quantitative flood damage data or complaints with
respect to wind/wave activity. It is also not aware of any quantitative flood damage
data as a result of the February 1990 or June 2007 events.

Lake Macquarie Waterway Flood Risk Management Study and Plan
WMAwater
29076:LakeMacFRMS.docx:26 June 2012 20
Council will provide (for a fee) a “Development Restrictions Certificate -
Flooding/Tidal Inundation/Climate Change” for a property. This certificate provides
flood information including Council’s flood planning level requirements, a survey of
the existing buildings and grounds and whether existing buildings comply with
Council’s present floor height policies.
Council will provide (for a fee) a Flood Control Land Certificate advising whether
complying development may be undertaken under the Exempt and Complying
Development Codes State Environmental Planning Policy.
In the past Council has issued Flood Awareness leaflets. Currently definitive flood
information is only provided to landowners via the “Development Restrictions Certificate”.
3.8. Previous Studies
3.8.1. Lake Macquarie Waterway Flood Study 2012 (Reference 6)
The 2012 Lake Macquarie Waterway Flood Study (Reference 6) provides the most up to
date information on design flood behaviour. This report was undertaken to update the
previous Lake Macquarie Flood Studies (References 7 and 8) undertaken in 1998.
The main reasons for updating the hydraulic modelling approach are as follows:
• use of a two dimensional (2D) hydraulic model,
• availability of detailed bathymetric data to better describe the bed of the
Swansea channel rather than the cross sections used previously,
• availability of Airborne Laser Scanning (ALS) survey that provides a very
accurate definition of the foreshore topography,
• a more detailed appraisal of design ocean level conditions,
• incorporation of predicted climate changes and sea level rises,
• incorporation of data for the June 2007 long weekend storm/flood event in the
calibration process, and
• incorporation of an “envelope” approach based on the maximum of an ocean
dominated event and a rainfall dominated event.
The adopted approach was to establish a TUFLOW 2D hydraulic model based on the
available bathymetric and ALS survey with inflows from a WBNM hydrologic model. A
calibration/verification was undertaken to the February 1990 and the June 2007 long
weekend storm/flood events. The model was then used for design flood estimation with
sensitivity analysis undertaken to determine the impacts of various model parameters.
An envelope approach of the ocean and rainfall dominated scenarios was adopted as
summarised in Section 3.5.
Climate Change
Global climate change is predicted to raise sea levels and possibly change local rainfall

Lake Macquarie Waterway Flood Risk Management Study and Plan
WMAwater
29076:LakeMacFRMS.docx:26 June 2012 21
intensities. The NSW Government has introduced a set of benchmarks for the assessment
of raised sea levels and guidelines for increases in design rainfall intensities (Flood Risk
Management Guide - Reference 3 and Floodplain Risk Management Guideline –Practical
Consideration of Climate Change – Reference 4). As a result, the following climate change
scenarios were analysed for the 5 year, 20 year and 100 year ARI events (results can be
interpolated for intermediate events).
Rainfall Induced flooding: increase in design rainfall of 10%, 20% and 30%,
Increase in mean sea levels: increase in sea level of 0.4 m and 0.9 m. All sea
level rise scenarios assume that the initial water level in the lake rises by a similar
amount to the sea level rise, thus for a 0.4 m sea level rise the initial water level
increases from 0.1 m to 0.5 m AHD,
Rainfall Induced flooding with increase in mean sea levels : combination of
increase in design rainfall (10%, 20% and 30%) and increase in sea level (0.4 m
and 0.9 m),
Ocean Induced flooding: increase in sea level of 0.4 m and 0.9 m.
A summary of the results are:
The effect of rainfall increase varies depending upon the size of the event. At the
5 year ARI level a 10% rainfall increase approximates a 0.05 m increase in peak
water level while at the 100 year ARI level the increase approximates a 0.12 m
increase.
The effect of a sea level rise varies depending upon the size of the event. At the 5
year ARI level a 0.4 m sea level rise approximates a 0.40 m increase in peak water
level while at the 100 year ARI level the increase approximates a 0.35 m increase.
Results for a combined sea level and rainfall increase for the rainfall dominated
scenario generally reflects the addition of the rainfall and sea level increases.
Results for the 5 year, 20 year and 100 year ARI events ocean dominated
scenarios indicates that flood levels will increase by a similar magnitude to the sea
level increase.
This report does not consider the effects of flooding due to a tsunami.
3.8.2. Lake Macquarie Floodplain Risk Management Study and Plan -
2000 (References 1 and 2)
The 2000 Lake Macquarie Floodplain Risk Management Study and 2001 Plan (References 1
and 2) provided an assessment of management measures to mitigate risk associated with
the flood planning levels predicted in the 1998 Lake Macquarie Flood Study (References 7
and 8). In summary the outcomes were:
flood mitigation dams, retarding basins, river improvement works and floodways
were considered not viable (largely on environmental, economic and practical
grounds),

Lake Macquarie Waterway Flood Risk Management Study and Plan
WMAwater
29076:LakeMacFRMS.docx:26 June 2012 22
no suitable sites for levees that would be supported by the residents were found,
local flooding causes inconvenience but does not reach floors levels. There are no
viable economic solutions but the problem should be monitored,
catchment treatment should be encouraged but would not reduce flood levels,
the wave runup effect is not well understood and should be monitored. Proposed
developments should not exacerbate the potential problems,
house raising is only suitable for a small number of buildings but should be
implemented where appropriate,
flood proofing is not viable for residential buildings but is appropriate for
commercial buildings,
improvements to flood related development controls were suggested,
no buildings were identified as suitable for voluntary purchase,
rezoning to remove existing flood liable buildings was considered unlikely to be
socially acceptable or sufficiently attractive to developers,
improvements to the flood warning, evacuation planning and flood awareness
procedures were supported,
development measures (climate change, further development and filling of the
floodplain) were addressed.
3.8.3. Lake Macquarie Adaptive Response of Estuarine Shores to Sea
Level Rise – 2010 (Reference 9)
The objective of this report was to gain an appreciation of how the foreshores of the Lake
Macquarie waterway might respond to rising sea levels Ten case study locations were
examined in terms of sediment/rock material, vegetation, back beach form and profile. The
study also examined wind and wave set up. The outcome was to develop a methodology to
investigate foreshore changes to sea level rise that can be re-applied at other sites.
The study established a hydrodynamic model to investigate shoreline erosion and recession.
The model simulated the effect of larger storms on the foreshore profile and was able to look
at seabed forces generated by storm waves at each location. The model results indicate the
factors affecting the shoreline response around the Lake Macquarie waterway are:
wave climate and near shore depth,
vegetation,
sediment type, and
sediment sources and sinks.
The study concluded that it was likely that the existing Lake Macquarie shoreline would shift
as a result of sea level rise and shoreline erosion. The extent of the inundation is dependant
on the topography, while the extent of erosion is dependant largely on the sediment type and
wave energy. Mapping potential risk from erosion is site specific and as such was not
incorporated into this plan.
Lake Macquarie Waterway Flood Risk Management Study and Plan
WMAwater
29076:LakeMacFRMS.docx:26 June 2012 23
4. STUDY AREA
4.1. Land Use
The majority of the lake perimeter is within the Lake Macquarie local government area (LGA),
with approximately 15% within the Wyong local Government area. The Wyong LGA includes
the land to the south around Point Wolstoncroft. Some key features of the Lake Macquarie
LGA (www.lakemac.com.au) are:
it is one of the fastest growing cities in the Hunter, and one of the largest cities in
New South Wales,
Lake Macquarie’s population is fast approaching 200,000,
Lake Macquarie is the Hunter region’s largest city, accounting for 37% of the Lower
Hunter population,
Lake Macquarie is the fourth most populous city in NSW, and the eighth most
populous city in Australia,
The population of Lake Macquarie is expected to grow by 60,000 to 70,000 people
over the next 25 years, which will create a demand for 36,500 new dwellings,
The percentage of population aged 55+ will increase from 29% to 39% of the total
population over the next 20 years.
However, whilst the LGA has experienced steady growth in recent times it is unlikely that the
pressure for increased housing densities or new subdivisions in the next (say) 50 years will
require the rezoning of any vacant land currently inundated in the Probable Maximum Flood
envelope. This is because there is a large amount of available land in the LGA outside this
envelope, though in many parts others issues may inhibit development. Higher density
development within the envelope has the potential to increase flood damages and risk to life
unless the flood problem is adequately addressed.
The land use (within the Lake Macquarie LGA) in the foreshore areas surrounding the lake
(assumed as land below 4 mAHD) comprises the full range of planning zones listed in Lake
Macquarie Local Environmental Plan 2004 namely:
Rural (1),
Residential (2.1 and 2.2),
Business (3),
Industrial (4),
Infrastructure (5),
Open Space (6),
Environmental Protection (7),
National Park (8),
Natural Resources (9), and
Investigation (10).
A summary of the number of properties within the above land use zones and having some
part of their property below 4 mAHD is shown on Table 8.

Lake Macquarie Waterway Flood Risk Management Study and Plan
WMAwater
29076:LakeMacFRMS.docx:26 June 2012 24
Table 8: Land Use for Lake Macquarie Waterway Foreshore Properties (below 4 mAHD)
Suburb No.
Prop Zone 1.1
Zone 1.2
Zone 2.1
Zone 2.2
Zone 3
Zone 4
Zone 5
Zone 6
Zone 7
Zone 8
Zone 9
Zone 10
Arcadia Vale 112 0 0 104 0 0 0 0 8 0 0 0 0
Argenton 37 0 0 0 25 2 2 2 5 1 0 0 0
Balcolyn 195 0 0 181 0 0 0 0 5 9 0 0 0
Balmoral 86 0 0 79 0 0 0 0 2 5 0 0 0
Barnsley 94 0 0 3 0 0 4 0 31 55 0 0 1
Belmont 646 0 0 216 207 158 0 6 46 13 0 0 0
Belmont North 1 0 0 0 0 0 0 0 0 1 0 0 0
Belmont South 423 0 0 408 0 0 0 1 9 5 0 0 0
Blackalls Park 366 0 32 245 29 0 0 4 21 34 0 1 0
Blacksmiths 769 0 0 296 408 20 0 0 24 21 0 0 0
Bolton Point 93 0 0 85 0 0 0 0 6 1 1 0 0
Bonnells Bay 411 0 0 339 50 4 0 0 10 5 2 0 1
Boolaroo 207 0 0 175 1 0 23 0 8 0 0 0 0
Booragul 108 0 0 98 0 0 0 0 9 1 0 0 0
Brightwaters 242 0 0 229 0 0 0 0 1 12 0 0 0
Buttaba 91 0 0 85 0 0 0 0 3 3 0 0 0
Cameron Park 1 0 0 0 0 0 0 0 1 0 0 0 0
Cams Wharf 18 0 1 0 0 0 0 0 9 8 0 0 0
Cardiff 2 0 0 0 0 0 0 1 0 1 0 0 0
Carey Bay 109 0 0 97 6 0 0 0 6 0 0 0 0
Caves Beach 137 0 0 118 0 0 14 0 3 2 0 0 0
Coal Point 349 0 0 342 0 0 0 0 6 1 0 0 0
Cooranbong 304 27 46 147 2 0 3 5 4 66 0 0 4
Crangan Bay 0 0 0 0 0 0 0 0 0 0 0 0 0
Croudace Bay 81 0 0 76 0 0 0 1 4 0 0 0 0
Dora Creek 781 7 20 642 0 13 3 3 15 78 0 0 0
Edgeworth 449 0 0 329 27 19 27 1 42 4 0 0 0
Eleebana 135 0 18 101 0 0 0 2 8 5 0 0 1
Eraring 60 0 25 0 0 0 1 0 1 33 0 0 0
Fassifern 172 0 0 105 34 3 0 6 18 0 0 2 4
Fennell Bay 134 0 0 86 39 0 0 1 7 0 0 0 1
Fishing Point 180 0 0 177 0 0 0 0 3 0 0 0 0
Glendale 73 0 0 3 51 7 4 0 7 1 0 0 0
Kilaben Bay 173 0 5 160 0 0 0 0 5 3 0 0 0
Lake Macquarie 5 0 0 0 0 0 0 2 0 2 0 1 0
Little Pelican 1 0 0 0 0 0 0 0 0 1 0 0 0
Mandalong 11 6 0 0 0 0 0 0 0 4 0 1 0
Marks Point 594 0 0 333 215 8 0 3 25 10 0 0 0
Marmong Point 85 0 0 73 0 6 0 0 5 1 0 0 0
Martinsville 5 0 1 0 0 0 0 0 0 4 0 0 0
Mirrabooka 41 0 0 37 0 0 0 0 2 1 0 1 0
Morisset 145 19 23 41 0 0 5 2 2 50 0 0 3
Morisset Park 128 0 0 92 0 0 0 0 17 19 0 0 0
Murrays Beach 14 0 0 0 0 0 0 0 9 0 0 0 5
Myuna Bay 6 0 0 0 0 0 0 0 1 5 0 0 0
Nords Wharf 124 0 0 111 0 0 0 0 9 4 0 0 0
Pelican 374 0 0 360 0 0 0 0 8 6 0 0 0
Pinny Beach 1 0 0 0 0 0 0 0 0 0 0 0 1
Rathmines 103 0 0 75 2 2 0 1 10 13 0 0 0
Silverwater 75 0 0 71 0 0 0 0 0 4 0 0 0
Speers Point 195 0 0 82 87 11 5 0 10 0 0 0 0
Sunshine 117 0 0 111 0 0 0 0 5 1 0 0 0
Swansea 1678 0 0 766 760 86 0 7 40 19 0 0 0
Swansea Heads 30 0 0 8 0 0 0 0 0 22 0 0 0
Teralba 202 2 4 18 104 22 7 6 20 17 0 2 0
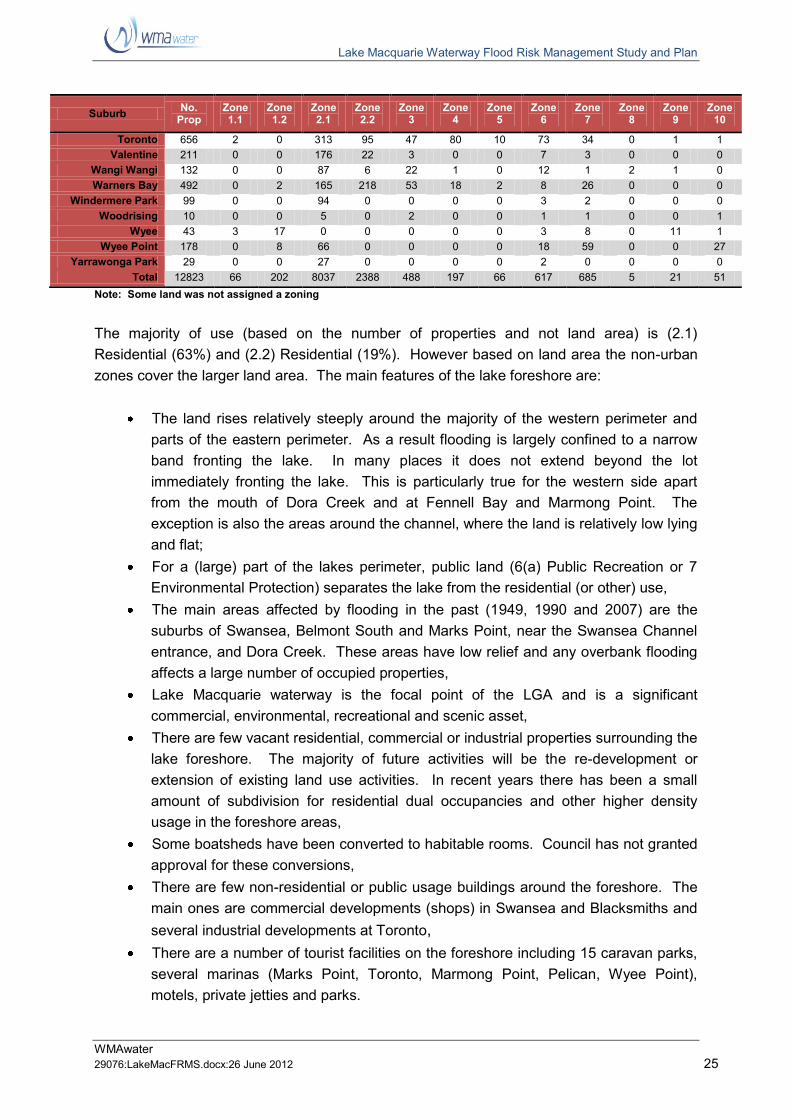
Lake Macquarie Waterway Flood Risk Management Study and Plan
WMAwater
29076:LakeMacFRMS.docx:26 June 2012 25
Note: Some land was not assigned a zoning
The majority of use (based on the number of properties and not land area) is (2.1)
Residential (63%) and (2.2) Residential (19%). However based on land area the non-urban
zones cover the larger land area. The main features of the lake foreshore are:
The land rises relatively steeply around the majority of the western perimeter and
parts of the eastern perimeter. As a result flooding is largely confined to a narrow
band fronting the lake. In many places it does not extend beyond the lot
immediately fronting the lake. This is particularly true for the western side apart
from the mouth of Dora Creek and at Fennell Bay and Marmong Point. The
exception is also the areas around the channel, where the land is relatively low lying
and flat;
For a (large) part of the lakes perimeter, public land (6(a) Public Recreation or 7
Environmental Protection) separates the lake from the residential (or other) use,
The main areas affected by flooding in the past (1949, 1990 and 2007) are the
suburbs of Swansea, Belmont South and Marks Point, near the Swansea Channel
entrance, and Dora Creek. These areas have low relief and any overbank flooding
affects a large number of occupied properties,
Lake Macquarie waterway is the focal point of the LGA and is a significant
commercial, environmental, recreational and scenic asset,
There are few vacant residential, commercial or industrial properties surrounding the
lake foreshore. The majority of future activities will be the re-development or
extension of existing land use activities. In recent years there has been a small
amount of subdivision for residential dual occupancies and other higher density
usage in the foreshore areas,
Some boatsheds have been converted to habitable rooms. Council has not granted
approval for these conversions,
There are few non-residential or public usage buildings around the foreshore. The
main ones are commercial developments (shops) in Swansea and Blacksmiths and
several industrial developments at Toronto,
There are a number of tourist facilities on the foreshore including 15 caravan parks,
several marinas (Marks Point, Toronto, Marmong Point, Pelican, Wyee Point),
motels, private jetties and parks.
Suburb No.
Prop Zone 1.1
Zone 1.2
Zone 2.1
Zone 2.2
Zone 3
Zone 4
Zone 5
Zone 6
Zone 7
Zone 8
Zone 9
Zone 10
Toronto 656 2 0 313 95 47 80 10 73 34 0 1 1
Valentine 211 0 0 176 22 3 0 0 7 3 0 0 0
Wangi Wangi 132 0 0 87 6 22 1 0 12 1 2 1 0
Warners Bay 492 0 2 165 218 53 18 2 8 26 0 0 0
Windermere Park 99 0 0 94 0 0 0 0 3 2 0 0 0
Woodrising 10 0 0 5 0 2 0 0 1 1 0 0 1
Wyee 43 3 17 0 0 0 0 0 3 8 0 11 1
Wyee Point 178 0 8 66 0 0 0 0 18 59 0 0 27
Yarrawonga Park 29 0 0 27 0 0 0 0 2 0 0 0 0
Total 12823 66 202 8037 2388 488 197 66 617 685 5 21 51
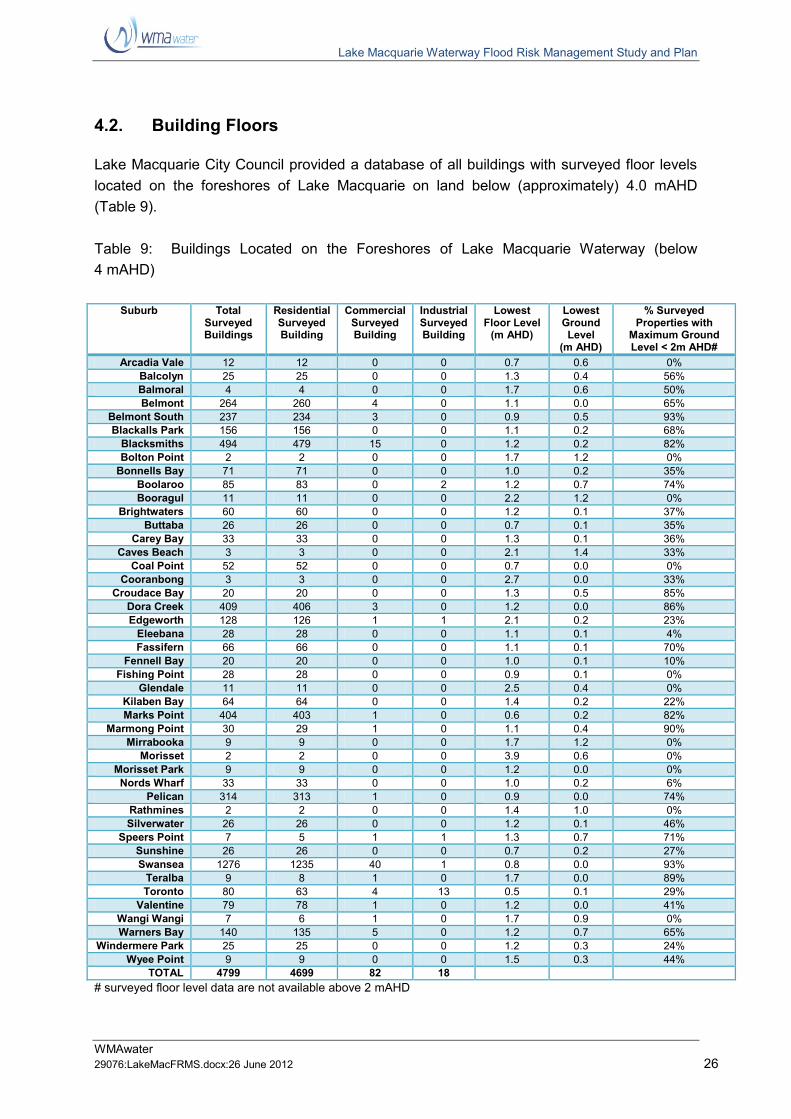
Lake Macquarie Waterway Flood Risk Management Study and Plan
WMAwater
29076:LakeMacFRMS.docx:26 June 2012 26
4.2. Building Floors
Lake Macquarie City Council provided a database of all buildings with surveyed floor levels
located on the foreshores of Lake Macquarie on land below (approximately) 4.0 mAHD
(Table 9).
Table 9: Buildings Located on the Foreshores of Lake Macquarie Waterway (below
4 mAHD)
Suburb Total Surveyed Buildings
Residential Surveyed Building
Commercial Surveyed Building
Industrial Surveyed Building
Lowest Floor Level
(m AHD)
Lowest Ground Level
(m AHD)
% Surveyed Properties with
Maximum Ground Level < 2m AHD#
Arcadia Vale 12 12 0 0 0.7 0.6 0%
Balcolyn 25 25 0 0 1.3 0.4 56%
Balmoral 4 4 0 0 1.7 0.6 50%
Belmont 264 260 4 0 1.1 0.0 65%
Belmont South 237 234 3 0 0.9 0.5 93%
Blackalls Park 156 156 0 0 1.1 0.2 68%
Blacksmiths 494 479 15 0 1.2 0.2 82%
Bolton Point 2 2 0 0 1.7 1.2 0%
Bonnells Bay 71 71 0 0 1.0 0.2 35%
Boolaroo 85 83 0 2 1.2 0.7 74%
Booragul 11 11 0 0 2.2 1.2 0%
Brightwaters 60 60 0 0 1.2 0.1 37%
Buttaba 26 26 0 0 0.7 0.1 35%
Carey Bay 33 33 0 0 1.3 0.1 36%
Caves Beach 3 3 0 0 2.1 1.4 33%
Coal Point 52 52 0 0 0.7 0.0 0%
Cooranbong 3 3 0 0 2.7 0.0 33%
Croudace Bay 20 20 0 0 1.3 0.5 85%
Dora Creek 409 406 3 0 1.2 0.0 86%
Edgeworth 128 126 1 1 2.1 0.2 23%
Eleebana 28 28 0 0 1.1 0.1 4%
Fassifern 66 66 0 0 1.1 0.1 70%
Fennell Bay 20 20 0 0 1.0 0.1 10%
Fishing Point 28 28 0 0 0.9 0.1 0%
Glendale 11 11 0 0 2.5 0.4 0%
Kilaben Bay 64 64 0 0 1.4 0.2 22%
Marks Point 404 403 1 0 0.6 0.2 82%
Marmong Point 30 29 1 0 1.1 0.4 90%
Mirrabooka 9 9 0 0 1.7 1.2 0%
Morisset 2 2 0 0 3.9 0.6 0%
Morisset Park 9 9 0 0 1.2 0.0 0%
Nords Wharf 33 33 0 0 1.0 0.2 6%
Pelican 314 313 1 0 0.9 0.0 74%
Rathmines 2 2 0 0 1.4 1.0 0%
Silverwater 26 26 0 0 1.2 0.1 46%
Speers Point 7 5 1 1 1.3 0.7 71%
Sunshine 26 26 0 0 0.7 0.2 27%
Swansea 1276 1235 40 1 0.8 0.0 93%
Teralba 9 8 1 0 1.7 0.0 89%
Toronto 80 63 4 13 0.5 0.1 29%
Valentine 79 78 1 0 1.2 0.0 41%
Wangi Wangi 7 6 1 0 1.7 0.9 0%
Warners Bay 140 135 5 0 1.2 0.7 65%
Windermere Park 25 25 0 0 1.2 0.3 24%
Wyee Point 9 9 0 0 1.5 0.3 44%
TOTAL 4799 4699 82 18
# surveyed floor level data are not available above 2 mAHD
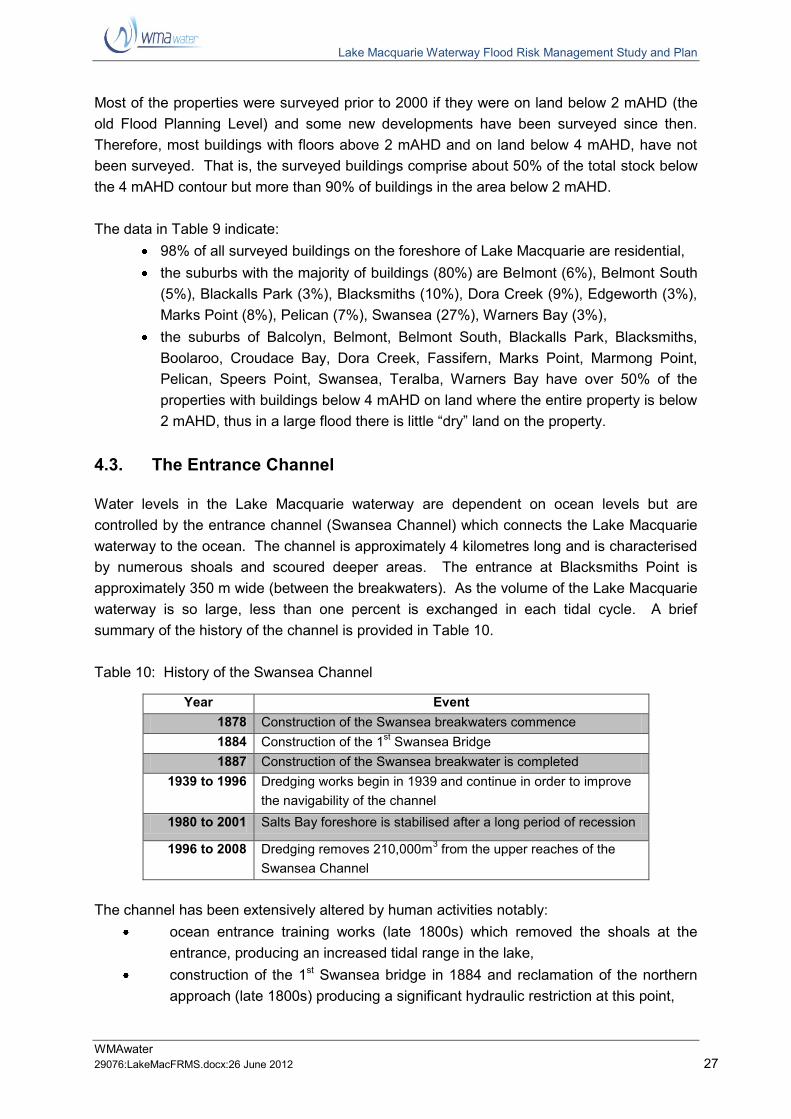
Lake Macquarie Waterway Flood Risk Management Study and Plan
WMAwater
29076:LakeMacFRMS.docx:26 June 2012 27
Most of the properties were surveyed prior to 2000 if they were on land below 2 mAHD (the
old Flood Planning Level) and some new developments have been surveyed since then.
Therefore, most buildings with floors above 2 mAHD and on land below 4 mAHD, have not
been surveyed. That is, the surveyed buildings comprise about 50% of the total stock below
the 4 mAHD contour but more than 90% of buildings in the area below 2 mAHD.
The data in Table 9 indicate:
98% of all surveyed buildings on the foreshore of Lake Macquarie are residential,
the suburbs with the majority of buildings (80%) are Belmont (6%), Belmont South
(5%), Blackalls Park (3%), Blacksmiths (10%), Dora Creek (9%), Edgeworth (3%),
Marks Point (8%), Pelican (7%), Swansea (27%), Warners Bay (3%),
the suburbs of Balcolyn, Belmont, Belmont South, Blackalls Park, Blacksmiths,
Boolaroo, Croudace Bay, Dora Creek, Fassifern, Marks Point, Marmong Point,
Pelican, Speers Point, Swansea, Teralba, Warners Bay have over 50% of the
properties with buildings below 4 mAHD on land where the entire property is below
2 mAHD, thus in a large flood there is little “dry” land on the property.
4.3. The Entrance Channel
Water levels in the Lake Macquarie waterway are dependent on ocean levels but are
controlled by the entrance channel (Swansea Channel) which connects the Lake Macquarie
waterway to the ocean. The channel is approximately 4 kilometres long and is characterised
by numerous shoals and scoured deeper areas. The entrance at Blacksmiths Point is
approximately 350 m wide (between the breakwaters). As the volume of the Lake Macquarie
waterway is so large, less than one percent is exchanged in each tidal cycle. A brief
summary of the history of the channel is provided in Table 10.
Table 10: History of the Swansea Channel
Year Event
1878 Construction of the Swansea breakwaters commence
1884 Construction of the 1st Swansea Bridge
1887 Construction of the Swansea breakwater is completed
1939 to 1996 Dredging works begin in 1939 and continue in order to improve
the navigability of the channel
1980 to 2001 Salts Bay foreshore is stabilised after a long period of recession
1996 to 2008 Dredging removes 210,000m3 from the upper reaches of the
Swansea Channel
The channel has been extensively altered by human activities notably:
ocean entrance training works (late 1800s) which removed the shoals at the
entrance, producing an increased tidal range in the lake,
construction of the 1st Swansea bridge in 1884 and reclamation of the northern
approach (late 1800s) producing a significant hydraulic restriction at this point,
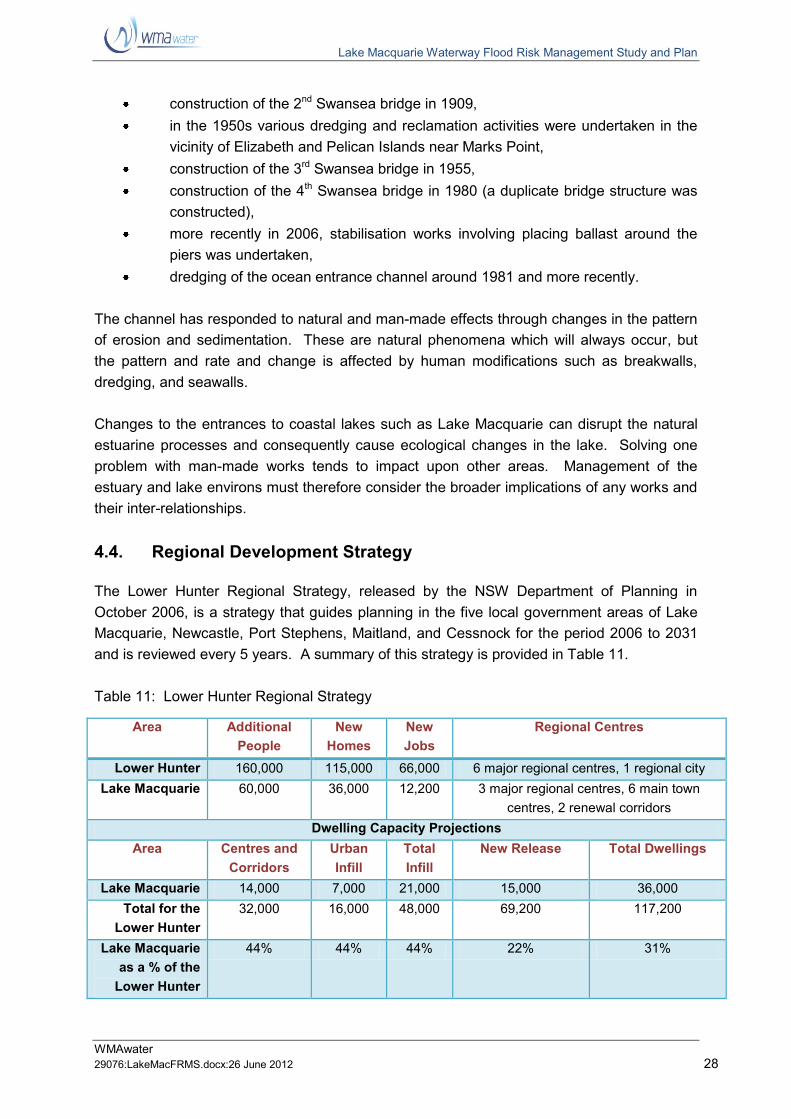
Lake Macquarie Waterway Flood Risk Management Study and Plan
WMAwater
29076:LakeMacFRMS.docx:26 June 2012 28
construction of the 2nd Swansea bridge in 1909,
in the 1950s various dredging and reclamation activities were undertaken in the
vicinity of Elizabeth and Pelican Islands near Marks Point,
construction of the 3rd Swansea bridge in 1955,
construction of the 4th Swansea bridge in 1980 (a duplicate bridge structure was
constructed),
more recently in 2006, stabilisation works involving placing ballast around the
piers was undertaken,
dredging of the ocean entrance channel around 1981 and more recently.
The channel has responded to natural and man-made effects through changes in the pattern
of erosion and sedimentation. These are natural phenomena which will always occur, but
the pattern and rate and change is affected by human modifications such as breakwalls,
dredging, and seawalls.
Changes to the entrances to coastal lakes such as Lake Macquarie can disrupt the natural
estuarine processes and consequently cause ecological changes in the lake. Solving one
problem with man-made works tends to impact upon other areas. Management of the
estuary and lake environs must therefore consider the broader implications of any works and
their inter-relationships.
4.4. Regional Development Strategy
The Lower Hunter Regional Strategy, released by the NSW Department of Planning in
October 2006, is a strategy that guides planning in the five local government areas of Lake
Macquarie, Newcastle, Port Stephens, Maitland, and Cessnock for the period 2006 to 2031
and is reviewed every 5 years. A summary of this strategy is provided in Table 11.
Table 11: Lower Hunter Regional Strategy
Area Additional
People
New
Homes
New
Jobs
Regional Centres
Lower Hunter 160,000 115,000 66,000 6 major regional centres, 1 regional city
Lake Macquarie 60,000 36,000 12,200 3 major regional centres, 6 main town
centres, 2 renewal corridors
Dwelling Capacity Projections
Area Centres and
Corridors
Urban
Infill
Total
Infill
New Release Total Dwellings
Lake Macquarie 14,000 7,000 21,000 15,000 36,000
Total for the
Lower Hunter
32,000 16,000 48,000 69,200 117,200
Lake Macquarie
as a % of the
Lower Hunter
44% 44% 44% 22% 31%

Lake Macquarie Waterway Flood Risk Management Study and Plan
WMAwater
29076:LakeMacFRMS.docx:26 June 2012 29
The strategy highlights the risk of flooding and states that “Future urban development will not
be located in areas of high risk from natural hazards, including sea level rise, coastal
recession, rising water table and flooding”.
Despite this statement, the pressure to accommodate an additional 115,000 new dwellings
by the year 2031 may mean that areas at future risk of flooding are considered for continued
development. Any proposals in these areas must carefully consider the impacts of future
flooding.
4.5. Environmental Summary
The 1997 Lake Macquarie Estuary Management Plan (Reference 10) described the
environmental qualities of the Lake Macquarie waterway in detail. The values of the Lake
Macquarie waterway identified in the 1997 Lake Macquarie Estuary Management Plan
included:
foreshore and waterway recreational activities;
tourism;
commercial and recreational fish stocks;
biodiversity, including estuarine habitats such as wetlands and seagrass beds; and
major industrial and commercial operations.
The major recommendations and actions of the 1997 Lake Macquarie Estuary Management
Plan (Reference 10) were to:
Establish suitable management structures, including the Office of the Lake
Macquarie and Catchment Coordinator, and the Lake Macquarie Coastal and
Estuary Management Committee.
Manage navigation issues in the entrance channel, including studies to
establish the optimum ‘stable’ channel configuration, and a series of dredging
and channel modification programs to improve the navigation channel.
Manage sedimentation and navigation issues in the lake, including a program to
remove ‘black ooze’ in some locations.
Reduce entrance channel foreshore erosion, particularly works to stabilise the
foreshore at Salts Bay, Coon Island, Pelican, and Black Neds Bay.
Improve water quality, with catchment management measures and stormwater
controls, including the construction of wetlands and SQIDs on creeks and
drainage lines.
Protect ecology, by improving water quality and protecting ecosystems such as
seagrass beds, mangroves, and saltmarsh.
Maintain fisheries, through healthy ecosystems and by removing commercial
fishing from the lake.
Foreshore management by encouraging protection of natural foreshores, and
controlling construction of foreshore infrastructure such as seawalls, boat
ramps, and jetties.

Lake Macquarie Waterway Flood Risk Management Study and Plan
WMAwater
29076:LakeMacFRMS.docx:26 June 2012 30
4.6. Community Consultation
4.6.1. Stakeholder Consultation Plan
Council engaged consultants Molino Stewart Pty Ltd to help prepare and implement a
stakeholder consultation plan associated with the public exhibition of the draft Lake
Macquarie Waterway Flood Study and Lake Macquarie Waterway Flood Risk Management
Study and Plan in October and November 2011. A copy of their report is provided as
Appendix D.
4.6.2. Outline of Plan
The draft Lake Macquarie Waterway Flood Study and Lake Macquarie Waterway Flood Risk
Management Study and Plan were placed on public exhibition from 13 October to 28
November 2011, and members of the public were invited to make submissions. Copies of
the reports were available from Council libraries, the Customer Service Centre and from
Council’s website, along with an electronic survey and feedback form.
Owners of all foreshore properties below 3 mAHD (approximately 7700 property owners)
were direct-mailed information about the studies, with an invitation to attend one of six
information sessions and workshops held at Morisset, Toronto, Boolaroo, Charlestown,
Belmont and Swansea in November 2011.
More than 370 people attended the workshops. The evaluation surveys showed that, on
average, more than 80% of participants were satisfied or highly satisfied with all elements of
the workshops. The lowest rating was given to the ‘quality of information’, almost certainly
reflecting the dissatisfaction of those participants who didn’t accept the science of climate
change and sea level rise. Workshop participants filled in a survey covering their attitudes to
major issues, and their level of agreement with the proposed flood risk management options.
As well, their comments during small-group discussions were recorded and collated, and
other comments were collected on a message board.
Other elements of the consultation included:
Feedback from the Lake Macquarie Floodplain Management Committee, Lake
Macquarie Community Advisory Group, Lake Macquarie Developers Forum, and
Lake Macquarie City Council,
Direct mail and requests to make submissions to more than 60 business chambers,
development industry groups, infrastructure providers, community environment
groups, and NSW government agencies.

Lake Macquarie Waterway Flood Risk Management Study and Plan
WMAwater
29076:LakeMacFRMS.docx:26 June 2012 31
4.6.3. Summary of Responses
The summary of the responses to the workshop and on-line surveys (345 received) is
contained in the report by Molino Stewart in Appendix D. The Molino Stewart report also
includes a précis of the issues raised in small-group workshop discussions and via the
message board.
Written submissions were received from 22 residents and stakeholder organisations. A
summary of the submissions and Council’s response is provided in Table 12 and discussed
in the following sections.
TECHNICAL CORRECTIONS AND SUGGESTIONS
A few submissions pointed out errors or inconsistencies in the text or in the assumptions
made in the flood modelling.
Council response
Response to submissions suggesting technical improvements and corrections are listed in
the table below, and some detailed responses have been sent individually. Several changes
have been made to the draft reports in response to these submissions.
MANAGEMENT OPTIONS
There were several suggestions supporting or opposing various management options
proposed in the Draft Flood Risk Management Study and Plan (such as seawalls, dredging
etc.).
Council response
These suggestions will be considered, along with the outcome of the community survey and
community workshops, when Council approves its recommendations for action after the
Study and Plan are adopted. Some suggestions, such as widening or deepening Swansea
Channel, have already been rejected by the report as they do not reduce the effects of
flooding in the lake, and may actually make it worse.

Lake Macquarie Waterway Flood Risk Management Study and Plan
WMAwater
29076:LakeMacFRMS.docx:26 June 2012 32
Table 12: Summary of Submissions of – Draft Lake Macquarie Waterway Flood Study and Flood Risk Management Study and Plan
Name/organisation Key points of submission Response to submission
Resident 1 Questions the science behind sea temperature increase and
sea level rise. Proposes alternative analysis based on own
(unpublished) research.
Covered in summary response (see above)
Resident 1 Queries calculation of 1.0 metre lake rise as sea level rises,
and the calculation of 1:100 flood level.
Misreading of the report – no change required
Resident 1 Comments on generation of tsunamis and response of
oceans to low pressure systems
Tsunami not included in Flood Study – separate study
underway by NSW Government.
Resident 2 Waste of time and money. Will Council compensate for a
drop in property value?
Covered in summary response (see above)
Resident 3 Questions the science of sea level rise Covered in summary response (see above)
Resident 4 Need plain-English summary of Study and Plan to make
them more accessible. Recommends adaptable buildings
and innovative design to make buildings more flood proof eg.
floating homes, waterproof cupboards. Change regulations
to encourage innovative design.
Will be considered when implementing management
recommendations and developing Local Area
Adaptation Plans.
Resident 5 Supports seawall to protect properties in her area, but
recognises problems with foreshore access for sailors.
Doesn’t support use of rock gabions for seawall construction.
Will be considered when implementing management
recommendations and developing Local Area
Adaptation Plans.
Resident 6 Supports recommended management options. Options will
vary from place to place – no “one-size-fits-all” solution.
Asks for regular review of science and education of the
public. Some properties may have to be sacrificed.
Will be considered when implementing management
recommendations and developing Local Area
Adaptation Plans.
Resident 7 Request photos be changed in Figure 12 of the Flood Study Report amended
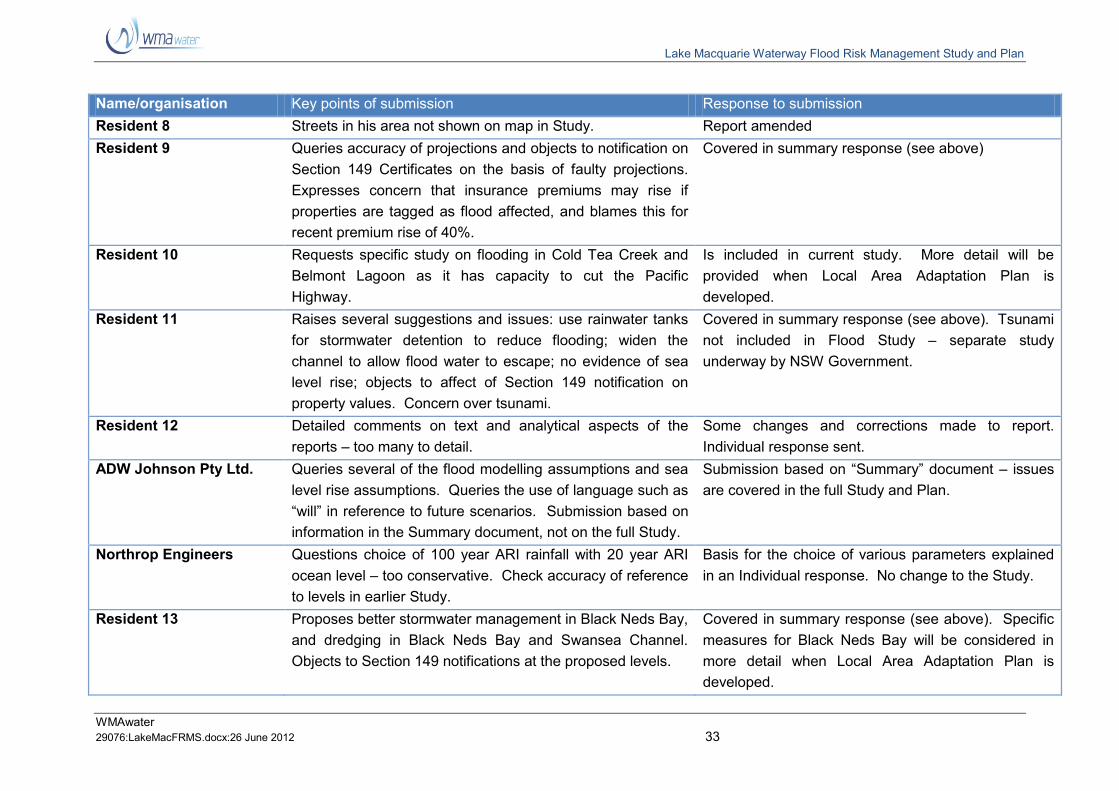
Lake Macquarie Waterway Flood Risk Management Study and Plan
WMAwater
29076:LakeMacFRMS.docx:26 June 2012 33
Name/organisation Key points of submission Response to submission
Resident 8 Streets in his area not shown on map in Study. Report amended
Resident 9 Queries accuracy of projections and objects to notification on
Section 149 Certificates on the basis of faulty projections.
Expresses concern that insurance premiums may rise if
properties are tagged as flood affected, and blames this for
recent premium rise of 40%.
Covered in summary response (see above)
Resident 10 Requests specific study on flooding in Cold Tea Creek and
Belmont Lagoon as it has capacity to cut the Pacific
Highway.
Is included in current study. More detail will be
provided when Local Area Adaptation Plan is
developed.
Resident 11 Raises several suggestions and issues: use rainwater tanks
for stormwater detention to reduce flooding; widen the
channel to allow flood water to escape; no evidence of sea
level rise; objects to affect of Section 149 notification on
property values. Concern over tsunami.
Covered in summary response (see above). Tsunami
not included in Flood Study – separate study
underway by NSW Government.
Resident 12 Detailed comments on text and analytical aspects of the
reports – too many to detail.
Some changes and corrections made to report.
Individual response sent.
ADW Johnson Pty Ltd. Queries several of the flood modelling assumptions and sea
level rise assumptions. Queries the use of language such as
“will” in reference to future scenarios. Submission based on
information in the Summary document, not on the full Study.
Submission based on “Summary” document – issues
are covered in the full Study and Plan.
Northrop Engineers Questions choice of 100 year ARI rainfall with 20 year ARI
ocean level – too conservative. Check accuracy of reference
to levels in earlier Study.
Basis for the choice of various parameters explained
in an Individual response. No change to the Study.
Resident 13 Proposes better stormwater management in Black Neds Bay,
and dredging in Black Neds Bay and Swansea Channel.
Objects to Section 149 notifications at the proposed levels.
Covered in summary response (see above). Specific
measures for Black Neds Bay will be considered in
more detail when Local Area Adaptation Plan is
developed.

Lake Macquarie Waterway Flood Risk Management Study and Plan
WMAwater
29076:LakeMacFRMS.docx:26 June 2012 34
Name/organisation Key points of submission Response to submission
Resident 14 Questions the science of sea level rise, and attaches several
letters and newspaper stories in support. Because science
is wrong, then other measures incorporating sea level rise
are unnecessary.
Covered in summary response (see above)
Belmont Chamber of
Commerce
Asking if land will be rezoned as a result of the Study and
Plan, and if owners will be compensated for loss of value.
Covered in summary response (see above).
Individual response sent to answer some specific
questions asked in the submission.
Gosford City Council Discrepancy between management options, with options (eg.
house-raising) seeming to be favoured in some parts of the
report, and dismissed in late sections. No costing of
management options.
Will be considered in more detail, including costing,
when Local Area Adaptation Plans are developed.
Resident 15 Questions the science of sea level rise. Suggests better
management of stormwater in catchments would reduce lake
flooding.
Covered in summary response (see above)
Resident 16 Questions the science behind sea level rise and provides
own analysis.
Covered in summary response (see above)
Resident 17 Questions the science of global warming and sea level rise. Covered in summary response (see above)
Hunter Water Corporation Concerned with effect of possible changes in development
intensity on service costs to affected areas. If new
development areas are needed or ‘development rights’ are
transferred, there is no guarantee that services can be
provided to new areas. Requested access to Flood Study
data to assist in their vulnerability mapping for HWC assets.
Individual response. No changes in urban planning
patterns or densities without consultation with HWC
and other service providers. No problem with access
to Flood Study data and analysis.
Lake Macquarie Waterway Flood Risk Management Study and Plan
WMAwater
29076:LakeMacFRMS.docx:26 June 2012 35
PROPERTY PLANNING
Several submissions raised concerns about notifications on Section 149 property certificates,
effects on property values, future insurance costs, and compensation for potential future
changes in property value.
Council Response
Council is obliged by law to indicate on Section 149 property certificates any special
development restrictions that are attached to properties. Since 2009, all flood-exposed
properties located below the 3 metre AHD topographic contour have had a notation
indicating that they may be affected by sea level rise and lake flooding. As a result of the
current study we are proposing to restrict the notification of sea level rise effects to
properties below the 1 metre AHD topographic contour, so fewer properties will carry this
notification. The lake flooding notification will remain on properties below the 3 metre
AHD topographic contour.
Council cannot predict the likely effects on property values of a notation on Section 149
property certificates. However, there has been no overall market effect since the Section
149 notification was added, in 2009, to all properties below the 3 metre AHD topographic
contour. The effects, if any, are likely to be small compared to other market factors such
as interest rates, demand for waterfront properties, and economic climate.
There is not expected to be any change in the cost or availability of flood insurance for
properties as a result of the Lake Macquarie Waterway Flood Risk Management Study
and Plan. This is because there are no additional properties identified as affected by
flood or sea level rise. In general, the availability of flood insurance can be greater in
localities, such as Lake Macquarie City, where Councils have well-developed flood risk
management plans, and impose restrictions such as floor height requirements on new
buildings in flood-affected areas. However, some insurance companies may charge
differential premiums based on their assessment of flood risk on an individual property.
It is up to the companies if they use the Section 149 property certificate for this (some
do, some don’t), and several companies now offer a “universal” flood cover irrespective
of property location. Council is planning to negotiate with insurance retailers in 2012 to
gain better recognition of the reduction in risk from flooding as a result of the Lake
Macquarie Waterway Flood Risk Management Study and Plan.
If there is a change in property values in flood-affected areas as assessed by the Valuer-
General, there will be a related change in Council rates payable on these properties.
There is currently no avenue for compensation if there is a reduction in the Valuer-
General’s assessment of the value of a property.
THE SCIENCE OF SEA LEVEL RISE
A number of submissions questioned the science behind the adopted sea level rise predictions
that underpin the Lake Macquarie Waterway Flood Study and Lake Macquarie Waterway Flood
Risk Management Study and Plan.
Council response
The feedback was considered, but there will be no change to this aspect of the reports. Some
of the reasons for maintaining these predicted levels of sea level rise are:
Lake Macquarie Waterway Flood Risk Management Study and Plan
WMAwater
29076:LakeMacFRMS.docx:26 June 2012 36
The background reports are based on peer-reviewed scientific studies that have been
incorporated into scientific reviews such as those prepared by the Intergovernmental
Panel on Climate Change (IPCC), US National Aeronautical and Space Administration
(NASA), Bureau of Meteorology (BOM), and the Commonwealth Scientific and Industrial
Research Organisation (CSIRO).
Both NSW State Government Policy Statement (2009) and Lake Macquarie City Council
Policy (2008) require Council to include consideration of sea level rise when planning for
new developments. The NSW State Government Sea Level Rise Policy Statement
(2009) requires Council to use benchmarks of 0.4 metres of sea level rise by 2050, and
0.9 metres of sea level rise by 2100. These are the levels that have been adopted in the
Lake Macquarie Waterway Flood Study. The basis for these levels is set out in
Technical note: Derivation of the NSW Government’s sea level rise planning benchmarks
(2009).
None of the feedback presented information from peer-reviewed scientific publications
that would require any change to the predicted levels.
As new and better scientific information is published, the flood and permanent inundation
levels in the Lake Macquarie Flood Study will be reviewed and up-dated as required,
within the legal framework set by the NSW Government.
4.6.4. Conclusions
From all responses received from the workshops, community surveys, and written submissions
in relation to the draft Lake Macquarie Waterway Flood Study and Lake Macquarie Waterway
Flood Risk Management Study and Plan, the following general conclusions have been made by
Molino Stewart Pty Ltd (see Appendix D for full report):
Residents would like to be included in decisions relating to management of flooding and
sea level rise.
Economic considerations such as the protection of the value of private property and the
provision of compensation where property usability or value is negatively impacted are
very important to potentially flood-affected residents.
Residents want local-scale flood modification measures such as drains, levees and sea
walls to be used by Council to manage flood risk, but were not supportive of ‘big’ projects
such as dams and entrance barriers.
Response modification measures (eg. community education and improved warning
systems) and property modification measures are also favoured to manage flood risk
and sea level rise impacts.
A relatively high proportion of residents are sceptical about climate change and the
resultant sea level projections.
Many residents are concerned about the possible impact of sea level projections on their
property values.
Residents want Council to provide more and clearer information to them about flooding,
climate change and sea level rise, and keep them up-to-date with the latest information.

Lake Macquarie Waterway Flood Risk Management Study and Plan
WMAwater
29076:LakeMacFRMS.docx:26 June 2012 37
5. EXISTING FLOOD ENVIRONMENT
5.1. Flood Behaviour
Flooding on the Lake Macquarie foreshore may occur as a result of a combination of factors
including:
an elevated ocean level due to an ocean storm surge, wave setup at the entrance, a
high astronomic tide and or an increase in mean sea levels,
rainfall over the lake and the tributaries entering the Lake Macquarie waterway,
wind wave action causing wind setup and runup on the foreshore within the lake,
and/or
permanent and tidal inundation as a result of rising sea and lake levels.
One of the key considerations in modelling coastal systems is the probability of occurrence of a
combined ocean and rainfall event and the relative magnitude of both. It is considered to be
overly conservative to assume a 100 year ARI ocean event will occur concurrently with a 100
year ARI rainfall event, however there are no data available to accurately define a suitable
approach. For this reason, two scenarios were analysed: a Rainfall Dominated scenario which
assumes the design rainfall over the catchment in conjunction with a design ocean event of
equal or smaller magnitude and an Ocean Dominated scenario which assumes the design
ocean event in conjunction with the design rainfall of equal or smaller magnitude.
Further details of this approach are provided in the 2012 Lake Macquarie Waterway Flood Study
(Reference 6).
5.2. Hydraulic Classification
The 2005 NSW Government’s Floodplain Development Manual (Reference 5) defines three
hydraulic categories which could be applied to areas of the foreshore, namely floodway, flood
storage or flood fringe.
Floodways are “those areas of the floodplain where a significant discharge of water occurs
during floods. They are often aligned with naturally defined channels. Floodways are areas
that, even if only partially blocked, would cause a significant redistribution of flood flow, or a
significant increase in flood levels”. For the Lake Macquarie waterway the only floodway areas
are the Swansea Channel and the channels of the creeks (Dora, Cockle, North, South, Stony
and Marmong) entering the lake, and three floodways for over-bank flows in Dora Creek,
identified in the Dora Creek Floodplain Management Plan.
Flood storage areas are “those parts of the floodplain that are important for the temporary
storage of floodwaters during the passage of a flood. The extent and behaviour of flood storage
areas may change with flood severity, and loss of flood storage can increase the severity of
flood impacts by reducing natural flood attenuation. Hence, it is necessary to investigate a
range of flood sizes before defining flood storage areas.”.

Lake Macquarie Waterway Flood Risk Management Study and Plan
WMAwater
29076:LakeMacFRMS.docx:26 June 2012 38
Flood fringe is “the remaining area of flood prone land after floodway and flood storage areas
have been defined”.
There is no precise definition of flood storage and flood fringe or accepted approach to
differentiate between the two areas. For this study, it was assumed that all the land on the
perimeter of the lake is flood fringe. It is not referred to as flood storage as this implies that the
filling of this land will have some significant impact on flood levels by reducing the temporary
floodplain storage capacity. This is not the case at Lake Macquarie given the magnitude of the
lake (Table 2). Land beyond the perimeter of the lake and within the floodplains of the tributary
creeks (Dora, Cockle, North, South, Stony and Marmong Creeks) may be flood storage or
floodway when considering flow along those creeks (i.e as part of a separate study).
5.3. Flood Hazard Classification
The 2005 NSW Government’s Floodplain Development Manual (Reference 5) determines the
provisional flood hazard categorisation of an area based on the combination of the depth and
velocity of floodwaters on the land. As the flood fringe areas surrounding the lake have
effectively nil velocity the provisional hazard categories were derived based solely upon the
depth of inundation.
If the depth is > 0.8m then the provisional hazard is HIGH, if the depth is < 0.8m then the
provisional hazard is LOW. The boundary of the provisional High and Low hazard classification
will change according to the magnitude of the flood.
However, to assess the full flood hazard all adverse effects of flooding have to be considered.
As well as considering the provisional (hydraulic) hazard it also incorporates threat to life,
danger and difficulty in evacuating people and possessions and the potential for damage, social
disruption and loss of production. As with provisional (hydraulic) hazard, land is classified as
either low or high hazard for a range of flood events.
An additional consideration is now required for areas that become permanently inundated as a
result of sea level rise. While there is not a catastrophic event, it presents a high hazard to
property and infrastructure over time. The classification is a qualitative assessment based on a
number of factors as listed in Table 13.

Lake Macquarie Waterway Flood Risk Management Study and Plan
WMAwater
29076:LakeMacFRMS.docx:26 June 2012 39
Table 13: Hazard Classification
Criteria Weight (1)
Comment
Size of the Flood High Up to a (say) 5 year ARI event the damages are confined to isolated properties. In larger floods the damages are increased significantly inundating large parts of Belmont, Swansea, Marks Point and Blacksmiths.
Flood Awareness of the Community
High Whilst residents are aware that the lake level rises during a flood (and have recently experienced the June 2007 event) the resulting extent of inundation in (say) a 100 year ARI event will be much greater than what is expected by the majority of the community.
Depth and Velocity of Floodwaters
Low Shallow depths (generally less than 0.5 m) and very low velocity.
Effective Warning and Evacuation Times
Medium Probably only 6 to 12 hours. There is only a very small likelihood that residents would be caught completely unaware but they are unlikely to have the foresight to react appropriately to the situation.
Evacuation Difficulties
Medium to High
For the majority of residents evacuation should be relatively easy as there is nearby high ground for vehicles and the majority of goods can be saved by raising them (say) 1 m off the ground within the building. However, the number of buildings/people requiring assistance will severely extend the services of the rescue services (SES, Police, etc.) with the main areas on the eastern shore. At Swansea the hazard is significantly increased due to the distance (> 1 km) to high ground.
Rate of Rise of Floodwaters
Low The rate of rise of floodwaters in lake systems is slow compared to river systems. The maximum rate was approximately 100 mm/h in June 2007 and for the 100 year ARI event. Whilst the rate of rise is slow this must be considered within the context that only a small rise is needed to inundate a large number of buildings.
Duration of Flooding
High The duration of inundation is much longer than on a river system. The lake may be near its peak for over 12 hours. However, this extended duration is unlikely to add significantly to the damages but will increase the risk to life (more crossings) and will add considerably to the level of inconvenience and the recovery time. Permanent inundation due to sea level rise is of indefinite duration.
Effective Flood Access
Low to Medium
The vehicular and pedestrian access routes are all along sealed roads and present no unexpected hazards if the roads have been adequately maintained. Boats can effectively be used to ferry residents to high ground. In events up to the 100 year ARI event four wheel drive access is possible. In larger events with greater depths (above 0.5 m) other forms of transport will be required. The main problem will be congestion due to the number of vehicles.
Additional Concerns such as Bank Erosion, Debris, Wind Wave Action, Sewage overflows
Low The impact of this factor will vary between events and even within a flood event as the wind direction changes. It will have its greatest impact within (say) 50 m of the shoreline. The impact of debris is unlikely to be a factor except in the most extreme cases where major floating objects (boats broken from their moorings, timber and debris picked up from upstream floodplains) come into contact with buildings or residents. Erosion or sedimentation during a flood event is also unlikely to be a significant factor except in areas of high wind/wave activity, along the entrance channel (high velocities). Wind set up may raise water levels by up to 0.2 m (1998 Lake Macquarie Flood Study - Reference 8).
Provision of Services
Medium In a large flood it is likely that services will be cut (sewer and possibly others). There is also the likelihood that the storm may affect power and telephones. Permanent inundation from sea level rise may lead to permanent loss of services.
Note: (1) Relative weighting in assessing the hazard.
Based on the above assessment, the flood hazard at Lake Macquarie waterway would be
increased to HIGH for properties in the flood fringe area at or below the current (year 2011) 100
year ARI flood level of 1.5 mAHD, where water depths in a year 2100 100 year ARI flood (2.32
mAHD) will exceed 0.8 m.
Lake Macquarie Waterway Flood Risk Management Study and Plan
WMAwater
29076:LakeMacFRMS.docx:26 June 2012 40
To manage the long term hazard from permanent inundation as sea levels rise, a new High
Lake Hazard or similar category is suggested, as management responses to deal with the
hazards from permanent inundation will be somewhat different from those used to deal with
flooding.
The remaining flood fringe area, between the year 2011 100 year ARI level (1.5 mAHD) and the
year 2100 100 year ARI level (2.32 mAHD) is considered low hazard due to the low water
velocity and flood depths below 0.8 m.
These general hazard classifications will have to be reviewed against specific local conditions,
and may increase in areas where the general depth of floodwaters exceeds 1 m, there are high
flow velocities, and/or there is a risk of isolation and difficulties for evacuation. This may include
some properties within Dora Creek and Swansea, for example.
In floods greater than the 100 year ARI the hazard will increase as the depth increases. For the
majority of areas, the flood level will increase gradually, and as such, residents will be able to
evacuate to higher ground. In a PMF event the main areas of high hazard are the same as for
the 100 year ARI event and there are no significant areas that would “suddenly” become high
hazard in the PMF as opposed to a gradual increase as the flood level rises.
5.4. Flood Risk and the Social Impacts of Flooding
The costs of flood damages (a summary of the types of flood damages is shown on Table 14)
and the extent of the disruption to the community depend upon many factors including:
the magnitude (depth, velocity and duration) of the flood,
land usage and susceptibility to damages,
awareness of the community to flooding,
effective warning time,
the availability of an evacuation plan or damage minimisation program,
physical factors such as erosion of the lake foreshore, failure of services (sewerage),
flood borne debris, sedimentation and wind/wave runup, and
the types of asset and infrastructure affected.
In order to quantify the effect of inundation on the existing development along the foreshore, a
floor level database was provided by Lake Macquarie City Council for use in this study (further
details are provided in Appendix C). This database was originally developed over 10 years ago
but only some, not all, new developments on flood-prone land have been added since then by
Council.
The original survey targeted properties on land below 2 mAHD, so floor level data for buildings
on properties on land above 2 mAHD is not complete. The database also included some 100
non residential properties (out of over 4800). For un-surveyed properties above 2 mAHD floor
levels are assumed to be at or near ground level, as most construction is slab-on-ground.

Lake Macquarie Waterway Flood Risk Management Study and Plan
WMAwater
29076:LakeMacFRMS.docx:26 June 2012 41
Table 14: Flood Damages Categories (excluding damage and losses from permanent inundation)
Provision of Public ServiceDisruption of Services,
Community Service Relief
Grants
Remove Mud & Debris from
Facilities, Public & Private
Property Repairs (temporary &
permanent)
Physical Damage to
Infrastructure: Electricity,
Water, Telephone, Gas, Road
& Rail Transport Links
Public Property and Facilities:
Parks, Signs, Machinery,
Equipment
Contents of Public Buildings
and FacilitiesPUBLIC
AUTHORITIES
COMMERCIAL
RURAL
RESIDENTIAL
SOCIAL
Costs which cannot be
expressed in dollars, eg:
- stress,
- loss of life,
- serious injury,
- depression,
- inconvenience,
- insecurity.
Costs associated with
the flood event
occurring, but not as
readily quantifiable.
Damage caused by floodwaters
coming into contact with items.
This can be expressed as
"Potential" (max. damage) and
"Actual" (reduced damages due
to moving items).
Costs which can be
expressed in dollars.
FINANCIAL
Loss of existing &/or
Potential Trade
Loss of Productivity and Income,
Bank Interest Charges
Dispose of damaged products,
stock, materials; Cleaning and
Re-instatement
Physical Damage to BuildingsExternal Items:
Vehicles, Machinery, Display,
Raw Materials/Stockpiles,
Fences
Contents of Buildings:
Products, Stock, Fittings,
Tools, Machinery, Raw
Materials
Sowing or harvesting of
Crops, Sale of Stock (at
depreciated value or
dependent on market
influences)
Loss of Farm Production and
Income, Re-instatement of
Pastures, Supplementary
feeding of stock (by hand or
outside agistment), Stock
movement/ transport, Living
costs (temporary accomodation
and food)
Clean Homestead and
Out-buildings; Remove Debris;
Dispose of affected crops &/or
stock
Physical Damage to Structures:
Damage to Homestead, Sheds,
Access tracks, Protection levees
External Items:
Vehicles, Sheds (stables/barns),
Machinery, Tools, Fences, Feed
storage, Saddles, Crops &/or
Stock, Irrigation Systems
Contents of Buildings:
Clothes, Carpets, Furniture,
Valuables, Fittings, Appliances
Not ApplicableLoss of wages, Living costs
(temporary accomodation and
food), Time to repair/replace
damaged items
Clean Carpets, Walls,
Clothes; Re-instate
Furniture; Remove Mud and
Debris
Physical Damage to Buildings:
Gyprock, Cupboards, Scour of
Footings, Houses becoming
buoyant (floating off footings)
External Items:
Vehicles, Laundries,
Caravans, Sheds, Tools,
Gardens, Fences
Contents of Buildings:
Clothes, Carpets, Furniture,
Valuables, Fittings, Appliances
OPPORTUNITYFINANCIALCLEANUPSTRUCTURALEXTERNALINTERNAL
INDIRECTDIRECT
INTANGIBLETANGIBLE
DAMAGE FROM FLOODING

Lake Macquarie Waterway Flood Risk Management Study and Plan
WMAwater
29076:LakeMacFRMS.docx:26 June 2012 42
As the focus of this Waterway Risk Management Study and Plan is on residential properties,
given the relatively small number of non-residential properties identified and the fact that many
are on the foreshore as part of their function (eg. boat hire) a full re-survey of these properties
was not justified and existing information considered appropriate for this plan.
Flood damages can be defined as being “tangible” or intangible”. Tangible damages are those
for which a monetary value can be assigned, in contrast to intangible damages, which cannot
easily be attributed a monetary value.
5.4.1. Tangible Flood Damages
Tangible flood damages are comprised of two basic categories, direct and indirect damages.
Direct damages are caused by floodwaters wetting goods and possessions thereby damaging
them and resulting in either costs to replace or repair or a reduction in their value. Direct
damages are further classified as either internal (damage to the contents of a building including
carpets, furniture), structural (referring to the structural fabric of a building such as foundations,
walls, floors, windows) or external (damage to all items outside the building such as cars,
garages). Indirect damages are the additional financial losses caused by the flood including the
cost of temporary accommodation, loss of wages by employees etc.
While the total likely damages in a given flood are useful to get a “feel” for the magnitude of the
flood problem, it is of little value for absolute economic evaluation. When considering the
economic effectiveness of a proposed mitigation option, the key question is what are the total
damages prevented over the life of the option? This is a function not only of the high damages
which occur in large floods but also of the lesser but more frequent damages which occur in
small floods.
The standard way of expressing flood damages is in terms of average annual damages (AAD).
AAD represents the equivalent average damages that would be experienced by the community
on an annual basis, by taking into account the probability of a flood occurrence. By this means
the smaller floods, which occur more frequently, are given a greater weighting than the rare
catastrophic floods. For the calculation of AAD at Lake Macquarie waterway it was assumed
that there are no flood damages in the 1 year ARI event.
A flood damages assessment was undertaken for existing development in the Lake Macquarie
waterway community and is summarised on Figure 11 and Tables 15, 16 and 17. It should be
noted that a significant contribution to the average annual damages is the houses inundated in
the 5 year ARI and smaller events. Also it is likely that some building floors will not have been
identified in the database or have been re-developed since the time of the survey.
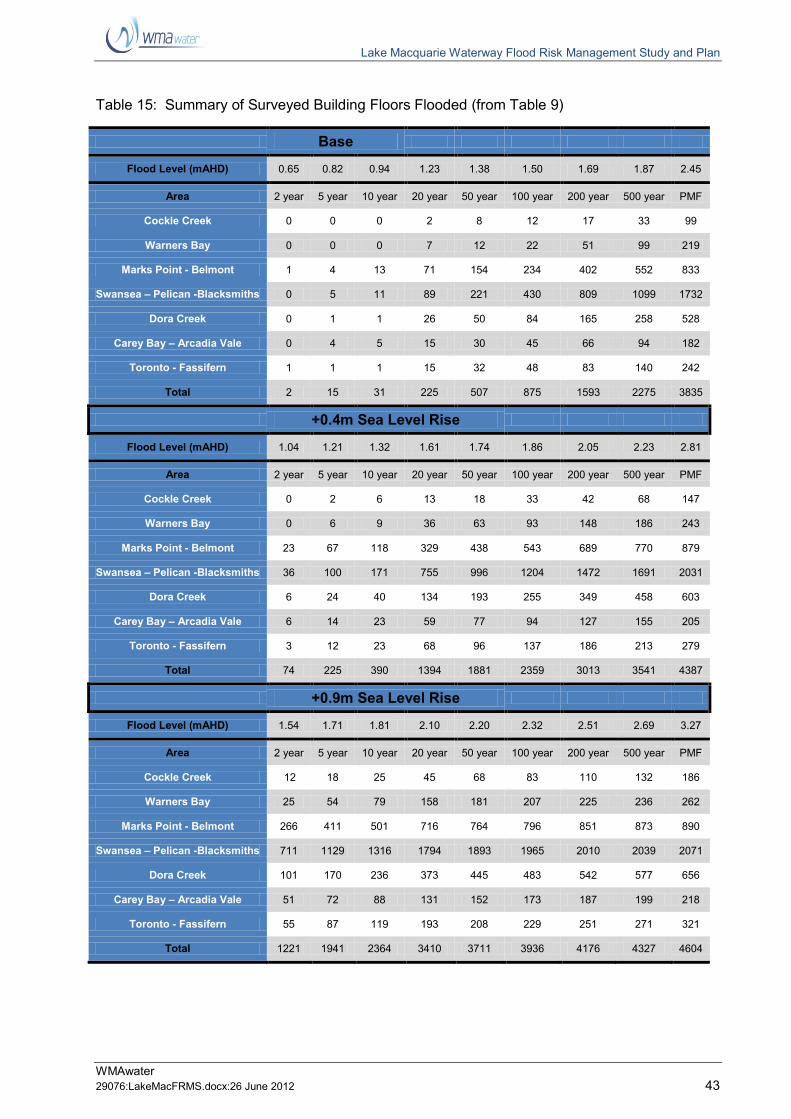
Lake Macquarie Waterway Flood Risk Management Study and Plan
WMAwater
29076:LakeMacFRMS.docx:26 June 2012 43
Table 15: Summary of Surveyed Building Floors Flooded (from Table 9)
Base
Flood Level (mAHD) 0.65 0.82 0.94 1.23 1.38 1.50 1.69 1.87 2.45
Area 2 year 5 year 10 year 20 year 50 year 100 year 200 year 500 year PMF
Cockle Creek 0 0 0 2 8 12 17 33 99
Warners Bay 0 0 0 7 12 22 51 99 219
Marks Point - Belmont 1 4 13 71 154 234 402 552 833
Swansea – Pelican -Blacksmiths 0 5 11 89 221 430 809 1099 1732
Dora Creek 0 1 1 26 50 84 165 258 528
Carey Bay – Arcadia Vale 0 4 5 15 30 45 66 94 182
Toronto - Fassifern 1 1 1 15 32 48 83 140 242
Total 2 15 31 225 507 875 1593 2275 3835
+0.4m Sea Level Rise
Flood Level (mAHD) 1.04 1.21 1.32 1.61 1.74 1.86 2.05 2.23 2.81
Area 2 year 5 year 10 year 20 year 50 year 100 year 200 year 500 year PMF
Cockle Creek 0 2 6 13 18 33 42 68 147
Warners Bay 0 6 9 36 63 93 148 186 243
Marks Point - Belmont 23 67 118 329 438 543 689 770 879
Swansea – Pelican -Blacksmiths 36 100 171 755 996 1204 1472 1691 2031
Dora Creek 6 24 40 134 193 255 349 458 603
Carey Bay – Arcadia Vale 6 14 23 59 77 94 127 155 205
Toronto - Fassifern 3 12 23 68 96 137 186 213 279
Total 74 225 390 1394 1881 2359 3013 3541 4387
+0.9m Sea Level Rise
Flood Level (mAHD) 1.54 1.71 1.81 2.10 2.20 2.32 2.51 2.69 3.27
Area 2 year 5 year 10 year 20 year 50 year 100 year 200 year 500 year PMF
Cockle Creek 12 18 25 45 68 83 110 132 186
Warners Bay 25 54 79 158 181 207 225 236 262
Marks Point - Belmont 266 411 501 716 764 796 851 873 890
Swansea – Pelican -Blacksmiths 711 1129 1316 1794 1893 1965 2010 2039 2071
Dora Creek 101 170 236 373 445 483 542 577 656
Carey Bay – Arcadia Vale 51 72 88 131 152 173 187 199 218
Toronto - Fassifern 55 87 119 193 208 229 251 271 321
Total 1221 1941 2364 3410 3711 3936 4176 4327 4604

Lake Macquarie Waterway Flood Risk Management Study and Plan
WMAwater
29076:LakeMacFRMS.docx:26 June 2012 44
Table 16: Summary of Increase in Surveyed Building Floors Flooded
Existing Sea Level Rise 0.4 m Sea Level Rise 0.9 m
ARI Buildings Inundated
Buildings Inundated
Increase Increase (%)
Buildings Inundated
Increase Increase (%)
2 year 2 74 72 3600% 1221 1219 60950%
5 year 15 225 210 1400% 1941 1926 12840%
10 year 31 390 359 1158% 2364 2333 7526%
20 year 225 1394 1169 520% 3410 3185 1416%
50 year 507 1881 1374 271% 3711 3204 632%
100 year 875 2359 1484 170% 3936 3061 350%
200 year 1593 3013 1420 89% 4176 2583 162%
500 year 2275 3541 1266 56% 4327 2052 90%
PMF 3835 4387 552 14% 4604 769 20%
The damages were calculated with use of a number of height/damage curves (that is, curves
which relate the depth of water above the floor with tangible damages) which were developed
based on guidelines provided by DECCW (now Office of Environment and Heritage).
Each component of tangible damages is allocated a maximum value and a maximum depth at
which this value occurs. Any flood depths greater than this allocated value do not incur
additional damages as it is assumed that, by this level, all potential damages have already
occurred.
For the Lake Macquarie waterway assessment, internal damages were allocated a maximum
value of $60,000 occurring at a depth of 2 m above the building floor level (and linearly
proportioned between the depths of 0 to 2 m). Structural and indirect damages were grouped
together and given a maximum value of $20,000 assumed to occur at 1.5 m depth above the
building floor level and linearly proportioned for the depths below this. External damages were
allocated a maximum of $1,000 occurring at 0.5 m above the property ground level and linearly
proportioned for depths below this.
This estimate does not include the cost of restoring or maintaining services and infrastructure.

Lake Macquarie Waterway Flood Risk Management Study and Plan
WMAwater
29076:LakeMacFRMS.docx:26 June 2012 45
Table 17: Summary of Tangible Flood Damages (based on Table 15)
Foreshore Management Area
2Y 5Y 10Y 20Y 50Y 100Y 200Y 500Y PMF
Existing
Cockle Creek
$0 $0 $1,000 $29,000 $135,000 $255,000 $503,000 $911,000 $3,749,000
Warners Bay $0 $0 $0 $72,000 $222,000 $465,000 $1,174,000 $2,467,000 $9,854,000
Marks Point - Belmont $7,000 $47,000 $218,000 $1,535,000 $3,385,000 $5,787,000 $11,384,000 $18,390,000 $44,716,000
Swansea – Pelican -Blacksmiths
$2,000 $47,000 $172,000 $1,664,000 $4,149,000 $8,491,000 $20,233,000 $34,647,000 $88,239,000
Dora Creek $1,000 $20,000 $33,000 $440,000 $1,081,000 $1,948,000 $4,393,000 $7,854,000 $24,674,000
Carey Bay – Arcadia Vale $0 $55,000 $106,000 $373,000 $689,000 $1,127,000 $2,060,000 $3,262,000 $8,749,000
Toronto - Fassifern $18,000 $36,000 $52,000 $299,000 $678,000 $1,175,000 $2,361,000 $4,157,000 $12,070,000
Total $28,000 $205,000 $582,000 $4,412,000 $10,339,000 $19,248,000 $42,108,000 $71,688,000 $192,051,000
+ 0.4m sea level rise
Cockle Creek
$3,000 $23,000 $77,000 $384,000 $579,000 $886,000 $1,497,000 $2,281,000 $6,721,000
Warners Bay $1,000 $53,000 $145,000 $808,000 $1,460,000 $2,371,000 $4,405,000 $6,716,000 $14,044,000
Marks Point - Belmont $459,000 $1,371,000 $2,443,000 $8,724,000 $13,107,000 $17,992,000 $26,808,000 $35,159,000 $56,838,000
Swansea – Pelican -Blacksmiths
$691,000 $1,854,000 $3,236,000 $16,666,000 $26,152,000 $36,448,000 $54,479,000 $71,443,000 $121,176,000
Dora Creek $91,000 $376,000 $761,000 $3,220,000 $5,201,000 $7,660,000 $12,382,000 $17,676,000 $34,655,000
Carey Bay – Arcadia Vale $160,000 $343,000 $525,000 $1,651,000 $2,366,000 $3,202,000 $4,748,000 $6,421,000 $12,125,000
Toronto - Fassifern $84,000 $258,000 $471,000 $1,818,000 $2,758,000 $4,048,000 $6,545,000 $8,979,000 $16,519,000
Total $1,489,000 $4,278,000 $7,658,000 $33,271,000 $51,623,000 $72,607,000 $110,864,000 $148,675,000 $262,078,000
+ 0.9m sea level rise
Cockle Creek
$296,000 $536,000 $724,000 $1,674,000 $2,164,000 $2,867,000 $4,230,000 $5,684,000 $10,636,000
Warners Bay $559,000 $1,277,000 $1,938,000 $5,057,000 $6,404,000 $8,086,000 $10,670,000 $12,779,000 $18,000,000
Marks Point - Belmont $6,686,000 $12,065,000 $15,807,000 $29,307,000 $34,103,000 $39,434,000 $47,151,000 $53,305,000 $68,694,000
Swansea – Pelican -Blacksmiths
$14,754,000 $28,477,000 $36,976,000 $70,492,000 $80,922,000 $91,854,000 $107,801,000 $119,437,000 $151,928,000
Dora Creek $2,329,000 $4,696,000 $6,568,000 $13,798,000 $16,933,000 $20,683,000 $26,536,000 $31,559,000 $45,323,000
Carey Bay – Arcadia Vale $1,296,000 $2,190,000 $2,839,000 $5,205,000 $6,190,000 $7,442,000 $9,355,000 $11,061,000 $15,527,000
Toronto - Fassifern $1,375,000 $2,516,000 $3,450,000 $7,259,000 $8,656,000 $10,329,000 $12,912,000 $15,165,000 $21,713,000
Total $27,295,000 $51,757,000 $68,302,000 $132,792,000 $155,372,000 $180,695,000 $218,655,000 $248,990,000 $331,821,000
* Tangible damages includes external damages which may occur with or without house floor inundation

Lake Macquarie Waterway Flood Risk Management Study and Plan
WMAwater
29076:LakeMacFRMS.docx:26 June 2012 46
Based on the above, the average annual damages for the foreshore management areas are
shown on Table 18.
Table 18: Annual Average Damages
Foreshore Management Area
Existing Year 2011
+0.4m sea level rise year 2050
+0.9m sea level rise year 2100
Cockle Creek $14,000 $64,000 $454,000
Warners Bay $30,000 $150,000 $1,108,000
Marks Point - Belmont $338,000 $1,639,000 $8,814,000
Swansea - Pelican - Backsmiths $491,000 $2,871,000 $20,379,000
Dora Creek $122,000 $587,000 $3,638,000
Carey Bay – Arcadia Vale $81,000 $355,000 $1,637,000
Toronto - Fassifern $85,000 $342,000 $1,965,000
Total $1,161,000 $6,008,000 $37,995,000
Tangible damages will also occur as a result of permanent inundation as a result of sea and lake
level rises. There is no current damage but, as land and, even some structures, are affected by
rising lake levels by the year 2050 and beyond, there will be a financial cost through loss of land
use and damage to buildings and infrastructure. The Lake Macquarie Environmental Security
Assessment report prepared for Lake Macquarie City Council in 2010 (Reference 11) estimated
the total losses in land value from permanent inundation to the year 2100 at $528 million,
although this would not start to be realised until after 2050.
Figure 12 provides a graph of the design flood levels taking into account sea level rise and
increases in rainfall intensities for the Lake Macquarie waterway and Swansea Channel. Figure
13 indicates the number of building footprints affected in the various design events (the
footprints were obtained from aerial photography and predominantly represent residential,
commercial and industrial buildings but may include other structures such as sheds or garages).
Figure 14 indicates the areal extent of inundation in the various design events and within each
planning zone. Figure 15 indicates the number of properties affected in the various design
events and within each planning zone. Figure 16 indicates the number of properties according
to the percentage of land inundated within the property for the various design events.
5.4.2. Intangible Flood Damages
The intangible damages associated with flooding are inherently more difficult to estimate. In
addition to the direct and indirect damages discussed above, additional costs/damages are
incurred by residents affected by flooding, such as stress, risk/loss to life, injury etc. It is not
possible to put a monetary value on the intangible damages as they are likely to vary
dramatically between each flood (from a negligible amount to several hundred times greater
than the tangible damages) and depend on a range of factors including the size of flood, the
individuals affected, community preparedness, etc. However, it is important that the

Lake Macquarie Waterway Flood Risk Management Study and Plan
WMAwater
29076:LakeMacFRMS.docx:26 June 2012 47
consideration of intangible damages is included when considering the impacts of flooding on a
community. An overview of the types of intangible damages likely to occur on the foreshores of
the Lake Macquarie waterway is discussed below.
Isolation
Isolation (the ability to freely exit and enter your house) during flood events will become a
significant factor for local residents in areas such as Dora Creek and to a lesser extent at
Swansea. There is also a high level of community support and spirit, which can to some extent
negate the effects of isolation and can certainly assist in a flood (as happened in June 2007).
However, isolation is of significant concern if a medical emergency arises during a flood.
Population Demographics
Analysis of the 2006 Census data indicates that there are some particular features of the
population demographics of the community on the foreshores of Lake Macquarie waterway that
would contribute to additional intangible damages, particularly community resilience.
These include age and income population characteristics. The population in some of the
suburbs most vulnerable to floods and inundation from sea level rise and storms attributable to
the impact of climate change are significantly older than the Lake Macquarie City average. For
example, while the median age of the population of Lake Macquarie is 40 years old, the median
age of the population of Swansea is 48 years old, in Belmont it is 46, and in Dora Creek it is 44
years old. The median age of people in New South Wales is 37 years.
Furthermore, the percentage of the population over 65 years old in Swansea is 28.4%, in
Belmont 28.1%, and in Dora Creek it is 21%, compared to the Lake Macquarie median of 16.8%
(the NSW median is 13.8%). Older populations and low incomes are linked, as many older
retirees are no longer earning incomes.
While some households in some vulnerable communities enjoy high incomes, many people
living in vulnerable foreshore communities are living on incomes that are significantly lower than
the Lake Macquarie average. For example, median household weekly income in Swansea is
$570/week, in Belmont it is $587/week and in Dora Creek it is $810/week, compared to the
Lake Macquarie average of $922/week (the NSW median is $1036/week).
Unemployment levels in these communities are generally higher than the Lake Macquarie
median, with unemployment level in Swansea being 13.3%, in Belmont 8%, and Dora Creek
8.87%, compared to the Lake Macquarie median of 6.7% (the NSW median is 5.8%).
These age, income and unemployment statistics indicate the possibility of lower resilience of
these vulnerable foreshore communities to adapt to change, therefore requiring local adaptation
plans that acknowledge and respond to specific local challenges. Well-developed emergency
preparedness, response and recovery programs are also required.
Stress
In addition to the stress caused during an event (from concern over property damage, risk to life
for the individuals or their family, clean up etc.,) many residents who have experienced a major
Lake Macquarie Waterway Flood Risk Management Study and Plan
WMAwater
29076:LakeMacFRMS.docx:26 June 2012 48
flood are fearful of the occurrence of another flood event and its associated damage. The extent
of the stress depends on the individual. To some extent, this does not appear to be a significant
issue at Lake Macquarie waterway as a number of residents experienced both the February
1990 and June 2007 events and this issue has not become apparent in post flood surveys. The
increasing hazard due to climate changes and rising sea levels is likely to add to community and
individual stress, as it makes future events even more difficult to predict, and planning for the
future even more uncertain.
Risk to Life and Injury
During any flood event there is the potential for injury as well as loss of life. At Lake Macquarie
waterway the absence of high velocities as well as high flood depths (say > 1 m) means that the
risk is smaller than in other flood liable communities. However the risk is increased due to the
duration of inundation and the length of some evacuation routes (Dora Creek and Swansea).
5.5. Flood Awareness and Flood Warning
The flood awareness of the community and the available flood warning time are important
factors in reducing the likely flood damages. Based on experience in other areas and
discussions with local residents and others it is likely that the flood awareness of the community
is medium to low. A contributing factor is that about 1% of the LGA’s population will be
temporary (holiday makers or possibly weekenders), although this percentage will be higher in
foreshore areas which are popular with visitors and tourists. However the available flood
warning time is high for the following reasons:
The lake rises relatively slowly (say on average less than 100 mm per hour),
The Bureau of Meteorology operates a flood warning system based upon regional
rainfall and river gauges,
The residents will be aware of the water actually rising across their yards (unless
at night) and heavy rain in their neighbourhood, and
Residents are generally aware that as the lake rises it will inundate the
surrounding foreshore areas. Residents who have been in the area for a few
years will have experienced minor rises in the water level (and possibly even the
February 1990 and June 2007 events) and will be aware that larger events may
occur causing more severe inundation.
The extent or success of damage mitigation measures employed by the residents during the
February 1990 or June 2007 events is unknown. However the relatively shallow depth of above
floor inundation means that it is easy to “lift” (portable) items above the water level. However
carpets and fixed items (such as kitchen and cupboards) cannot generally be saved.
5.6. Impacts of Flooding on Public Infrastructure
Public sector (non-building) damages include:
recreational/tourist facilities,
water and sewerage supply,
gas supply,

Lake Macquarie Waterway Flood Risk Management Study and Plan
WMAwater
29076:LakeMacFRMS.docx:26 June 2012 49
telephone supply,
electricity supply including transmission poles/lines, sub-stations and
underground cables,
roads and bridges including traffic lights/signs, and
costs to employ the emergency services and assist in cleaning up.
Damages to the public sector can contribute a significant proportion of the total flood costs.
There are no accurate estimates of the amount of damages to the public sector in previous
floods.
Fixed infrastructure such as roads and sewer are particularly vulnerable to permanent and tidal
inundation as sea and lake levels rise. Infrastructure in low-lying areas close to the lake
foreshore can expect to experience increased corrosion, rising groundwater levels, and more
frequent tidal inundation. This will increase maintenance and service costs, and may lead to
long-term failure of some assets unless they are re-designed or relocated. The future risk, and
cost, to infrastructure needs to be investigated in more detail as local Area Adaptation Plans are
prepared for vulnerable foreshore communities.
5.7. Impacts of Flooding on Commercial and Industrial Activities
Commercial and industrial activities will also be adversely affected by flooding and vulnerable to
permanent and tidal inundation as sea and lake levels rise. The magnitude of the damages will
likely be less than for the residential community as there are much fewer buildings susceptible to
flooding (Table 9). A rigorous study of these activities has not been undertaken but it is also
likely that as re-development occurs (many commercial premises have a much shorter lifespan
than houses) measures to mitigate the impacts of flooding and climate change can be
incorporated into the building design. This issue would need to be examined on a case by case
basis.
5.8. Environmental Impacts of Flooding
Flooding is a natural phenomenon that has been a critical element in the formation of the
present topography. Thus erosion, sedimentation and other results from flooding should be
viewed as part of the natural ecosystem. It is only when these effects impact on man-made
elements that they are of concern, and similarly, when development impacts or exacerbates
these processes.
However, as natural areas become permanently inundated by rising sea and lake levels, and
tidal and flood regimes change, ecosystems will be affected by the changes to hydrology.
Foreshore ecosystems such as mangroves, saltmarsh, and wetlands may be inundated, or
suffer from changes in salinity, groundwater, and tidal inundation. The Lake Macquarie
Wetlands Climate Change Assessment study for Lake Macquarie City Council in 2010
(Reference 12) showed that a 0.9 m increase in lake level would inundate 680 ha (28%) of
foreshore wetlands, but up to 90% of some types such as saltmarsh and swamp-oak forest.

Lake Macquarie Waterway Flood Risk Management Study and Plan
WMAwater
29076:LakeMacFRMS.docx:26 June 2012 50
Assessment of the environmental impact of property protection and flood modification measures
needs to consider changes in baseline environmental conditions caused by sea level rise, such
as permanent inundation of tidal saltmarsh. For example, protection works such as berms or
sea walls could affect ecosystems such as saltmarsh, and/or block off possible areas for
ecosystem retreat. Filling and changes to local drainage patterns could also affect ecosystems
dependent on a particular hydraulic pattern of wetting and drying.
Strategic planning for areas affected by permanent inundation and increased flooding must
include consideration of ecosystem adaptation and retreat, particularly for tidal saltmarsh, and
foreshore and coastal wetlands. The future protection and conservation of ecosystems
dependent on lake water levels should be included in the development of Area Adaptation Plans
that are recommended as part of this study and plan.
5.9. Flood Emergency Response Classification
To assist in the planning and implementation of response strategies, the SES in conjunction with
DECCW (now OEH) has developed guidelines to classify communities according to the impact
that flooding has upon them. Flood affected communities are considered to be those in which
the normal functioning of services is altered, either directly or indirectly, because a flood results
in the need for external assistance. This impact relates directly to the operational issues of
evacuation, resupply and rescue.
Based on the guidelines, communities are classified as either, Flood Islands, Road Access
Areas, Overland Access Areas, Trapped Perimeter Areas or Indirectly Affected Areas (refer
Table 19). From this classification an indication of the emergency response required can be
determined.
Table 19: Emergency Response Classification of Communities
The guideline was applied for the community and for all foreshore management areas of Lake
Macquarie waterway the community was classified as Low Flood Island based on the following
criteria:
there are homes and access roads below the PMF,
vehicle evacuation routes are cut before homes are inundated,
there are no habitable areas for refuge (except the homes themselves),
Classification Response Required
Resupply Rescue/Medivac Evacuation
High Flood Island Yes Possibly Possibly
Low Flood Island No Yes Yes
Area with Rising Road Access No Possibly Yes
Areas with Overland Escape Routes
No Possibly Yes
Low Trapped Perimeter No Yes Yes
High Trapped Perimeter Yes Possibly Possibly
Indirectly Affected Areas Possibly Possibly Possibly
Lake Macquarie Waterway Flood Risk Management Study and Plan
WMAwater
29076:LakeMacFRMS.docx:26 June 2012 51
the homes are first surrounded by floodwaters and then inundated, and
thus vehicle evacuation must be completed before the route is closed.
In summary, a local flood action plan should be prepared for each foreshore management area
and communicated with the community. Due to the extensive area and number of people
requiring the services of the SES, the main focus for many residents will be on self-help during a
flood.
5.10. Implications of Climate Change and Sea Level Rise
5.10.1. Background
Climate change is predicted to cause an increase in sea level and possibly changes to design
rainfall intensities. The likely impacts of a rise in sea-level include:
an increase in the intensity and frequency of storm surges;
increased foreshore erosion and inundation of low lying coastal lands;
further loss of important coastal wetland ecosystems; and
damage to and destruction of human assets and settlements.
In developed areas such as Lake Macquarie waterway, changes in the climate, such as an
increase in storm activity, together with a rise in sea level are likely to influence future building
design, standards and performance as well as energy and water demand and in particular
coastal/estuary planning.
Given that the Lake Macquarie waterway has a wide foreshore, future development and
redevelopment of foreshore areas will need to factor how future sea-level rise will impact on the
developments. Nearly 4000 residential and commercial properties will be at least partially
affected by a 0.9m rise in sea levels (Figure 15), affecting their future use and development. By
area, it is public land that is most affected (Figure 14), covering Council reserves, Crown land,
and National Parks. Rising sea and lake levels will affect construction and reconstruction of
foreshore structures, such as seawalls, fixed jetties and boat ramps, and public foreshore
access in the future. Mitigation and adaptation options to address the potential impacts of
climate change, particularly for coastal communities, will become increasingly more expensive
and problematic.
The 2005 Floodplain Development Manual (Reference 5) and 2010 Flood Risk Management
Guide (Reference 3) requires that Flood Studies and Risk Management Studies consider the
impacts of sea level rise and climate change on flood behaviour.
5.10.2. Key Developments
Since completion of the Lake Macquarie Flood Study reports (References 5 and 6) in 1998,
current best practice for considering the impacts of climate change (sea level rise and rainfall
increase) have been evolving rapidly. Key developments in the last three years are summarised
in Section 7of the 2012 Lake Macquarie Waterway Flood Study (Reference 6).

Lake Macquarie Waterway Flood Risk Management Study and Plan
WMAwater
29076:LakeMacFRMS.docx:26 June 2012 52
5.10.3. How will Climate Change Affect Water Levels in the Lake Macquarie
Waterway?
Climate change has the potential to alter the water level in both non-flood and flood times.
During Non Flood Times
The main impacts in non-flood times will be:
The “normal” water level in the Lake Macquarie waterway will rise from the current 0.1
mAHD average lake water level. The predicted increase in lake levels is the same as
the expected sea level rise (by 0.4 m in 2050 to 0.5 mAHD and by 0.9 m in 2100 to
1.0 mAHD), as determined by the NSW State Government’s 2010 Flood Risk
Management Guide (Reference 3).
Through-out the year, a series of elevated ocean levels (combination of high
astronomic tides and/or storm surges) over a few days will “pump up” water levels in
the Lake Macquarie waterway. This “highest non-flood lake water level in a year” is
estimated to be 0.5 mAHD and will rise by an equivalent amount to the climate
change sea level rise. Thus each year lake water levels of 0.9 mAHD (+0.4m sea
level rise) and of 1.4 mAHD (+0.9m sea level rise) will occur as a result of elevated
ocean levels.
It is possible that the tidal range and seasonal variation in water level within the lake
(i.e change in tidal prism) may change in response to rainfall or temperature changes
but the extent is unknown at this time.
The increase in the “normal” water level in the Lake Macquarie waterway in “non-flood” times
may result in increased maintenance costs and/or modifications costs for existing developments
and infrastructure due to more frequent inundation in non-flood times. For example, low lying
roads will be more frequently inundated. Inflows of water from the Lake Macquarie waterway to
sewer surcharge vents in backyards may also occur more frequently. The increased cost for
residents and Lake Macquarie City Council to maintain the existing developments and
infrastructure is unknown. A separate study is required to quantify the effect in non flood times
but it is likely that at some time in the future the existing services in particularly low lying areas
(say a road) will become unable to be maintained and it will have to be relocated or re-built.
This may affect service standards to existing developments.
The increase in water levels during non-flood times may also see some areas of land that are
currently dry become flooded most of the time. This will affect the current use of that land and
strategic planning is necessary to reduce the economic impact resulting from this flooding.
Any change in the “normal” water level regime will impact on the ecology of the Lake Macquarie
waterway. The implications of this are largely outside the scope of this Waterway Risk
Management Study and Plan.
During Flood Times
There are several broad ways in which climate change and sea level rise will affect water levels
in the Lake Macquarie waterway during floods, namely:
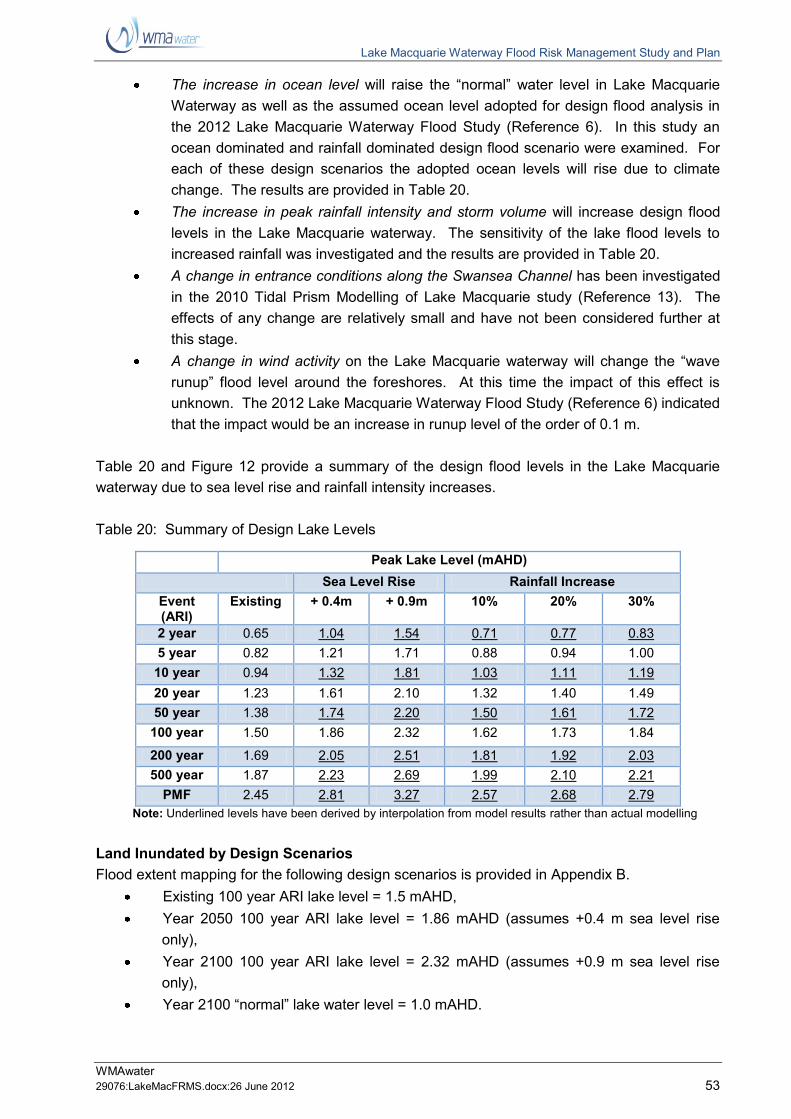
Lake Macquarie Waterway Flood Risk Management Study and Plan
WMAwater
29076:LakeMacFRMS.docx:26 June 2012 53
The increase in ocean level will raise the “normal” water level in Lake Macquarie
Waterway as well as the assumed ocean level adopted for design flood analysis in
the 2012 Lake Macquarie Waterway Flood Study (Reference 6). In this study an
ocean dominated and rainfall dominated design flood scenario were examined. For
each of these design scenarios the adopted ocean levels will rise due to climate
change. The results are provided in Table 20.
The increase in peak rainfall intensity and storm volume will increase design flood
levels in the Lake Macquarie waterway. The sensitivity of the lake flood levels to
increased rainfall was investigated and the results are provided in Table 20.
A change in entrance conditions along the Swansea Channel has been investigated
in the 2010 Tidal Prism Modelling of Lake Macquarie study (Reference 13). The
effects of any change are relatively small and have not been considered further at
this stage.
A change in wind activity on the Lake Macquarie waterway will change the “wave
runup” flood level around the foreshores. At this time the impact of this effect is
unknown. The 2012 Lake Macquarie Waterway Flood Study (Reference 6) indicated
that the impact would be an increase in runup level of the order of 0.1 m.
Table 20 and Figure 12 provide a summary of the design flood levels in the Lake Macquarie
waterway due to sea level rise and rainfall intensity increases.
Table 20: Summary of Design Lake Levels
Peak Lake Level (mAHD)
Sea Level Rise Rainfall Increase
Event (ARI)
Existing + 0.4m + 0.9m 10% 20% 30%
2 year 0.65 1.04 1.54 0.71 0.77 0.83
5 year 0.82 1.21 1.71 0.88 0.94 1.00
10 year 0.94 1.32 1.81 1.03 1.11 1.19
20 year 1.23 1.61 2.10 1.32 1.40 1.49
50 year 1.38 1.74 2.20 1.50 1.61 1.72
100 year 1.50 1.86 2.32 1.62 1.73 1.84
200 year 1.69 2.05 2.51 1.81 1.92 2.03
500 year 1.87 2.23 2.69 1.99 2.10 2.21
PMF 2.45 2.81 3.27 2.57 2.68 2.79
Note: Underlined levels have been derived by interpolation from model results rather than actual modelling
Land Inundated by Design Scenarios
Flood extent mapping for the following design scenarios is provided in Appendix B.
Existing 100 year ARI lake level = 1.5 mAHD,
Year 2050 100 year ARI lake level = 1.86 mAHD (assumes +0.4 m sea level rise
only),
Year 2100 100 year ARI lake level = 2.32 mAHD (assumes +0.9 m sea level rise
only),
Year 2100 “normal” lake water level = 1.0 mAHD.

Lake Macquarie Waterway Flood Risk Management Study and Plan
WMAwater
29076:LakeMacFRMS.docx:26 June 2012 54
Table 21 provides a tabulation of the number of properties affected in the design scenarios.
Table 21: Properties Affected – Flood Design Scenarios
Event and Peak Level (m AHD)
No. of Properties Affected
No Building footprints Affected
Year 2011 2yr ARI - 0.65 2224 216
Year 2011 5yr ARI-0.82 3251 669
Year 2011 10yr ARI-0.94 4024 1187
Year 2100 Lake Level-1.00 4450 1562
Year 2011 20yr ARI-1.23 5973 3057
Year 2011 50yr ARI-1.38 6747 3967
Year 2011 100yr ARI-1.5 7331 4661
Year 2011 200yr ARI-1.69 8192 5595
Year 2050 100yr ARI -1.86 (+0.4m SLR) 8750 6282
Year 2011 500yr ARI-1.87 8776 6300
Year 2100 100yr ARI -2.32 (+0.9m SLR) 9709 7245
Year 2011 PMF-2.45 9932 7475
Year 2100 100yr ARI (+ 0.5m freeboard)-2.82 10608 8054
Are the Implications of Climate Change Significant?
A rise in the “normal” lake water level, annual peak lake water level and the design flood levels
will have a significant effect.
5.10.4. Implications of Future Development
Due to the limited availability and relatively small scale of residential zoned land in the
contributing catchments, the hydrologic impacts (increased runoff) of increased building
construction will have no significant impact on the flood regime (increased runoff or rate of
runoff). Council’s Development Control Plan requires that new developments do not increase
stormwater run-off into lake catchments, although the controls only apply to the smaller, more
frequent rainfall events (less than 20 year ARI).
Future filling of the foreshore (for roads or building pads) will reduce the available temporary
floodplain storage capacity. However, given the large foreshore surrounding the lake, the area
of the lake (110 km2), and the likely scale of the filling, it is considered that filling of the foreshore
will have no significant impact on flood levels. All filling proposals must still be considered in
terms of their potential impact on local drainage, effects on foreshore processes, and overland
flow paths in the foreshore areas.

Lake Macquarie Waterway Flood Risk Management Study and Plan
WMAwater
29076:LakeMacFRMS.docx:26 June 2012 55
6. RISK MANAGEMENT MEASURES
6.1. General
The 2005 NSW Government’s Floodplain Development Manual (Reference 3) separates risk
management measures into three broad categories:
Flood modification measures modify the flood’s physical behaviour (depth, velocity and
redirection of flow paths) and include flood mitigation dams, retarding basins and levees. At
Lake Macquarie waterway this would also include any works that modify the entrance to the
Pacific Ocean (Swansea Channel).
Property modification measures modify land use and development controls. This is generally
accomplished through such means as flood proofing (house raising or sealing entrances),
strategic planning (such as land use zoning), building regulations (such as flood-related
development controls), or voluntary purchase.
Response modification measures modify the community’s response to flood hazard by
educating flood affected property owners about the nature of flooding so that they can make
informed decisions. Examples of such measures include provision of flood warning and
emergency services, improved information, awareness and education of the community and
provision of flood insurance.
6.1.1. Relative Merits of Management Measures
A number of methods are available for judging the relative merits of competing measures. The
benefit/cost (B/C) approach has long been used to quantify the economic worth of each option
enabling the ranking against similar projects in other areas. The benefit/cost ratio is the ratio of
the net present worth (the total present value of a time series of cash flows). It is a standard
method for using the time value of money to appraise long-term projects of the reduction in flood
damages (benefit) compared to the cost of the works. Generally the ratio expresses only the
reduction in tangible damages as it is difficult to accurately include intangibles (such as anxiety,
risk to life, ill health and other social and environmental effects).
The potential environmental or social impacts of any proposed flood mitigation measure must be
considered in the assessment of any management measure and these cannot be evaluated
using the classical B/C approach. For this reason a matrix type assessment has been used
which enables a value (including non-economic worth) to be assigned to each measure. Due to
the limited number of options available this matrix was not rigorously used for each option. It is
a recommendation of this report that multi-variate decision matrices be developed for specific
foreshore management areas, allowing detailed benefit/cost estimates, community involvement
in determining social and other intangible values, and local assessment of environmental
impacts. The matrix below is designed to set out a general scheme to illustrate how a local
matrix might be developed.

Lake Macquarie Waterway Flood Risk Management Study and Plan
WMAwater
29076:LakeMacFRMS.docx:26 June 2012 56
6.1.2. Management Matrix
The criteria assigned a value in the management matrix are:
impact on flood behaviour (reduction in flood level, hazard or hydraulic categorisation)
over the range of flood events,
number of properties benefited by measure,
technical feasibility (design considerations, construction constraints, long-term
performance),
community acceptance and social impacts,
economic merits (capital and recurring costs versus reduction in flood damages),
financial feasibility to fund the measure,
environmental and ecological benefits,
impacts on the State Emergency Services,
political and/or administrative issues,
long-term performance given the likely impacts of climate change and ocean/sea level
rises, and
risk to life.
The scoring system for the above criteria is provided in Table 22 and largely relates to the
impacts in a 100 year ARI event. These criteria and their relative weighting may be adjusted in
the light of community consultations and local conditions.
Table 22: Matrix Scoring System
-3 -2 -1 0 1 2 3
Impact on Flood Behaviour
>100mm increase
50 to 100mm
increase
<50mm increase
no change
<50mm decrease
50 to 100mm decrease
>100mm decrease
Number of Properties Benefited
>5 adversely affected
2-5 adversely affected
<2 adversely affected
none <2 2 to 5 >5
Technical Feasibility
major issues moderate issues
minor issues
neutral moderately straightforward
straightforward no issues
Community Acceptance
majority against
most against some against
neutral minor most majority
Economic Merits
major disbenefit
moderate disbenefit
minor disbenefit
neutral low medium high
Financial Feasibility
major disbenefit
moderate disbenefit
minor disbenefit
neutral low medium high
Environmental and Ecological Benefits
major disbenefit
moderate disbenefit
minor disbenefit
neutral low medium high
Impacts on SES
major disbenefit
moderate disbenefit
minor disbenefit
neutral minor benefit moderate benefit
major benefit
Political/administrative Issues
major negative moderate negative
minor negative
neutral few very few none
Long Term Performance
major disbenefit
moderate disbenefit
minor disbenefit
neutral positive good excellent
Risk to Life major increase moderate increase
minor increase
neutral minor benefit moderate benefit
major benefit

Lake Macquarie Waterway Flood Risk Management Study and Plan
WMAwater
29076:LakeMacFRMS.docx:26 June 2012 57
6.2. Measures Not Considered Further
It was apparent that after a preliminary matrix assessment that a number of risk management
measures were not worthy of further consideration. These are summarised in Table 23.
Table 23: Risk Management Measures Not Considered Further
Measure
Impact
Reduction in Flood Level
Social Effect
Environ-mental Impact
Cost to Implement
Benefit/ Cost Ratio
FLOOD MODIFICATION MEASURES:
Flood Mitigation Dams, etc. Yes but minimal
Nil Very High Very High Low
Change the existing entrance or construct another entrance
No Very High Very High Very High Low
Catchment Treatment Minimal Nil Low Low Nil
PROPERTY MODIFICATION MEASURES:
Voluntary Purchase of all Buildings Inundated in the PMF
Nil High Nil High per building Probably Low
RESPONSE MODIFICATION MEASURES:
Nil
6.2.1. Flood Mitigation Dams, Retarding Basins, On-Site Detention
Large flood mitigation dams within the catchment are not viable on economic, social and
environmental grounds. Construction of retarding basins (say up to 50 000 m3) and the use of
on-site stormwater detention or retention systems are increasingly being used in developing
catchments. These measures are appropriate for use in controlling flooding in small catchments
(say up to 5 km2) or to mitigate the effects of increased runoff caused by development.
However, these structures would have negligible impact upon lake levels.
6.2.2. Change the Existing Entrance or Construct another Entrance
Enlarging the Swansea Channel entrance will not reduce flooding, sea level rise, or tidal
inundation. In fact, by allowing easier access to the lake for oceanic tides, storm surge, and
wave setup, it will increase flood peaks, tidal inundation, and ocean-induced lake water level
rise. It would also be expensive to construct and maintain. Constructing another opening from
the ocean to Lake Macquarie to the north of the existing entrance would have all the same
problems and, like the channel-deepening, it would be counter-productive. There would be a
high social (loss of land), environmental (loss of flora and fauna, impact on lake ecosystem,
impact on coastal processes at the existing and new outlets) and economic costs (excavation
and bridging costs), making these measure impractical. Measures such as a “Thames” style
barrage to prevent elevated ocean levels from entering the lake are unlikely to be successful for

Lake Macquarie Waterway Flood Risk Management Study and Plan
WMAwater
29076:LakeMacFRMS.docx:26 June 2012 58
all storms, as many events that produce elevated ocean levels (storm surge) also produce
intense rainfall causing flooding. Thus a barrier would keep flood waters in as well as keeping
storm surge out, providing little net benefit in Lake Macquarie waterway. Such engineered
barriers are also very expensive to construct and maintain, and may have significant
environmental impacts. Such barriers will have no effect on long-term sea level and lake level
rise.
6.2.3. Catchment Treatment
Catchment treatment modifies the runoff characteristics of the catchment to reduce inflows to
the lake. For an urban catchment, this involves planning to maximise the amount of pervious
area, maintaining natural channels where practical and the use of on-site detention (now called
Water Sensitive Urban Design or WSUD). For a rural catchment, this involves limiting
deforestation or contour ploughing of hill slopes. These measures can reduce the volumes of
storm water run-off in relatively small, frequent events, typically up to about 5 year ARI events.
They have little effect in larger, less frequent events, above say a 20 ARI event. These
measures can be effective on small catchments but have a negligible impact on large
catchments such as Lake Macquarie waterway.
As a general concept, catchment treatment techniques and WSUD should be encouraged (eg.
on-site detention, limit on-site imperviousness for developments, controls on rural land use)
along with water quality and other environmental controls as these approaches provide
significant local drainage and non-flooding benefits. However as a management measure to
reduce flood levels on the foreshore of the Lake Macquarie waterway they are ineffectual and
are not supported for this purpose.
6.2.4. Voluntary Purchase of Buildings
Voluntary purchase of the buildings inundated above floor level in the 100 year ARI flood (over
800 at say $500 000+ per building) cannot be economically or socially justified. Generally,
Government funding is only available for voluntary purchase of buildings that are frequently
flooded in a high hazard area. Even purchasing the approximately 50 buildings inundated
above floor level in the February 1990 and June 2007 events would cost approximately over $25
million. Voluntary purchase may also introduce a number of social problems (residents are
unwilling to sell, or are unable to find alternative accommodation with similar attributes) which
can be difficult to resolve. Results from previous public consultation programs indicated little
support for this measure.
In some flood liable areas individual buildings may be suitable for voluntary purchase due to
their particular circumstances (isolation, high hazard, regularly flooded). In the foreshore areas
surrounding the lake, no individual building has been identified as being suitable for voluntary
purchase.
However, this option may be more practical when considering land and buildings affected by
permanent inundation. Protection measures for these properties may be expensive to build and
maintain, and may have a high environmental impact, making voluntary purchase or other forms

Lake Macquarie Waterway Flood Risk Management Study and Plan
WMAwater
29076:LakeMacFRMS.docx:26 June 2012 59
of compensation more attractive. Such purchases are not considered necessary at this stage,
and are not likely to be required for many years, but should be included in planning for future
management of sea level rise in vulnerable areas.
6.3. Flood Modification Measures
Flood modification involves changing the behaviour of the flood itself, by reducing flood levels or
velocities, or excluding floodwaters from areas under threat. This includes:
dams (not considered further – see 6.2.1),
retarding basins (not considered further – see 6.2.1)
entrance modifications (not considered further – see 6.2.2),
levees, flood gates, pumps,
local drainage issues,
assessment of wind wave runup.
Discussion on each of these measures is provided in the following sections.
6.3.1. Levees, Flood Gates and Pumps
DESCRIPTION
Levees are built to exclude previously inundated areas of the foreshore from flooding or
inundation from the lake up to a certain design event. They are commonly used on large river
systems (eg. Hunter and Macleay Rivers) but can also be found on small creeks in urban areas.
They are used less frequently on coastal estuaries, but there are flood levees to mitigate lake
flooding at, for example, North Entrance on Tuggerah Lakes in Wyong Council LGA.
Flood gates allow local runoff to be drained from an area (say an area protected by a levee)
when the external level is low, but when the river or lake is elevated, the gates prevent
floodwaters from the river entering the area (they are commonly installed on drainage systems
within a levee area).
Pumps are generally also associated with levee designs. They are installed to remove local
runoff behind levees when flood gates are closed or if there are no flood gates. Unless designed
for the PMF, levees will be overtopped. Under overtopping conditions the rapid inundation may
produce a situation of greater hazard than exists today. This may be further exacerbated if the
community is under the false sense of security that the levee has “solved” the flood problem (as
happened with Hurricane Katrina in New Orleans, USA).
DISCUSSION
There are no levee systems on the foreshores of the Lake Macquarie waterway. On Tuggerah
Lakes (south of Lake Macquarie waterway) there is a levee with associated flood gates at The
Entrance North, with Wilfred Barrett Drive acting as the levee bank. Photographs from the
February 1990 and June 2007 floods indicate that in both events there was considerable
flooding within the levee area. It is unclear whether this was due to the local catchment runoff
being unable to drain away successfully to the lake or inflow from malfunctioning flap gates from
the lake. Certainly Wilfred Barrett Drive (the levee) was not overtopped. Some of the key
Lake Macquarie Waterway Flood Risk Management Study and Plan
WMAwater
29076:LakeMacFRMS.docx:26 June 2012 60
issues regarding levees are summarised in Table 24.
Levees have been considered for areas around the foreshore however there are no obvious
areas (inability to tie into high ground, likely to have a low cost benefit ratio due to the length of
structure required) where a levee similar to The Entrance North could be constructed. At
Swansea it is likely that access/visual amenity and cost will be significant issues. At Marks Point
- Belmont these issues together with ensuring the upstream catchment does not cause flooding
from within the protected areas are the major issues. In summary there are no foreshore
management areas where a levee could be built that would not introduce some adverse impact,
however from an engineering perspective these can all be overcome. The main concerns are
social and to a lesser extent environmental issues.
Whilst at first glance levees may appear a viable means of protection of existing developments
from the effects of sea level rise the above concerns with levees still apply. Once it is realised
that levees may be the only solution to protect existing developments from sea level rise there
may be a greater acceptance by the community.
Pumps have been suggested as a means of addressing the “internal drainage” problem but are
not widely used in levee type situations in NSW. Some of the drawbacks of employing pumps
are:
high capital cost. In many instances two sets of pumps are installed in case one set is
being repaired or maintained when the flood occurs,
high maintenance cost. The pumps have to be regularly maintained and tested by
trained personnel,
relatively high risk of failure. Experience in other areas has shown that as the pumps
are used only infrequently there is a relatively high risk of failure due to:
o inadequate maintenance of the pumps causing seals or valves to deteriorate,
o power cuts caused by the storm,
o failure of the device which activates the pumps.
The pumps are only required to operate for a short time (several hours) possibly once or twice a
year. If they fail to start or fail during the event there is practically no likelihood that service
personnel will be able to restart them prior to the peak level being reached. An alternative to
pumps is to install additional flap gated culverts and these can be more cost effective though
also can fail (mainly due to vandalism or vegetation “jamming” the mouth open).
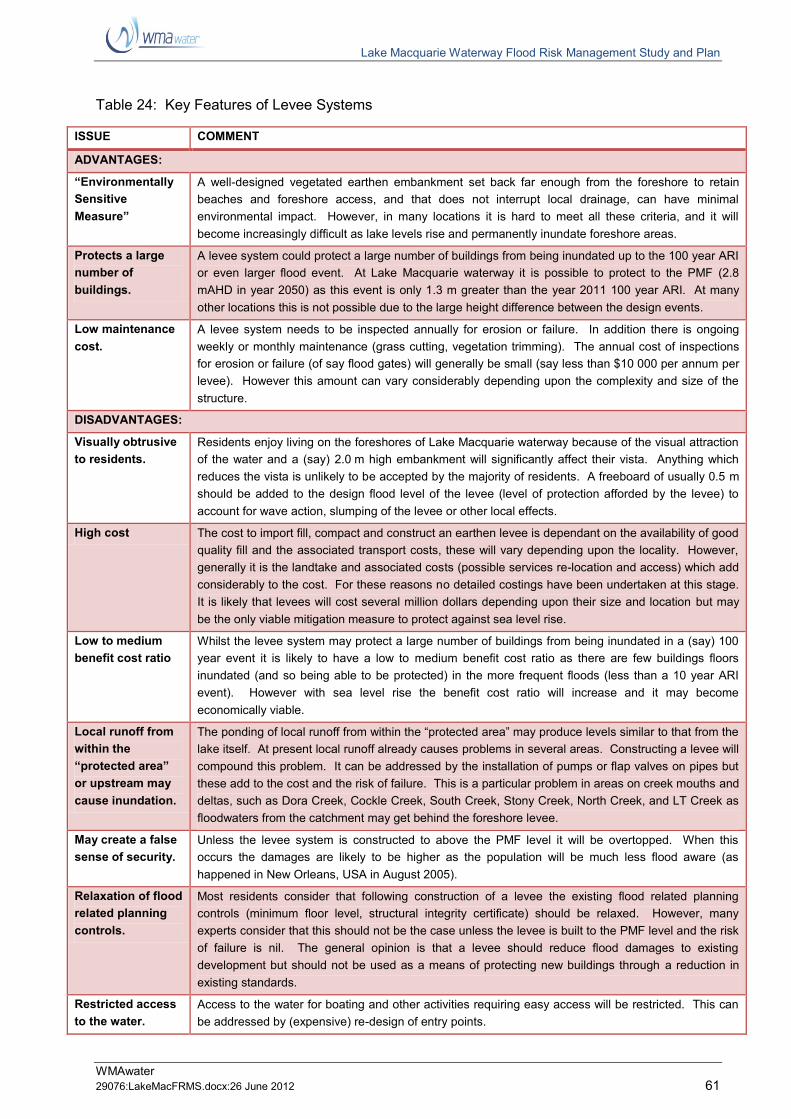
Lake Macquarie Waterway Flood Risk Management Study and Plan
WMAwater
29076:LakeMacFRMS.docx:26 June 2012 61
Table 24: Key Features of Levee Systems
ISSUE COMMENT
ADVANTAGES:
“Environmentally
Sensitive
Measure”
A well-designed vegetated earthen embankment set back far enough from the foreshore to retain
beaches and foreshore access, and that does not interrupt local drainage, can have minimal
environmental impact. However, in many locations it is hard to meet all these criteria, and it will
become increasingly difficult as lake levels rise and permanently inundate foreshore areas.
Protects a large
number of
buildings.
A levee system could protect a large number of buildings from being inundated up to the 100 year ARI
or even larger flood event. At Lake Macquarie waterway it is possible to protect to the PMF (2.8
mAHD in year 2050) as this event is only 1.3 m greater than the year 2011 100 year ARI. At many
other locations this is not possible due to the large height difference between the design events.
Low maintenance
cost. A levee system needs to be inspected annually for erosion or failure. In addition there is ongoing
weekly or monthly maintenance (grass cutting, vegetation trimming). The annual cost of inspections
for erosion or failure (of say flood gates) will generally be small (say less than $10 000 per annum per
levee). However this amount can vary considerably depending upon the complexity and size of the
structure.
DISADVANTAGES:
Visually obtrusive
to residents. Residents enjoy living on the foreshores of Lake Macquarie waterway because of the visual attraction
of the water and a (say) 2.0 m high embankment will significantly affect their vista. Anything which
reduces the vista is unlikely to be accepted by the majority of residents. A freeboard of usually 0.5 m
should be added to the design flood level of the levee (level of protection afforded by the levee) to
account for wave action, slumping of the levee or other local effects.
High cost The cost to import fill, compact and construct an earthen levee is dependant on the availability of good
quality fill and the associated transport costs, these will vary depending upon the locality. However,
generally it is the landtake and associated costs (possible services re-location and access) which add
considerably to the cost. For these reasons no detailed costings have been undertaken at this stage.
It is likely that levees will cost several million dollars depending upon their size and location but may
be the only viable mitigation measure to protect against sea level rise.
Low to medium
benefit cost ratio Whilst the levee system may protect a large number of buildings from being inundated in a (say) 100
year event it is likely to have a low to medium benefit cost ratio as there are few buildings floors
inundated (and so being able to be protected) in the more frequent floods (less than a 10 year ARI
event). However with sea level rise the benefit cost ratio will increase and it may become
economically viable.
Local runoff from
within the
“protected area”
or upstream may
cause inundation.
The ponding of local runoff from within the “protected area” may produce levels similar to that from the
lake itself. At present local runoff already causes problems in several areas. Constructing a levee will
compound this problem. It can be addressed by the installation of pumps or flap valves on pipes but
these add to the cost and the risk of failure. This is a particular problem in areas on creek mouths and
deltas, such as Dora Creek, Cockle Creek, South Creek, Stony Creek, North Creek, and LT Creek as
floodwaters from the catchment may get behind the foreshore levee.
May create a false
sense of security. Unless the levee system is constructed to above the PMF level it will be overtopped. When this
occurs the damages are likely to be higher as the population will be much less flood aware (as
happened in New Orleans, USA in August 2005).
Relaxation of flood
related planning
controls.
Most residents consider that following construction of a levee the existing flood related planning
controls (minimum floor level, structural integrity certificate) should be relaxed. However, many
experts consider that this should not be the case unless the levee is built to the PMF level and the risk
of failure is nil. The general opinion is that a levee should reduce flood damages to existing
development but should not be used as a means of protecting new buildings through a reduction in
existing standards.
Restricted access
to the water. Access to the water for boating and other activities requiring easy access will be restricted. This can
be addressed by (expensive) re-design of entry points.
Lake Macquarie Waterway Flood Risk Management Study and Plan
WMAwater
29076:LakeMacFRMS.docx:26 June 2012 62
SUMMARY
A review of the flood liable areas surrounding Lake Macquarie waterway indicates that there are
no areas where a levee system, similar to that at The Entrance North on Tuggerah Lakes could
be constructed to protect existing buildings. The levee system at The Entrance North would
appear to not have worked successfully in the February 1990 or June 2007 event due to issues
with internal drainage.
This measure is one of the only means of protecting existing buildings from sea level rise and
therefore must be considered further. From an engineering perspective it is possible to
construct levees at say Swansea and Marks Point, however in the first instance community
acceptance must be obtained, land availability assessed, and environmental and social impacts
considered. It is likely that such levee systems will have much higher benefit cost ratios in areas
that will be permanently inundated by sea level rise (lake level rises from 0.1 mAHD to
1.0 mAHD).
6.3.2. Local Drainage Issues
DESCRIPTION
Local stormwater flooding is probably the flooding mechanism which is most widely identified by
the community as being of concern, the only exception being where the residents actually
experienced the February 1990 or the June 2007 floods. Local flooding occurs in nearly all
suburbs on the foreshores due to the relatively flat grades. Many residents consider that local
flooding is a significant issue (possibly many view this as a greater issue than the more
infrequent flooding of Lake Macquarie waterway) and report this to Council.
DISCUSSION
Local flooding results from rainfall over the local catchment being unable to quickly drain away.
Generally it only occurs after several hours of rain and will not cause above floor inundation. In
the past there has been extensive ponding (areas such as Swansea or Marks Point) but this has
been significantly reduced with installation of kerb and guttering in the streets adjoining the lake.
Ponding in yards still occurs and may take several days to drain away. It is likely to be
associated with high water table conditions and is exacerbated when in high tides occur
simultaneously or if the drainage system is restricted by debris, silt or vegetation. This still
occurs to some extent around Chapman oval in Swansea.
Upgrading the sub-surface system to improve yard to road drainage would improve the situation
in the short term but is unlikely to solve the longer term problem with sea level rise and would
not be cost effective (on the basis of a reduction in tangible damages). Flap gates on culverts
can prevent back flow from the lake but apart from at Swansea this is unlikely to be an issue. At
Swansea on the northern side facing the Swansea Channel their application might be more
beneficial and should be investigated further.
Debris (litter, vegetation) in the piped system is not considered to be a major contributing factor
according to Council officers. Installation of agricultural drains in the yards would assist in
reducing the incidence of local flooding. As the benefits of the works are largely intangible
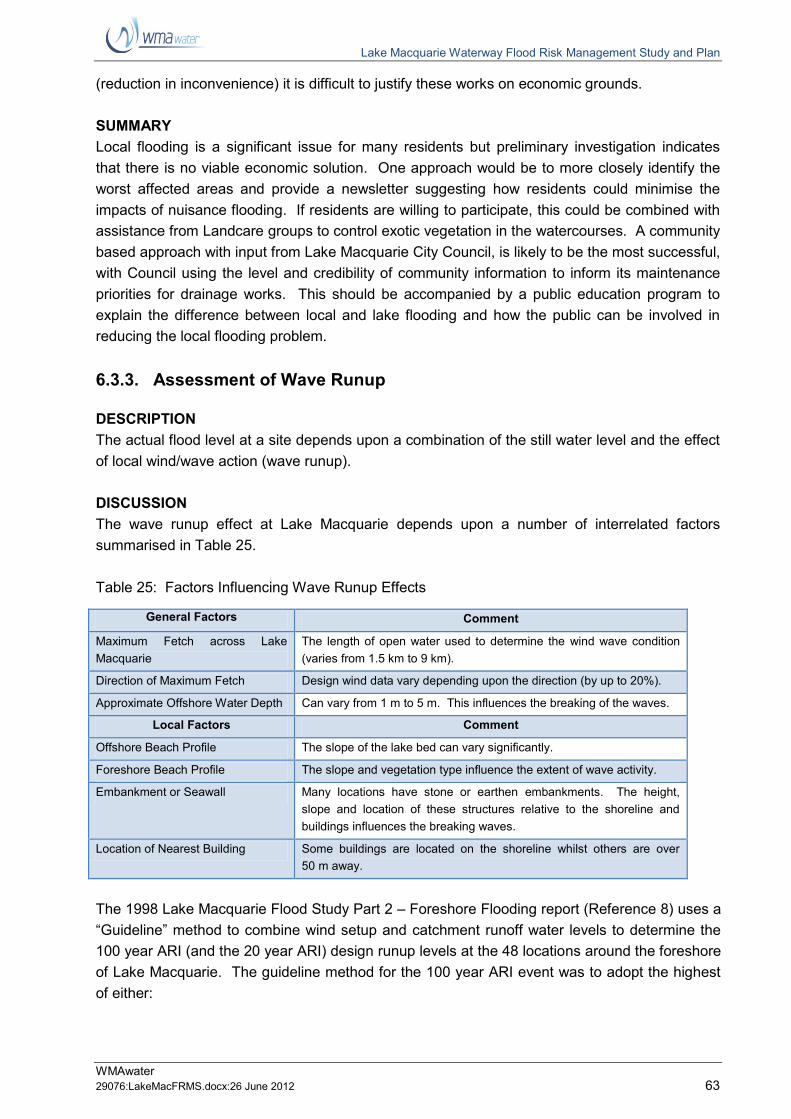
Lake Macquarie Waterway Flood Risk Management Study and Plan
WMAwater
29076:LakeMacFRMS.docx:26 June 2012 63
(reduction in inconvenience) it is difficult to justify these works on economic grounds.
SUMMARY
Local flooding is a significant issue for many residents but preliminary investigation indicates
that there is no viable economic solution. One approach would be to more closely identify the
worst affected areas and provide a newsletter suggesting how residents could minimise the
impacts of nuisance flooding. If residents are willing to participate, this could be combined with
assistance from Landcare groups to control exotic vegetation in the watercourses. A community
based approach with input from Lake Macquarie City Council, is likely to be the most successful,
with Council using the level and credibility of community information to inform its maintenance
priorities for drainage works. This should be accompanied by a public education program to
explain the difference between local and lake flooding and how the public can be involved in
reducing the local flooding problem.
6.3.3. Assessment of Wave Runup
DESCRIPTION
The actual flood level at a site depends upon a combination of the still water level and the effect
of local wind/wave action (wave runup).
DISCUSSION
The wave runup effect at Lake Macquarie depends upon a number of interrelated factors
summarised in Table 25.
Table 25: Factors Influencing Wave Runup Effects
General Factors
Comment Maximum Fetch across Lake
Macquarie
The length of open water used to determine the wind wave condition
(varies from 1.5 km to 9 km). Direction of Maximum Fetch
Design wind data vary depending upon the direction (by up to 20%).
Approximate Offshore Water Depth
Can vary from 1 m to 5 m. This influences the breaking of the waves.
Local Factors
Comment
Offshore Beach Profile
The slope of the lake bed can vary significantly.
Foreshore Beach Profile
The slope and vegetation type influence the extent of wave activity.
Embankment or Seawall
Many locations have stone or earthen embankments. The height,
slope and location of these structures relative to the shoreline and
buildings influences the breaking waves. Location of Nearest Building
Some buildings are located on the shoreline whilst others are over
50 m away.
The 1998 Lake Macquarie Flood Study Part 2 – Foreshore Flooding report (Reference 8) uses a
“Guideline” method to combine wind setup and catchment runoff water levels to determine the
100 year ARI (and the 20 year ARI) design runup levels at the 48 locations around the foreshore
of Lake Macquarie. The guideline method for the 100 year ARI event was to adopt the highest
of either:
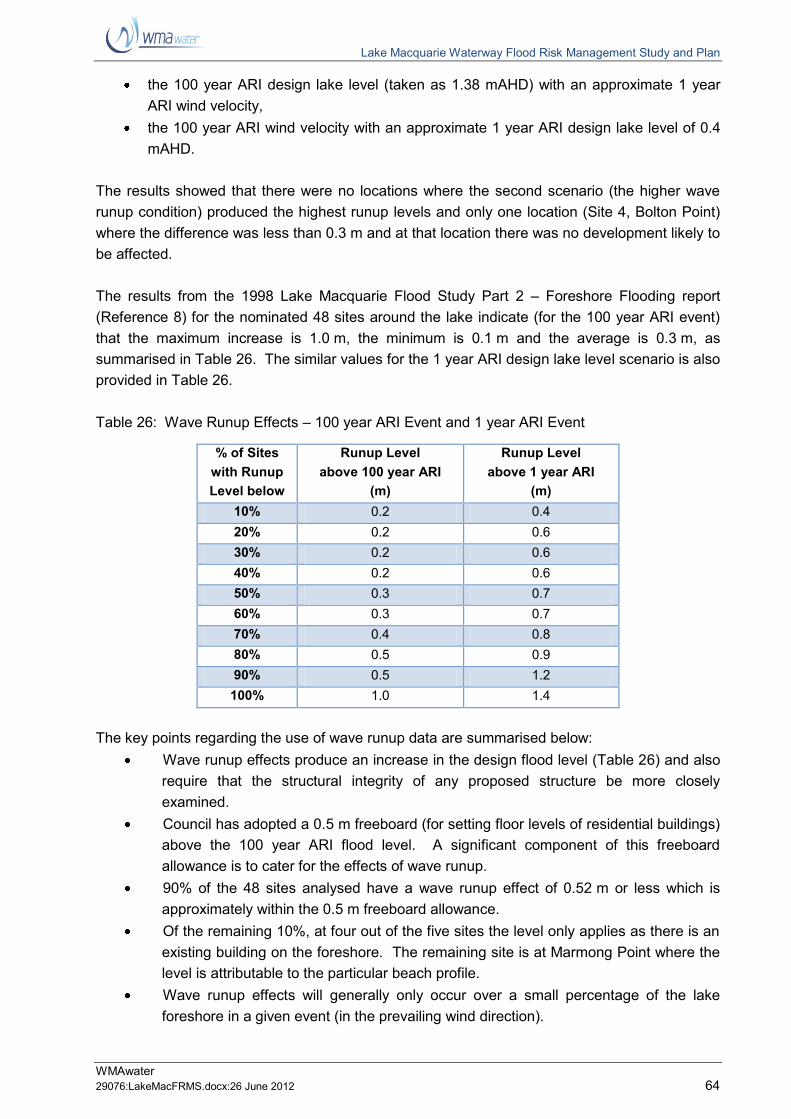
Lake Macquarie Waterway Flood Risk Management Study and Plan
WMAwater
29076:LakeMacFRMS.docx:26 June 2012 64
the 100 year ARI design lake level (taken as 1.38 mAHD) with an approximate 1 year
ARI wind velocity,
the 100 year ARI wind velocity with an approximate 1 year ARI design lake level of 0.4
mAHD.
The results showed that there were no locations where the second scenario (the higher wave
runup condition) produced the highest runup levels and only one location (Site 4, Bolton Point)
where the difference was less than 0.3 m and at that location there was no development likely to
be affected.
The results from the 1998 Lake Macquarie Flood Study Part 2 – Foreshore Flooding report
(Reference 8) for the nominated 48 sites around the lake indicate (for the 100 year ARI event)
that the maximum increase is 1.0 m, the minimum is 0.1 m and the average is 0.3 m, as
summarised in Table 26. The similar values for the 1 year ARI design lake level scenario is also
provided in Table 26.
Table 26: Wave Runup Effects – 100 year ARI Event and 1 year ARI Event
% of Sites
with Runup
Level below
Runup Level
above 100 year ARI
(m)
Runup Level
above 1 year ARI
(m)
10% 0.2 0.4
20% 0.2 0.6
30% 0.2 0.6
40% 0.2 0.6
50% 0.3 0.7
60% 0.3 0.7
70% 0.4 0.8
80% 0.5 0.9
90% 0.5 1.2
100% 1.0 1.4
The key points regarding the use of wave runup data are summarised below:
Wave runup effects produce an increase in the design flood level (Table 26) and also
require that the structural integrity of any proposed structure be more closely
examined.
Council has adopted a 0.5 m freeboard (for setting floor levels of residential buildings)
above the 100 year ARI flood level. A significant component of this freeboard
allowance is to cater for the effects of wave runup.
90% of the 48 sites analysed have a wave runup effect of 0.52 m or less which is
approximately within the 0.5 m freeboard allowance.
Of the remaining 10%, at four out of the five sites the level only applies as there is an
existing building on the foreshore. The remaining site is at Marmong Point where the
level is attributable to the particular beach profile.
Wave runup effects will generally only occur over a small percentage of the lake
foreshore in a given event (in the prevailing wind direction).
Lake Macquarie Waterway Flood Risk Management Study and Plan
WMAwater
29076:LakeMacFRMS.docx:26 June 2012 65
The effects will vary in time and space as a result of changing foreshore profiles. This
may occur naturally (sedimentation, erosion, vegetation growth) or as a result of
human activities (construction).
New buildings located close to the foreshore will experience the greatest wave runup
impact (increased design flood level and increased potential for structural damage).
Further away the impacts reduce significantly. The zone of influence of the wave
runup effect varies considerably depending upon the topography of the area. In a
relatively flat area (Swansea) the impact may be over 200 m whilst in a steeply rising
foreshore area the impact may be 10 m or less.
Of the factors influencing wave runup (Table 25) only three, foreshore beach profile,
embankment or seawall and location of nearest building, can possibly be modified to
reduce the impact. The likely adverse social impact, the high cost and likely low
benefit cost ratio makes any modification measure impractical.
Further discussion on wave runup and the likely impacts of climate change on wave runup are
provided in Section 8 of the 2012 Lake Macquarie Waterway Flood Study (Reference 6).
SUMMARY
Council already includes consideration of wave impacts in their development approval process
for foreshore properties. The considerations include: setbacks to remove properties from the
wave impact zone; technical assessment of foundation stability; and wave-resistant foundation
design. Council also considers foreshore stabilisation works in areas of high impact and/or
foreshore erosion, using cobble beaches, sloping rock walls, and vegetated back-shore areas to
help dissipate wave energy and prevent erosion.
This action is considered adequate at this time. Further monitoring will ensure that it is
accurately quantified and if necessary Council’s procedure should be modified as new
information becomes available. The approval process should be modified to ensure that any
proposed development on the foreshore does not exacerbate the situation for surrounding
properties and is considered within the proposed Adaptation Plans.
6.4. Property Modification Measures
6.4.1. House Raising and Flood Proofing
DESCRIPTION
House raising has been widely used throughout NSW to eliminate or significantly reduce
flooding of habitable floors. However it has limited application as it is not suitable for all building
types. Also, it is more common in areas where there is a greater depth of flooding than on the
Lake Macquarie foreshore and raising the houses allows creation of an underfloor garage or
non-habitable area (though it is essential that this underfloor area and its contents will not incur
flood damages, as if it is infilled this may negate the benefits of house raising). House raising
and flood proofing are not suitable options for properties that are affected by permanent
inundation as, while the building may be above lake flood levels, the land and infrastructure will
be affected by the rising waters.
Lake Macquarie Waterway Flood Risk Management Study and Plan
WMAwater
29076:LakeMacFRMS.docx:26 June 2012 66
DISCUSSION
House raising is suitable for most non-brick single storey houses on piers and is particularly
relevant to those situated in low hazard areas on the foreshore. The benefit of house raising is
that it eliminates flooding to the height of the floor and consequently reduces the flood damages.
It should be noted that larger floods than the design flood (used to establish the minimum floor
level) will inundate the house floor (although this is unlikely to be an issue for the Lake
Macquarie waterway). It also provides a “safe refuge” during a flood, assuming that the building
is suitably designed for the water and debris loading. However the potential risk to life is still
present if residents choose to enter floodwaters or are unable to leave the house during a
medical emergency, or larger floods than the design flood occurs.
Funding is available for house raising in NSW and has been widely undertaken in rural areas
(Macleay River floodplain) and urban areas (Fairfield and Liverpool). An indicative cost to raise
a house is $60,000 though this can vary considerably depending on the specific details of the
house. Home raising was the traditional method of eliminating tangible flood damages but is
less prevalent today in NSW as:
the majority of suitable buildings have already been raised,
the houses that can be raised are nearing the end of their useful life,
house styles and requirements (ensuites, cabling, air conditioning) means that the
timber piered homes are less attractive than in the past,
most households indicate that they would prefer to use the funding to construct a new
house,
re-building rather than renovations are becoming more cost effective. In many
suburbs in Sydney 30 year old brick homes are being demolished as the cost per m2
to renovate is up to twice the per m2 cost of re-building. Thus if 50% of the house is
to be renovated it is cheaper to re-build.
The house raising potential at Lake Macquarie waterway cannot be accurately assessed due to
the lack of detail in the floor level database. However it is acknowledged that there will be a lot
(>100 houses) that could be raised (though many may be impractical or the owners are
unwilling). Subsidised house raising has been available in Lake Macquarie for more than 30
years, but only about 20 owners have used the scheme, and none since 2001. This option is
unattractive to home owners, and subsidies from the NSW Government are difficult to obtain.
An alternative to house raising for buildings that are not compatible, is flood proofing or sealing
off the entry points to the building. This measure has the advantage that it is generally less
expensive than house raising and causes less social disruption. However this measure is really
only suitable for commercial and industrial buildings where there are only limited entry points
and aesthetic considerations are less of an issue. Also there are issues of compliance and
maintenance. Based upon our experience we do not consider flood proofing a viable measure
for existing houses on the foreshores of the Lake Macquarie waterway. However flood
compatible building or renovating techniques should be employed for extensions or renovations
where appropriate. Guidelines are provided in a booklet “Reducing Vulnerability to Flood
Damage” prepared in 2006 for the Hawkesbury-Nepean Floodplain Management Steering
Committee (Reference 15).

Lake Macquarie Waterway Flood Risk Management Study and Plan
WMAwater
29076:LakeMacFRMS.docx:26 June 2012 67
A house raising/re-building subsidy scheme has been considered whereby the home owner can
put the payment towards the cost of a replacement house constructed in a flood-compatible way
rather than raising the existing building. Such a scheme has been promoted in other flood prone
communities in NSW where there are large numbers of houses that could be raised but many
owners wish to re build and/or consider it more cost effective. This scheme would provide a
financial incentive to undertake house raising or re-building works and would be available to all
house owners whose house is flood liable. However such a scheme is not expected to receive
funding from the federal or State Government’s flood mitigation program and thus is unlikely to
be affordable.
Slab-on-ground construction is probably the current most common method of housing
construction. A significant issue with this mode of construction is that the building floor is
generally not much higher than the ground level, thus there is a risk with overland flow or
shallow depths of flooding that some above-floor flooding will occur. House raising has been
undertaken for slab on ground houses in the past (Fairfield) and should be investigated further in
order to protect existing buildings from sea level rise. Slab-on-ground construction is much
harder to adapt if sea level rise or other climate changes require a more radical or speedier
response than currently predicted.
Subsidies for house raising implies that Council and the NSW Government will be maintaining
the existing services and infrastructure for the life of the building, including provision for sea
level rise. This situation needs to be reviewed before approval is given to ensure that these
services can actually be provided for the life of the asset.
House raising can also be a means by which a new house can be built at the existing FPL but is
constructed in such a manner that it can be raised in the future as climate change impacts
occur. This type of modular/adaptive housing construction is not common in NSW but is
employed in the USA where the habitable floor may be several metres above the ground. A
concern with this approach is that the surrounding ground in the property may remain saturated
due to rising water tables and will also become more frequently inundated. Also of concern is
the increase in maintenance required to ensure the condition of the roads remains acceptable
and evacuation routes are maintained. These issues will need to be addressed if this type of
housing construction is permitted.
As limited funding for house raising is available from the NSW Government, future dwellings in
areas subject to sea level rise should incorporate adaptable design elements to enable them to
be more easily raised in the future.
SUMMARY
For the majority of currently flood affected buildings around Lake Macquarie waterway house
raising and flood proofing are not viable means of flood protection. However if advertised and
favourable responses are obtained from the owners a house raising subsidy scheme could be
further investigated (subject to ensuring that Lake Macquarie City Council and the NSW
Government will be maintaining the existing services for the life of the building and including sea
level rise).
Lake Macquarie Waterway Flood Risk Management Study and Plan
WMAwater
29076:LakeMacFRMS.docx:26 June 2012 68
In addition a house re-building subsidy scheme should be initiated in order to provide an
incentive to all house owners whose house floor is flood liable.
Council should also consider whether slab-on-ground construction is an appropriate form of
house construction in areas that will be subject to a climate change induced sea level rise. An
alternative is to require houses that can have service connections adjusted, their floors easily
raised in the future, or be re-located if the risk becomes too great.
6.4.2. Strategic Planning Issues
DESCRIPTION
The division of flood prone land into appropriate land use zones can be an effective and long
term means of limiting danger to personal safety and flood damage to future developments.
Zoning of flood prone land should be based on an objective assessment of land suitability and
capability, flood risk, environmental and other factors. In many cases, it is possible to develop
flood prone lands without resulting in undue risk to life and property.
The strategic assessment of flood risk (as part of the present study) can prevent new
development occurring in areas with a high hazard and/or with the potential to have significant
impacts upon flood behaviour in other areas. It can also reduce the potential damage to new
developments likely to be affected by flooding to acceptable levels. Development control
planning includes both zoning and development controls.
With sea level rise the continued habitation or re-development of an area may become
increasingly difficult to sustain, as the risk increases, and the maintenance of services and
infrastructure becomes increasingly expensive. There are several flood liable areas in NSW
where past floods have caused relocation to higher ground (Terara village to Nowra on the
Shoalhaven River following the 1860 and 1970 floods) or the gradual decline of an area with
limited potential for re-development (Horseshoe Bend at Maitland following the February 1955
flood).
The two issues of continued habitation or approval for re-development must be considered in
light of future elevated flood levels and the “normal” lake level due to sea level rise.
DISCUSSION
Flood extent mapping (Appendix B) has been undertaken as part of this study, based on the
best available information (airborne laser scanning and accurate to ±0.15 m) and should be
used by Council to identify properties subject to flood related development controls and as a
result of sea level rise.
It may be that some existing developed areas cannot be protected by adaptation (house raising)
or defence (levees) mechanisms. For these areas Council and the community will need to
establish some form of retreat or re-development strategy. While such measures will not be
necessary for many years, planning should start now to allow sufficient time to develop suitable
adaptation plans, funding models, and market mechanisms to make the transition as easy and
Lake Macquarie Waterway Flood Risk Management Study and Plan
WMAwater
29076:LakeMacFRMS.docx:26 June 2012 69
equitable as possible.
Each of these areas must be examined in detail as it may be that some form of “land swap” or
similar can be achieved (as has being envisaged following the January 2011 floods in south east
Queensland). For example, current developable land is turned into open space or some other
use that will not be as affected by sea level rise. Alternatively some form of insurance fund or
similar might be established to “pay out” affected land owners. The details of such a scheme
have not been evaluated. A retreat policy needs careful consideration and significant public
consultation before it can be implemented.
Many residential properties have land at or below 1 mAHD and during non-flood times this land
is not inundated as the “normal” water level is around 0.1 mAHD with a maximum annual water
level of around 0.5 mAHD. However during flood times such as the June 2007 long weekend
event, where the water level reached approximately 1.1 mAHD, floodwaters can remain above
0.8 mAHD for over 24 hours.
With sea level rise the “normal” water level in Lake Macquarie waterway will rise by a similar
amount to the ocean. This means that low lying land will be more frequently inundated by tides
and at times of elevated ocean levels (storm surge, for example). With a 0.9 m sea level rise all
land below 1 mAHD (approximately the existing 15 year ARI flood level) will be permanently
inundated. It is predicted that this level will be the “normal” water level in Lake Macquarie
waterway by approximately the year 2100. Consideration needs to be given to planning for
when the land becomes unsuitable for habitation due to frequent inundation.
Filling
Filling of the foreshore is generally not considered an acceptable means of permitting future
development as it “destroys” the ecology of the area, disrupts the lake foreshore processes, and
affects local drainage. On riverine floodplains filling can raise flood levels by eliminating
temporary floodplain storage and, in some cases, reduce the hydraulic conveyance. At Lake
Macquarie waterway the hydraulic effect on flood levels will be negligible given the size of lake
storage in the existing foreshore and the likely quantity of fill. If the ecological issues can be
overcome this will provide a means of permitting future re-development at higher levels at the
subdivision scale.
Filling close to the shoreline is more problematic, as it will have a greater environmental impact,
and will be affected by rising lake levels. Even if the land surface is raised, rising groundwater
levels, foreshore recession, and increasing difficulty with drainage means filling close to the lake
shoreline may not be a suitable or effective solution.
Managed filling could also be adopted for infill development as long as care is taken to ensure
local drainage issues are not exacerbated and services (roads, sewer, water) can be
accommodated. Possibly a staged approach can be undertaken where the new buildings and
garages are constructed on elevated pads and in time the remainder of the property and the
roads are raised. This piece-meal approach can lead to disharmony within the community when
there are some filled and some non-filled properties.

Lake Macquarie Waterway Flood Risk Management Study and Plan
WMAwater
29076:LakeMacFRMS.docx:26 June 2012 70
The advantage of this approach is that it allows existing land owners to remain on their property
and still enjoy the qualities of the area without construction of levees.
Planned Retreat
Permanent inundation, increased flooding, and foreshore recession as a result of rising lake
levels may make some land unsuitable for future development or re-development.
However there is uncertainty regarding the predicted sea level rise or its timeframe. Thus it may
be possible to permit development in these areas with the proviso that if the sea level rise
eventuates then the development must retreat according to a planned retreat strategy. This
strategy could be based on a suite of conditions, or thresholds including groundwater levels,
inundation in non-flood times, continued provision of services and infrastructure, or availability of
access allowing residents to stay until site conditions are considered unsuitable. While such
measures will not be necessary for many years, planning should start now to allow sufficient
time to develop suitable adaptation plans, funding models, and market mechanisms to make the
transition as easy and equitable as possible.
Limit the Extent of Development
Future residential development in low lying areas could be restricted to the “lowest residential”
zoning. Thus any development that will increase the present residential density would not be
permitted. Thus dual occupancy, sub division or increasing the site coverage (increasing the
size of the building) would not be permitted. In affected areas already zoned for medium density
residential or urban centres, this could mean “back-zoning” to a lower development density,
which may have legal and financial ramifications for Council. Legislative and financial options
for Council and property owners to help deal with these situations should be raised with the
NSW and federal Governments, as the problem will occur in all coastal LGAs. There is also the
possibility of establishing “transferable development rights” or similar schemes to encourage
voluntary changes to inappropriate property zonings. These controls could be further refined
through local Area Adaptation Plans.
Ensuring Adequate Evacuation
For many of the existing flood liable areas (Dora Creek and Swansea), even if house raising,
construction of a levee or filling was undertaken, and the services issues resolved, there is still
no safe access to high ground in flood. Whilst in a medical emergency a helicopter or flood boat
could access the area many residents will attempt to cross the floodwaters (collect children,
leave house, obtain food). This represents a burden on the SES to “rescue” residents and a risk
to life to the residents who cross floodwaters unprepared.
At present many locations do not have adequate flood access and this will be exacerbated with
sea level rise. The lack of adequate access may mean that some areas should not be further
developed.
SUMMARY
Strategic planning is the main approach for reducing flood damages to future developments and
in particular to adapt to the implications of the sea level rise benchmarks.

Lake Macquarie Waterway Flood Risk Management Study and Plan
WMAwater
29076:LakeMacFRMS.docx:26 June 2012 71
No detailed assessment of each foreshore area has been undertaken or the necessary public
consultation to determine which strategy should be employed, through local area adaptation
plans, for example. It is recommended that this process be undertaken (it may take several
years) to develop an appropriate approach for each foreshore management area.
This study has nominated seven foreshore management areas, however these could be further
sub-divided into smaller areas if required. The three areas likely to experience the greatest
impact from sea level rise are Marks Point-Belmont, Swansea-Pelican-Blacksmiths and Dora
Creek. In some areas there are fewer properties likely to be affected (Cockle Creek and
Warners Bay) and the adaptation issues may introduce less significant challenges. Based on
feedback from the proposed community consultation program Council will need to initiate a
program to examine each area.
6.4.3. Rezoning
The 2010 NSW Coastal Planning Guideline: Adapting to Sea Level Rise (Reference 14) sets out
principles for strategic and statutory land use planning in coastal areas. Principle 3 of the
Guideline is to “avoid intensifying use in coastal risk areas…” and Principle 4 is to “consider
options to reduce land use intensity in coastal risk areas where feasible”. While it seems
“common sense” to prevent additional development in vulnerable areas this could, in effect,
‘freeze’ new development in all flood affected foreshore areas. This is contrary to the aim of the
NSW Government’s 2005 Floodplain Development Manual (Reference 5) which seeks to allow
new development in flood affected areas, provided the risk is adequately assessed and
managed.
In general, it is likely to increase the risk to persons and property, if more buildings,
infrastructure and people are located in flood hazard areas, particularly high hazard areas and
areas vulnerable to permanent inundation. So, land in the lake flood hazard areas should not be
re-zoned if it increases development intensity. Individual developments that increase
development intensity within current zonings, should be assessed against the increased risk to
persons and property as a result of the development to ensure there is no increase in risk.
In some specific circumstances, rezoning of flood liable land for higher density development
could encourage people to purchase and demolish existing flood liable property and redevelop
the area in accordance with Council’s design floor level policy. This strategy is difficult to
implement, as generally the surrounding residents, who are not flood affected, consider that the
quality of the area would be adversely affected by the increased building density. Furthermore
the high cost to purchase the existing land and building is unlikely to make this measure
financially attractive to developers. Additional concerns are the cost to provide and maintain on
going services (particularly with sea level rise) as well as the likely lack of adequate flood
access. Such proposals should be considered against, at least, the criteria of “no increase in
risk compared to current risk” for the life of the development.
The wholesale rezoning of all flood liable lands is not appropriate, but this measure could be
used on a local scale as a means of removing or improving flood liable buildings.

Lake Macquarie Waterway Flood Risk Management Study and Plan
WMAwater
29076:LakeMacFRMS.docx:26 June 2012 72
6.4.4. Modification to the s149 Certificates
DESCRIPTION
Councils issue planning certificates to potential purchasers under Section 149 of the
Environmental Planning and Assessment Act of 1979. The function of these certificates is to
inform purchasers of planning controls and policies that apply to the subject land. Planning
certificates are an important source of information for prospective purchasers on whether there
are flood related development controls on the land. They need to rely upon the information
under both Section 149(2) and 149(5) in order to make an informed decision about the property.
It should be noted that only Part 2 is compulsory when a house is purchased and thus detail in
Part 5 may not be made known to the purchaser unless it is specifically requested. Under Part 2
Council is required to advise if it is aware of the flood risk as it is of any other known risk (bush
fire, land slip etc.).
The current wording shown on Section 149(2) and 149(5) certificates provides only limited
details of the extent of flood and sea level rise effects.
DISCUSSION
Because of the wide range of different flood conditions across NSW, there is no standard way of
conveying flood related information. As such, Councils are encouraged to determine the most
appropriate way to convey information for their areas of responsibility. This will depend on the
type of flooding, whether from major rivers or local overland flooding, and the extent of flooding
(whether widespread or relatively confined). It is noted that Council has for many years issued a
Flood Advisory Letter which has been well received. New technology allows the possibility of
this information being available through an on-line property inquiry.
It should be noted that the Section 149 certificate only relates to the subject land and not any
building on the property. This can be confusing or misleading to some.
The information provided under Part 2 of the certificate is determined by the legislation and
unless specifically included by the Council provides no indication of the extent of inundation.
Under Part 5 there is scope for providing this additional type of information. Residents in many
areas have suggested that insurance companies, lending authorities or other organisations may
disadvantage flood liable properties that have only a very small part of their property inundated
by floodwaters. Some Councils have addressed this concern by adding information onto Part 5
to show the percentage of the property inundated as well as floor levels and other flood related
information.
In addition the hazard category could be provided and also advice regarding climate change
increases in flood level.
Flood related development controls (such as stipulation of a minimum floor level at say the 100
year ARI plus a freeboard of 0.5 m – termed the Flood Planning Level or FPL) are the most
constructive measure for reducing flood damages to new residential dwellings. Developments
more vulnerable to flooding (hospitals, electricity sub stations, “seniors” housing) must consider
rarer events greater than the 100 year ARI when determining their FPL. With predicted sea

Lake Macquarie Waterway Flood Risk Management Study and Plan
WMAwater
29076:LakeMacFRMS.docx:26 June 2012 73
level rise the FPL is increased to account for climate change for the life of the development.
However, the FPL does not address the full range of issues when considering flood and
permanent inundation risk such as access and failure of essential services.
The 0.5 m freeboard should still be included in the FPL and, as recommended in the 2010 Flood
Risk Management Guide (Reference 3), it should not be assumed that the freeboard can take
full account of climate change. According to the 2005 Floodplain Development Manual
(Reference 5) the purpose of the freeboard is to provide reasonable certainty that the reduced
flood risk exposure provided by selection of a particular flood as the basis of a FPL is actually
provided given the following factors:
uncertainties in estimates of flood levels,
differences in water level because of “local factors”,
increases due to wave action,
the cumulative effect of subsequent infill development on existing zoned land, and
climate change.
In a real flood some of these factors may reduce the flood level (local factors) or not apply at all
(no wave action). Whilst climate change is included as one of the above factors there is no
advice as to what the contribution for each factor should be. The 2010 Flood Risk Management
Guide (Reference 3) states “Freeboard should not be used to allow for sea level rise impacts,
instead these should be quantified and applied separately..”. The 0.5 m freeboard allowance
allows for uncertainties, thus, if the best advice is that sea levels will rise by 0.9 m by the year
2100, the FPL should be calculated to include this rise in the modelled flood heights. The
climate change component in the 0.5 m freeboard allowance accounts for any uncertainty in
estimation of the 0.9 m sea levels rise, and other climate change factors that are more difficult to
predict such as changes in rainfall intensities and storm frequencies.
Whilst raising the floor levels will ensure that the floors are not flooded in the design event (with
sea level rise) there is still the issue of whether adequate services (sewer, roads) can be
provided and that the private land will be suitable for habitation (i.e not permanently or regularly
inundated so as to make the land unsuitable).
SUMMARY
It is recommended that Council consider revising the flood related information on the Section
149 Certificate, particularly to include notification about areas likely to be permanently inundated
by the “normal” lake level in the year 2100. There is an option for separate notifications for
flooding, and for permanent inundation as a result of predicted sea level rise.
As Council information for 149 Certificates and Development Restriction Certificates is obtained
mainly from computerised databases and maps, Council should investigate ways to make
property-based flooding information more accessible via its web-site.

Lake Macquarie Waterway Flood Risk Management Study and Plan
WMAwater
29076:LakeMacFRMS.docx:26 June 2012 74
6.4.5. Provision of Public Services
DESCRIPTION
The ability of public services (sewer pipes, pumps and treatment plants; water pipes and pumps;
electricity; gas; roads; traffic facilities; cycleways; footpaths and bridges; recreational and
sporting facilities; stormwater drains; stormwater pits and treatment devices) to accommodate
increased water levels due to climate change is unknown. Probably the most critical (if failure
during a flood occurs) is provision of sewerage. This loss of service affects both flood liable and
non-flood liable properties if they are connected to a pump station that fails.
As lake levels rise some services will be affected by permanent inundation, increased tidal
inundation, and rising water tables. This is likely to increase maintenance costs (roads and
other services such as drainage, sewer, water, gas and electricity), as assets are affected by
salt water corrosion and saturation, and access for maintenance becomes more difficult and
expensive. Local stormwater drainage infrastructure will become less effective, and may have
to be redesigned and replaced.
This will add to the maintenance budget of Lake Macquarie City Council, Roads and Maritime
NSW, and the supply authorities such as Hunter Water Corporation and may mean that, for
example, the road standard will be reduced to a lesser standard in order to maintain a level of
service. A reduction in service levels may have ongoing ramifications for public safety and
amenity.
DISCUSSION
When the predicted sea level rise benchmarks are considered with regard to the existing service
levels, such as sewer outlets and manhole levels, significant works and costs are required to
maintain the service at working condition.
Council and supply authorities need to undertake reviews of the impact of sea level rise on the
maintenance of the services provided.
Lake Macquarie City Council is responsible for provision of stormwater drainage facilities around
the foreshore and Council’s Stormwater Asset Risk Management Plan identifies more frequent
flooding due to climate change effects, such as increasing lake levels, as a high risk. The
Stormwater Asset Risk Management Plan recommends this risk be treated by identifying areas
where more frequent flooding is likely to occur, where it will have greatest community impact,
and prioritising drainage infrastructure upgrade works in these areas. Implementing the detailed
review of infrastructure in each foreshore management area, as recommended by this plan, will
therefore make a key contribution to addressing critical flood risks within the City.
Table 27 summarises the approximate number of stormwater assets located within each of the
hazard zones identified by this plan.

Lake Macquarie Waterway Flood Risk Management Study and Plan
WMAwater
29076:LakeMacFRMS.docx:26 June 2012 75
Table 27: Council Stormwater Assets within Hazard Zones
Hazard Zone Approximate number of
stormwater pipes
Approximate number of
stormwater pits, pollutant traps,
detention basins and outlet
structures
Low Flood Hazard Zone
(below 2.32m AHD)
2270 2680
High Flood Hazard Zone
(below 1.5m AHD)
1480 1650
High Lake Hazard Zone
(below 1.0m AHD)
840 820
Of the stormwater assets listed in Table 27, those within the High Lake Hazard Zone present the
greatest concern with respect to ongoing serviceability, maintenance and replacement costs.
Most of these stormwater assets are not designed for saltwater environments, and may fail
earlier than planned. These early failures are likely to be among the most noteworthy impacts of
rising lake levels on Council’s existing stormwater assets.
In most cases, protecting existing low-lying stormwater assets from salt-water incursion is not
likely to be a feasible management strategy. ‘Retreating’ or abandoning stormwater assets from
the High Lake Hazard Zone, may be the preferred management option in some locations.
Identifying these locations requires detailed risk-cost-benefit assessment for the whole asset life
cycle on a location-specific basis. This work should be included in the detailed adaptation
assessments for each foreshore management area. Accommodating salt-water incursion would
involve installing saline-resistant replacements for each affected asset. This would impose
significant additional costs on Council between now and 2100. For example, if all stormwater
assets below 1.0m AHD are replaced early, the cost to Council is likely to exceed $25 million.
If Council is unable to secure sufficient funds to accommodate (via early replacement and
upgrade) saline incursion, or to abandon low-lying stormwater assets, flood impacts on private
property could increase.
For new stormwater assets, accepting the impacts of saline incursion would be an imprudent
management strategy. Accommodating these impacts for new assets may be possible in many
locations. To ensure assets created as part of future development are fit for purpose, and can
be maintained at reasonable costs, Council should update the technical guidelines that support
its development controls. The updated guidelines should require stormwater infrastructure
design below 2.82 mAHD to consider increased outlet levels (lake levels). The updated
guidelines should also require new stormwater assets below 1.0 mAHD to be constructed with
salt-resistant materials. However, in some locations, it will not be technically feasible to
accommodate the impacts of saline incursion. At these locations, installation of new stormwater
assets will need to be avoided. The work required to identify locations to avoid new stormwater
assets should be included in detailed adaptation assessments for each foreshore management
area.

Lake Macquarie Waterway Flood Risk Management Study and Plan
WMAwater
29076:LakeMacFRMS.docx:26 June 2012 76
The ability for recreation and open space areas to accommodate increased water levels due to
climate change will vary throughout the Lake Macquarie LGA. The most critical issues include:
How to continue to provide connectivity within Council’s open space network?
How to ensure the community still has use of and access to sufficient high quality
recreation, open space and community facilities?
Rising lake levels will significantly affect access to foreshore areas and the use of these sites for
formal/informal recreation, and threaten the linkages between open space areas, particularly via
formalised shared pathways. There will be substantial cost implications for Council to continue
to provide waterfront areas for the community to enjoy. These costs could be in the form of
acquisition of additional open space, or engineering solutions such as the construction of over-
water walkways.
Lake levels will also impact upon Council’s formal recreation and open space facilities such as
sportsgrounds and lake facilities. In some instances there may not be the opportunity for
engineering solutions or to purchase additional open space. Alternatively, significant funds will
be needed to upgrade/expand nearby facilities.
Future planning and land acquisition for open space and new community facilities should
consider the implications of sea level change and avoid development in high risk areas.
A study by the Department of Planning in 2008 showed that in the Lake Macquarie LGA about
20 kilometres of roads are in areas below 1.0 mAHD. These roads will already be subject to
frequent flooding, and the maintenance of the sub-grade and surface will be difficult due to high
groundwater, poor drainage, and frequent inundation. This will gradually get worse as lake
levels rise, and eventually the roads may become unserviceable and/or permanently inundated.
There are about 170 kilometres of road in the flood area between 1.0 mAHD and 3.0 mAHD.
Maintenance costs on these roads are likely to increase with rising water and flood levels. While
raising roads is possible, the costs are significant, and there are practical issues with drainage
(adjoining properties usually drain to the road, so raising the road can interrupt local drainage)
and the effect of rising water levels on groundwater levels and the road foundation.
Hunter Water Corporation, who is responsible for installing, operating, and maintaining water
and sewerage services in Lake Macquarie has prepared the "Climate Change Adaptation Plan -
Hunter Water's Plan to adapt to an uncertain climate". The plan recognises the effect that sea
level rise will have on Hunter Water's assets, and their ability to maintain services up to the year
2050, and rates the risk from sea level rise as High to Extreme for key aspects of their
operation. Their Plan sets out a table of actions that includes:
incorporate predicted sea level rises when designing and constructing new infrastructure,
liaise with Council regarding any proposed foreshore protection works,
map key water and wastewater assets vulnerable to climate change impacts, including sea
level rise,
develop guidelines for network servicing strategies to include consideration of sea level rise,

Lake Macquarie Waterway Flood Risk Management Study and Plan
WMAwater
29076:LakeMacFRMS.docx:26 June 2012 77
update condition assessment of critical assets, including mains, to include considerations of
sea level rise and other climate change impacts.
Consistent with standard planning practices, Hunter Water considers the future environmental
vulnerabilities on both:
Existing assets, through routine condition assessment programs and
reliability/maintenance strategies, which identify both the operational performance of
the asset and the future asset vulnerability. These investigations guide the future
management of the asset, with potential environmental adaptation incorporated into
traditional rehabilitation, replacement or upgrade strategies. This management
practice is currently being implemented on existing sewer mains and wastewater
pump stations on the lake foreshore, with successful environmental and service
solutions being undertaken.
Future assets, through regional master planning and growth related upgrade
strategies, which consider future environmental vulnerabilities on the long term
operation of an upgraded or new asset or facility.
The provision of public services is essential for the continued habitation of flood liable areas.
For some (water, electricity, gas) they can be relatively easily modified for sea level rise, others
(sewer, stormwater drainage systems, roads) are more difficult but can be achieved. Failure of
the sewerage system can occur during floods for many reasons including:
loss of electricity supply (power outage or damage to power lines caused by storm
damage),
failure at the pumping station,
the pumps are turned off as the water level rises above toilets or sewer vents.
The loss of supply of a sewerage system represents a potential life threatening hazard to human
life as raw sewage will enter the flood waters which residents will be wading around in. In
addition residents who do not have a functioning sewage system should be evacuated from their
homes. This would also include those houses that are not flooded but experience a failure of
the sewerage system for several days. This will place considerable additional burden on the
SES.
The most difficult service to adapt to rising water levels is the provision of roads. Whilst
infrequent flooding will cause only minor damage it is the frequent inundation of the road base
by elevated “normal” lake levels that will incur significantly increased maintenance costs. This
can obviously be addressed by filling and raising of the road but again at significant cost and
disruption to the community (driveway access and local drainage issues).
SUMMARY
Future refinement of the planning practices for public service infrastructure will continue to
benefit from integrated development and assessment, conducted by relevant service providers
in collaboration with Council, of the impacts of elevated lake water levels and other climate
change impacts. This will allow service providers to develop appropriate solutions, in
consultation with relevant local communities, as part of local area adaptation plans for each
Lake Macquarie Waterway Flood Risk Management Study and Plan
WMAwater
29076:LakeMacFRMS.docx:26 June 2012 78
foreshore management area.
Following the adoption of this Flood Study and Flood Risk Management Plan, Council needs to
work with other key infrastructure providers to ensure they integrate the Study findings and
Management Plan recommendations in their climate change adaptation planning. Other
infrastructure providers will have to develop local planning and maintenance assessments for
areas vulnerable to sea level rise and increased flooding, for consideration when local area
plans are developed by Council and the community.
6.4.6. Minimise the Risk of Electrocution
DESCRIPTION
Minimising the chance of electrocution by turning of the electricity supply during a flood should
be ‘standard practice’ for residents and commercial owners during floods. The risk of
electrocution can also be reduced by installing electrical circuits above, at least, the flood
planning level (100 year ARI flood level + 0.5 m freeboard).
DISCUSSION
There is always the risk of electrocution in times of flood and whilst this has occurred elsewhere
there is no record of injury or loss of life due to electrocution on the foreshores of Lake
Macquarie waterway in the February 1990 or the June 2007 long weekend events. In order to
reduce the risk of electrocution a flood education program should be undertaken in vulnerable
communities, especially with older housing stock.
SUMMARY
There is a risk of electrocution during flooding and from an increase in lake water levels due to
sea level rise on the foreshores of Lake Macquarie waterway which needs to be addressed. At
a minimum flood education programs should encompass this issue, and there may be role for
specific programs targeted at tradesmen, for example, to encourage safer installations.
All new developments and re-developments should have requirements to locate unsealed
electrical circuits at least 0.5 m above the 100 year ARI flood level. Ways to encourage retro-
fitting of older buildings should be investigated, which could range from requiring circuit breakers
as a condition for any re-development approvals, offering incentives to encourage owners to up-
grade, to considering mandatory retro-fitting requirements. A minimum aim should be to have
all properties in flood hazard areas to, at least, be fitted with a circuit breaker.
6.5. Response Modification Measures
6.5.1. Flood Warning
DESCRIPTION
It may be necessary for a number of residents to evacuate their homes during or following a
major flood, such as the February 1990 and June 2007 events, though it is understood that
many residents stayed in their homes (possibly moved goods and themselves to an upper floor
or onto tables or such like).

Lake Macquarie Waterway Flood Risk Management Study and Plan
WMAwater
29076:LakeMacFRMS.docx:26 June 2012 79
The amount of time for evacuation depends on the available warning time. Providing sufficient
warning time has the potential to reduce the social impacts of the flood as well as reducing the
strain on emergency services.
Flood warning and the implementation of evacuation procedures by the SES are widely used
throughout NSW to reduce flood damages and protect lives. Adequate warning gives residents
time to move goods and cars above the reach of floodwaters and to evacuate from the
immediate area to high ground. The effectiveness of a flood warning scheme depends on:
the maximum potential warning time before the onset of flooding,
the actual warning time provided before the onset of flooding. This depends on the
adequacy of the information gathering network and the skill and knowledge of the
operators,
the flood awareness of the community responding to a warning.
For smaller catchments a Severe Weather Warning (SWW) is provided by the Bureau of
Meteorology (BOM) but this is not specific to a particular catchment.
DISCUSSION
The BOM is responsible for flood warnings on major river systems such as Lake Macquarie
waterway and the Hunter River. Flood warning systems are based on stations which
automatically record rainfall or river levels at upstream locations and telemeter the information to
a central location. This information is then provided to the SES who undertake evacuations or
flood damage prevention measures (sand bagging or raising goods).
Studies have shown that flood warning systems generally have high benefit/cost ratios if
sufficient warning time is provided. In this regard all residents should be made aware of the
types of warnings issued by the BOM (refer flood awareness in Section 6.5.3).
Flooding on Lake Macquarie waterway differs from flooding on the tributary creeks or on major
river systems. Firstly, the rate of rise of the lake is relatively slow providing more warning time.
Secondly, the magnitude of the rise is also relatively small (only 1.4 m in a 100 year ARI event)
with the level responding more to the volume of runoff and ocean conditions rather than the
magnitude of the peak inflows.
As the lake rises relatively slowly residents are unlikely to be “caught completely unaware” and
should have some time to prevent damages to easily moved items such as televisions, rugs,
clothing and cars as long as they are in the building at the time or nearby. As the depth of
floodwaters is shallow (generally less than 0.5 m) it is also easy to raise goods above the water.
Intangible damages such as the loss of memorabilia, important papers and pets should also be
much reduced.
The 2012 Lake Macquarie Waterway Flood Study (Reference 6) examined a range of rainfall
durations (24 to 72 hour) to determine the design storm duration which produces the highest
lake level and concluded that the 48 hour duration was critical, although the 36 hour duration
was only slightly lower. However, it is misleading to consider that the duration of the design

Lake Macquarie Waterway Flood Risk Management Study and Plan
WMAwater
29076:LakeMacFRMS.docx:26 June 2012 80
rainfall event is necessarily related to the available warning time. A much shorter duration storm
(36 hours) may produce a peak very similar (but slightly smaller) than the adopted design
duration. The peak level in the lake in a 48 hour 100 year ARI event occurs approximately 38
hours after the start of the storm. For the first 6 hours there is little runoff from the catchments
and the lake barely rises. Thereafter the lake rises at a relatively constant rate of approximately
70 mm per hour.
During a large lake flood, residents may be isolated for up to approximately 18 hours.
The 2012 Lake Macquarie Waterway Flood Study (Reference 6) indicated that the peak lake
level was sensitive to the ocean level, thus the warning time is affected by the state of the ocean
(high tide, storm surge, wave setup).
SUMMARY
The BOM already has a flood warning system for Lake Macquarie waterway and, for the first
time, a specific Lake Macquarie flood warning was issued for the June 2007 event. However, it
seems the BOM warning was based on regional data, and they do not have a specific model or
local data-collection to predict flood behaviour for the Lake Macquarie waterway. A review of
the system is currently being undertaken to ensure that it will work successfully in all future
events.
The greatest improvement in the accuracy of any flood warning predictions generally only
occurs following major flood events. It is imperative therefore that a post flood assessment
report be prepared following each future flood event with particular emphasis on the adequacy
and accuracy of the flood warning system. This post flood assessment has been undertaken for
the June 2007 event by the BOM.
Improving the flood warning system is relatively inexpensive and is likely to have a high
benefit/cost ratio. It has no apparent adverse environmental or social impacts. The new
information and predictive modelling from the 2012 Lake Macquarie Waterway Flood Study
(Reference 6) should be provided to the BOM and other agencies to assist with their flood
prediction and warning system.
6.5.2. Flood Emergency Management
DESCRIPTION
As mentioned above, it may be necessary for some residents to evacuate their homes in a
major flood. This would be undertaken under the direction of the lead agency under the Displan,
the SES. Some residents may choose to leave on their own accord based on flood information
from the radio or other warnings, and may be assisted by local residents. The main problems
with all flood evacuations are:
they must be carried out quickly and efficiently,
there can be confusion about ‘ordering’ evacuations, with rumours and well-meaning
advice taking precedence over official directions which can only come from the lead
agency, the SES
they are hazardous for both rescuers and the evacuees,

Lake Macquarie Waterway Flood Risk Management Study and Plan
WMAwater
29076:LakeMacFRMS.docx:26 June 2012 81
residents are generally reluctant to leave their homes, causing delays and placing
more stress on the rescuers, and
people (residents and visitors) do not appreciate the dangers of crossing floodwaters.
For this reason, the preparation of a Community Flood Emergency Response Plan (CFERP)
helps to minimise the risk associated with evacuations by providing information regarding
evacuation routes, refuge areas, what to do/not to do during floods etc. It is the role of the SES
to develop a CFERP for vulnerable communities. Dora Creek is the only community in Lake
Macquarie with a local CFERP currently in place.
DISCUSSION
The SES has the skills and experience to undertake the necessary evacuations.
SUMMARY
The SES should ensure that the Local Flood Plan for all settlements surrounding Lake
Macquarie waterway is up to date and includes feedback from the June 2007 event and the
recommendations of this plan. This might include floor level and ground level details provided in
this report and the 2012 Lake Macquarie Waterway Flood Study (Reference 6). In addition,
input from the local community (e.g Council, RFS, and community representatives) through a
Community Flood Emergency Response Plan (CFERP)) is required to ensure that workable
actions for the community are incorporated. Priority should be given to the implementation of
this Plan once completed, which will involve ongoing community education and awareness.
6.5.3. Public Information and Raising Flood Awareness
DESCRIPTION
The success of any flood warning system and the evacuation process depends on:
Flood Awareness: How aware is the community to the threat of flooding? Has it been
adequately informed and educated? How aware is the community to the threat from sea level
rise?
Flood Preparedness: How prepared is the community to react to the threat of flooding? Do they
(or the SES) have damage minimisation strategies (such as sand bags, raising possessions)
which can be implemented?
Flood Evacuation: How prepared are the authorities and the residents to evacuate households
to minimise damages and the potential risk to life during a flood? How will the evacuation be
done, where will the evacuees be moved to?
DISCUSSION
A community with high flood awareness will suffer less damage and disruption during and after a
flood because people are aware of the potential of the situation. On river systems which
regularly flood, there is often a large, local, unofficial warning network which has developed over
the years and residents know how to effectively respond to warnings by raising goods, moving
cars, lifting carpets, etc. Photographs (of less importance with digital photography) and other
Lake Macquarie Waterway Flood Risk Management Study and Plan
WMAwater
29076:LakeMacFRMS.docx:26 June 2012 82
non-replaceable items are generally put in safe places. Often residents have developed storage
facilities, buildings, etc., which are flood compatible. The level of trauma or anxiety may be
reduced as people have “survived” previous floods and know how to handle both the immediate
emergency and the post flood rehabilitation phase in a calm and efficient manner. To some
extent many of the above issues for Lake Macquarie waterway have already been addressed by
the community as a result of the June 2007 long weekend and February 1990 floods. However,
Lake Macquarie residents have not experienced a 100 year ARI flood so have no experience of
such a severe event (approximately 0.5 m higher than the February 1990 and June 2007
events).
The level of flood awareness within a community is difficult to evaluate. It will vary over time and
depends on a number of factors including:
Frequency and impact of previous floods. A major flood causing a high degree of
flood damage in relatively recent times will increase flood awareness. If no floods
have occurred, or there have been a number of small floods which cause little damage
or inconvenience, then the level of flood awareness may be low. As a result of the
June 2007 long weekend flood, which caused significant damage, the community
generally has a medium level of awareness at this time (it will decline as the time
since the last flood increases and maybe increase as a result of community flood or
climate change awareness programs).
History of residence. Families who have owned properties for a long time will have
established a considerable depth of knowledge regarding flooding and a high level of
flood awareness. A community which consists predominantly of short lease rental
homes will have a low level of flood awareness. It would appear that the majority of
the residents have lived in the area for several years and are therefore familiar with
flooding. Also it is very likely that new residents will be aware from advice at the time
of their property purchase (Section 149 certificate) or from neighbours after they move
in. It is very unlikely that a new resident buying a house along the foreshore of the
Lake Macquarie waterway will not be aware of the potential of flooding, many will also
be aware of the potential of sea level rise affecting their property in the future.
Whether an effective public awareness program has been implemented. It is
understood that no large scale awareness program has been implemented in the past
for the foreshore areas, although in the last few years there have been many articles
in the national and local press regarding the effects of sea level rise. Some have
specifically mentioned Lake Macquarie foreshore as being an area of potential
affectation.
For risk management to be effective it must become the responsibility of the whole community.
It is difficult to accurately assess the benefits of an awareness program but it is generally
considered that the benefits far outweigh the costs. The perceived value of the information and
level of awareness, diminishes as the time since the last flood increases.
A major hurdle is often convincing residents that major floods (larger than the June 2007 long
Lake Macquarie Waterway Flood Risk Management Study and Plan
WMAwater
29076:LakeMacFRMS.docx:26 June 2012 83
weekend event) will occur in the future. Many residents hold the false view that once they have
experienced a large flood then another will not occur for a long time thereafter. This viewpoint is
incorrect as a 100 year ARI (or sometimes termed a 1% AEP event) has the same chance of
occurring next year, regardless of the magnitude of the event that may have recently occurred.
A similar analogy is after “tossing” a coin say 5 times and coming up with “heads” each time, the
chance of “heads” on the next throw is still 50:50.
Some NSW Councils (Rockdale, Pittwater, Maitland) have initiated catchment-wide flood
awareness strategies (for residential and commercial). For Lake Macquarie waterway only a
residential strategy is required as there are few significant commercial areas in flood hazard
areas. Lake Macquarie City Council and the SES websites also provide excellent information on
flood awareness and other flood related and climate change information.
SUMMARY
Based on feedback it would appear that the majority of residents around the foreshores of Lake
Macquarie waterway have a medium level of flood awareness and preparedness. However this
may not be the case for the “holiday” visitors.
As time passes since the last significant flood, the direct experience of the community with
historical floods will diminish. It is important that a high level of awareness is maintained
through implementation of a suitable Flood Awareness Program that would include Floodsafe
brochures as well as advice provided on the Council’s and SES’s websites. These need to be
updated on regular basis.
Table 28 provide examples of various flood awareness methods that can be used.
Lake Macquarie Waterway Flood Risk Management Study and Plan
WMAwater
29076:LakeMacFRMS.docx:26 June 2012 84
Table 28: Flood Awareness Methods
Method Comment Letter/pamphlet from Council These may be sent (annually or biannually) with the rate notice or separately.
A Council database of flood liable properties/addresses makes this a relatively inexpensive and effective measure. The pamphlet can inform residents of ongoing implementation of the Risk Management Plan, changes to flood levels, climate change or any other relevant information.
Council website Council should continue to update and expand their website to provide both technical information on flood levels as well as qualitative information on how residents can make themselves flood aware. This would provide an excellent source of knowledge on flooding on the foreshores of Lake Macquarie waterway (and elsewhere in the LGA) as well as on issues such as climate change. It is recommended that Council’s website continue to be updated as and when required.
Community Working Group Council should initiate a Community Working Group framework which will provide a valuable two way conduit between the local residents and Council.
School project or local historical society
This provides an excellent means of informing the younger generation about flooding and climate change. It may involve talks from various authorities and can be combined with topics relating to water quality, estuary management, etc.
Displays at caravan parks or similar
This is an inexpensive way of informing the tourist/holiday maker community and may be combined with related displays.
Historical flood markers and flood depth markers
Signs or marks can be prominently displayed on telegraph poles or such like to indicate the level reached in previous floods. Depth indicators advise of potential hazards. These are inexpensive and effective but in some flood communities not well accepted as it is considered that they affect property values.
Articles in local newspapers Ongoing articles in the newspapers will ensure that the flood and climate change issues are not forgotten. Historical features and remembrance of the anniversary of past events are interesting for local residents.
Collection of data from future floods
Collection of data (photographs) assists in reinforcing to the residents that Council is aware of the problem and ensures that the design flood levels are as accurate as possible (as occurred successfully after the June 2007 long weekend event).
Types of information available A recurring problem is that new owners consider they were not adequately advised that their property was flood affected on the 149 Certificate during the purchase process. Council may wish to advise interested parties, when they inquire during the property purchase process, regarding flood information currently available, how it can be obtained and the cost. This information also needs to be provided to all visitors who may rent for a period. Some Councils have conducted “briefing” sessions with real estate agents and conveyancers.
Establishment of a flood affectation effects database and post flood data collection program
A database would provide information on (say) which houses require evacuation, which public structures will be affected (eg. telephone or power cuts). This database should be reviewed after each flood event. It is already being developed as part of this present study. This database should be updated following each flood with input from the community.
Flood preparedness program Providing information to the community regarding flooding helps to inform it of the problem and associated implications. However, it does not necessarily adequately prepare people to react effectively to the problem. A Flood Preparedness Program would ensure that the community is adequately prepared. The SES would take a lead role in this.
Develop approaches to foster community ownership of the problem
Flood damages in future events can be minimised if the community is aware of the problem and takes steps to find solutions. The development of approaches that promote community ownership should therefore be encouraged. For example residents should be advised that they have a responsibility to advise Council if they see a problem such as blockage of drains or such like. This process can be linked to water quality or other water related issues including estuary management. The specific approach can only be developed in consultation with the community.
The specific flood awareness measures that are implemented will need to be developed by
Council taking into account the views of the local community, funding considerations and other
awareness programs within the LGA. The details of the exact measures would need to be

Lake Macquarie Waterway Flood Risk Management Study and Plan
WMAwater
29076:LakeMacFRMS.docx:26 June 2012 85
developed in consultation with affected communities.
6.6. Other Management Measures
6.6.1. Planning Regulations for Tourist/Caravan Parks
DESCRIPTION
There are approximately 15 tourist/caravan parks on the foreshores of Lake Macquarie
waterway although many are not affected by flooding. The number of cabins/sites on the
foreshore is unknown. Those most susceptible to inundation are provided in Table 29 (as at
2005).
Table 29: Tourist Parks on the Lake Macquarie Foreshore likely to be susceptible to Flooding
Caravan Park Suburb Ownership
Swansea Gardens Tourist Park Swansea Council
Belmont Pines Tourist Park Belmont South Council
Wangi Point Tourist Park Wangi Wangi Council
Blacksmiths Beach Tourist Park Blacksmiths Council
These parks within the foreshore present their own unique problems, namely:
there is generally poor access with a single entrance/exit which may be controlled by
gates,
a poor (or no) site map is generally available to show the internal road system or the
types of vans,
fixed annexes on caravans or cabins which may contain high cost equipment such as
freezers or stoves,
there may be poor internal lighting which may fail during a flood,
there is probably no comprehensive flood emergency plan or it has not been tested
recently,
there may be a problem in communicating to the residents due to the lack of or failure
of the public address system or telephone network,
short term residents will have little flood awareness of the flood risk or damage
minimisation measures,
a number of cabins or vans may be vacant thus increasing the workload and possible
risk to life of the “rescuers” in removing vans or raising goods in cabins,
there is the risk that vans may float and crash into each other or obstruct exit routes,
caravans and many cabins have little structural integrity and thus can easily be
damaged or completely destroyed by floodwaters. As caravans and cabins are
relatively high value items they represent a significant financial loss to the owner,
although they can be insured, and
the internal fittings (cupboards, fridges, beds) are usually non-removable and quickly
damaged by floodwaters.
DISCUSSION
In theory caravans can be easily moved to high ground in a flood. However, in practice
Lake Macquarie Waterway Flood Risk Management Study and Plan
WMAwater
29076:LakeMacFRMS.docx:26 June 2012 86
experience has shown that this is unlikely to occur for a number of reasons including owner not
present, limited time, caravan cannot readily be moved etc.
Lake Macquarie waterway has a much slower rate of rise than a river system. For many of the
of parks, while there is nearby high ground where caravans and residents can be moved, there
has been no assessment or specific identification of potential evacuation areas. Also, as the
cabins and caravans are all (say) 0.5 m above the natural surface they are unlikely to be flooded
above floor in events smaller than a year 2011 50 year ARI event (assuming the ground level is
0.8 mAHD or above).
Shoalhaven City Council has special provisions for caravan parks on the floodplain which
include:
rapid knock down annexes,
quick release ties on the vans to prevent them floating away,
an effective evacuation strategy documented in a Flood Action Plan,
restrictions on the type of vans, eg. vans that cannot be towed not permitted in certain
areas, no rigid annexes, and
specific inclusion of caravan parks in the SES Local Flood Plan.
Similar provisions could be applied to flood affected caravan parks in Lake Macquarie.
SUMMARY
Cabins and caravan parks on the foreshore can be exposed to significant flood risk even though
the risk is reduced because there is usually some warning time, there is nearby high ground,
and the frequency of above-floor flooding is low. However the June 2007 long weekend event
has shown that a much shorter duration of rainfall (< 24 hours) than previously assumed can
produce flooding, thus the available warning time can be insufficient to enact a safe evacuation.
In the June 2007 event the issue was further compounded by the flood occurring on a long
weekend when many are going on holiday and thus not as prepared as they normally might be.
As well, evacuation is made more difficult in storm conditions by high winds, fallen trees, and
road closures.
This issue has been addressed in Council’s 2005 Policy for Caravan Parks (Reference 16) and
Performance Criteria and Development Standards are documented. This Policy is currently
programmed to be reviewed by Council and should be updated in case the nature of the park
has been upgraded and also to include the implications of sea level rise.
6.6.2. Mine Subsidence
The Mine Subsidence Board has indicated that parts of Lake Macquarie waterway are within a
mine subsidence area. The magnitude of subsidence could be between 0.1 m and 0.6 m.
Further detail is required to define the likely extent and magnitude of mine subsidence and an
appropriate allowance, over and above the 0.5 m freeboard, should be included in the flood
development assessment process. Mine subsidence may also influence which areas will be
exposed to permanent inundation from sea level rises.

Lake Macquarie Waterway Flood Risk Management Study and Plan
WMAwater
29076:LakeMacFRMS.docx:26 June 2012 87
6.6.3. Flood Insurance
Flood insurance does not reduce flood damages but transforms the random sequence of losses
into a regular series of payments. It is only in the last five years or so that flood insurance has
become readily available for houses, although it was always available for some very large
commercial and industrial properties. There are many issues with the premium for this type of
insurance and how insurance companies evaluate the risk (is it based on the house floor being
inundated or the ground within the property?). These issues are outside the scope of this
present study and are currently being re-assessed as part of the Commission of Inquiry into the
South East Queensland floods of January 2011. Flood insurance at an individual property level
is encouraged for affected land owners, but is not an appropriate risk management measure as
it does not reduce flood damages.
Insurance companies will not cover damage from storm surge, but the Flood Study shows that it
is rainfall events in the catchment that cause severe lake floods, with ocean induced lake levels
significantly lower than rainfall induced levels.
Continued access to flood insurance in flood-affected areas is, in part, dependent on the current
system of flood studies and risk management planning represented by this Lake Macquarie
Flood Study and Risk Management Study and Plan. This planning must include consideration
on the future risk from sea level rise and climate change.

Lake Macquarie Waterway Flood Risk Management Study and Plan
WMAwater
29076:LakeMacFRMS.docx:26 June 2012 88
7. ACKNOWLEDGMENTS
This study was carried out by WMAwater and funded by Lake Macquarie City Council and the
NSW State Government. The assistance of the following in providing data and guidance to the
study is gratefully acknowledged:
Lake Macquarie City Council,
NSW Office of Environment and Heritage,
Ministry for Police and Emergency Services Department of Attorney General and
Justice,
Council’s Floodplain Management Committee,
Residents surrounding the foreshores of the Lake Macquarie waterway.

Lake Macquarie Waterway Flood Risk Management Study and Plan
WMAwater
29076:LakeMacFRMS.docx:26 June 2012 89
8. REFERENCES
1. Lake Macquarie City Council
Lake Macquarie Floodplain Risk Management Study
Webb McKeown & Associates, August 2000
2. Lake Macquarie City Council
Lake Macquarie Floodplain Risk Management Plan
Webb McKeown & Associates, July 2001
3. Flood Risk Management Guide
Department of Environment Climate Change and Water NSW, August 2010
4. Floodplain Risk Management Guideline - Practical Consideration of Climate
Change
NSW Department of Environment and Climate Change (DECC), October 2007
5. Floodplain Development Manual
NSW Government, April 2005
6. Lake Macquarie City Council
Lake Macquarie Waterway Flood Study
WMAwater, 2012
7. Lake Macquarie City Council
Lake Macquarie Flood Study Part 1 – Design Lake Water Levels and Wave
Climate Report
Manly Hydraulics Laboratory, Report MHL 682, January 1998
8. Lake Macquarie City Council
Lake Macquarie Flood Study Part 2 – Foreshore Flooding
Manly Hydraulics Laboratory, Report MHL 715, April 1998
9. Lake Macquarie City Council
Lake Macquarie Adaptive Response of Estuarine Shores to Sea Level Rise
Cardno Lawson Treloar, LJ2857/R2629, June 2010
10. Lake Macquarie City Council
Lake Macquarie Estuary Management Plan
WBM Oceanics, May 1997
11. Lake Macquarie City Council
Lake Macquarie Environmental Security Assessment
Cardno Pty Ltd, LJ2829/R2589, October 2010

Lake Macquarie Waterway Flood Risk Management Study and Plan
WMAwater
29076:LakeMacFRMS.docx:26 June 2012 90
12. Lake Macquarie City Council
Lake Macquarie Wetlands Climate Change Assessment
Eco Logical Australia, July 2010
13. Lake Macquarie City Council
Tidal Prism Modelling of Lake Macquarie, Volume 1
Worley Parsons Report No. 301020- 02167- 01, March 2010
14. NSW Coastal Planning Guideline: Adapting to Sea Level Rise
NSW Government Planning, August 2010
15. Hawkesbury-Nepean Floodplain Management Steering Committee
Reducing Vulnerability of Buildings to Flood Damage
June 2006
16. Lake Macquarie City Council
The Policy: Caravan Parks on Flood prone Lands Surrounding Lake Macquarie
Waterway
Lake Macquarie City Council, April 2005


Lake Macquarie Waterway Flood Risk Management Study and Plan
WMAwater 29076:LakeMacFRMS.docx:26 June 2012 A1
APPENDIX A: GLOSSARY
Taken from the Floodplain Development Manual (April 2005 edition)
acid sulfate soils Are sediments which contain sulfidic mineral pyrite which may become extremely
acid following disturbance or drainage as sulfur compounds react when exposed
to oxygen to form sulfuric acid. More detailed explanation and definition can be
found in the NSW Government Acid Sulfate Soil Manual published by Acid Sulfate
Soil Management Advisory Committee.
Annual Exceedance
Probability (AEP)
The chance of a flood of a given or larger size occurring in any one year, usually
expressed as a percentage. For example, if a peak flood discharge of 500 m3/s
has an AEP of 5%, it means that there is a 5% chance (that is one-in-20 chance)
of a 500 m3/s or larger event occurring in any one year (see ARI).
Australian Height Datum
(AHD)
A common national surface level datum approximately corresponding to mean sea
level.
Average Annual Damage
(AAD)
Depending on its size (or severity), each flood will cause a different amount of
flood damage to a flood prone area. AAD is the average damage per year that
would occur in a nominated development situation from flooding over a very long
period of time.
Average Recurrence
Interval (ARI)
The long term average number of years between the occurrence of a flood as big
as, or larger than, the selected event. For example, floods with a discharge as
great as, or greater than, the 20 year ARI flood event will occur on average once
every 20 years. ARI is another way of expressing the likelihood of occurrence of a
flood event.
caravan and moveable
home parks
Caravans and moveable dwellings are being increasingly used for long-term and
permanent accommodation purposes. Standards relating to their siting, design,
construction and management can be found in the Regulations under the LG Act.
catchment The land area draining through the main stream, as well as tributary streams, to a
particular site. It always relates to an area above a specific location.
consent authority The Council, Government agency or person having the function to determine a
development application for land use under the EP&A Act. The consent authority
is most often the Council, however legislation or an EPI may specify a Minister or
public authority (other than a Council), or the Director General of DIPNR, as
having the function to determine an application.
development Is defined in Part 4 of the Environmental Planning and Assessment Act (EP&A
Act).
infill development: refers to the development of vacant blocks of land that are
generally surrounded by developed properties and is permissible under the
current zoning of the land. Conditions such as minimum floor levels may be
imposed on infill development.
new development: refers to development of a completely different nature to that
associated with the former land use. For example, the urban subdivision of an
area previously used for rural purposes. New developments involve rezoning and
typically require major extensions of existing urban services, such as roads, water
supply, sewerage and electric power.
redevelopment: refers to rebuilding in an area. For example, as urban areas
age, it may become necessary to demolish and reconstruct buildings on a
relatively large scale. Redevelopment generally does not require either rezoning
or major extensions to urban services.
disaster plan (DISPLAN) A step by step sequence of previously agreed roles, responsibilities, functions,
actions and management arrangements for the conduct of a single or series of

Lake Macquarie Waterway Flood Risk Management Study and Plan
WMAwater 29076:LakeMacFRMS.docx:26 June 2012 A2
connected emergency operations, with the object of ensuring the coordinated
response by all agencies having responsibilities and functions in emergencies.
discharge The rate of flow of water measured in terms of volume per unit time, for example,
cubic metres per second (m3/s). Discharge is different from the speed or velocity
of flow, which is a measure of how fast the water is moving for example, metres
per second (m/s).
ecologically sustainable
development (ESD)
Using, conserving and enhancing natural resources so that ecological processes,
on which life depends, are maintained, and the total quality of life, now and in the
future, can be maintained or increased. A more detailed definition is included in
the Local Government Act 1993. The use of sustainability and sustainable in this
manual relate to ESD.
effective warning time The time available after receiving advice of an impending flood and before the
floodwaters prevent appropriate flood response actions being undertaken. The
effective warning time is typically used to move farm equipment, move stock, raise
furniture, evacuate people and transport their possessions.
emergency management A range of measures to manage risks to communities and the environment. In the
flood context it may include measures to prevent, prepare for, respond to and
recover from flooding.
flash flooding Flooding which is sudden and unexpected. It is often caused by sudden local or
nearby heavy rainfall. Often defined as flooding which peaks within six hours of
the causative rain.
flood Relatively high stream flow which overtops the natural or artificial banks in any
part of a stream, river, estuary, lake or dam, and/or local overland flooding
associated with major drainage before entering a watercourse, and/or coastal
inundation resulting from super-elevated sea levels and/or waves overtopping
coastline defences excluding tsunami.
flood awareness Flood awareness is an appreciation of the likely effects of flooding and a
knowledge of the relevant flood warning, response and evacuation procedures.
flood education Flood education seeks to provide information to raise awareness of the flood
problem so as to enable individuals to understand how to manage themselves an
their property in response to flood warnings and in a flood event. It invokes a
state of flood readiness.
flood fringe areas The remaining area of flood prone land after floodway and flood storage areas
have been defined.
flood liable land Is synonymous with flood prone land (i.e. land susceptible to flooding by the
probable maximum flood (PMF) event). Note that the term flood liable land covers
the whole of the floodplain, not just that part below the flood planning level (see
flood planning area).
flood mitigation standard The average recurrence interval of the flood, selected as part of the floodplain risk
management process that forms the basis for physical works to modify the
impacts of flooding.
floodplain Area of land which is subject to inundation by floods up to and including the
probable maximum flood event, that is, flood prone land.
floodplain risk management
options
The measures that might be feasible for the management of a particular area of
the floodplain. Preparation of a floodplain risk management plan requires a
detailed evaluation of floodplain risk management options.
floodplain risk management
plan
A management plan developed in accordance with the principles and guidelines in
this manual. Usually includes both written and diagrammatic information
describing how particular areas of flood prone land are to be used and managed
to achieve defined objectives.
Lake Macquarie Waterway Flood Risk Management Study and Plan
WMAwater 29076:LakeMacFRMS.docx:26 June 2012 A3
flood plan (local) A sub-plan of a disaster plan that deals specifically with flooding. They can exist
at State, Division and local levels. Local flood plans are prepared under the
leadership of the State Emergency Service.
flood planning area The area of land below the flood planning level and thus subject to flood related
development controls. The concept of flood planning area generally supersedes
the Aflood liable land@ concept in the 1986 Manual.
Flood Planning Levels
(FPLs)
FPL=s are the combinations of flood levels (derived from significant historical flood
events or floods of specific AEPs) and freeboards selected for floodplain risk
management purposes, as determined in management studies and incorporated
in management plans. FPLs supersede the Astandard flood event@ in the 1986
manual.
flood proofing A combination of measures incorporated in the design, construction and alteration
of individual buildings or structures subject to flooding, to reduce or eliminate flood
damages.
flood prone land Is land susceptible to flooding by the Probable Maximum Flood (PMF) event.
Flood prone land is synonymous with flood liable land.
flood readiness Flood readiness is an ability to react within the effective warning time.
flood risk Potential danger to personal safety and potential damage to property resulting
from flooding. The degree of risk varies with circumstances across the full range
of floods. Flood risk in this manual is divided into 3 types, existing, future and
continuing risks. They are described below.
existing flood risk: the risk a community is exposed to as a result of its location
on the floodplain.
future flood risk: the risk a community may be exposed to as a result of new
development on the floodplain.
continuing flood risk: the risk a community is exposed to after floodplain risk
management measures have been implemented. For a town protected by levees,
the continuing flood risk is the consequences of the levees being overtopped. For
an area without any floodplain risk management measures, the continuing flood
risk is simply the existence of its flood exposure.
flood storage areas Those parts of the floodplain that are important for the temporary storage of
floodwaters during the passage of a flood. The extent and behaviour of flood
storage areas may change with flood severity, and loss of flood storage can
increase the severity of flood impacts by reducing natural flood attenuation.
Hence, it is necessary to investigate a range of flood sizes before defining flood
storage areas.
floodway areas Those areas of the floodplain where a significant discharge of water occurs during
floods. They are often aligned with naturally defined channels. Floodways are
areas that, even if only partially blocked, would cause a significant redistribution of
flood flows, or a significant increase in flood levels.
freeboard Freeboard provides reasonable certainty that the risk exposure selected in
deciding on a particular flood chosen as the basis for the FPL is actually provided.
It is a factor of safety typically used in relation to the setting of floor levels, levee
crest levels, etc. Freeboard is included in the flood planning level.
habitable room in a residential situation: a living or working area, such as a lounge room, dining
room, rumpus room, kitchen, bedroom or workroom.
in an industrial or commercial situation: an area used for offices or to store
valuable possessions susceptible to flood damage in the event of a flood.
hazard A source of potential harm or a situation with a potential to cause loss. In relation
to this manual the hazard is flooding which has the potential to cause damage to
Lake Macquarie Waterway Flood Risk Management Study and Plan
WMAwater 29076:LakeMacFRMS.docx:26 June 2012 A4
the community. Definitions of high and low hazard categories are provided in the
Manual.
hydraulics Term given to the study of water flow in waterways; in particular, the evaluation of
flow parameters such as water level and velocity.
hydrograph A graph which shows how the discharge or stage/flood level at any particular
location varies with time during a flood.
hydrology Term given to the study of the rainfall and runoff process; in particular, the
evaluation of peak flows, flow volumes and the derivation of hydrographs for a
range of floods.
local overland flooding Inundation by local runoff rather than overbank discharge from a stream, river,
estuary, lake or dam.
local drainage Are smaller scale problems in urban areas. They are outside the definition of
major drainage in this glossary.
mainstream flooding Inundation of normally dry land occurring when water overflows the natural or
artificial banks of a stream, river, estuary, lake or dam.
major drainage Councils have discretion in determining whether urban drainage problems are
associated with major or local drainage. For the purpose of this manual major
drainage involves:
the floodplains of original watercourses (which may now be piped,
channelised or diverted), or sloping areas where overland flows develop
along alternative paths once system capacity is exceeded; and/or
water depths generally in excess of 0.3 m (in the major system design
storm as defined in the current version of Australian Rainfall and Runoff).
These conditions may result in danger to personal safety and property
damage to both premises and vehicles; and/or
major overland flow paths through developed areas outside of defined
drainage reserves; and/or
the potential to affect a number of buildings along the major flow path.
mathematical/computer
models
The mathematical representation of the physical processes involved in runoff
generation and stream flow. These models are often run on computers due to the
complexity of the mathematical relationships between runoff, stream flow and the
distribution of flows across the floodplain.
merit approach The merit approach weighs social, economic, ecological and cultural impacts of
land use options for different flood prone areas together with flood damage,
hazard and behaviour implications, and environmental protection and well being of
the State=s rivers and floodplains.
The merit approach operates at two levels. At the strategic level it allows for the
consideration of social, economic, ecological, cultural and flooding issues to
determine strategies for the management of future flood risk which are formulated
into Council plans, policy and EPIs. At a site specific level, it involves
consideration of the best way of conditioning development allowable under the
floodplain risk management plan, local floodplain risk management policy and
EPIs.
minor, moderate and major
flooding
Both the State Emergency Service and the Bureau of Meteorology use the
following definitions in flood warnings to give a general indication of the types of
problems expected with a flood:
minor flooding: causes inconvenience such as closing of minor roads and the
submergence of low level bridges. The lower limit of this class of flooding on the
reference gauge is the initial flood level at which landholders and townspeople

Lake Macquarie Waterway Flood Risk Management Study and Plan
WMAwater 29076:LakeMacFRMS.docx:26 June 2012 A5
begin to be flooded.
moderate flooding: low-lying areas are inundated requiring removal of stock
and/or evacuation of some houses. Main traffic routes may be covered.
major flooding: appreciable urban areas are flooded and/or extensive rural areas
are flooded. Properties, villages and towns can be isolated.
modification measures Measures that modify either the flood, the property or the response to flooding.
Examples are indicated in Table 2.1 with further discussion in the Manual.
peak discharge The maximum discharge occurring during a flood event.
Probable Maximum Flood
(PMF)
The PMF is the largest flood that could conceivably occur at a particular location,
usually estimated from probable maximum precipitation, and where applicable,
snow melt, coupled with the worst flood producing catchment conditions.
Generally, it is not physically or economically possible to provide complete
protection against this event. The PMF defines the extent of flood prone land, that
is, the floodplain. The extent, nature and potential consequences of flooding
associated with a range of events rarer than the flood used for designing
mitigation works and controlling development, up to and including the PMF event
should be addressed in a floodplain risk management study.
Probable Maximum
Precipitation (PMP)
The PMP is the greatest depth of precipitation for a given duration
meteorologically possible over a given size storm area at a particular location at a
particular time of the year, with no allowance made for long-term climatic trends
(World Meteorological Organisation, 1986). It is the primary input to PMF
estimation.
probability A statistical measure of the expected chance of flooding (see AEP).
risk Chance of something happening that will have an impact. It is measured in terms
of consequences and likelihood. In the context of the manual it is the likelihood of
consequences arising from the interaction of floods, communities and the
environment.
runoff The amount of rainfall which actually ends up as streamflow, also known as
rainfall excess.
stage Equivalent to Awater level@. Both are measured with reference to a specified
datum.
stage hydrograph A graph that shows how the water level at a particular location changes with time
during a flood. It must be referenced to a particular datum.
survey plan A plan prepared by a registered surveyor.
water surface profile A graph showing the flood stage at any given location along a watercourse at a
particular time.
wind fetch The horizontal distance in the direction of wind over which wind waves are
generated.


Lake Macquarie Waterway Flood Risk Management Study and Plan
WMAwater 29076:LakeMacFRMS.docx:26 June 2012 C1
APPENDIX C: INFORMATION ON REPRESENTATION OF PROPERTY AND
FLOOR LEVEL DATA
The property and floor level data that have been used in this study and represented on the
various figures and tables in this report was provided by Lake Macquarie City Council in April
2011. The following lists some of the details and assumptions in the application of this
information.
The data are current as at April 2011,
The building footprint database was provided as a shape file (GIS) and only shows
the outline of the building. There is no link from the footprint to a street address and in
places the footprint may cross property boundaries. The footprint predominantly
represents a residential, commercial or industrial building, however sheds or garages
may have also be included. It is also possible that some footprints have been missed
out.
In places the zone boundaries do not align with the Lot boundary (this situation
generally only occurs for Lots that are not zoned for residential, commercial or
industrial use). In the representations made in this report the zone assigned to a Lot
is the zone boundary that aligns with the Lot boundary.
Properties are defined as all Lots with the same Property Number.
For ease of application, in the majority of the figures and tables a horizontal water
surface was assumed within the lake and in the Swansea Channel. This is not strictly
correct as there is a gradient within the Swansea Channel.
A 5m by 5m ground grid, created from the ALS survey, was used to define the ground
surface.
It is noted that the building footprint shape file indicates that there may be many
building floors not contained within the floor level database.
The extent of the foreshore area was defined by the 4 mAHD ground contour.
The ALS has a vertical accuracy of approximately +/- 0.2m.


