Lake Sarah Nutrient TMDL January 2011 Prepared for: Pioneer-Sarah Creek Watershed Management Commission and Minnesota Pollution Control Agency Prepared by: Three Rivers Park District Field Operations Center French Regional Park 121615 County Road 9 Plymouth, MN 55441 APPROVED FINAL
Transcript
Lake Sarah Nutrient TMDL
January 2011
Prepared for:
Pioneer-Sarah Creek Watershed Management Commission
and
Minnesota Pollution Control Agency
Prepared by:
Three Rivers Park District Field Operations Center French Regional Park
121615 County Road 9 Plymouth, MN 55441
APPROVED FINAL
kbarenz
Typewritten Text
wq-iw8-13e
APPROVED FINAL
TMDL Summary Table
EPA/MPCA
Required Elements Summary
TMDL
Page #Location Upper Mississippi River Basin, North Fork Crow River
Watershed, Hennepin County, MN
11-13 303(d) Listing Information
Waterbody: Lake Sarah Lake Assessment Unit ID: 27-0191-01 (Lake Sarah - West Bay) and 27-0191-02 (Lake Sarah - East Bay) Affected Use: Aquatic Recreation Pollutant or Stressor: nutrient/eutrophication biological indicators (Phosphorus) Original Listing: 2006 Priority Ranking: The 2008 303(d) list recommended a 2007 start date and 2012 end date for this TMDL
11-12
Applicable Water Quality Standards/
Numeric Targets
Class 2B Eutrophication Standards (Lakes and Reservoirs in North Central Hardwood Forest Ecoregion): Phosphorus, total: < 40 µg/L Chlorophyll-a: < 14 µg/L Secchi disc transparency: > 1.4 m Source: Minnesota Rule 7050.0222 Subp. 4.
11-12
Loading Capacity (expressed as daily
load)
1386.00 lbs/yr Total Phosphorus (TP) representing an annual average daily load of 3.797 lbs TP/day Critical condition is defined as the summer growing season.
* represents 0 lbs TP above background levels implicitly represented in the models
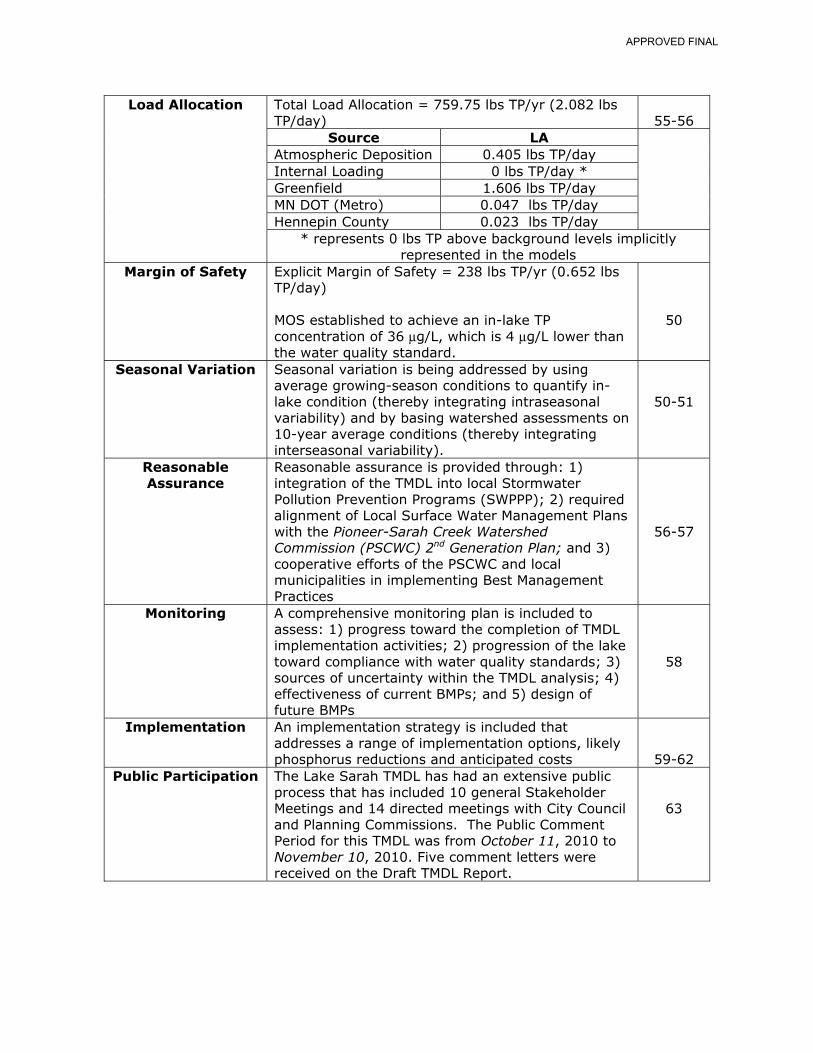
Margin of Safety Explicit Margin of Safety = 238 lbs TP/yr (0.652 lbs TP/day) MOS established to achieve an in-lake TP concentration of 36 μg/L, which is 4 μg/L lower than the water quality standard.
50
Seasonal Variation Seasonal variation is being addressed by using average growing-season conditions to quantify in-lake condition (thereby integrating intraseasonal variability) and by basing watershed assessments on 10-year average conditions (thereby integrating interseasonal variability).
50-51
Reasonable Assurance
Reasonable assurance is provided through: 1) integration of the TMDL into local Stormwater Pollution Prevention Programs (SWPPP); 2) required alignment of Local Surface Water Management Plans with the Pioneer-Sarah Creek Watershed Commission (PSCWC) 2nd Generation Plan; and 3) cooperative efforts of the PSCWC and local municipalities in implementing Best Management Practices
56-57
Monitoring A comprehensive monitoring plan is included to assess: 1) progress toward the completion of TMDL implementation activities; 2) progression of the lake toward compliance with water quality standards; 3) sources of uncertainty within the TMDL analysis; 4) effectiveness of current BMPs; and 5) design of future BMPs
58
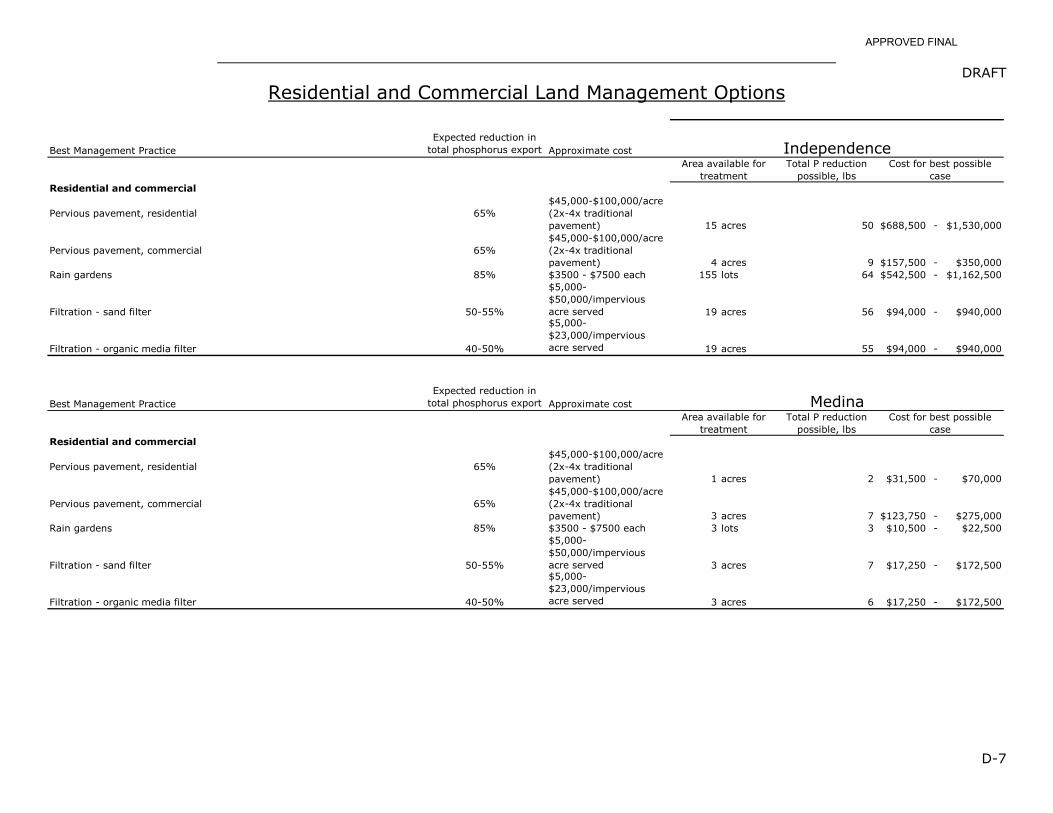
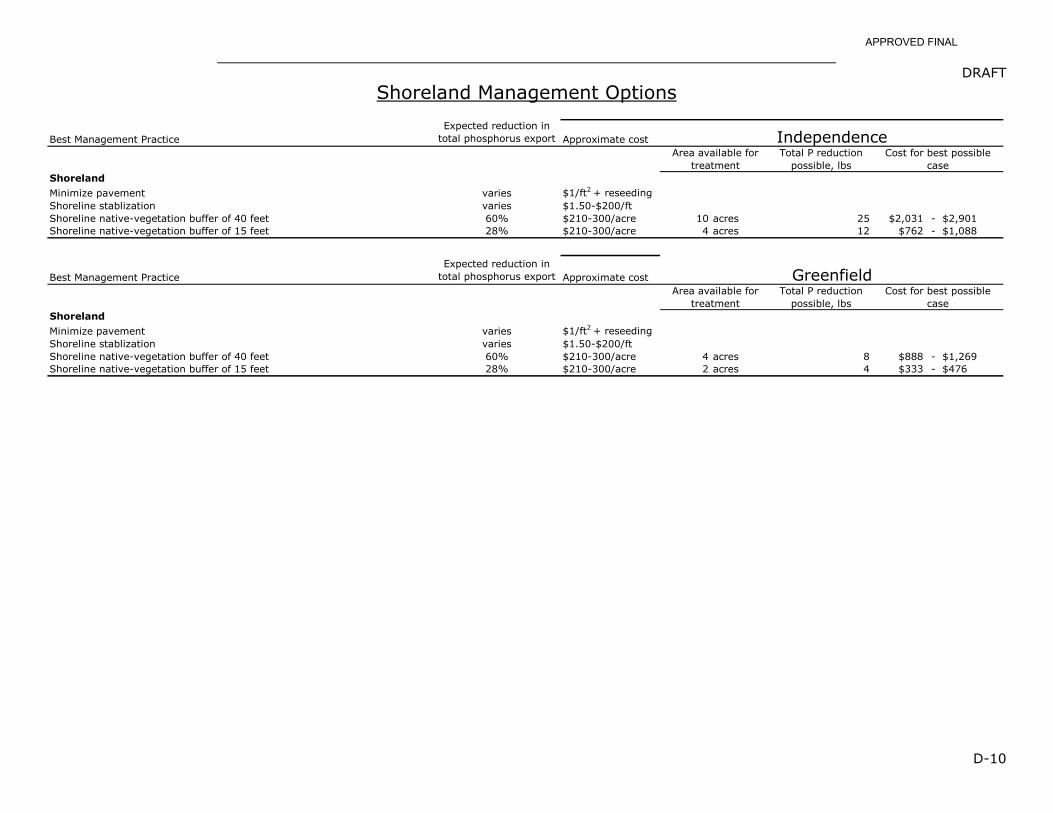
Implementation An implementation strategy is included that addresses a range of implementation options, likely phosphorus reductions and anticipated costs
59-62 Public Participation The Lake Sarah TMDL has had an extensive public
process that has included 10 general Stakeholder Meetings and 14 directed meetings with City Council and Planning Commissions. The Public Comment Period for this TMDL was from October 11, 2010 to November 10, 2010. Five comment letters were received on the Draft TMDL Report.
63
APPROVED FINAL
Table of Contents
TABLE OF FIGURES ................................................................................................. 6
TABLE OF TABLES ................................................................................................... 8
TABLE OF APPENDICES ........................................................................................ 10
1.1 PURPOSE .................................................................................................... 12 1.2 PROBLEM STATEMENT – 303(D) LISTING .......................................................... 12 1.3 APPLICABLE WATER QUALITY STANDARDS ......................................................... 12 1.4 DESCRIPTION OF LAKE SARAH AND THE SURROUNDING WATERSHED ......................... 13
Figure 1.1. Locator map for the Lake Sarah watershed. .............................................. 13
Figure 1.2. Land use throughout the Lake Sarah watershed for 2008. .......................... 14
Figure 1.3. Lake Sarah depth contours in feet. ......................................................... 17
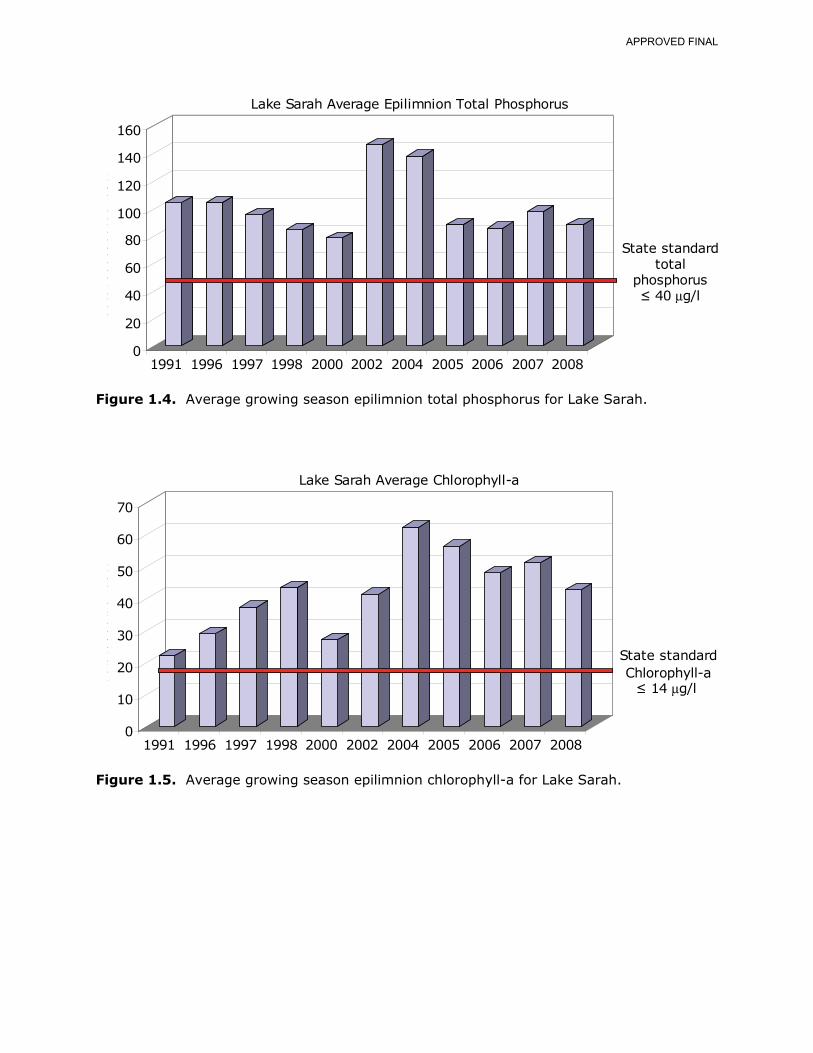
Figure 1.4. Average growing season epilimnion total phosphorus for Lake Sarah. .......... 19
Figure 1.5. Average growing season epilimnion chlorophyll-a for Lake Sarah. ............... 19
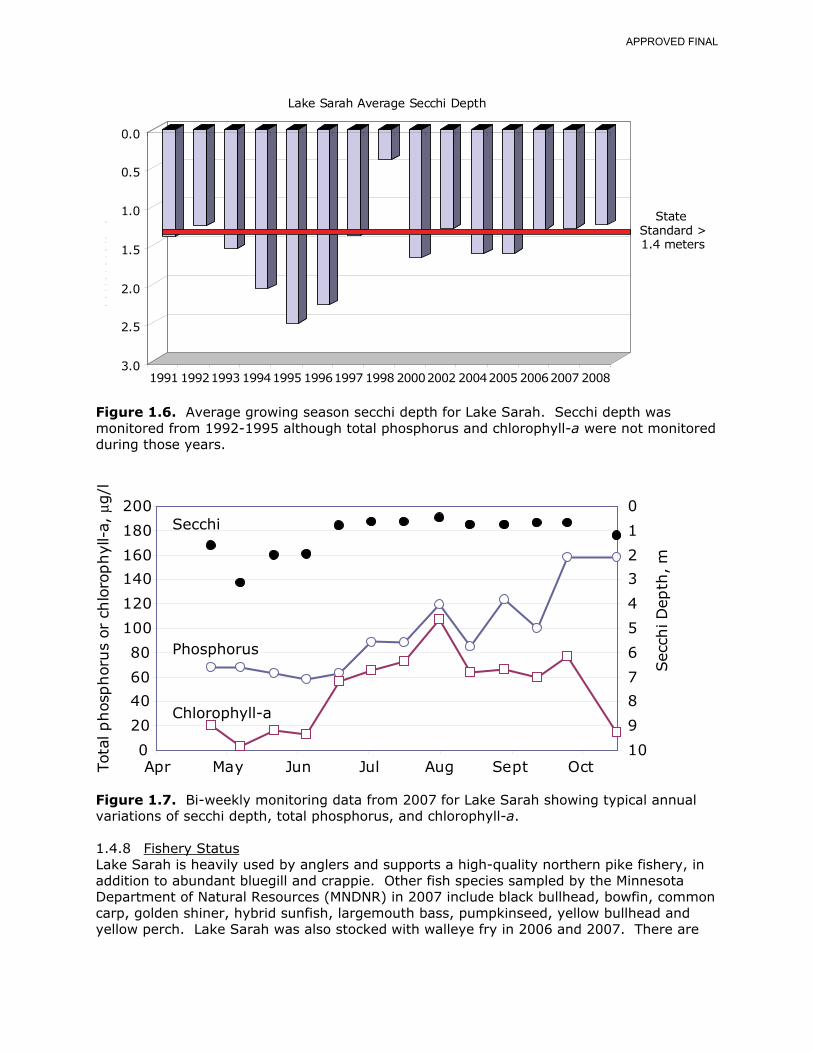
Figure 1.6. Average growing season secchi depth for Lake Sarah. Secchi depth was monitored from 1992-1995 although total phosphorus and chlorophyll-a were not monitored during those years. ................................................................................................ 20
Figure 1.7. Bi-weekly monitoring data from 2007 for Lake Sarah showing typical annual variations of secchi depth, total phosphorus, and chlorophyll-a. .................................... 20
Figure 1.8. Curlyleaf pondweed density through the littoral zone of Lake Sarah during the spring survey of 2006. ............................................................................................ 21
Figure 2.1. Watersheds for Lake Sarah tributaries and direct runoff. ........................... 23
Figure 2.2. Daily mean streamflow for the East and West Tributaries in 2007 and 2008. 25
Figure 3.1. Describes the modeling approach used for each subwatershed. ................... 26
Figure 3.2. Subwatersheds in Loretto characterized using P8. .................................... 28
Figure 3.3. Conceptual flow diagram for the P8 model of Loretto. ............................... 29
Figure 3.4. The subwatershed areas that provide direct run-off and nutrient loading to Lake Sarah. .................................................................................................................. 31
Figure 3.5. Major roadways within the Lake Sarah watershed. ................................... 32
Figure 3.6. Modeled and monitored daily flows for the East and West Tributaries during the two monitoring seasons. ......................................................................................... 37
Figure 3.7. Monitored and modeled phosphorus concentrations for the East and West watersheds during 2007 and 2008. ........................................................................... 38
Figure 3.8. Lake Sarah hypolimnetic dissolved oxygen profile in 2007. ........................ 41
Figure 3.9. Lake Sarah hypolimnetic phosphorus concentration in 2007. ...................... 41
Figure 3.10. Model predictions of epilimnion total phosphorus concentrations in Lakes Sarah in 2008. ...................................................................................................... 43
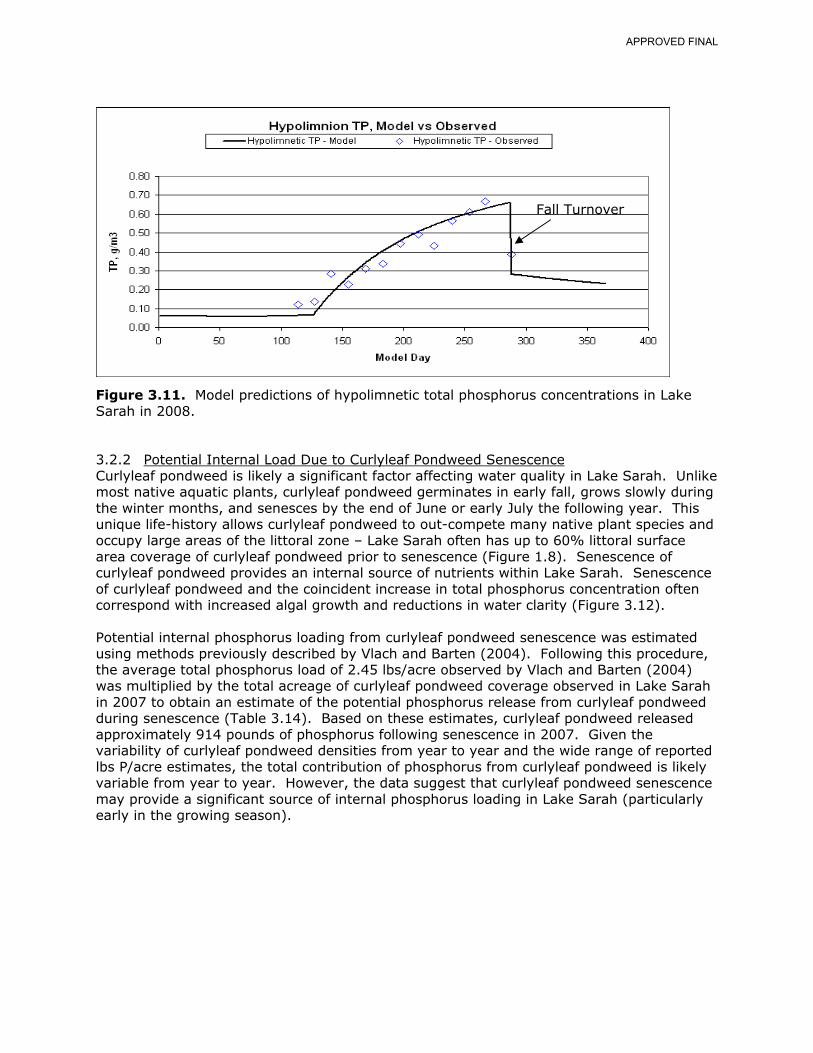
Figure 3.11. Model predictions of hypolimnetic total phosphorus concentrations in Lake Sarah in 2008. ...................................................................................................... 44
APPROVED FINAL
Figure 3.12. Lake Sarah total phosphorus concentrations corresponding to the senescence of curlyleaf pondweed (numbers above the bars represent phosphorus concentrations before and after senescence). ........................................................................................... 45
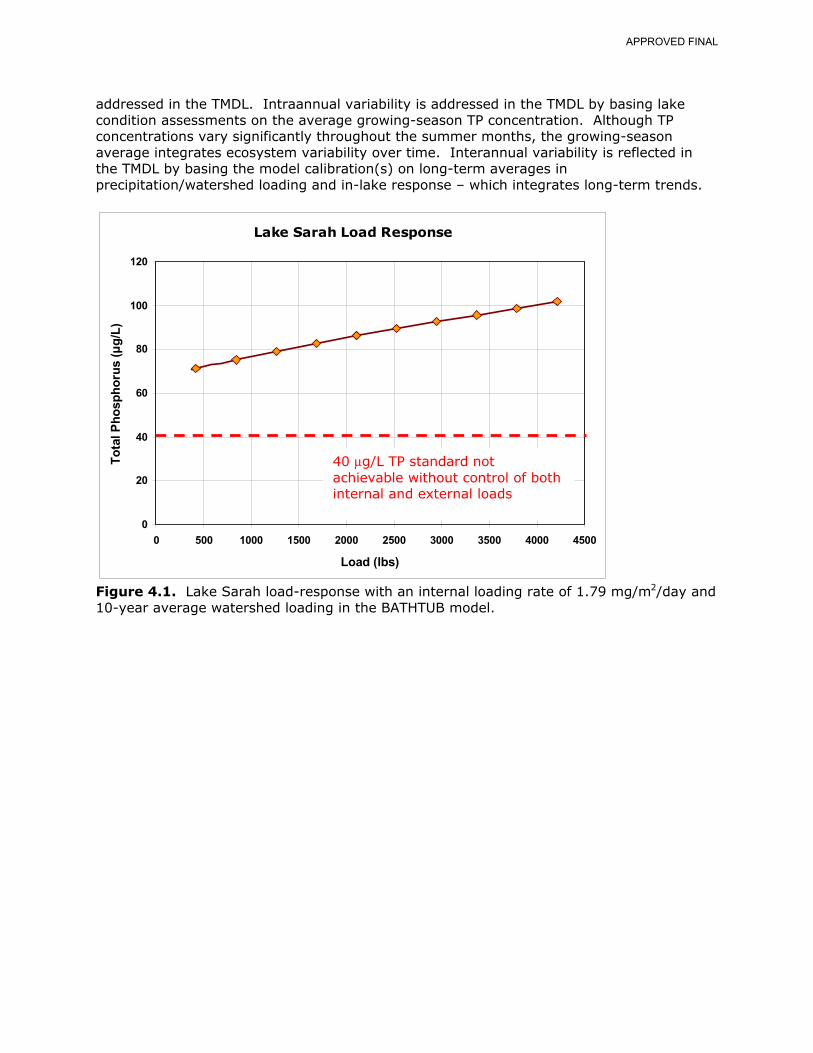
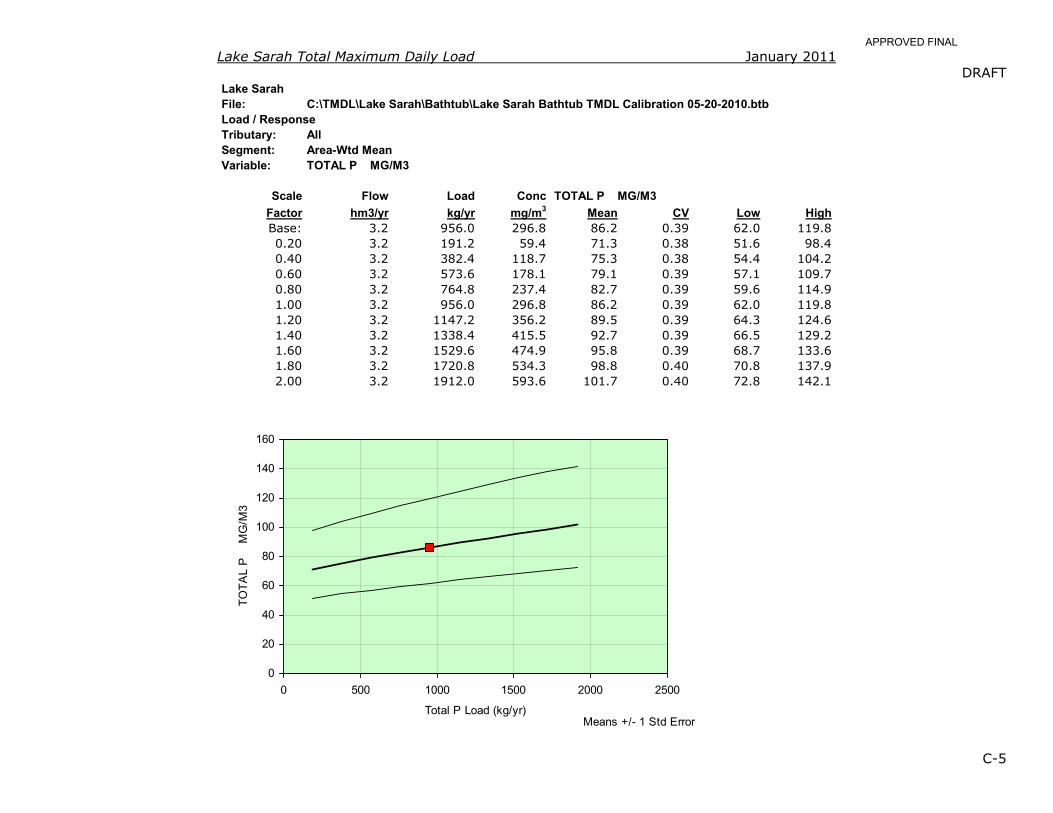
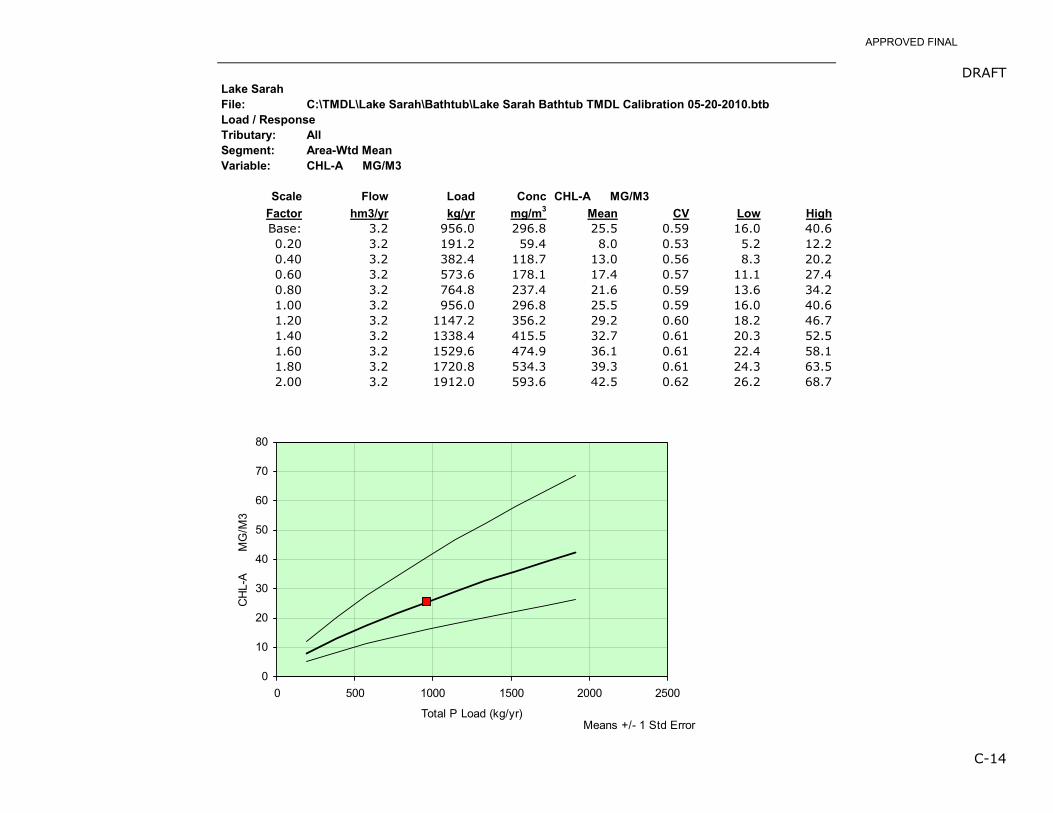
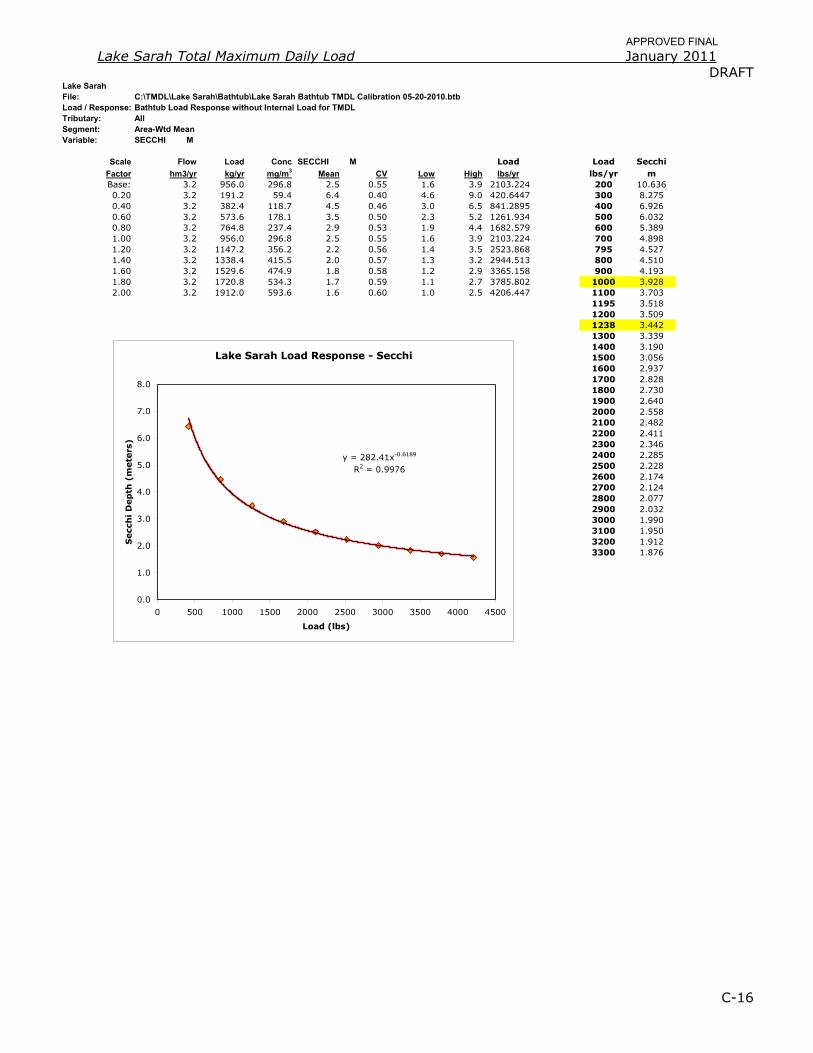
Figure 4.1. Lake Sarah load-response with an internal loading rate of 1.79 mg/m2/day and 10-year average watershed loading in the BATHTUB model. ......................................... 51
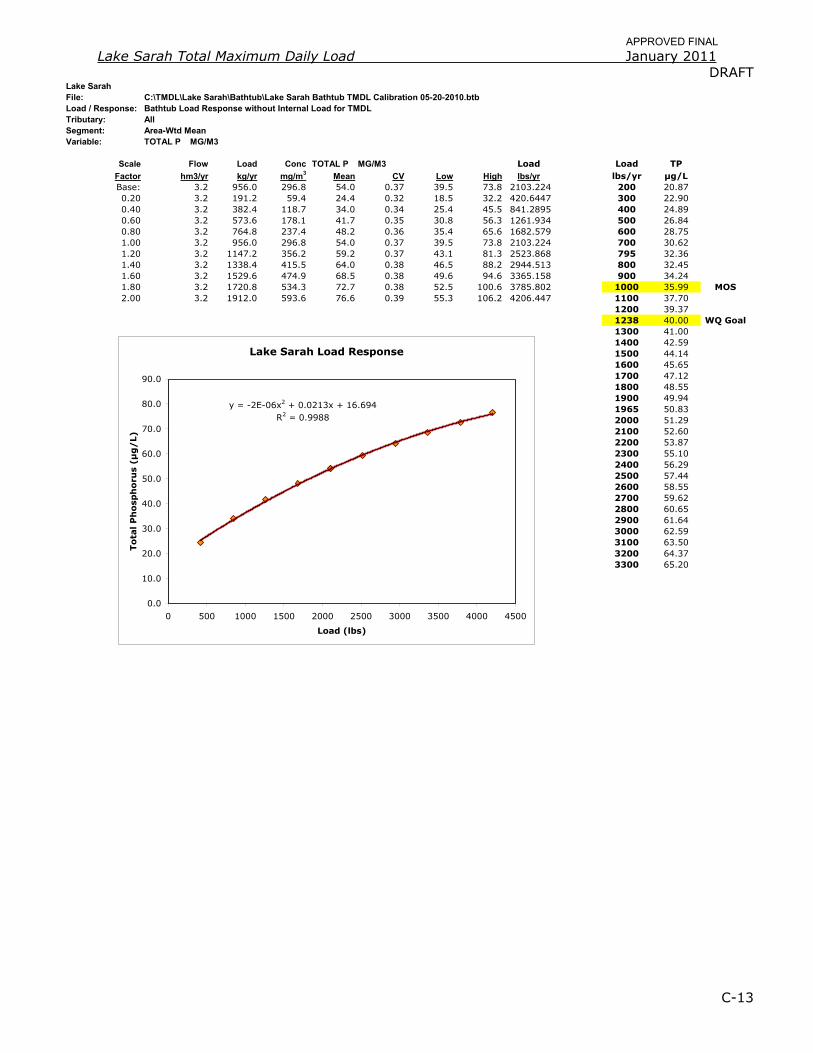
Figure 4.2. Lake Sarah load-response with internal loading set to zero in the BATHTUB model and average watershed loading based on the 10-year average. ........................... 52
APPROVED FINAL
Table of Tables Table 1.1. Annual and growing season precipitation for Rockford, MN. ......................... 15
Table 1.2. Soil areas in each of the soil hydrologic groups in the Lake Sarah watershed. 15
Table 1.3. Populations of the five municipalities in the Lake Sarah watershed from 1990 to 2030 (Metropolitan Council, 2010). .......................................................................... 16
Table 1.4. Lake Sarah physical characteristics. ......................................................... 16
Table 1.5. Average observed water quality for Lake Sarah is presented in part per billion concentration (ppb) and coefficient of variation (CV). .................................................. 18
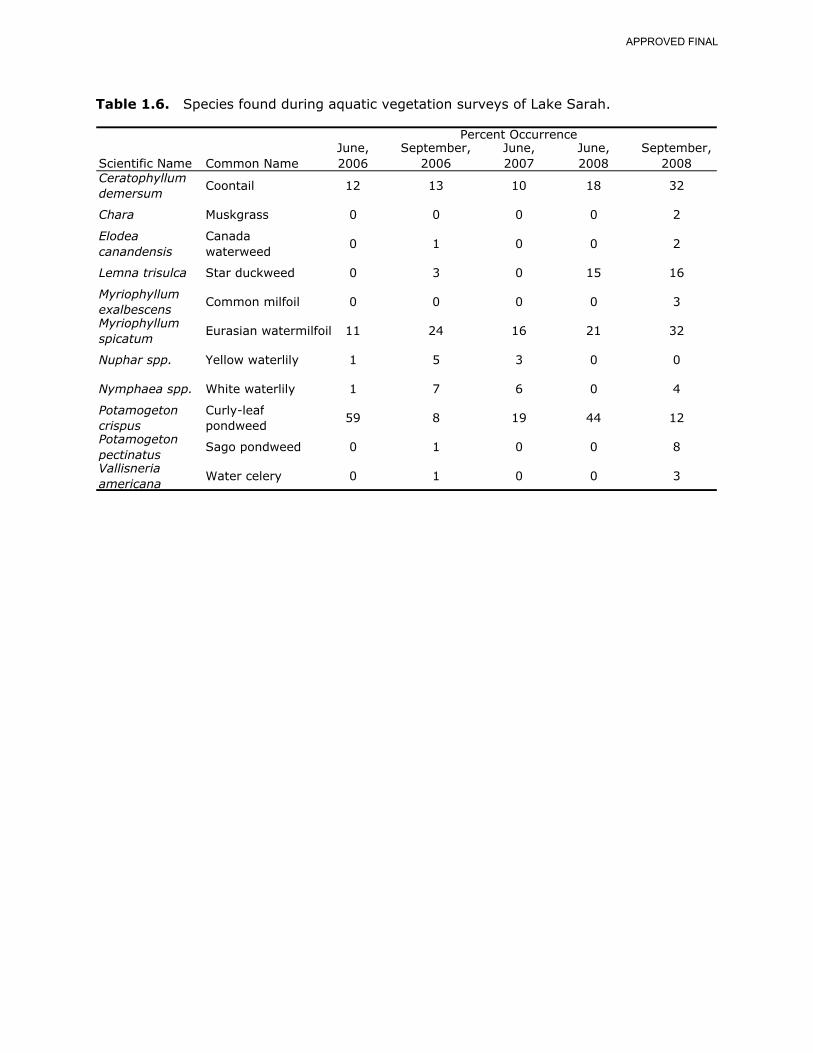
Table 1.6. Species found during aquatic vegetation surveys of Lake Sarah. ................. 22
Table 2.1. Loads of total nitrogen, total phosphorus, and soluble reactive phosphorus estimated with FLUX for 2007 and 2008. ................................................................... 24
Table 3.1. Areas and curve numbers for the Loretto subwatersheds. ............................ 28
Table 3.2. Morphological characteristics of the four nutrient removal devices in the P8 model of Loretto. ................................................................................................... 29
Table 3.3. Results from P8 model runs in Loretto ...................................................... 30
Table 3.4. Impervious and pervious source parameter acres input into the SLAMM model. ........................................................................................................................... 31
Table 3.5. County Road and State Highway inputs into the SLAMM model. ................... 32
Table 3.6. SLAMM model estimates of run-off volume and phosphorus load from subwatersheds providing direct drainage to Lake Sarah. .............................................. 33
Table 3.7. Estimates of run-off volume, dirt accumulation and phosphorus loading for major roadways within the Lake Sarah watershed. ...................................................... 33
Table 3.8. Comparisons between modeled and monitored flow volumes for calibration. All reported values correspond to the monitoring period in 2007 and 2008 (Figure 3.6). ....... 38
Table 3.9. Total phosphorus loads modeled with SWAT and estimated with FLUX for the 2007 and 2008 monitoring periods. .......................................................................... 39
Table 3.10. Average annual phosphorus exports from different land use types in the SWAT model. Reported values represent the range of averages predicted by SWAT across different soil types and topography throughout the Lake Sarah watershed. .................... 39
Table 3.11. Average annual total phosphorus load from the Lake Sarah watershed (developed using the calibrated watershed models and 10-yr precipitation file). .............. 39
Table 3.12. Nürnberg sediment release model inputs ................................................ 42
APPROVED FINAL
Table 3.13. Simple TP model user-specified constants ............................................... 43
Table 3.14. Estimate of potential internal load from the senescence of curlyleaf pondweed. ........................................................................................................................... 45
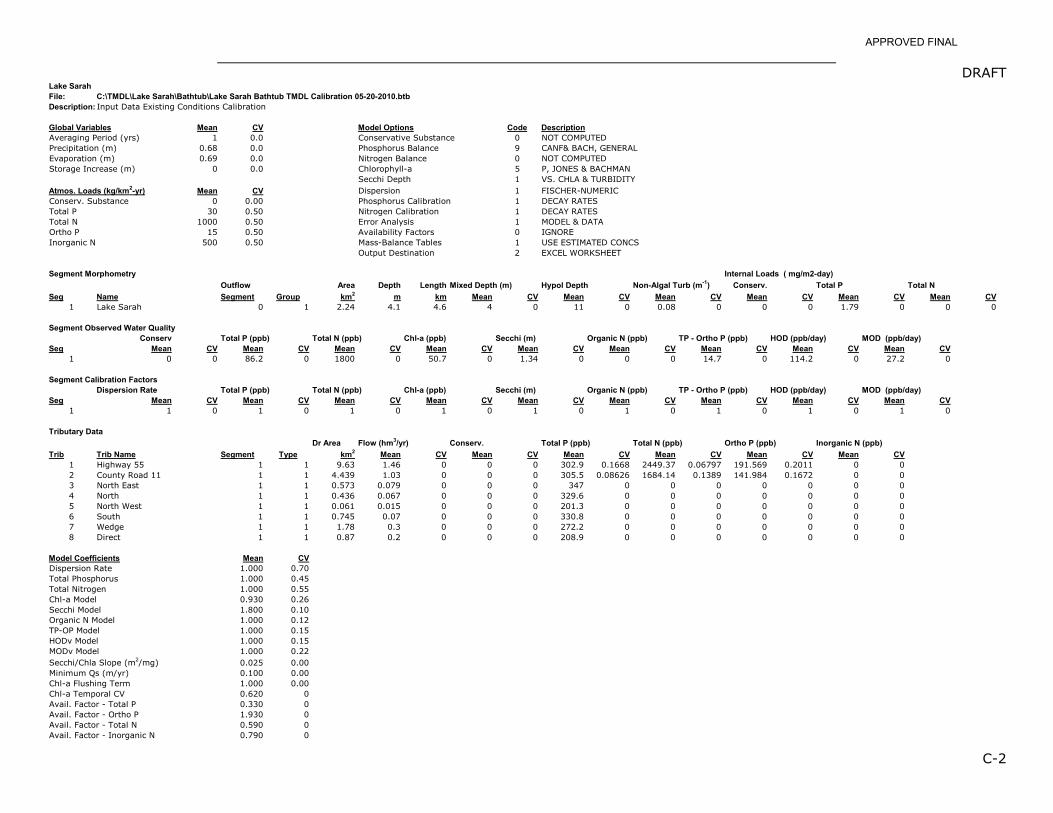
Table 4.1. Lake Sarah observed water quality conditions used for calibration of the BATHTUB model. Yearly values, averages and coefficients of variation (CV) are reported for TP, Chl-a and Secchi depth. ..................................................................................... 46
Table 4.2. Lake Sarah morphometry inputs. ............................................................ 47
Table 4.3. BATHTUB global input parameters. .......................................................... 47
Table 4.4. Lake Sarah tributary flow and concentration data used for BATHTUB calibration. ........................................................................................................................... 47
Table 4.5. BATHTUB model calibration to existing conditions. ..................................... 48
Table 4.6. Watershed loadings used for the BATHTUB model in 2007 and 2008. ............ 49
Table 4.7. Validation results from independent water quality and watershed load data from 2007 and 2008 in Lake Sarah. ................................................................................. 49
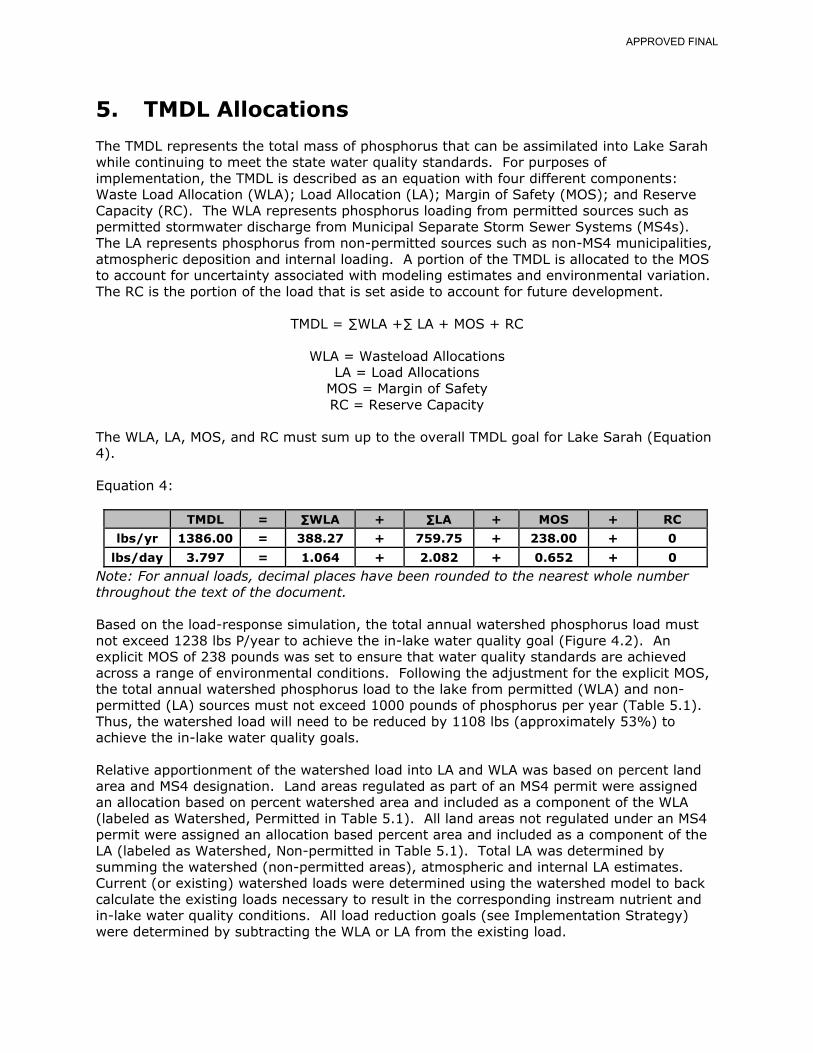
Table 5.1. Lake Sarah phosphorus sources and required reductions necessary to achieve in-lake water quality goal. ....................................................................................... 54
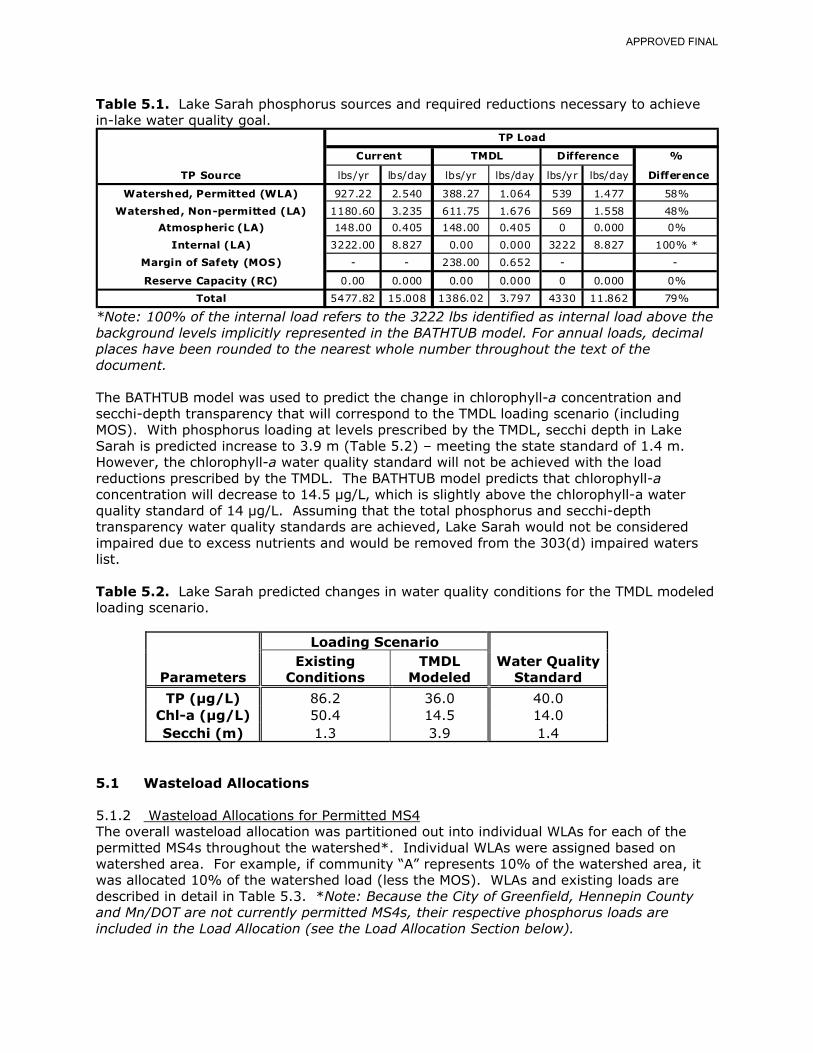
Table 5.2. Lake Sarah predicted changes in water quality conditions for the TMDL modeled loading scenario. .................................................................................................... 54
Table 5.3. Annual and daily TP wasteload allocations for permitted discharges in the Lake Sarah watershed. ................................................................................................... 55
Table 5.4. Annual and daily load allocations for non-permitted discharges in the Lake Sarah watershed. ............................................................................................................ 56
APPROVED FINAL
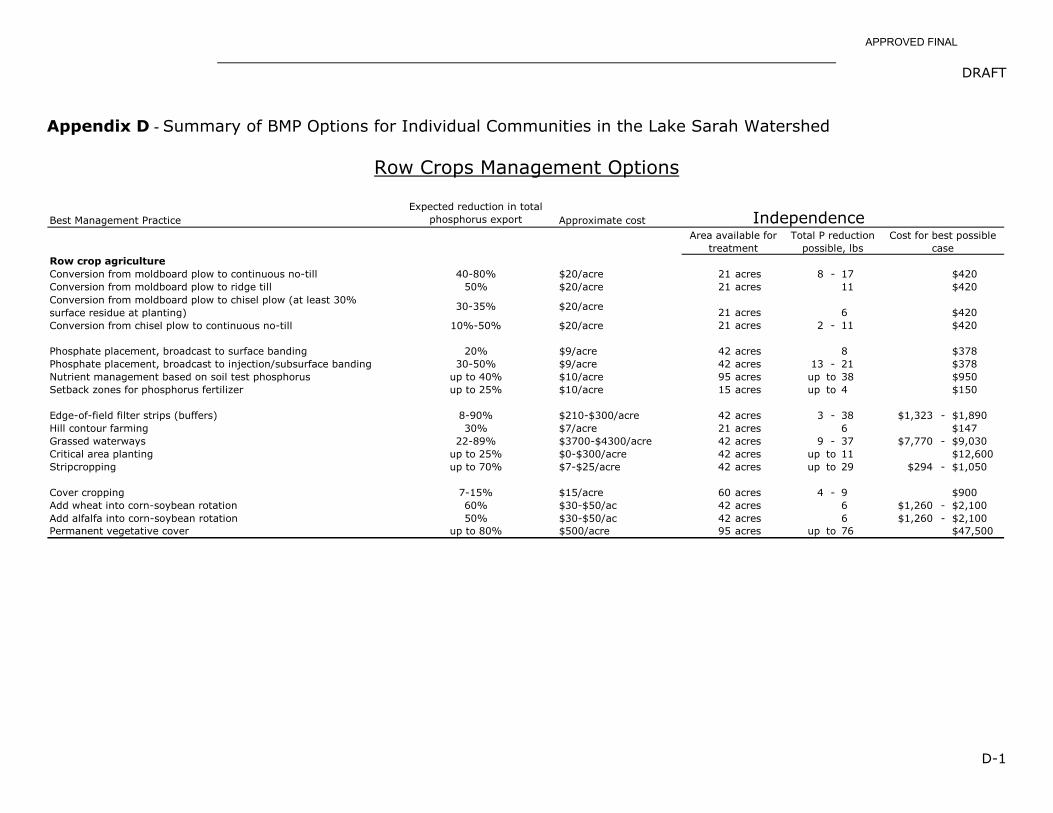
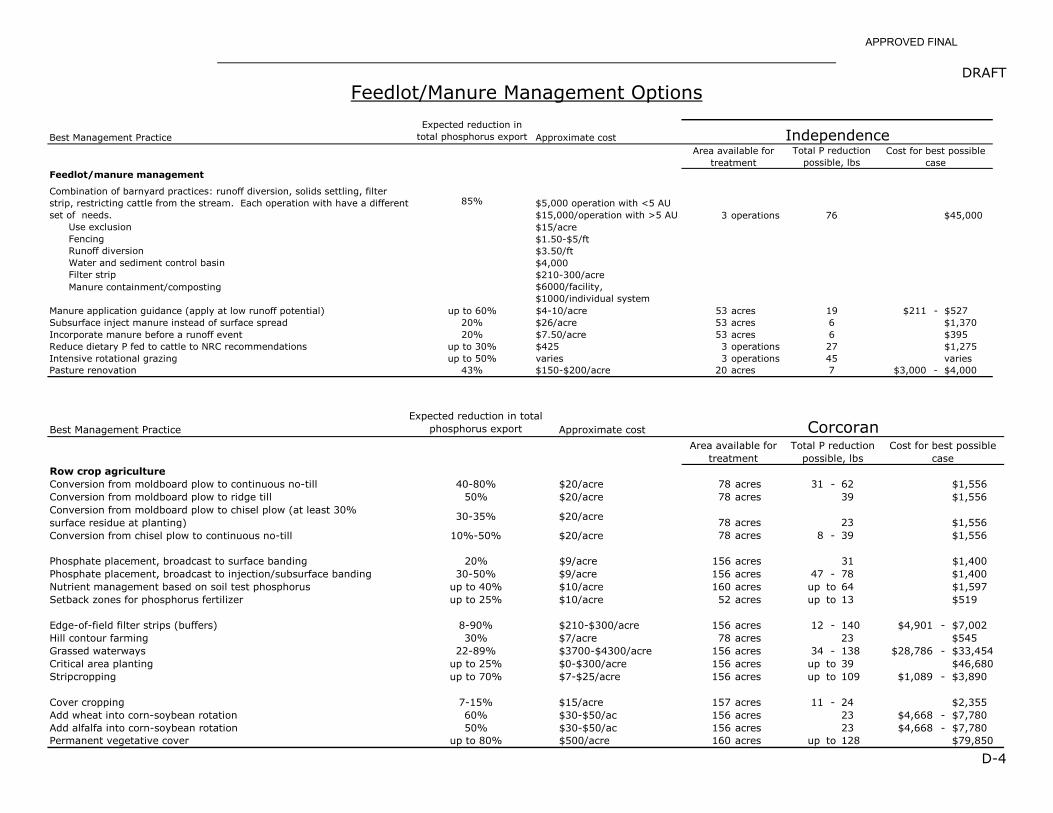
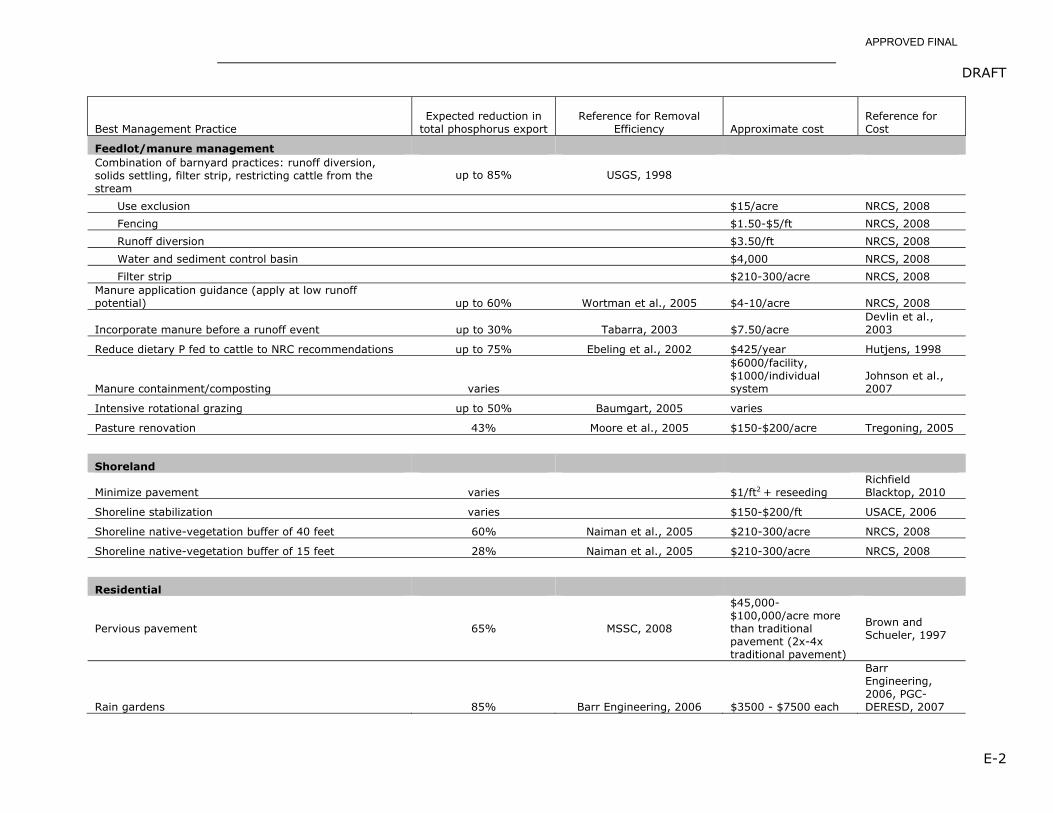
Table of Appendices Appendix A - Comparison of General Water Quality Parameters between the East and West Bays of Lake Sarah in 2008 Appendix B – SWAT Input Parameters Appendix C - BATHTUB Model Input Data, Output Files and Diagnostic Parameters Appendix D - Summary of BMP Options for Individual Communities in the Lake Sarah Watershed Appendix E - Summary of BMP Effectiveness and Anticipated Implementation Costs Appendix F – Summary of In-Lake BMP Options for Lake Sarah
APPROVED FINAL
Executive Summary Lake Sarah is a Class 2B lake located in Hennepin County in the North Central Hardwood Forest Ecoregion of Minnesota. In 2006, Lake Sarah was identified for impairment of aquatic recreation (swimming) and placed on the Minnesota Pollution Control Agency’s (MPCA) 303(d) list of impaired waters. Impaired water designation was based on an exceedance of state water quality standards: total phosphorus (< 40 µg/L); Chlorophyll-a (< 14 µg/L); and secchi disc transparency (> 1.4 m). Assessment of average water quality conditions (TP = 101 µg/L, Chl-a = 42 µg/L, Secchi = 1.5 m) was based on over ten years of biweekly monitoring data. Phosphorus in Lake Sarah (the primary cause of the impairment) originates from two main sources – watershed runoff and in-lake nutrient cycling (i.e., internal loading). Lake Sarah receives runoff from a 4,454-acre mixed-use watershed which drains land from portions of five municipalities (Greenfield, Independence, Corcoran, Loretto, and Medina) and two road authorities (Hennepin County and Minnesota Department of Transportation). Primary land uses throughout the watershed are agriculture (23%), rural residential (22%), medium density residential (7%), wetland (21%), commercial (3%), and pasture/feedlots (3%). To better understand the relative sources of phosphorus from the watershed, water quality was monitored at four sites on the two major tributaries in 2007 and 2008. The Total Maximum Daily Load (TMDL) estimate (3.797 lbs TP/day) for Lake Sarah was developed using a BATHTUB in-lake response model. Average existing phosphorus loads input into the BATHTUB model (representing 5.775 lbs TP/day) were generated using a series of models to represent watershed runoff. Runoff from agricultural land was modeled with the Soil and Water Assessment Tool (SWAT). Runoff from urban areas was modeled using either the Program for Predicting Polluting Particle Passage through Pits, Puddles, and Ponds (P8) or the Source Loading and Management Model (SLAMM). Internal loading processes contribute ~8.827 lbs TP/day (above background loading levels) to the total phosphorus load and were modeled using BATHTUB and the Nürnberg anoxic sediment release model. Modeling results suggest that the watershed phosphorus load must be reduced by ~53% and internal loading must be controlled to background levels for the lake to meet water quality standards. Results from the watershed models were used to develop wasteload allocations (WLAs), load allocations (LAs) and load reduction goals. The total WLA of 1.064 lbs TP/day was divided among all regulated entities based on watershed area. LAs estimates (totaling 2.082 lbs TP/day) were developed individually for non-permitted entities and internal phosphorus sources. The TMDL allocation equation includes an explicit margin of safety of 0.652 lbs TP/day and a reserve capacity of zero. A detailed implementation strategy was developed through interpretation of the monitoring and modeling results and an ongoing public participation process. A total of 25 stakeholder meetings were held throughout the TMDL development process and the resulting implementation strategy highlights the need to comprehensively address both watershed and internal sources of phosphorus. Reduction of the watershed load will be achieved by implementing a series of Best Management Practices (BMPs) related to row crop agriculture, feedlot and manure management, residential and commercial development and restoration of stream, wetland and shoreline habitat. Reductions in internal load will be achieved through a combination of curlyleaf pondweed control and sediment phosphorus sequestration. Total costs for implementation efforts are anticipated to range between $1.22 million and $3.66 million for all in-lake and watershed restoration work. The implementation timeframe for all measures is expected to be up to 10-15 years.
APPROVED FINAL
1. Introduction 1.1 Purpose The goal of this Total Maximum Daily Load (TMDL) analysis is to quantify the phosphorus reduction that will be required to meet the water quality standards established for Lake Sarah and identify phosphorus reduction strategies in accordance with section 303(d) of the Clean Water Act. Lake Sarah was identified as a priority resource in the Pioneer-Sarah Creek Watershed 2nd Generation Plan. A Lake Sarah Project Report and implementation plan was completed in December 1996 that suggested a number of projects to enhance lake quality. This list of projects included estimates of associated cost, expected effectiveness, predicted longevity, and technical feasibility for each proposed management alternative. Selection of actions for implementation required public discussion and cooperation between many concerned parties to evaluate and select the most acceptable management alternatives from this list. Through cooperative efforts between Three Rivers Park District, Pioneer-Sarah Creek Watershed Management Commission, local municipalities, and the Minnesota Pollution Control Agency (MPCA), this diagnostic/feasibility study evolved into the Lake Sarah Phosphorus TMDL. 1.2 Problem Statement – 303(d) Listing In 2006, Lake Sarah was identified for impairment of aquatic recreation (swimming) and placed on the MPCA 303(d) list of impaired waters. Inclusion on the 303(d) list was based on excess nutrients - the Lake Sarah mean growing-season phosphorus concentration was consistently in excess of the MPCA State water quality standard of 40 μg/L (applicable for deep lakes). See the water quality monitoring section below for a more detailed discussion of the data supporting the 303(d) listing. 1.3 Applicable Water Quality Standards Lake Sarah is located in the North Central Hardwood Forest Ecoregion, and is designated as a Class 2B water under Minnesota Rule 7050.0430. Class 2 waters are defined as:
Aquatic life and recreation. Aquatic life and recreation includes all waters of the state that support or may support fish, and other aquatic life, bathing, boating, or other recreational purposes and for which quality control is or may be necessary to protect aquatic or terrestrial life or their habitats or the public health, safety, or welfare (Minnesota Rule 7050.0140).
Numeric water quality criteria applicable to deep (i.e., at least 15 feet maximum depth or less than 80% littoral area) lakes and reservoirs in the North Central Hardwood Forest Ecoregion are (Minnesota Rule 7050.0222 Subp 4):
Eutrophication standards are compared to data averaged over the summer season (June through September). Exceedance of the total phosphorus and either the chlorophyll-a or Secchi disk standard is required to indicate a polluted condition (Minnesota Rule 7050.0222 Subp. 4a).
APPROVED FINAL
1.4 Description of Lake Sarah and the Surrounding Watershed 1.4.1 History Lake Sarah (West and East Bays; MNDNR Lake ID# 27-0191-01 and 27-0191-02) is a 553-acre lake located approximately 24 miles west of Minneapolis in west central Hennepin County (Figure 1.1). The Lake Sarah watershed was dominated by woodlands, grassland and wetlands before initial European settlement of the Greenfield area (then Greenwood) in the 1850s. Lake Sarah was named after the wife or sweetheart of an unknown pioneer in 1855. It was alternately called Union Lake and Long Lake before Lake Sarah became the accepted name. The onset of agriculture brought the removal of the hardwood forests and the draining of wetlands and small lakes in the watershed. Agriculture has continued to dominate the landscape in the Lake Sarah Watershed, though agricultural parcels are being subdivided to accommodate rural residential development on 2 to 40 acre lots.
Figure 1.1. Locator map for the Lake Sarah watershed. The Lake Sarah watershed has been heavily influenced by its proximity to Minneapolis, 24 miles to the east. The Soo Line Railroad was laid through Greenfield, Loretto, and Medina in the 1880s and Lake Sarah became a popular summer destination for vacationers from Minneapolis. The downturn in the resort industry occurred with the onset of the Second World War and the resort buildings were converted to homes or removed to make way for shoreline development. The final resort was closed in 1993. The main automobile route in the area, State Highway 55, was paved in the 1940s and provides automobile traffic to and from Minneapolis. The current trend towards rural residential development is a continuation of the expansion of Minneapolis suburban development to the west.
APPROVED FINAL
1.4.2 Land Use Lake Sarah receives runoff from a 4454-acre mixed-use watershed which drains land from portions of five municipalities – Greenfield, Independence, Corcoran, Loretto, and Medina (Figures 1.1 and 1.2). The primary land uses are agriculture (23%), rural residential (22%), medium density residential (7%), wetland (21%) and commercial (3%). Approximately 3% of the land in the watershed is dedicated to pasture and feedlots for horses and cattle. Most of the shoreline land is occupied by single family residential homes, but the shoreline also includes a horse farm, a cattle farm, wetland areas, and parkland. Property along the western shoreline of the lake is within the Lake Sarah Regional Park, operated by Three Rivers Park District. In recent years, agricultural land has been increasingly converted into residential and commercial developments in the Lake Sarah watershed. Development of agricultural land into low density residential, medium density residential and commercial land uses is expected to continue. The Metropolitan Council’s 2030 land use plan includes substantial areas that will be zoned for residential and commercial development.
Greenfield
Independence
Medina
Corcoran
Loretto
Land Use
0 0.8 1.60.4MilesParcel Boundaries
AgricultureFeedlot
Forest / TreesGrassland Highway 55
Pasture Industrial / Commercial
Residential - Low Density
Residential - Medium Density
Roads
Open WaterWetland
Figure 1.2. Land use throughout the Lake Sarah watershed for 2008. 1.4.3 Climate Lake Sarah and its surrounding watershed are located within the Northern Central Hardwood Forest ecoregion. The closest weather station to the Lake Sarah Watershed is the cooperative observer station at Rockford, MN (COOP ID 217020). Average annual precipitation for this station from 1979 to 2008 is 754 mm (29.7 inches; Table 1.1). Approximately 72% of the precipitation falls as rain during the six-month growing season of
APPROVED FINAL
May to October. Yearly ice cover records have not been kept on Lake Sarah, but typically ice cover is established in the end of November and disappears the first week of April. Based on current trends in Minnesota, regional climate is expected to experience increases in precipitation, dew points, winter overnight temperatures, and rainfall intensities during convective storms (Seeley, 2003). Increased rainfall intensities and precipitation amounts are expected to result in increased runoff and potential for phosphorus transport. Table 1.1. Annual and growing season precipitation for Rockford, MN.
Period Annual precipitation, mm May to October precipitation, mm1979-2008, average 754 546
10-year average 681 4872007 732 5272008 582 397
1.4.4 Geology and Soils The topography of the Lake Sarah watershed, like much of Hennepin and the surrounding counties, is the product of glacial processes and ice wasting during and after the last glacial maxima, approximately 14,000 years ago. Soils in the Lake Sarah watershed were formed from glacial till parent material (Steffen, 2001) and include some relatively clay-rich lenses compared with other tills in Hennepin County. The till units found in the watershed are loamy tills and clayey tills associated with the Des Moines Lobe. There are also some small areas of lacustrine clay and silt deposited by glacial lakes. Soils in the Lake Sarah watershed overlay approximately 100 to 300 feet of unconsolidated glacial material. The Franconia Formation, an Upper Cambrian dolomitic sandstone and shale, is the first bedrock layer below the unconsolidated material. The Lake Sarah watershed includes soils in four soil orders: Mollisols, Histosols, Alfisols, and Entisols. The dominant orders in the non-wetland areas are Mollisols and Alfisols. Small areas along the lake shore and in Loretto are classified as Entisols. Soils classified as Histosols dominate the wetland areas. Textures range from sandy over loamy to fine, but the majority of the soils are fine-loamy. Soils in the Lake Sarah watershed are within the entire spectrum of well drained (soil hydrologic group A) to poorly drained (soil hydrologic group D). The majority of the watershed area is in the B soil hydrologic group (Table 1.2) and classified as moderately well drained. Soils in the A/D, B/D, and C/D soil hydrologic groups are wetland soils and the two hydrologic group classifications refer to the normal and wetted drainage of the soil. Because of the variation in natural drainage in the watershed, there are some tile lines in place to drain agricultural fields. Table 1.2. Soil areas in each of the soil hydrologic groups in the Lake Sarah watershed.
1.4.5 Demographic Information The five municipalities in the Lake Sarah watershed are experiencing population growth and residential development (Table 1.3). The portion of three of these communities, Greenfield, Medina, and Corcoran, that is in the Lake Sarah watershed is currently in rural land uses and is anticipated (based on 2030 Comprehensive Plans) to continue to develop significantly in future years. The remaining two communities, Loretto and Independence, are predominantly developed within the watershed boundary and will only undergo small amounts of further development. Table 1.3. Populations of the five municipalities in the Lake Sarah watershed from 1990 to 2030 (Metropolitan Council, 2010).
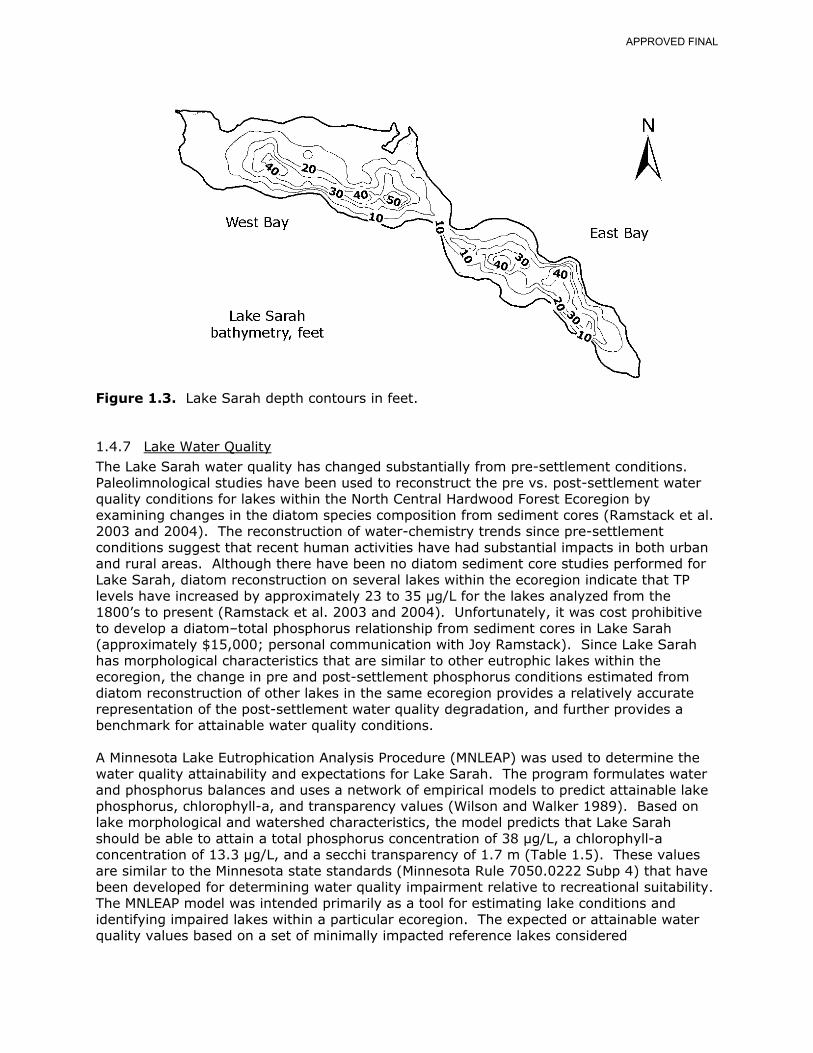
1.4.6 Lake Morphometry and Hydrology Lake Sarah is a deep (maximum depth of 59 feet and a median depth of 9.7 feet), elongated lake of glacial origin with two bays: a west bay and an east bay. Water flows down gradient in the lake from east to west, where the outlet is located (Figure 1.3). In 2004, the lake outlet was set at 985.42 feet. Lake Sarah is fed by three surface water inlets and direct runoff from surrounding areas (Figure 1.1). Precipitation and shallow groundwater also contribute water directly to the lake. Information about the morphometry, watershed, and observed water quality are found in Table 1.4. Table 1.4. Lake Sarah physical characteristics. Morphometry and WatershedLake area (acre) 553Maximum depth - (feet) 59Median depth (feet) 9.7% Littoral (% of basin 15 feet or less in depth) 65Drainage area (total acre) 4,454Watershed: lake area ratio 8 to 1Water residence time (years) 1.95Thermally stratified in summer? YesDoes lake have surface outlet? YesIs the lake a "created" lake? NoIs the lake managed as a reservoir? No
APPROVED FINAL
Figure 1.3. Lake Sarah depth contours in feet.
1.4.7 Lake Water Quality
The Lake Sarah water quality has changed substantially from pre-settlement conditions. Paleolimnological studies have been used to reconstruct the pre vs. post-settlement water quality conditions for lakes within the North Central Hardwood Forest Ecoregion by examining changes in the diatom species composition from sediment cores (Ramstack et al. 2003 and 2004). The reconstruction of water-chemistry trends since pre-settlement conditions suggest that recent human activities have had substantial impacts in both urban and rural areas. Although there have been no diatom sediment core studies performed for Lake Sarah, diatom reconstruction on several lakes within the ecoregion indicate that TP levels have increased by approximately 23 to 35 µg/L for the lakes analyzed from the 1800’s to present (Ramstack et al. 2003 and 2004). Unfortunately, it was cost prohibitive to develop a diatom–total phosphorus relationship from sediment cores in Lake Sarah (approximately $15,000; personal communication with Joy Ramstack). Since Lake Sarah has morphological characteristics that are similar to other eutrophic lakes within the ecoregion, the change in pre and post-settlement phosphorus conditions estimated from diatom reconstruction of other lakes in the same ecoregion provides a relatively accurate representation of the post-settlement water quality degradation, and further provides a benchmark for attainable water quality conditions. A Minnesota Lake Eutrophication Analysis Procedure (MNLEAP) was used to determine the water quality attainability and expectations for Lake Sarah. The program formulates water and phosphorus balances and uses a network of empirical models to predict attainable lake phosphorus, chlorophyll-a, and transparency values (Wilson and Walker 1989). Based on lake morphological and watershed characteristics, the model predicts that Lake Sarah should be able to attain a total phosphorus concentration of 38 µg/L, a chlorophyll-a concentration of 13.3 µg/L, and a secchi transparency of 1.7 m (Table 1.5). These values are similar to the Minnesota state standards (Minnesota Rule 7050.0222 Subp 4) that have been developed for determining water quality impairment relative to recreational suitability. The MNLEAP model was intended primarily as a tool for estimating lake conditions and identifying impaired lakes within a particular ecoregion. The expected or attainable water quality values based on a set of minimally impacted reference lakes considered
APPROVED FINAL
representative of healthy aquatic ecosystems are compared to the current water quality conditions. The MNLEAP model indicates that the current water quality conditions are significantly different than the attainable or expected water quality conditions (Table 1.5). Lake Sarah has been monitored biweekly during the ice-free season in 1991 and yearly from 1996 to 2008 with the exception of 1999, 2001, and 2003 (Table 1.5). Monitoring efforts have characterized changes in total phosphorus (TP), soluble reactive phosphorus (SRP), chlorophyll-a (Chl-a), temperature, conductivity, dissolved oxygen (DO) and secchi depth. All in-lake data have been collected by Three Rivers Park District water resource staff following standard procedures for eutrophic lake assessment (Heiskary 1994 and MPCA 2007). Based on the monitoring data, Carlson’s Trophic State Index (TSI; Carlson, 1977) ranges from 54 to 70.7 (eutrophic to hypereutrophic). Average annual total phosphorus concentrations (Figure 1.4) show no significant trend throughout the data record, but average chlorophyll-a concentration (Figure 1.5) has increased annually and average secchi depth (Figure 1.6) has decreased, indicating a trend towards larger algae populations. In any given year, water quality changes significantly throughout the summer, generally resulting in increased algal blooms and reduced water clarity by late summer (Figure 1.7). Lake Sarah did not meet the state standard for average annual total phosphorus for recreational contact in any year it was monitored. Table 1.5. MNLEAP model estimates for comparing expected and observed water quality conditions for Lake Sarah.
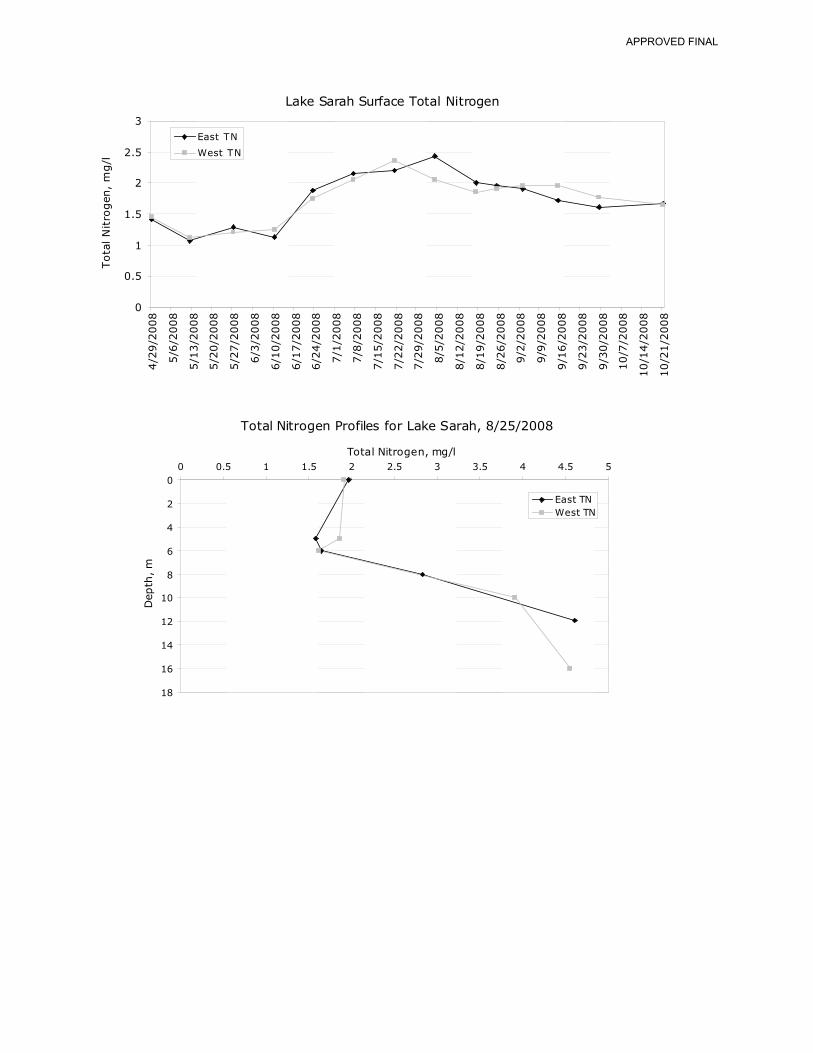
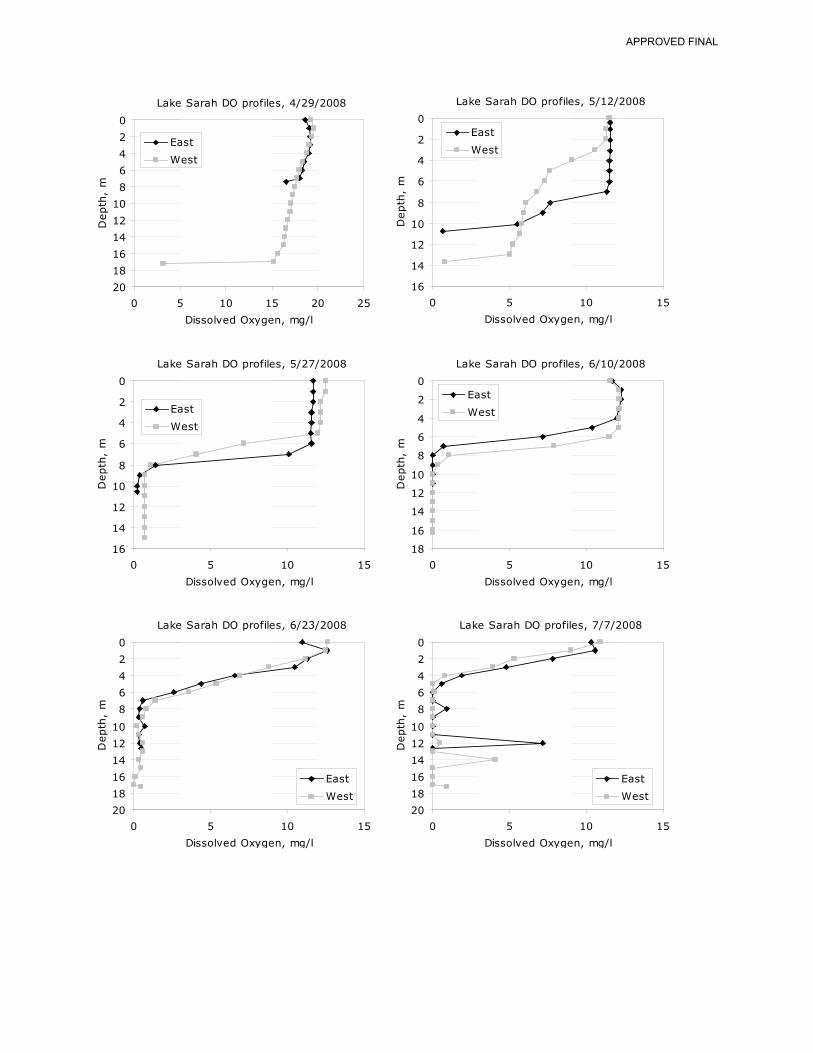
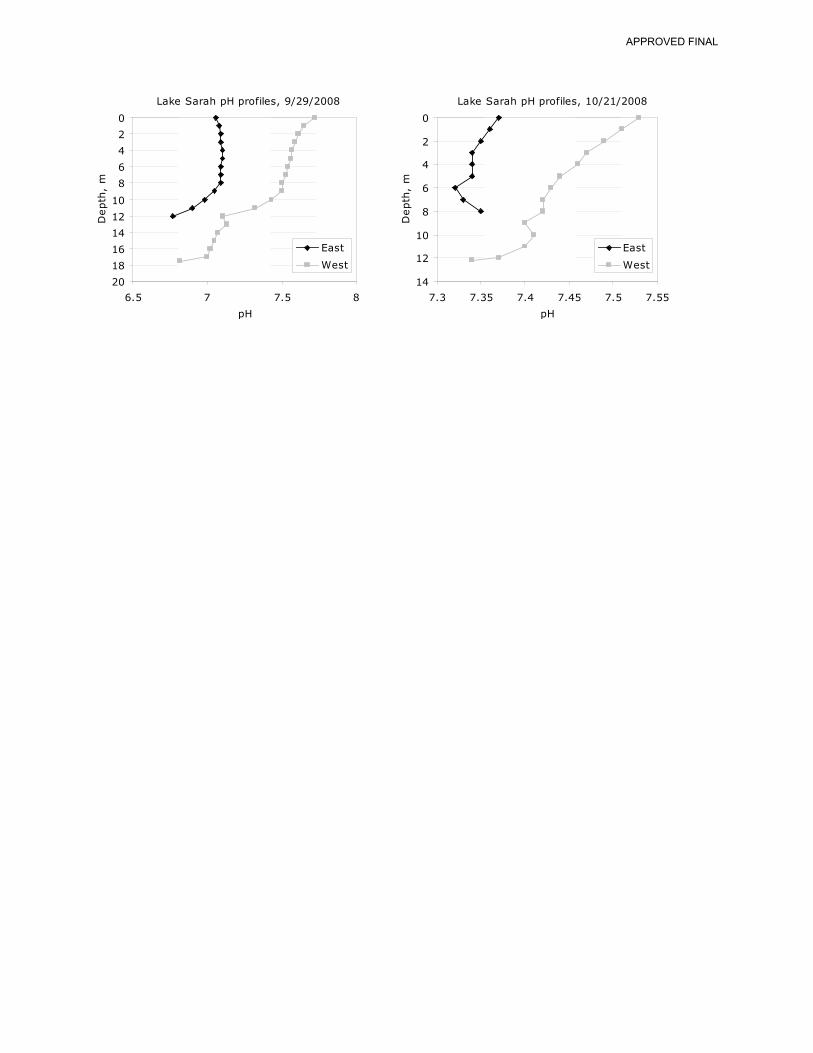
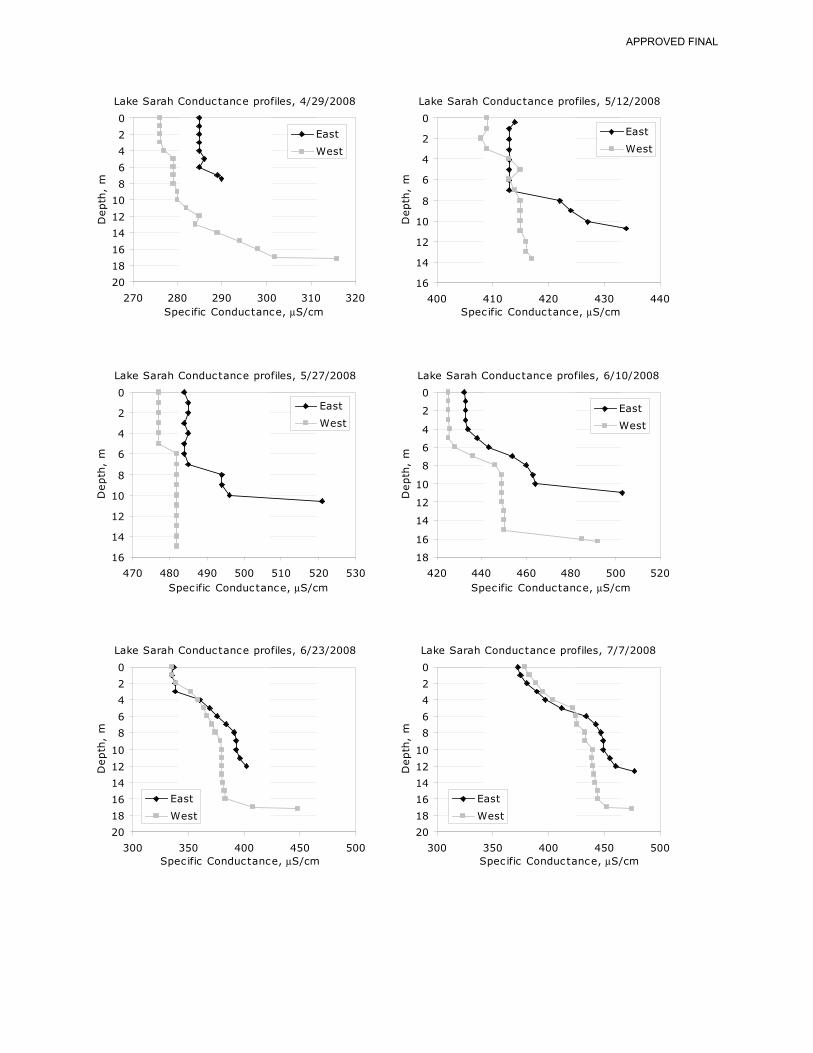
WQ – Water Quality CV – Coefficient of Variation Lake Sarah has two bays, a west bay with a maximum depth of 59 feet and an east bay with a maximum depth of 53 feet. From 1991 to 2007 only the west bay was monitored. Both bays were monitored in 2008 to examine potential water quality differences. Water quality and stratification were very similar in both bays throughout 2008; and thus, data gathered in the west bay was used to represent the water quality condition of the entire lake (Appendix A).
APPROVED FINAL
Lake Sa r ah Average Epilimnion Total Phosphorus
0
20
40
60
80
1 00
1 20
1 40
1 60
T o t
a l
P ho sp ho r u
s
, μ
g /l
Sta te standatotal
ph osp≤ 40
horuμg/l
rd
s
1 9 9 1 199 6 1 9 97 1 9 9 8 2000 2002 2004 2005 2006 2007 2008 Figure 1.4. Average growing season epilimnion total phosphorus for Lake Sarah.
La ke Sarah Average Chlorophyll-a
70
60
50l
/
g
μ
,
40a
-
l
l
y
30h
p
o
Sta te standardr
20o
l
Figure 1.5. Average growing season epilimnion chlorophyll-a for Lake Sarah.
Figure 1.6. Average growing season secchi depth for Lake Sarah. Secchi depth was monitored from 1992-1995 although total phosphorus and chlorophyll-a were not monitored during those years.
0
20
40
60
80
100
120
140
160
180
200
Apr May Jun Jul Aug Sept OctTota
lphos
phor
us
orch
loro
phyl
l-a,
μg/l
0
1
2
3
4
5
6
7
8
9
10
Sec
chiD
epth
,m
Secchi
Chlorophyll-a
Phosphorus
Figure 1.7. Bi-weekly monitoring data from 2007 for Lake Sarah showing typical annual variations of secchi depth, total phosphorus, and chlorophyll-a. 1.4.8 Fishery Status Lake Sarah is heavily used by anglers and supports a high-quality northern pike fishery, in addition to abundant bluegill and crappie. Other fish species sampled by the Minnesota Department of Natural Resources (MNDNR) in 2007 include black bullhead, bowfin, common carp, golden shiner, hybrid sunfish, largemouth bass, pumpkinseed, yellow bullhead and yellow perch. Lake Sarah was also stocked with walleye fry in 2006 and 2007. There are
APPROVED FINAL
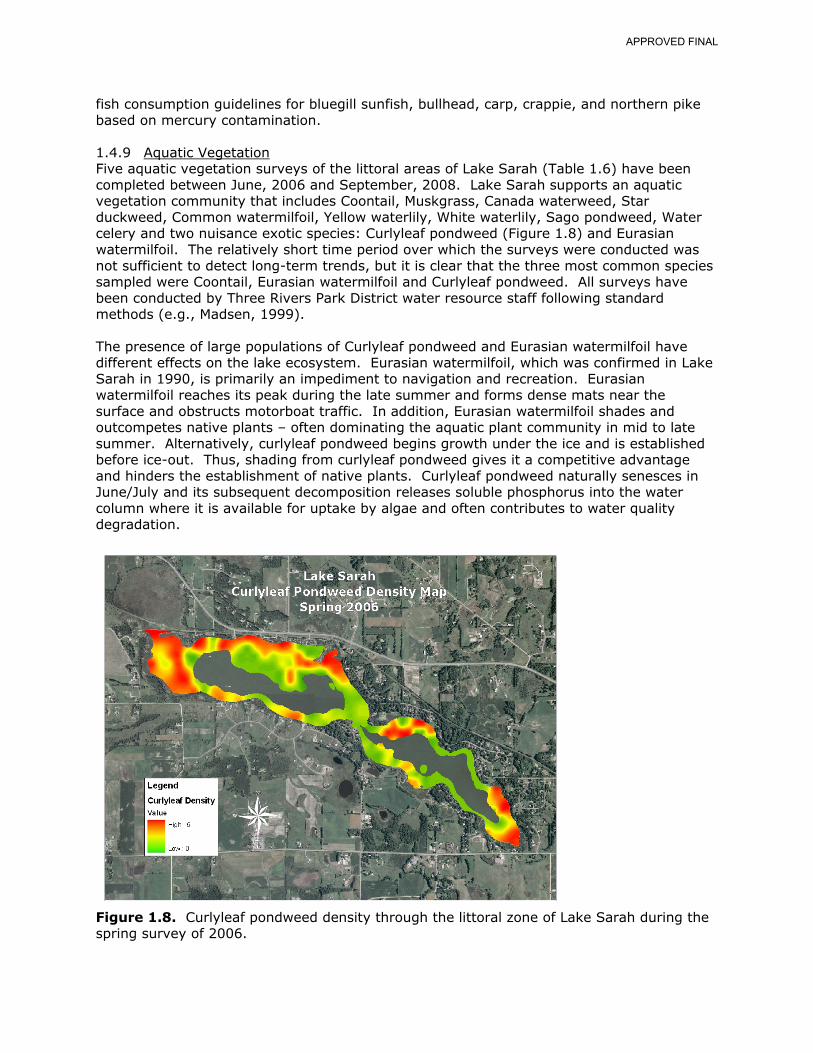
fish consumption guidelines for bluegill sunfish, bullhead, carp, crappie, and northern pike based on mercury contamination. 1.4.9 Aquatic Vegetation Five aquatic vegetation surveys of the littoral areas of Lake Sarah (Table 1.6) have been completed between June, 2006 and September, 2008. Lake Sarah supports an aquatic vegetation community that includes Coontail, Muskgrass, Canada waterweed, Star duckweed, Common watermilfoil, Yellow waterlily, White waterlily, Sago pondweed, Water celery and two nuisance exotic species: Curlyleaf pondweed (Figure 1.8) and Eurasian watermilfoil. The relatively short time period over which the surveys were conducted was not sufficient to detect long-term trends, but it is clear that the three most common species sampled were Coontail, Eurasian watermilfoil and Curlyleaf pondweed. All surveys have been conducted by Three Rivers Park District water resource staff following standard methods (e.g., Madsen, 1999). The presence of large populations of Curlyleaf pondweed and Eurasian watermilfoil have different effects on the lake ecosystem. Eurasian watermilfoil, which was confirmed in Lake Sarah in 1990, is primarily an impediment to navigation and recreation. Eurasian watermilfoil reaches its peak during the late summer and forms dense mats near the surface and obstructs motorboat traffic. In addition, Eurasian watermilfoil shades and outcompetes native plants – often dominating the aquatic plant community in mid to late summer. Alternatively, curlyleaf pondweed begins growth under the ice and is established before ice-out. Thus, shading from curlyleaf pondweed gives it a competitive advantage and hinders the establishment of native plants. Curlyleaf pondweed naturally senesces in June/July and its subsequent decomposition releases soluble phosphorus into the water column where it is available for uptake by algae and often contributes to water quality degradation.
Figure 1.8. Curlyleaf pondweed density through the littoral zone of Lake Sarah during the spring survey of 2006.
APPROVED FINAL
Table 1.6. Species found during aquatic vegetation surveys of Lake Sarah.
2. Watershed Monitoring To understand the relative sources of phosphorus from the watershed, water quality was monitored throughout the Lake Sarah watershed from April to November in both 2007 and 2008. The East and West Tributary sites were monitored during both 2007 and 2008 and the East Upstream and West Upstream sites were monitored from June to November, 2008 (Figure 2.1). The West Upstream site was not included in the analysis because equipment problems produced an inconsistent record.
LakeSarah,
561 acres
Eastwatershed,1097 acres
Westwatershed,2379 acres
Middlewatershed
and direct runoff,968 acres
Greenfield
Independence
Corcoran
Medina
Loretto
0 0.5 1Miles
Monitoring Locations
Municipalities
Monitored watersheds
Unmonitored watershed East Tributary
East Tributary Upstream
West Tributary
West TributaryUpstream
Figure 2.1. Watersheds for Lake Sarah tributaries and direct runoff. Continuous level and velocity in each of the streams were measured every 15 minutes during the monitoring period with Isco Area-Velocity probes communicating with Isco 4150 data loggers (Teledyne Isco, Inc., Lincoln, NE). Area-Velocity probes were used for monitoring and maintained approximately twice per week during the sampling period. The East Tributary site was located at a concrete box culvert flowing under County Road 11 and the West Tributary site was located at a metal 36-inch culvert flowing under a grass path extension to the east end of North Shore Drive in Greenfield. The East Upstream site was at a 60” metal culvert flowing under Townline Road and the West Upstream site was located at an 18” metal culvert flowing under Greenfield Road. Flows were calculated for each of the sites using Isco Flowlink version 4.16 (Teledyne Isco, Inc., Lincoln, NE) and the measured level, velocity, and culvert diameter. All streamflow measurements were conducted by Three Rivers Park District water resource staff following previously described protocols (Walker, 1996). Water quality samples (composite and grab) were collected in conjunction with streamflow measurements throughout the sampling period. A 10-Liter GLS Compact Composite sampler (communicating with the 4150 datalogger; Teledyne Isco, Inc., Lincoln, NE) was
APPROVED FINAL
used to collect composite water quality samples during storm events. Auto samplers were set to collect flow-weighted composite samples that characterize average concentration throughout the rising and falling limbs of the hydrograph (Isco, 2007). Baseflow and stormflow grab water quality samples were also collected to determine phosphorus loading during base flow and validate autosampler collection. All samples were analyzed for TP, SRP, Total Nitrogen (TN) and Total Suspended Solids (TSS). Loads of each nutrient were calculated with the FLUX32 Load Estimating Software version 2.11 (Table 2.1) for the tributary outlet sites. Concentrations from both years were used to determine the relationship between concentration and flow that was applied to the whole time period. All sample analysis and data processing was conducted by the Three Rivers Park District laboratory (certified by Minnesota Department of Health) following Standard Methods for Analysis of Water and Wastewater 21st Ed. (2005). Table 2.1. Loads of total nitrogen, total phosphorus, and soluble reactive phosphorus estimated with FLUX for 2007 and 2008.
Site Constituent 2007 2008 nWest Tributary Total Nitrogen 4,050 5,136 0.07 10
East Tributary Total Nitrogen 1,725 3,866 0.14 18Total Phosphorus 269 539 0.06 17Soluble Reactive Phosphorus 159 335 0.12 10
Estimated Load, lbs Coefficient of Variation
2.1 Hydrologic Results Precipitation during the two monitoring years was lower than the long-term average and included long periods of non-flowing, stagnant conditions during the summer months (Figure 2.2). Given the limited sampling period (2-years), it is unclear if this streamflow pattern is consistent across average precipitation patterns or a product of two years of below average flow. Modeling and assessment of average conditions is described in detail below (see the SWAT modeling section). The hydrographs for 2007 and 2008 illustrate how differing hydrology in the two watersheds affects streamflow (Figure 2.2). The East Tributary is a flashier system that has steeper storm recessions, possibly because the East watershed is more developed and includes more connected impervious areas than the West watershed. Both the East and West tributaries flow through wetlands above the monitoring sites, but the wetland areas in the West watershed are larger and more directly connect to the stream system. 2.2 Watershed Monitoring Results Water quality and nutrient loading varied significantly between sites and years (Table 2.1). In general, nutrient loads were highest in the western tributary and higher in 2008 than 2007. However, nutrient concentrations within each tributary were highly variable, depending on the instream flow that was present prior to a precipitation event. Under low-flow conditions, nutrient concentrations were higher than high-flow conditions, likely as a result of sediment release during anoxic conditions. However, despite high concentrations, the total nutrient load associated with low flow is relatively small compared with high flow events.
APPROVED FINAL
0
5
10
15
20
Apr May Jun Jul Aug Sep Oct Nov
Str
eam
flow
,cf
s
0
5
10
15
20
Apr May Jun Jul Aug Sep Oct Nov
Str
eam
flow
,cf
s0
5
10
15
20
Apr May Jun Jul Aug Sep Oct Nov
Str
eam
flow
,cf
s
0
5
10
15
20
Apr May Jun Jul Aug Sep Oct Nov
Str
eam
flow
,cf
s
0
5
10
15
20
Apr May Jun Jul Aug Sep Oct Nov
Str
eam
flow
,cf
s
WestTributary
EastTributary
EastTributary -Upstream
2007 2008
Figure 2.2. Daily mean streamflow for the East and West Tributaries in 2007 and 2008.
APPROVED FINAL
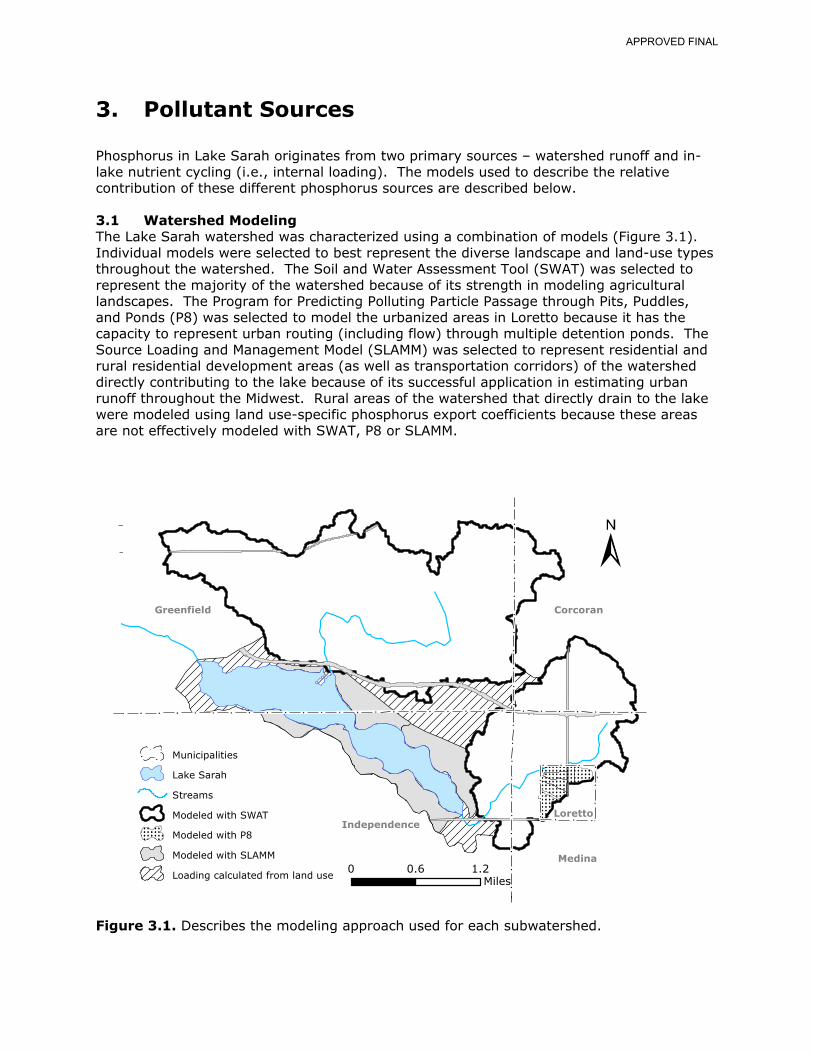
3. Pollutant Sources Phosphorus in Lake Sarah originates from two primary sources – watershed runoff and in-lake nutrient cycling (i.e., internal loading). The models used to describe the relative contribution of these different phosphorus sources are described below. 3.1 Watershed Modeling The Lake Sarah watershed was characterized using a combination of models (Figure 3.1). Individual models were selected to best represent the diverse landscape and land-use types throughout the watershed. The Soil and Water Assessment Tool (SWAT) was selected to represent the majority of the watershed because of its strength in modeling agricultural landscapes. The Program for Predicting Polluting Particle Passage through Pits, Puddles, and Ponds (P8) was selected to model the urbanized areas in Loretto because it has the capacity to represent urban routing (including flow) through multiple detention ponds. The Source Loading and Management Model (SLAMM) was selected to represent residential and rural residential development areas (as well as transportation corridors) of the watershed directly contributing to the lake because of its successful application in estimating urban runoff throughout the Midwest. Rural areas of the watershed that directly drain to the lake were modeled using land use-specific phosphorus export coefficients because these areas are not effectively modeled with SWAT, P8 or SLAMM.
Greenfield
Independence
Medina
Corcoran
Loretto
Municipalities
Lake Sarah
Streams
Modeled with SWAT
Modeled with P8
Modeled with SLAMM
Loading calculated from land use0 0.6 1.2
Miles
Figure 3.1. Describes the modeling approach used for each subwatershed.
APPROVED FINAL
3.1.1 Watershed Model Inputs All of the watershed models used in this study are populated by inputs for both land use and precipitation. As described above, each watershed model was selected to represent specific land use types, and the detail of the land uses represented in the individual models is described in the subsequent sections. All watershed models were developed using precipitation inputs from a 10-year period (1999-2008). Over the 10-year precipitation record, data from 2000 and 2002 were excluded because they represented environmental extremes (i.e., years of abnormally high and low precipitation). Within the 10-year record, precipitation data from 2007 and 2008 were used for calibration purposes in all models (because this time period corresponds with in-stream monitoring efforts). Phosphorus loads used to calibrate the in-lake response model were generated by running the watershed models over the 10-year precipitation record and averaging the outputs. All precipitation data was obtained from the Rockford, MN cooperative weather observer station (COOP ID 217020). Any data gaps at the Rockford station were filled with corresponding precipitation records from the nearest cooperative observer station (generally in Delano, Mound and Chanhassen, MN).
3.1.2 P8 Model A P8 model was used to estimate the pollutant loading from the urban areas within the Lake Sarah watershed (Figure 3.2) and the outputs were used to calibrate the Hydrologic Response Units (HRUs) that drain urban areas in the SWAT model (see the SWAT section below for more detail). P8 has been used to model urban areas (i.e., residential and commercial) to design and evaluate runoff treatment schemes for existing or proposed urban developments in a number of TMDL efforts throughout the region (e.g., Bonestroo, 2009). P8 estimates watershed phosphorus loading using particle concentrations in the runoff. Particle loads from pervious and impervious areas are computed using a sediment rating model and particle accumulation and washoff equations – which are derived from the EPA Stormwater Management Model (SWMM; Huber and Kikinson, 1988). The water quality components of the model are based upon weight distributions across particle classes. A default file (NURP50.PAR) for particle classes and water quality components was used to estimate watershed loads of total phosphorus, total nitrogen, and total suspended solids. Watershed runoff and loading in the model is transported directly to downstream devices. Continuous water-balance and mass-balance calculations are performed to determine nutrient removal efficiencies for each device. In the Lake Sarah watershed, P8 was specifically used to evaluate the urban and residential drainage areas within the City of Loretto. The P8 model was developed for the City of Loretto as an interconnected, one-dimensional network of watersheds and treatment devices (Figure 3.3). Seven subwatersheds were defined in the model as the primary sources contributing to runoff and particle transport. The pervious and impervious areas for each subwatershed were digitized from aerial photography images and defined within the model (Figure 3.3; Table 3.1). Curve numbers (CN) for the pervious and impervious areas were estimated using the TR-55 Curve Number technique (USDA-NRCS, 2004). In P8, watershed runoff is routed to specified devices such as storm sewer pipes, open channels, and detention ponds to model their effect on water quality. The City of Loretto drainage area included four treatment devices - three detention ponds and one wetland. The morphology of each treatment device was characterized using development plans supplied by the City of Loretto and were incorporated into the P8 model (Table 3.2). There were several pipes and open channels also identified as devices within the model; however these devices were assumed to have negligible particle removal efficiencies.
APPROVED FINAL
Figure 3.2. Subwatersheds in Loretto characterized using P8. Continuous hourly precipitation is required in P8 to simulate runoff from the drainage area. Runoff from pervious areas is computed using the Soil Conservation Service (SCS) curve number technique (USDA-NRCS, 1964). Antecedent moisture conditions are adjusted based on 5-day antecedent precipitation and season. Runoff from impervious areas starts after the cumulative storm rainfall exceeds the specified depression storage. A precipitation file was developed and executed to simulate runoff conditions in 2007 and 2008. The P8 model estimated run-off volumes, nutrient concentrations, and nutrient loadings using 2007 and 2008 precipitation data. These water volumes and phosphorus export components derived from the P8 model were used to further verify and validate the calibrated watershed-wide SWAT model (see the SWAT modeling section for greater detail). The calibrated SWAT model was used to track the portion of phosphorus loading conveyed to Lake Sarah from the City of Loretto for the 10-year average precipitation conditions. Table 3.1. Areas and curve numbers for the Loretto subwatersheds.
TotalWatershed Acres CN Acres CN AcreageLoretto A 7.7 80 6.2 98 13.9Loretto B 3.4 80 3.5 98 6.9Loretto C 12.9 80 3.8 98 16.7Loretto Industrial North 4.4 80 7.0 98 11.4Loretto Industrial South 6.7 80 6.6 98 13.3Ballfield North 5.9 80 2.1 98 8.0Ballfield South 6.4 80 1.6 98 8.0
Pervious Impervious
APPROVED FINAL
Table 3.2. Morphological characteristics of the four nutrient removal devices in the P8 model of Loretto.
Bottom Area Infiltration(acres) Area (ac) Volume (ac-ft) Area (ac) Volume (ac-ft) (in/hr)
Pond A 0.70 0.23 1.15 0.38 2.66Pond B 0.45 0.83 3.32 1.03 6.18Pond C 0.06 0.41 2.46 0.76 6.08Wetland 1.00 1.50 6.00 3.00 12.00 0.06
Permanent Pool Flood PoolDevice
Loretto Flow Diagram
Loretto A
Pond A
Ballfield NorthLoretto B
Ballfield South Industrial Area North
Pond B
Pond C
Loretto C
Industrial Area South
Pip
eC
In
Pip
eA
InPip
eB
Pip
eA
Out
Pipe B2
Pipe C Out
Chan
nel
Pipe B1
Pip
eE
InPi
pe
E
Wetland Pipe E Out
Pipe D
Figure 3.3. Conceptual flow diagram for the P8 model of Loretto.
APPROVED FINAL
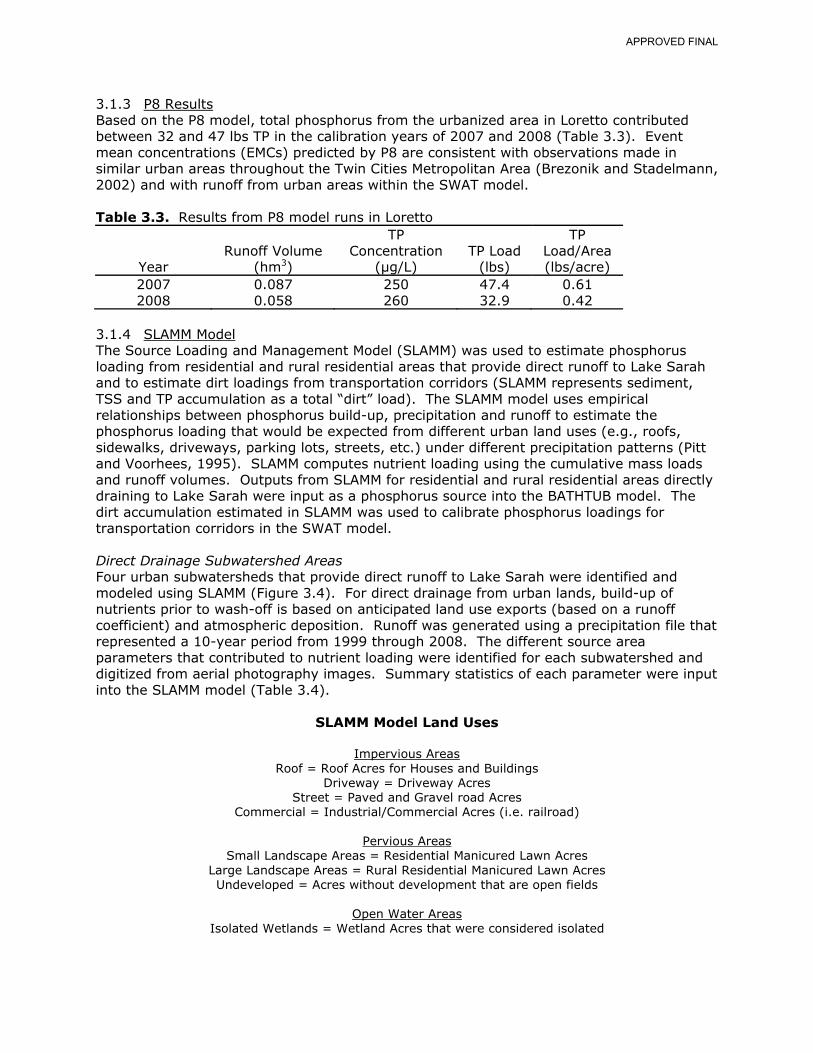
3.1.3 P8 Results Based on the P8 model, total phosphorus from the urbanized area in Loretto contributed between 32 and 47 lbs TP in the calibration years of 2007 and 2008 (Table 3.3). Event mean concentrations (EMCs) predicted by P8 are consistent with observations made in similar urban areas throughout the Twin Cities Metropolitan Area (Brezonik and Stadelmann, 2002) and with runoff from urban areas within the SWAT model. Table 3.3. Results from P8 model runs in Loretto
3.1.4 SLAMM Model The Source Loading and Management Model (SLAMM) was used to estimate phosphorus loading from residential and rural residential areas that provide direct runoff to Lake Sarah and to estimate dirt loadings from transportation corridors (SLAMM represents sediment, TSS and TP accumulation as a total “dirt” load). The SLAMM model uses empirical relationships between phosphorus build-up, precipitation and runoff to estimate the phosphorus loading that would be expected from different urban land uses (e.g., roofs, sidewalks, driveways, parking lots, streets, etc.) under different precipitation patterns (Pitt and Voorhees, 1995). SLAMM computes nutrient loading using the cumulative mass loads and runoff volumes. Outputs from SLAMM for residential and rural residential areas directly draining to Lake Sarah were input as a phosphorus source into the BATHTUB model. The dirt accumulation estimated in SLAMM was used to calibrate phosphorus loadings for transportation corridors in the SWAT model. Direct Drainage Subwatershed Areas Four urban subwatersheds that provide direct runoff to Lake Sarah were identified and modeled using SLAMM (Figure 3.4). For direct drainage from urban lands, build-up of nutrients prior to wash-off is based on anticipated land use exports (based on a runoff coefficient) and atmospheric deposition. Runoff was generated using a precipitation file that represented a 10-year period from 1999 through 2008. The different source area parameters that contributed to nutrient loading were identified for each subwatershed and digitized from aerial photography images. Summary statistics of each parameter were input into the SLAMM model (Table 3.4).
SLAMM Model Land Uses
Impervious Areas Roof = Roof Acres for Houses and Buildings
Driveway = Driveway Acres Street = Paved and Gravel road Acres
Open Water Isolated Wetlands 2.29 16.16 19.48 50.69Total 15.14 107.86 141.51 184.19
Sub-watershed (acres)
Major Roadways SLAMM was used to estimate dirt accumulation and phosphorus loading from the major county and state roadways. There are three County Roads (CR11, CR19, and CR50) and one state Highway (Hwy 55) within the Lake Sarah watershed (Figure 3.5). SLAMM calculates an initial roadway dirt loading (lbs/mile) based upon roadway surface area (impervious and right of way), roadway length, and average daily traffic volume. Inputs for impervious surface area and roadway length for the County Roads and State Highways were digitized from aerial photography images and road right-of-way area was calculated based on information provided by the Minnesota Department of Transportation (Mn/DOT; Table 3.5). Average daily traffic volumes for each roadway were determined from the most recent published transportation information from Mn/DOT and Hennepin County (2008; Table 3.5).
APPROVED FINAL
Roadway dirt loading was based on an accumulation equation for a time period of 14 days and represents the maximum dirt load that can wash off a road during a rainstorm event. SLAMM provides an estimate of dirt loading based on traffic volume that is not explicitly accounted for within the SWAT model. The SLAMM dirt accumulation and loading estimate was used to calibrate phosphorus runoff from major roadways in the Lake Sarah SWAT model. Dirt loads are translated into phosphorus loads by assuming a relationship of 150 mg P per kg of the total dirt mass and a linear build-up of dirt over the 14-day accumulation period (e.g., if 7-days elapsed between rain events, 50% of the maximum dirt load would have accumulated, of which 150 mg P/kg dirt would runoff as phosphorus). Phosphorus loads from transportation corridors were routed through filter strips (to simulate nutrient removal of roadway BMPs) and the downstream drainage network. Nutrient removal in filter strips (~18%) was based on SLAMM model estimates of BMP removal efficiency and corresponding literature values. SWAT was used to estimate the load allocation and load reduction goals for Mn/DOT and Hennepin County Department of Transportation. Table 3.5. County Road and State Highway inputs into the SLAMM model.
Impervious Pervious Roadway Length Average Daily Traffic
Figure 3.5. Major roadways within the Lake Sarah watershed.
APPROVED FINAL
SLAMM Results Estimated total phosphorus runoff from directly draining urban subwatersheds ranged from 6.7 lbs TP/yr to 61.2 lbs TP/yr (Table 3.6). Estimated TP loads from transportation corridors ranged from 21.3 lbs/yr to 45.1 lbs/yr (Table 3.7). SWAT was used to simulate phosphorus loading from the transportation corridors to Lake Sarah by routing nutrient loads and runoff through road ditches, downstream channels and wetlands throughout the watershed. Phosphorus loads from transportation corridors ranged between 0.53 to 0.74 lbs TP/acre/yr (summarized as a part of Table 3.10 below). Total phosphorus loads from both urban subwatersheds and transportation corridors are similar to values reported by Brezonik and Stadelmann (2002), who observed TP EMCs of between 320 μg/L and 570 μg/L throughout the Twin Cities Metro Area. Table 3.6. SLAMM model estimates of run-off volume and phosphorus load from subwatersheds providing direct drainage to Lake Sarah.
Runoff Volume TP Concentration TP Load Area P-ExportSub-Watershed (hm3) (µg/L) (lbs) (Acres) (lbs/ac/yr)Northwest Direct 0.016 194 6.7 15.14 0.44
North Direct 0.069 325 49.5 107.86 0.46Northeast Direct 0.082 344 62.2 141.51 0.44
South Direct 0.072 329 52.3 184.19 0.28 Table 3.7. Estimates of run-off volume, dirt accumulation and phosphorus loading for major roadways within the Lake Sarah watershed.
County Road 50 3275 1.7 112 County Road 11 4800 1.0 93 County Road 19 5150 1.3 128
21.3
State Highway 55 16200 3.7 1011 45.1
*Represents a maximum dirt accumulation over the 14-day build up period. 3.1.5 SWAT Model The Soil and Water Assessment Tool (SWAT) was used to model runoff from the agricultural subwatersheds draining to Lake Sarah (Figure 3.1). SWAT is a partially physically-based and partially empirically-based watershed model (Neitsch et al., 2005) developed at the U.S. Department of Agriculture Agricultural Research Service (SWAT is currently supported by the Blacklands Research and Extension Center at Texas A&M University). SWAT runs on a daily time step and is intended to model large agricultural watersheds. It has been calibrated and validated to many watersheds in the United States and around the world (Gassman, 2007). SWAT has progressed through several development releases. The release selected for this project was ArcSWAT 2.3.4 for ArcGIS 9.3.1. This interface release was run with an updated version of the base 2.0.0 executable code release. The 2.0.0 executable file was updated to eliminate a code anomaly which affected phosphorus settling in stream channels during low flow conditions (the unmodified version overpredicted instream phosphorus settling). All SWAT modeling and field assessments were conducted by Three Rivers Park District staff. Calibration and validation of the updated model is described below.
APPROVED FINAL
SWAT simulates the hydrologic cycle accounting for the following processes: precipitation, overland runoff, infiltration, percolation through one or more soil layers, evaporation, plant transpiration, interaction with the shallow aquifer, and loss to a deep aquifer (Arnold et al., 1998). Water is delivered to the stream as overland runoff, lateral flow, and groundwater flow and is routed through defined stream channels to the watershed outlet. SWAT also models off-channel, surface-water bodies such as wetlands and ponds and on-channel bodies such as reservoirs. Sediment export from uplands is calculated in SWAT with the Modified Universal Soil Loss Equation (MUSLE; Williams, 1975). While the original Universal Soil Loss Equation (USLE) predicts annual erosion on a field, the MUSLE includes a peak flow component that is used to determine the amount of eroded sediment reaching the stream from a uniform land area during a single storm event. Factors that control sediment export predicted by the MUSLE are surface runoff, peak flow, soil erodibility, biomass and residue present, cropping practices, slope length, and percentage of coarse fragments (i.e., stones) of soil. Simulation of phosphorus and nitrogen cycles in SWAT uses inputs of inorganic fertilizer, organic fertilizer, plant residue, and, for nitrogen, rainwater. Nitrogen is partitioned between five mineral and organic pools within the soil and is transferred between and out of these pools through export, decay, mineralization, nitrification and denitrification, volatilization, and plant uptake. Similarly, SWAT models five soil phosphorus pools, with transfer between and out of these pools through export, decay, mineralization, immobilization and plant uptake. Nitrogen and phosphorus are exported via overland runoff, lateral flow, and groundwater flow to the stream channel, though they are only tracked through overland runoff and lateral flow. In the stream reaches, in-stream nutrient processes can be simulated with the imbedded QUAL2E submodel, or the nutrients can be delivered to the reach outlet unprocessed. Given the channelized nature of most streams and that the primary driver of nutrient dynamics throughout the Lake Sarah watershed is wetland processing (based on an assessment of monitoring data), in-stream process subroutines were not utilized in this analysis. Plant growth is modeled directly in SWAT based on simplified crop growth equations from the Erosion Productivity-Impact Calculator (EPIC) with controlling inputs including temperature, solar radiation, nutrient availability, and water. SWAT allows input of specific management rotations for agricultural land, providing opportunities for modeling alternative scenarios to guide management decisions. Each day, the crop biomass, weight of residue present, and soil moisture are recalculated for each hydrologic response unit (HRU; the basic model unit that includes a unique combination of soil and land use). Agricultural crops can be rotated by year, and crops that continue to grow over several years, such as alfalfa, can be represented in the model. SWAT Spatial Inputs Spatial inputs for the Lake Sarah SWAT model included digital elevation, land use, and soils. All data for the Lake Sarah watershed were projected into the Universal Transverse Mercator Zone 15, with the North American Datum, 1983. The Lake Sarah watershed and subbasins were delineated from the National Elevation Dataset 10-meter gridded digital elevation model (DEM). This delineation was updated with water routing information from the Loretto department of public works and field observations. Soil Survey Geographic (SSURGO) soil data were downloaded from the US Department of Agriculture-Natural Resources Conservation Service (USDA-NRCS) Soil Data Mart website. These data are organized by county and are the most detailed available for the watershed. The SSURGO dataset included 61 soils in the Lake Sarah watershed and was overlain with the municipality to allow analysis of the resulting HRUs by town. Land use input for the Lake
APPROVED FINAL
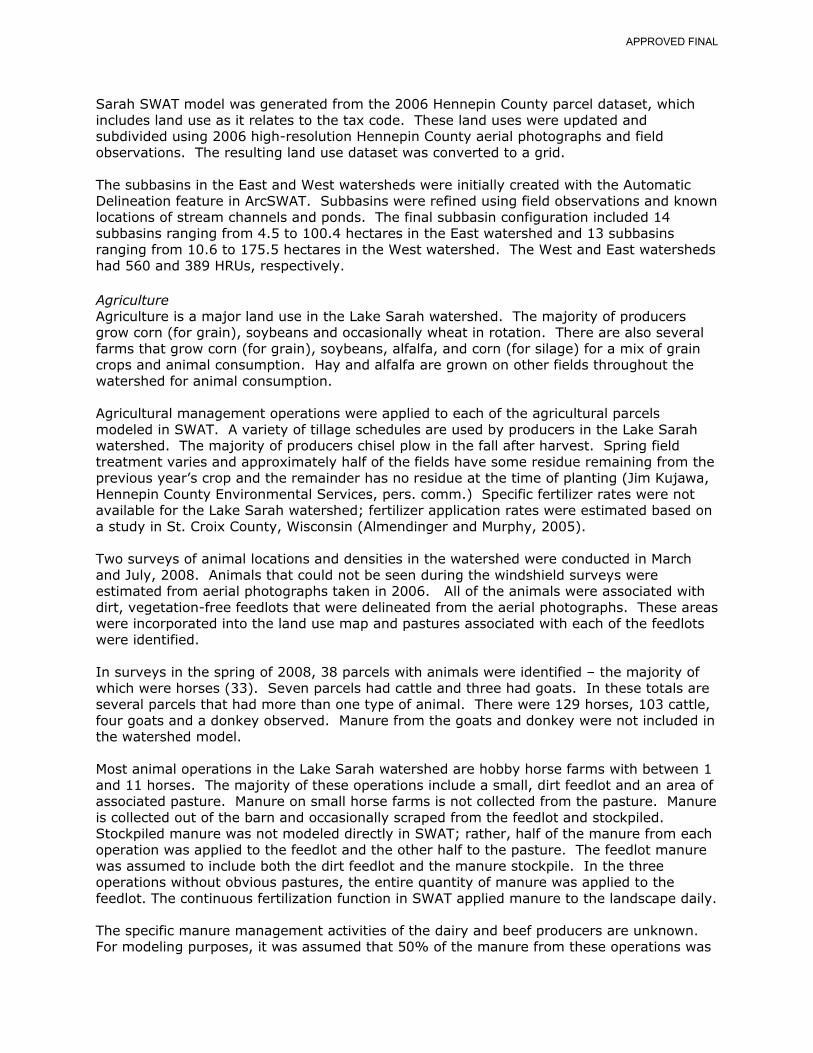
Sarah SWAT model was generated from the 2006 Hennepin County parcel dataset, which includes land use as it relates to the tax code. These land uses were updated and subdivided using 2006 high-resolution Hennepin County aerial photographs and field observations. The resulting land use dataset was converted to a grid. The subbasins in the East and West watersheds were initially created with the Automatic Delineation feature in ArcSWAT. Subbasins were refined using field observations and known locations of stream channels and ponds. The final subbasin configuration included 14 subbasins ranging from 4.5 to 100.4 hectares in the East watershed and 13 subbasins ranging from 10.6 to 175.5 hectares in the West watershed. The West and East watersheds had 560 and 389 HRUs, respectively. Agriculture Agriculture is a major land use in the Lake Sarah watershed. The majority of producers grow corn (for grain), soybeans and occasionally wheat in rotation. There are also several farms that grow corn (for grain), soybeans, alfalfa, and corn (for silage) for a mix of grain crops and animal consumption. Hay and alfalfa are grown on other fields throughout the watershed for animal consumption. Agricultural management operations were applied to each of the agricultural parcels modeled in SWAT. A variety of tillage schedules are used by producers in the Lake Sarah watershed. The majority of producers chisel plow in the fall after harvest. Spring field treatment varies and approximately half of the fields have some residue remaining from the previous year’s crop and the remainder has no residue at the time of planting (Jim Kujawa, Hennepin County Environmental Services, pers. comm.) Specific fertilizer rates were not available for the Lake Sarah watershed; fertilizer application rates were estimated based on a study in St. Croix County, Wisconsin (Almendinger and Murphy, 2005). Two surveys of animal locations and densities in the watershed were conducted in March and July, 2008. Animals that could not be seen during the windshield surveys were estimated from aerial photographs taken in 2006. All of the animals were associated with dirt, vegetation-free feedlots that were delineated from the aerial photographs. These areas were incorporated into the land use map and pastures associated with each of the feedlots were identified. In surveys in the spring of 2008, 38 parcels with animals were identified – the majority of which were horses (33). Seven parcels had cattle and three had goats. In these totals are several parcels that had more than one type of animal. There were 129 horses, 103 cattle, four goats and a donkey observed. Manure from the goats and donkey were not included in the watershed model. Most animal operations in the Lake Sarah watershed are hobby horse farms with between 1 and 11 horses. The majority of these operations include a small, dirt feedlot and an area of associated pasture. Manure on small horse farms is not collected from the pasture. Manure is collected out of the barn and occasionally scraped from the feedlot and stockpiled. Stockpiled manure was not modeled directly in SWAT; rather, half of the manure from each operation was applied to the feedlot and the other half to the pasture. The feedlot manure was assumed to include both the dirt feedlot and the manure stockpile. In the three operations without obvious pastures, the entire quantity of manure was applied to the feedlot. The continuous fertilization function in SWAT applied manure to the landscape daily. The specific manure management activities of the dairy and beef producers are unknown. For modeling purposes, it was assumed that 50% of the manure from these operations was
APPROVED FINAL
collected, based on a herd size of fewer than 25 animals (Powell et al., 2005). The collected manure was applied to nearby agricultural fields. Solid manure and bedding application to agricultural fields was observed in the watershed from February to April, 2009. The remaining, uncollected manure was assumed to remain – half to each the pasture and the feedlot associated with the operation. Residential and Urban Land Uses A variety of urban and residential land uses are present in the Lake Sarah watershed. The percentage of impervious area in each of the land uses guided how the land use type was represented in the SWAT model. SWAT is better structured to represent agricultural landscapes, so the P8 model of Loretto and the SLAMM model of the roadways and urban areas were developed in parallel. Outputs from P8 were used to provide a calibration check for the areas with impervious land within the SWAT model. Dirt loads (and the corresponding phosphorus) from SLAMM were used to calibrate TP runoff rates for road surfaces in SWAT. Phosphorus loads were routed through grassed filter strips, which were parameterized according to the removal efficiencies reported in the scientific literature and predicted by SLAMM (~18%) and ultimately through the stream and wetland drainage network. SLAMM outputs for residential areas were used as direct inputs to BATHTUB for the residential areas directly draining to the lake. For more detail regarding modeling of the Residential and Urban land uses see the SWAT and SLAMM model sections above. Wetlands Wetlands exert a large influence in the Lake Sarah watershed, detaining water, and settling out nutrients. However, wetland cannot be explicitly modeled in SWAT, instead, on-channel wetlands were modeled as “reservoirs” in SWAT. Each “reservoir” was assigned to a subbasin and individually parameterized according to the normal surface area/volume (which corresponds to the bankfull conditions) and the emergency surface area/volume (which correspond with maximum flooded conditions) to match the monitored hydrograph and water quality data. Each wetland was parameterized with a number of days to return to the normal pool volume after exceeding the emergency pool volume. Rural Non-tributary Areas Approximately 10% of the Lake Sarah watershed represents rural land uses (i.e., non-urban/residential) that directly drain to the lake. Because this area of the watershed is not confined to a discrete tributary and does not capture runoff from urban and/or residential land uses, it is not effectively modeled using SWAT, P8 or SLAMM. Instead, these rural non-tributary areas of the watershed were modeled using land use export coefficients and average wetland removal efficiency estimates derived from the SWAT model. Total phosphorus loads from rural, non-tributary areas (Figure 3.1) were modeled using land use export coefficients and wetland removal efficiencies predicted by corresponding land use types in the SWAT model. First, the area in each land use was summed. Then, the average phosphorus export values from SWAT were applied by land use to these areas to develop a total annual phosphorus load. Since these areas are connected to the lake via diffuse wetland complexes, the total average annual phosphorus load was reduced by 20% to estimate wetland removal – based on observed removal efficiencies throughout the remainder of the watershed. Water yield from the area was calculated proportionally to the 10-year average water yield from the West Tributary. The resulting average water yield (0.3 hm3) and phosphorus concentration (272.2 μg/L) were included as direct inputs to the BATHTUB model (summarized in Table 3.11 below).
APPROVED FINAL
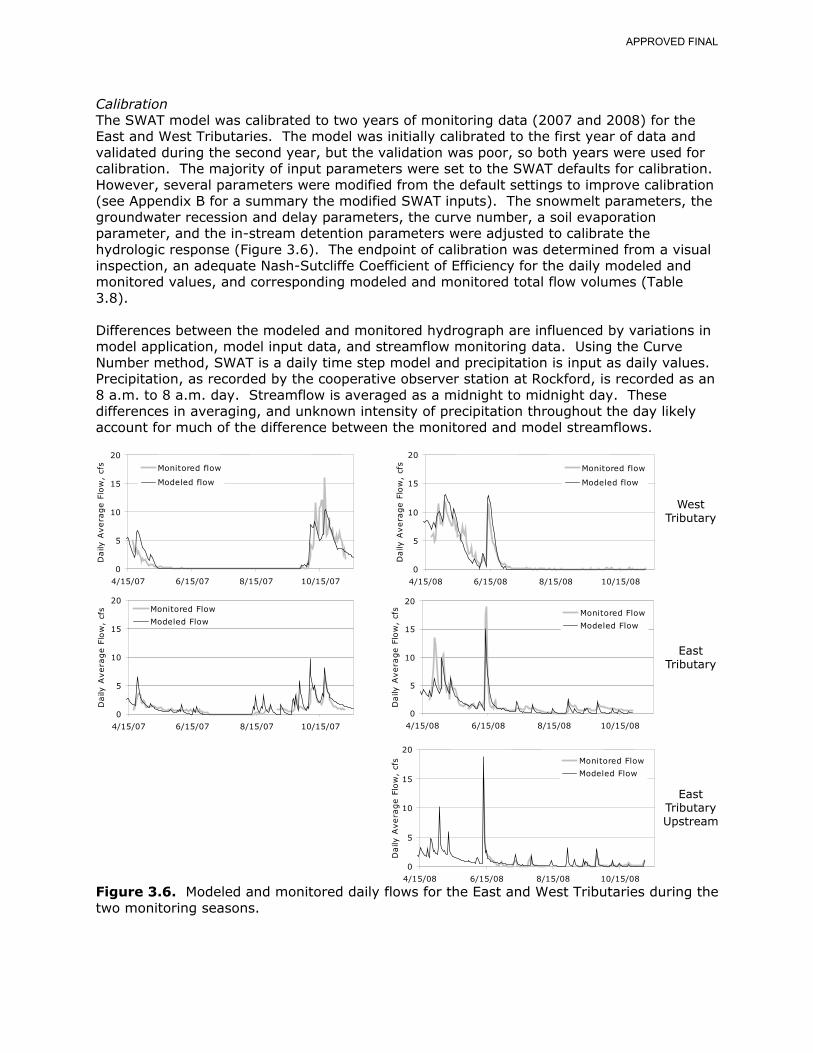
Calibration The SWAT model was calibrated to two years of monitoring data (2007 and 2008) for the East and West Tributaries. The model was initially calibrated to the first year of data and validated during the second year, but the validation was poor, so both years were used for calibration. The majority of input parameters were set to the SWAT defaults for calibration. However, several parameters were modified from the default settings to improve calibration (see Appendix B for a summary the modified SWAT inputs). The snowmelt parameters, the groundwater recession and delay parameters, the curve number, a soil evaporation parameter, and the in-stream detention parameters were adjusted to calibrate the hydrologic response (Figure 3.6). The endpoint of calibration was determined from a visual inspection, an adequate Nash-Sutcliffe Coefficient of Efficiency for the daily modeled and monitored values, and corresponding modeled and monitored total flow volumes (Table 3.8). Differences between the modeled and monitored hydrograph are influenced by variations in model application, model input data, and streamflow monitoring data. Using the Curve Number method, SWAT is a daily time step model and precipitation is input as daily values. Precipitation, as recorded by the cooperative observer station at Rockford, is recorded as an 8 a.m. to 8 a.m. day. Streamflow is averaged as a midnight to midnight day. These differences in averaging, and unknown intensity of precipitation throughout the day likely account for much of the difference between the monitored and model streamflows.
0
5
10
15
20
4/15/07 6/15/07 8/15/07 10/15/07
Daily
Avera
ge
Flow
,cf
s Monitored flow
Modeled flow
0
5
10
15
20
4/15/08 6/15/08 8/15/08 10/15/08
Daily
Avera
ge
Flow
,cf
s Monitored flow
Modeled flow
0
5
10
15
20
4/15/07 6/15/07 8/15/07 10/15/07
Daily
Avera
ge
Flow
,cf
s Monitored Flow
Modeled Flow
0
5
10
15
20
4/15/08 6/15/08 8/15/08 10/15/08
Daily
Avera
ge
Flow
,cf
s Monitored Flow
Modeled Flow
0
5
10
15
20
4/15/08 6/15/08 8/15/08 10/15/08
Daily
Avera
ge
Flow
,cf
s Monitored Flow
Modeled Flow
WestTributary
EastTributary
EastTributaryUpstream
Figure 3.6. Modeled and monitored daily flows for the East and West Tributaries during the two monitoring seasons.
APPROVED FINAL
The SWAT model(s) for the two tributaries were calibrated to monitored phosphorus concentrations (Figure 3.7). Calibration parameters that affect landscape phosphorus export were set to the same values for both tributaries. The USLE P_factor was lowered to reduce landscape phosphorus loads to expected quantities. Other parameters altered were the phosphorus soil partitioning coefficient and the width of vegetated field edges. The phosphorus sorption coefficient and the soil labile phosphorus concentration were calculated based on soil parameters in the Lake Sarah watershed (Vadas and White, unpublished). The phosphorus concentration in the groundwater was set to 50 μg/L – which corresponds to observations of regional surficial Quaternary groundwater reported by MPCA (1999). Finally, wetlands were assumed to settle phosphorus from August to May and release phosphorus in June and July – based on inspection of the monitoring data. After phosphorus concentrations were calibrated (Figure 3.7), daily and annual loads from SWAT and FLUX were compared for the two watersheds (Table 3.8). Total phosphorus concentrations for the two tributaries corresponded well (R2 = 0.6 or greater). The West Tributary FLUX and SWAT phosphorus annual loads are closer than the East Tributary annual loads. Storm flows during 2007 were underestimated in the East Tributary model, while storm events during 2008 were overestimated in the East Tributary model, leading to the overestimate of total phosphorus load in 2007 and the underestimate of the total phosphorus load in 2008 (Table 3.9). Final land use phosphorus exports are consistent with corresponding literature estimates (Table 3.10). Table 3.8. Comparisons between modeled and monitored flow volumes for calibration. All reported values correspond to the monitoring period in 2007 and 2008 (Figure 3.6).
Site Period Monitored Modeled % DifferenceWest Tributary 2007 0.71 0.70 -1% 0.75
Total Flow, hm3 Nash-Sutcliffe Coefficient of Efficiency
y = 0.99xR2 = 0.64
0
100
200
300
400
500
600
700
800
0 200 400 600 800
Monitored P, ppb
Modele
dP,
ppb
y = 0.96xR2 = 0.80
0
100
200
300
400
500
600
700
800
0 200 400 600 800Monitored P, ppb
Modele
dP,
ppb
East Tributary West Tributary
Figure 3.7. Monitored and modeled phosphorus concentrations for the East and West watersheds during 2007 and 2008.
APPROVED FINAL
Table 3.9. Total phosphorus loads modeled with SWAT and estimated with FLUX for the 2007 and 2008 monitoring periods.
Site Period FLUX SWAT % DifferenceWest Tributary 2007 414 356 -14%
2008 611 419 -31% Total 1,026 775 -24%
East Tributary 2007 268 277 3% 2008 539 409 -24%
Total 807 686 -15%
Total Phosphorus, lbs
Table 3.10. Average annual phosphorus exports from different land use types in the SWAT model. Reported values represent the range of averages predicted by SWAT across different soil types and topography throughout the Lake Sarah watershed.
DevelopedLow and medium density residential 0.61 - 0.94Commercial and industrial 0.82 - 0.96County and state highways 0.53 - 0.74
UndevelopedForest 0.04 - 0.05Wetland 0.15 - 0.19
3.1.6 Estimating the Cumulative Watershed Load Total phosphorus loads from the individual land use models were combined to estimate an average cumulative watershed load, based on 10-year average precipitation conditions. The average annual watershed load (2108 lb/yr) was entered into the BATHTUB model as an annual flow and concentration for each drainage area (Table 3.11). Table 3.11. Average annual total phosphorus load from the Lake Sarah watershed (developed using the calibrated watershed models and 10-yr precipitation file).
Area Land Use Flow TP Conc.
(Acres) Model (hm3/yr) (ug/L) TP Load (lbs)
West 2378.9 SWAT 1.46 302.9 975
East 1097 SWAT/P8 1.03 305.5 694
Northeast Direct 141.5 SLAMM 0.079 347 60
North Direct 107.9 SLAMM 0.067 329.6 49
Northwest Direct 15.1 SLAMM 0.015 201.3 7
South Direct 184.2 SLAMM 0.07 330.8 51
Middle Direct 325.8 Export Coeff. 0.3 272.2 180
Other Direct 203.6 Export Coeff. 0.2 208.9 92
Total 4454 3.221 2108
Subwatershed
Average Annual
APPROVED FINAL
Qualitative Model Uncertainty There are four general areas of uncertainty in the watershed model estimates: 1) snowmelt; 2) year-to-year variations in runoff; 3) the influence of wetland and channel processes; and 4) contributions of the non-tributary areas. SWAT cannot explicitly model nutrient dynamics in wetland systems based on physical characteristics. However, SWAT does provide the capability to model phosphorus release/sequestration based on temporal patterns, so wetland nutrient dynamics were modeled based on monthly patterns observed in the monitoring data. Based on monitoring data, we hypothesized wetlands in the Lake Sarah watershed acted as phosphorus sinks during most of the year and were phosphorus sources during periods when water stagnated and anoxia caused the release of phosphorus from the sediments. The monitored and modeled phosphorus concentrations correspond well throughout the monitoring period (Figure 3.7), but these relationships should be confirmed in future monitoring efforts.
The snowmelt period (February to the middle of April) was not directly sampled in the Lake Sarah watershed in either of the monitoring years. This is a period of high flow, but the unpredictable period of thawing and refreezing often compromise field sampling equipment. These periods were modeled with SWAT by modifying snowmelt parameters to correspond with the flow régimes throughout the monitoring period. Studies in two adjacent watersheds have demonstrated that the initial streamflow after snowmelt has very high total phosphorus concentrations and future streamflow monitoring in the Lake Sarah system should include the period of snowmelt.
The two monitoring years, 2007 and 2008, both had lower than average total precipitation. Future monitoring efforts should attempt to capture runoff during high precipitation years to validate the model calibration throughout a wider range of environmental conditions. Additionally, the monitoring data was based primarily on samples that were collected during stormflows; and as a result, a limited number of baseflow samples were included in the analysis. The proportionally higher number of stormflow samples likely result in an overestimation of annual phosphorus loads using FLUX. 3.2 Internal Loading Internal loading in lakes refers to the re-cycling and re-suspension of in-lake phosphorus into the water column. There are two primary sources of internal loading in Lake Sarah – direct sediment release and curlyleaf pondweed senescence (i.e., die off). 3.2.1 Sediment Release Due to Hypolimnetic Anoxia Water at the sediment-water interface remains hypoxic/anoxic (periods where dissolved oxygen concentration are at or near zero) for a significant portion of the growing season (Figure 3.8). Under low oxygen conditions, sediments release phosphorus, which accumulates in the deep lake waters, or hypolimnion (Figure 3.9). Phosphorus released from the sediments is mixed throughout the water column as stratification changes throughout the growing season (as depicted by the sudden increase in TP concentration following fall turnover in Figures 3.10 and 3.11). Typically, wind mixing and temperature changes are the primary mechanisms that alter stratification patterns within a lake (based on fishery assessments and visual observation, benthic fish do not appear to be a significant source of internal loading). Increased phosphorus release to surface waters often results in more frequent and intense algal blooms and reduced water clarity (Figure 1.7).
APPROVED FINAL
Lake Sarah Dissolved Oxygen Profiles 20070
2
4
6
8
10
12
14
16
180 2 4 6 8 10 12 14
Dissolved Oxygen (mg/L)
Dep
th (m
)
AprilMayJuneJulyAugustSeptemberOctober
Figure 3.8. Lake Sarah hypolimnetic dissolved oxygen profile in 2007.
Lake Sarah Hypolimnion
0
200
400
600
800
1000
1200
1400
04/2
4/07
05/0
8/07
05/2
2/07
06/0
5/07
06/1
9/07
07/0
3/07
07/1
7/07
07/3
1/07
08/1
4/07
08/2
8/07
09/1
1/07
09/2
5/07
10/0
9/07
Phos
phor
us (µ
g/L)
Total Phosphorus
Soluble Reactive Phosphorus
Figure 3.9. Lake Sarah hypolimnetic phosphorus concentration in 2007.
APPROVED FINAL
Calculating Potential Internal Phosphorus Load from Sediment Release Potential internal loading of phosphorus from sediment release in Lake Sarah was calculated using methods described by Nürnberg (1985 and 1987). The Nürnberg equation estimates internal phosphorus load by multiplying an internal loading rate by the lake area (Equation 1). Internal loading rate (Equation 2) is calculated by multiplying the sediment release rates (RR; calculation of sediment release rates is described below) by an anoxic factor (AF). The anoxic factor represents the number of days that a sediment area, equal to the whole-lake surface area, is overlain by anoxic water (< 1 mg O2/L). The number of days of anoxia for Lake Sarah (120) was based on dissolved oxygen profile data collected in 2007. The anoxic hypolimnetic area was quantified using the MNDNR bathymetric contour maps for Lake Sarah. Using the Nürnberg equation, the internal phosphorus load for Lake Sarah was estimated to be 2763 pounds (Table 3.12).
Calculating Sediment Release Rates Sediment release rates for Lake Sarah were estimated using a Simple TP Model (LimnoTech 2009). The Simple TP Model uses mass balance calculations to track the estimated epilimnetic and hypolimnetic concentrations of total phosphorus on a time series basis. The initial model set-up requires constant inputs that define the morphological characteristics of the lake (Table 3.13). The model also requires the input of time series data that defines whether the lake is stratified (true or false), the watershed inflow and nutrient concentration, and the observed hypolimnetic and epilimnetic phosphorus concentrations. Mixing is specified on a daily basis as either full mixing within each layer, or complete mixing between layers.
APPROVED FINAL
Table 3.13. Simple TP model user-specified constants User-Specified Constants
Description Value Units Areal hypolimnetic oxygen demand 1.03 grams/(m2 day)
Initial Conditions: TP 0.06 grams/m3 Initial Conditions: Date 12/31/2006 date
The Simple TP model uses a series of algorithms to calculate the mass balance within and between each segment layer (epilimnion and hypolimnion) based on the in-lake stratification conditions. The model is calibrated to observed hypolimnetic and epilimnetic phosphorus concentrations by adjusting thermocline dispersion, settling velocity, and anoxic total phosphorus sediment flux. The model estimated hypolimnetic and epilimnetic phosphorus concentrations that were similar to observed conditions in 2008 (Figures 3.10 and 3.11). Based on the TP Model predictions, the anoxic total phosphorus sediment flux value that corresponded to in-lake conditions was 9 mg/m2/day; this value was used as the sediment release rate within the Nürnberg equation to estimate internal loading (Equation 1). A sediment release rate of 9 mg TP/m2/day is consistent with estimates from other eutrophic lakes throughout the region (average of 8.4 mg/m2/day; Barr 1987).
Fall Turnover
Figure 3.10. Model predictions of epilimnion total phosphorus concentrations in Lakes Sarah in 2008.
APPROVED FINAL
Fall Turnover
Figure 3.11. Model predictions of hypolimnetic total phosphorus concentrations in Lake Sarah in 2008. 3.2.2 Potential Internal Load Due to Curlyleaf Pondweed Senescence Curlyleaf pondweed is likely a significant factor affecting water quality in Lake Sarah. Unlike most native aquatic plants, curlyleaf pondweed germinates in early fall, grows slowly during the winter months, and senesces by the end of June or early July the following year. This unique life-history allows curlyleaf pondweed to out-compete many native plant species and occupy large areas of the littoral zone – Lake Sarah often has up to 60% littoral surface area coverage of curlyleaf pondweed prior to senescence (Figure 1.8). Senescence of curlyleaf pondweed provides an internal source of nutrients within Lake Sarah. Senescence of curlyleaf pondweed and the coincident increase in total phosphorus concentration often correspond with increased algal growth and reductions in water clarity (Figure 3.12). Potential internal phosphorus loading from curlyleaf pondweed senescence was estimated using methods previously described by Vlach and Barten (2004). Following this procedure, the average total phosphorus load of 2.45 lbs/acre observed by Vlach and Barten (2004) was multiplied by the total acreage of curlyleaf pondweed coverage observed in Lake Sarah in 2007 to obtain an estimate of the potential phosphorus release from curlyleaf pondweed during senescence (Table 3.14). Based on these estimates, curlyleaf pondweed released approximately 914 pounds of phosphorus following senescence in 2007. Given the variability of curlyleaf pondweed densities from year to year and the wide range of reported lbs P/acre estimates, the total contribution of phosphorus from curlyleaf pondweed is likely variable from year to year. However, the data suggest that curlyleaf pondweed senescence may provide a significant source of internal phosphorus loading in Lake Sarah (particularly early in the growing season).
APPROVED FINAL
Total Phosphorus
89
63
0
20
40
60
80
100
120
140
160
180
04/2
4/07
05/0
7/07
05/2
1/07
06/0
4/07
06/1
8/07
07/0
2/07
07/1
6/07
07/3
1/07
08/1
3/07
09/1
1/07
09/2
4/07
10/1
5/07
Tota
l Pho
spho
rus
(µg/
L)
Fall Turnover
Curlyleaf Pondweed Senescence
Figure 3.12. Lake Sarah total phosphorus concentrations corresponding to the senescence of curlyleaf pondweed (numbers above the bars represent phosphorus concentrations before and after senescence). Table 3.14. Estimate of potential internal load from the senescence of curlyleaf pondweed.
Acres Biomass TP Conc. TP TP Load
(g dry-wt/m2) (mg/g dry-wt) (lbs/acre) (lbs)
373 76.7 3.93 2.45 913.9 3.2.3 Representing Internal Load in the TMDL The internal load value used to establish the Load Allocation for the TMDL was derived using the BATHTUB model (see the Loading Capacity section below for further detail). The BATHTUB internal load estimate was compared to the estimates derived from the Nürnberg equation and estimates of internal load from curlyleaf pondweed senescence (see the Internal Load Calibration section). The estimates of potential internal phosphorus load from sediment release and curlyleaf pondweed senescence are being used to identify and quantify the potential benefits of different in-lake options for water quality management (described in detail in the Implementation section). 3.3 Atmospheric Deposition Atmospheric depositional loading was estimated within the BATHTUB model (described further in the Loading Capacity section below). The default BATHTUB estimate for atmospheric deposition is 30 mg/m2-yr (0.27 lbs/acres-year). The BATHTUB default value is similar to other atmospheric TP loading rates observed in Minnesota watersheds (Barr, 2007). Since the total surface area of Lake Sarah is approximately 2.24 km2 (553 acres), the average annual atmospheric deposition of phosphorus was estimated to be 148 lbs/year for Lake Sarah. The atmospheric depositional loading was included in the overall lake nutrient balance.
APPROVED FINAL
4. Loading Capacity 4.1 Methods A BATHTUB model (Army Corps of Engineers Version 6.1) was developed to describe water quality conditions and estimate the assimilative capacity for Lake Sarah. BATHTUB is an empirical model that estimates lake and reservoir eutrophication using several different algorithms. The model estimates in-lake water quality conditions based on the lake morphological characteristics and a mass-balance of nutrient loading to the lake. BATHTUB was selected to model Lake Sarah because the input requirements matched the available data and because of its successful application in previous lake nutrient TMDLs throughout the region (e.g., Bonestroo, 2009 and Johnson et al., 2007). Nutrient sources included in the model are atmospheric deposition, and both internal and watershed nutrient loading. Following calibration/validation, an in-lake, load-response simulation was performed to determine the assimilative capacity for Lake Sarah. The load response procedure was used to estimate the watershed load that would result in compliance with the water quality goals for Lake Sarah. Input data, output files and diagnostic parameters for BATHTUB are summarized in Appendix C. 4.1.1 BATHTUB Inputs Physical-Chemical Parameters Modeling for Lake Sarah was initially based on in-lake data from a ten year period (1999-2008) that corresponds with the 10-year average precipitation data used to generate watershed phosphorus loads (Figures 1.4 through 1.7). To simulate average, growing-season, water-quality conditions (May through September), the BATHTUB model was calibrated to in-lake water quality data from 2005 through 2008 (Table 4.1). Water quality data from 2000, 2002 and 2004 were not included in the calibration dataset because they did not represent average conditions (2000 and 2002 represented years with extreme precipitation events and in 2004 lake water levels were affected by installation of a new outlet structure). Water quality data from 1999, 2001 and 2003 were not collected, and thus, not include in the BATHTUB modeling efforts. Morphometry and observed water quality conditions for Lake Sarah were represented within the BATHTUB model as a spatially-averaged single segment (Tables 4.2 and 4.3). Average lake depth was calculated using the generalized lake area relationship (Wetzel, 1983). Although Lake Sarah has two geographically distinct areas (Figure 1.1), it was modeled as a single segment because the results from comparative sampling efforts suggested that there was not a significant difference in water quality between the two bays (see section Water Quality Monitoring Section for further detail). Table 4.1. Lake Sarah observed water quality conditions used for calibration of the BATHTUB model. Yearly values, averages and coefficients of variation (CV) are reported for TP, Chl-a and Secchi depth.
Precipitation and evaporation values used in the model were based on average conditions for Minneapolis, Minnesota. Evaporation loss was calculated using a pan evaporation average (0.93 m) from the St. Paul Campus Climatological Observatory (from 1972 through 2008). The pan evaporation average was converted to lake evaporation using a pan coefficient of 74.5% (Minnesota Hydrology Guide, 1975). The atmospheric deposition TP loading rate used in BATHTUB was the default value (see the Atmospheric Deposition section for further detail). Table 4.2. Lake Sarah morphometry inputs. Morphometry Characteristics
Surface Area 2.24 km2 Mean Depth 4.1 m
Length 4.6 km Mixed Layer Depth 4 m Hypolimnetic Depth 11 m
Table 4.3. BATHTUB global input parameters.
Parameter BATHTUB Input Precipitation 0.68 m Evaporation 0.69 m Atmospheric precipitation TP load rate 30 mg/m2-yr
Averaging period 1 year
Watershed Load The watershed load entered into the BATHTUB model was developed from both modeling efforts and monitoring data (Table 4.4). The BATHTUB model calculates watershed load for each tributary by multiplying an annual flow by an average concentration. A ten-year average annual flow and TP concentration was calculated using the Lake Sarah SWAT model and used as input for the West, East, Middle Direct and West Direct tributaries (Figure 2.1; see the SWAT model section for further detail). Annual flow and TP concentration values for the tributaries providing direct drainage (Northeast, North, Northwest and South; Figure 3.2) were derived from SLAMM modeling efforts (see SLAMM modeling section for further detail). Watershed loadings from rural, non-tributary areas were developed using land-use export coefficients (see the rural, non-tributary modeling section for further detail).
Table 4.4. Lake Sarah tributary flow and concentration data used for BATHTUB calibration.
Flow TP Conc.
hm3/yr ug/L kg lbs
Highway 55 West 1.46 302.9 442 975
CR 11 East 1.03 305.5 315 694
North East Northeast Direct 0.079 347 27 60
North East North Direct 0.067 329.6 22 49
North West Northwest Direct 0.015 201.3 3 7
South South Direct 0.07 330.8 23 51
Wedge Middle Direct 0.3 272.2 82 180
Direct Other Direct 0.2 208.9 42 92
Total 3.221 956 2108
TP Load
SubwatershedTrib Name
APPROVED FINAL
4.2 Calibration The BATHTUB model was calibrated to in-lake total phosphorus concentrations using data from 2004 through 2008. The Canfield and Bachmann General Lakes TP sedimentation equation (option 9) was used for BATHTUB model simulations because it best predicted the observed in-lake water quality conditions in Lake Sarah (Table 4.5). Calibration of the BATHTUB model was initially attempted using an internal loading rate of zero (i.e., although a background level of internal loading is implicitly represented in BATHTUB, no additional internal load was added). However, calibration with an internal loading rate of zero did not produce a strong fit between observed and modeled values. To achieve a stronger correlation between modeled and observed water quality conditions, an additional internal loading calibration adjustment was necessary. The internal load that was added to the model was very similar (within 15%) to the total internal load previously estimated from the Nürnberg equation and curlyleaf pondweed senescence.
4.2.1 Internal Load Calibrations
An internal loading calibration adjustment of 1.79 mg TP/m2/day resulted in a strong correlation between the modeled and observed water quality conditions (Table 4.5). The internal load calibration adjustment represents additional internal load that is greater than the implicit background level already considered in the BATHTUB model. This internal load calibration resulted in an additional 3222 pounds of phosphorus to the overall mass balance equation. The additional internal load required to calibrate the BATHTUB model was consistent with the internal load estimated from the Nürnberg equation (2763 lbs of phosphorus) and curlyleaf pondweed senescence (914 lbs of phosphorus). The difference between the total estimated internal load (e.g., sum of the Nürnberg and curlyleaf pondweed estimates) and the additional internal load required to calibrate the BATHTUB model was 455 pounds of phosphorus. The internal load estimate calculated using the BATHTUB model (3222 lbs) was used in the overall lake nutrient balance. 4.2.2 Chlorophyll-a and Secchi Transparency Calibrations The chlorophyll-a and secchi depth algorithms were selected based on the model option that best predicted the observed in-lake conditions. The chlorophyll-a model option used was P, Jones and Bachman (option 5). The default transparency vs. chlorophyll-a and turbidity model option (option 1) was used to characterize secchi depth. Chlorophyll-a and secchi depth model coefficients were adjusted incrementally to further calibrate to the observed in-lake water quality conditions (Table 4.5). Table 4.5. BATHTUB model calibration to existing conditions.
Lake Sarah BATHTUB Water Quality
Parameters Observed
BATHTUB Predicted Model Selection
Calibration Coefficients
TP (µg/L) Mean 86.2 86.2 9-Canfield Bachmann, General 1 Chl-a (µg/L) Mean 50.7 50.5 5-P, Jones and Bachman 0.93
SD (m) Mean 1.3 1.3 1-vs. Chl-a & Turbidity 1.8
4.3 Validation The calibrated BATHTUB model was validated using in-lake water quality data and SWAT/SLAMM watershed load estimates from 2007 and 2008 (Table 4.6). The correlation of BATHTUB model predictions with the 2007 and 2008 datasets suggests that the BATHTUB model (developed for average conditions) accurately predicts (within 15%) changes in lake
APPROVED FINAL
water quality in specific individual years (Table 4.7). Given the large influence of internal loading (which accounts for ~ 59% of the total phosphorus load), in-lake water quality conditions appear to be somewhat insensitive to change in watershed loading (see the Load Response section for further discussion). Table 4.6. Watershed loadings used for the BATHTUB model in 2007 and 2008.
2007 2008 Flow TP Flow TP
Tributaries hm3/yr µg/L hm3/yr µg/L
West 1.50 300 1.39 256 East 1.08 294 0.94 324
Northeast Direct 0.08 338 0.07 321 North Direct 0.07 321 0.06 304
Northwest Direct 0.02 198 0.01 184 South Direct 0.07 325 0.06 309 Middle Direct 0.31 282 0.28 253 Other Direct 0.20 216 0.18 194
Table 4.7. Validation results from water quality and watershed load data from 2007 and 2008 in Lake Sarah.
4.4 Load Response A load response procedure was performed to evaluate the in-lake water quality response to varying phosphorus loads from the watershed. The load response procedure was used to estimate the watershed TP load consistent with achieving specific water quality goals. The load response analysis was performed with the internal loading rate set to zero. Setting the internal loading rate to zero does not imply there is no internal loading occurring within Lake Sarah. Instead, an internal loading rate of zero indicates that the maximum internal load that will result in compliance with the in-lake water quality goals can be no higher than the background levels of internal loading implicitly represented in the BATHTUB model (see the BATHTUB calibration section for further detail). With the internal load set to zero, the watershed phosphorus loads were incrementally reduced to identify the watershed load that resulted in an in-lake TP concentration of 40 µg/L. The output from the load response analysis also included predictions of chlorophyll-a concentrations and secchi depth that would be anticipated when the in-lake phosphorus concentration reached the TMDL goal (with the Margin of Safety). 4.5 Results 4.5.1 Existing Conditions Water quality conditions in Lake Sarah are influenced by both watershed and internal loading processes. The Lake Sarah watershed contributes approximately 38% of the total annual phosphorus load to the lake, and internal loading accounts for 59% of the total
APPROVED FINAL
annual load (Table 4.8). Atmospheric deposition accounts for only a small percentage (3%) of the total phosphorus loading to the lake. Table 4.8. Volume and TP load source contributions: Existing conditions
4.5.2 Assimilative Capacity The load response simulation for Lake Sarah determined that reductions in both the watershed and internal loads will be necessary to meet the in-lake water quality goal of 40 µg/L. Initially, the load response simulation was run to estimate the water quality improvements that would result from a reduction in the watershed load alone (i.e., the internal loading rate was not reduced). This analysis suggested that a 100% reduction of the watershed load would result in an in-lake TP concentration of 67.1 µg/L – above the 40 µg/L goal (Figure 4.1). A second load-response simulation was run with the internal loading rate set to zero (i.e., the internal loading represented in the model was no greater than background levels implicitly represented by BATHTUB). Results from the second load-response analysis suggest that – when internal loading is controlled to background levels –in-lake water quality goals will be achieved when the total annual watershed phosphorus load to the lake does not exceed 1238 lbs TP/yr (Figure 4.2). 4.6 Margin of Safety The margin of safety (MOS) for Lake Sarah is explicitly defined as 238 lbs. The MOS value was developed by identifying and adopting an in-lake phosphorus goal of 36 µg TP/L, which is 4 µg/L less than the Minnesota State standard of 40 µg TP/L. A primary input for the development of in-lake phosphorus standards in Minnesota was the relationship between user perception and in-lake TP concentrations (e.g., Heiskary and Wilson, 2005). Heiskary and Walker (1988) observed that a 40 µg TP/L standard corresponds to an ~25% risk of experiencing “High Algae” conditions, “Swimming Impairment” and Chlorophyll-a concentrations of > 20 µg/L. An in-lake TP concentration of 36 µg TP/L corresponds to a reduced risk of these conditions of ~10%. The explicit MOS was considered to be appropriate based upon the generally good agreement between the water quality models predicted and the observed values that was demonstrated during the calibration and validation processes. Since the models reasonably reflect the conditions in the lake watershed, the MOS is considered to be adequate to address the uncertainty in the TMDL based upon the data available. 4.7 Reserve Capacity Reserve capacity for Lake Sarah is being set to zero in the TMDL. A reserve capacity of zero was determined based on the non-degradation policy described in the Pioneer-Sarah Creek Watershed Commission 2nd Generation Plan (section VI, A.21). This policy requires no increase in phosphorus discharge as a result of development and/or redevelopment activities. 4.8 Seasonal Variability As described in the Lake Water Quality and Watershed Monitoring sections, water quality in Lake Sarah and phosphorus loads from the surrounding watershed vary within and among years (Figures 1.4 through 1.7 and 2.2). Intra and interannual variability are both
APPROVED FINAL
addressed in the TMDL. Intraannual variability is addressed in the TMDL by basing lake condition assessments on the average growing-season TP concentration. Although TP concentrations vary significantly throughout the summer months, the growing-season average integrates ecosystem variability over time. Interannual variability is reflected in the TMDL by basing the model calibration(s) on long-term averages in precipitation/watershed loading and in-lake response – which integrates long-term trends.
Lake Sarah Load Response
0
20
40
60
80
100
120
0 500 1000 1500 2000 2500 3000 3500 4000 4500
Load (lbs)
Tota
l Pho
spho
rus
(µg/
L)
40 μg/L TP standard not achievable without control of both internal and external loads
Figure 4.1. Lake Sarah load-response with an internal loading rate of 1.79 mg/m2/day and 10-year average watershed loading in the BATHTUB model.
APPROVED FINAL
Lake Sarah Load Response
0
10
20
30
40
50
60
70
80
90
0 500 1000 1500 2000 2500 3000 3500 4000 4500
Load (lbs)
Tota
l Pho
spho
rus
(µg/
L)
Watershed load of 1238 lbs/yr TP will result in compliance with the 40 μg/L Standard
Figure 4.2. Lake Sarah load-response with internal loading set to zero in the BATHTUB model and average watershed loading based on the 10-year average.
APPROVED FINAL
5. TMDL Allocations The TMDL represents the total mass of phosphorus that can be assimilated into Lake Sarah while continuing to meet the state water quality standards. For purposes of implementation, the TMDL is described as an equation with four different components: Waste Load Allocation (WLA); Load Allocation (LA); Margin of Safety (MOS); and Reserve Capacity (RC). The WLA represents phosphorus loading from permitted sources such as permitted stormwater discharge from Municipal Separate Storm Sewer Systems (MS4s). The LA represents phosphorus from non-permitted sources such as non-MS4 municipalities, atmospheric deposition and internal loading. A portion of the TMDL is allocated to the MOS to account for uncertainty associated with modeling estimates and environmental variation. The RC is the portion of the load that is set aside to account for future development.
TMDL = ∑WLA +∑ LA + MOS + RC
WLA = Wasteload Allocations LA = Load Allocations
MOS = Margin of Safety RC = Reserve Capacity
The WLA, LA, MOS, and RC must sum up to the overall TMDL goal for Lake Sarah (Equation 4). Equation 4:
TMDL = ∑WLA + ∑LA + MOS + RC
lbs/yr 1386.00 = 388.27 + 759.75 + 238.00 + 0
lbs/day 3.797 = 1.064 + 2.082 + 0.652 + 0
Note: For annual loads, decimal places have been rounded to the nearest whole number throughout the text of the document. Based on the load-response simulation, the total annual watershed phosphorus load must not exceed 1238 lbs P/year to achieve the in-lake water quality goal (Figure 4.2). An explicit MOS of 238 pounds was set to ensure that water quality standards are achieved across a range of environmental conditions. Following the adjustment for the explicit MOS, the total annual watershed phosphorus load to the lake from permitted (WLA) and non-permitted (LA) sources must not exceed 1000 pounds of phosphorus per year (Table 5.1). Thus, the watershed load will need to be reduced by 1108 lbs (approximately 53%) to achieve the in-lake water quality goals. Relative apportionment of the watershed load into LA and WLA was based on percent land area and MS4 designation. Land areas regulated as part of an MS4 permit were assigned an allocation based on percent watershed area and included as a component of the WLA (labeled as Watershed, Permitted in Table 5.1). All land areas not regulated under an MS4 permit were assigned an allocation based percent area and included as a component of the LA (labeled as Watershed, Non-permitted in Table 5.1). Total LA was determined by summing the watershed (non-permitted areas), atmospheric and internal LA estimates. Current (or existing) watershed loads were determined using the watershed model to back calculate the existing loads necessary to result in the corresponding instream nutrient and in-lake water quality conditions. All load reduction goals (see Implementation Strategy) were determined by subtracting the WLA or LA from the existing load.
APPROVED FINAL
Table 5.1. Lake Sarah phosphorus sources and required reductions necessary to achieve in-lake water quality goal.
Total 5477.82 15.008 1386.02 3.797 4330 11.862 79%
TP Source
TP Load
Current TMDL Difference
*Note: 100% of the internal load refers to the 3222 lbs identified as internal load above the background levels implicitly represented in the BATHTUB model. For annual loads, decimal places have been rounded to the nearest whole number throughout the text of the document. The BATHTUB model was used to predict the change in chlorophyll-a concentration and secchi-depth transparency that will correspond to the TMDL loading scenario (including MOS). With phosphorus loading at levels prescribed by the TMDL, secchi depth in Lake Sarah is predicted increase to 3.9 m (Table 5.2) – meeting the state standard of 1.4 m. However, the chlorophyll-a water quality standard will not be achieved with the load reductions prescribed by the TMDL. The BATHTUB model predicts that chlorophyll-a concentration will decrease to 14.5 µg/L, which is slightly above the chlorophyll-a water quality standard of 14 µg/L. Assuming that the total phosphorus and secchi-depth transparency water quality standards are achieved, Lake Sarah would not be considered impaired due to excess nutrients and would be removed from the 303(d) impaired waters list. Table 5.2. Lake Sarah predicted changes in water quality conditions for the TMDL modeled loading scenario.
5.1 Wasteload Allocations 5.1.2 Wasteload Allocations for Permitted MS4 The overall wasteload allocation was partitioned out into individual WLAs for each of the permitted MS4s throughout the watershed*. Individual WLAs were assigned based on watershed area. For example, if community “A” represents 10% of the watershed area, it was allocated 10% of the watershed load (less the MOS). WLAs and existing loads are described in detail in Table 5.3. *Note: Because the City of Greenfield, Hennepin County and Mn/DOT are not currently permitted MS4s, their respective phosphorus loads are included in the Load Allocation (see the Load Allocation Section below).
APPROVED FINAL
5.1.3 Construction Stormwater Stormwater from construction activities has been assigned a WLA of 1.46 lbs TP/yr (0.004 lbs TP/day). The construction stormwater WLA was estimated based on a 10-year estimate of the median number of construction site acres present throughout the Lake Sarah watershed. Ten-year median construction acres (6.45 in the Lake Sarah watershed) were divided by the total watershed area (4454 acres) to identify the percent watershed area anticipated to be in construction in any given year (0.145%). The 10-year median construction percentage was multiplied by the TMDL watershed load export to identify the construction WLA (1.46 lbs TP/yr). Construction stormwater activities are considered in compliance with provisions of the TMDL if they obtain a Construction General Permit under the NPDES program and properly select, install and maintain all BMPs required under the permit, including any applicable additional BMPs required in Appendix A of the Construction General Permit for discharges to impaired waters, or meet local construction stormwater requirements if they are more restrictive than requirements of the State General Permit. 5.1.4 Industrial Stormwater Industrial stormwater has not been assigned a WLA. There are no known industrial discharges located in the Lake Sarah watershed. Any future industrial stormwater activities will be considered in compliance with provisions of the TMDL if they obtain an industrial stormwater general permit or General Sand and Gravel general permit (MNG49) under the NPDES program and properly select, install and maintain all BMPs required under the permit. Table 5.3. Annual and daily TP wasteload allocations for permitted discharges in the Lake Sarah watershed.
TOTAL 927.22 2.540 1736 39.0% 388.27 1.064 539 1.477
Wasteload ReductionWasteload AllocationExisting Wasteload Wasteload Area
Acres % Watershed % WLA
* Assuming compliance with NPDES general permits. ** No known industrial or municipal discharges in the Lake Sarah watershed Note: For annual loads, decimal places have been rounded to the nearest whole number throughout the text of the document. 5.2 Load Allocations The total Load Allocation (LA) for Lake Sarah was 760 lbs TP/year (Tables 5.1 and 5.4). The LA portion of the TMDL equation represents 586 lbs TP/yr from the City of Greenfield, 17 lbs TP from Mn/DOT, 9 lbs TP from Hennepin County, 148 lbs TP/yr from the atmosphere and 0 lbs TP/yr from internal loading. As described above, setting the internal load value in the TMDL equation to zero does not imply there is no internal load. Instead, the zero value indicates that the internal load that will allow Lake Sarah to meet water quality standards can be no higher than the background levels of internal loading already represented in the BATHTUB model (additional sources of internal load are described in more detail in the Internal Load section above). To meet water quality goals in all years (particularly those with high densities of curlyleaf pondweed), internal load will also have to be reduced by an average of 3222 lbs TP/year. *Note: Because the City of Greenfield, Hennepin County and
APPROVED FINAL
Minnesota Department of Transportation are not currently regulated MS4s within the watershed, their respective phosphorus loads are included in the Load Allocation. Table 5.4. Annual and daily load allocations for non-permitted discharges in the Lake Sarah watershed.
Non-watershed LA 3370.00 9.233 148.00 0.405 3222 8.827
TOTAL 4550.60 12.467 2724 61.2% 759.75 2.082 3791 10.386
Load ReductionExisting Load Load AllocationLoad Area
Source Acres % Watershed % LA Area
Note: For annual loads, decimal places have been rounded to the nearest whole number throughout the text of the document. 5.3 Reasonable Assurances Implementation of the Lake Sarah TMDL will occur at federal, state and local levels. Given the ongoing commitment of the watershed communities, local residents and the Pioneer-Sarah Creek Watershed Management Organization, timely and effective implementation of water quality improvement projects is anticipated. All implementation efforts will be guided by a detailed implementation plan that will be developed through ongoing discussion with watershed stakeholders. Since ~39% of the phosphorus runoff throughout the Lake Sarah watershed is a component of the WLAs for the permitted MS4s, much of the implementation will occur through the National Pollution Discharge Elimination System (NPDES) permit program. As part of the NPDES program, the Minnesota MS4 general permit requires that all regulated MS4s develop and implement a Stormwater Pollution Prevention Program (SWPPP). Within 18 months of TMDL approval by EPA, each MS4 (in consultation with MPCA) must determine if current activities are in compliance with the WLA, and if not, modify the SWPPP to reflect the necessary changes. General MS4 permits are reviewed by MPCA every five years and reports are submitted by the permit holder and reviewed by MPCA annually to track implementation activities. Water quality in the Lake Sarah watershed is further managed through the local surface water planning process implemented by the Minnesota Board of Water and Soil Resources (BWSR). Minnesota Rules Chapter 8410 requires that watershed management plans be developed to address specific goals and policies that address: Water Quantity; Water Quality; Natural Resource Protection; Erosion and Sediment Control; Wetland Protection; Shoreland Management; and Floodplain Management. Watershed management plans are updated every ten years and reviewed by BWSR. Permitted MS4s are required to update their Local Surface Water Management Plans to align with the current Pioneer-Sarah Creek Watershed Management Plan. As described above, the Pioneer-Sarah Creek Watershed Commission (PSCWC) 2nd Generation Plan (section VI, A.21) contains a non-degradation policy that requires no increase in phosphorus discharge during development and redevelopment activities. Development, adoption and implementation of shoreland management controls is also required and regulated by Minnesota Department of Natural Resources (MNDNR) for all riparian communities (Minnesota Rules 6120.2500 – 3900). Progress toward TMDL implementation will also be tracked through a comprehensive monitoring program (see the Monitoring Plan section below for further detail).
APPROVED FINAL
In addition the regulatory capacity of MPCA, BWSR and PSCWC, implementation (particularly for non-point sources) will be facilitated through incentive-based programs. Hennepin County Environmental Services (HCES), Natural Resource Conservation Service (NRCS) and the Lake Sarah Improvement Association (LSIA) have been actively involved in a number of projects throughout the watershed to engage landowners in water resource stewardship activities. Previous incentive programs have included: cost-share grants for shoreline stabilization/restoration, erosion control, conservation buffers, technical assistance and rain garden installation. To increase voluntary participation in watershed stewardship activities, the PSCWC is also an active participant in the regional Education and Public Outreach Committee (EPOC).
APPROVED FINAL
6. Monitoring Strategy To ensure effectiveness and efficiency of TMDL implementation, ongoing monitoring will be conducted. Monitoring will assess BMP implementation, in-lake condition, watershed loading and aquatic plant community composition. BMP implementation monitoring will be conducted by the Pioneer-Sarah Creek Watershed Commission (PSCWC). Each year member communities will submit a summary of BMP projects and the anticipated phosphorus reductions to the PSCWC in conjunction with Stormwater Pollution Prevention Program (SWPPP) reporting. BMPs will be cataloged to monitor progress toward the individual wasteload reduction goals. In-lake monitoring will be conducted annually following completion of the TMDL. Samples will be collected biweekly (April thru October) following previously described protocols for eutrophic lake assessment (Heiskary, 1994 and MPCA, 2007). Lake monitoring will continue to be cooperatively implemented by PSCWC and Three Rivers Park District. Five years after approval of the TMDL, a detailed watershed load monitoring study should be conducted to quantify the relative load reduction associated with various BMPs. Watershed monitoring will be conducted at the current TMDL monitoring sites following protocols described by Walker (1996). Follow-up monitoring will be conducted for a one to two year period (depending on precipitation patterns), every five years until wasteload reduction goals have been achieved. Watershed load monitoring should be structured to assess BMP effectiveness at a watershed scale (where applicable) to validate the predicted phosphorus removal efficiencies and facilitate an adaptive approach to the design/implementation of future BMPs. *Future watershed load monitoring efforts should include assessments of early season runoff associated with snow melt and early season rain events (particularly during seasons where rain-on-snow events are possible). Preliminary data suggests that early season runoff may be an important phosphorus source to the lake that is currently underrepresented in the model (see the modeling uncertainty section for further discussion). Again, this monitoring would be carried out through a cooperative arrangement between PSCWMC and Three Rivers Park District. Sediment phosphorus levels should be assessed concurrently with watershed load monitoring efforts to better evaluate the applicability and potential cost-effectiveness of various in-lake BMPs. Sediment phosphorus monitoring will be conducted following the protocol outlined by Pettersson et al. (1988). Aquatic macrophyte monitoring should be conducted annually to assess: 1) the natural variability of the aquatic plant community; and 2) the efficacy of any future aquatic plant management programs. Monitoring should be conducted at ~200 points throughout the littoral zone using a point intercept survey (e.g., Madsen, 1999). Annual monitoring will be conducted until in-lake plant management activities have been completed. Vegetation monitoring will continue to be cooperatively implemented by PSCWC and Three Rivers Park District.
APPROVED FINAL
7. Implementation Strategy Implementation efforts will focus on reduction of both internal and external phosphorus loads. The majority of the watershed and internal loading is considered anthropogenic. As described in the TMDL Allocation section, reductions of both the watershed (53%) and internal (100% - above background levels) loads are necessary to achieve water quality goals for Lake Sarah. To ensure that water quality improvements from internal load management efforts are sustained, implementation will initially focus on reducing watershed loading. Total implementation costs are anticipated to be between $494,000 and $2.93-million for watershed work and about $730,000 for in-lake work. 7.1 Watershed Load Reduction Strategies To achieve the Wasteload Allocation (WLA) and Load Allocation (LA) goals (as described in the TMDL Allocation section), watershed load reduction efforts must remove 1108 lbs of phosphorus annually. Based on input from the stakeholder group and communities, a lower cost approach emphasizing land treatment BMP’s at numerous locations in the affected subwatersheds was preferable to a higher cost approach involving a few large, capital intensive treatment projects near the bottom of major watersheds. It was also recognized that taking the former approach might require more time – up to 10-15 years – for full implementation. The preferred strategy for achieving the requisite reductions in the watershed load involves implementing a series of BMPs related to row crop agriculture, feedlot and manure management, and residential and commercial development, supplemented with restoration of stream, wetland and shoreline habitat. To facilitate flexibility during implementation, the total acreages available for implementation, relative cost, and removal efficiencies of different BMPs for each watershed community have been summarized (Appendix D). Anticipated costs and phosphorus reductions are based on estimates from a range of sources (e.g., Devlin, et al. 2003; MSSC, 2008; Rehm, et al. 2002; Wortmann, et al. 2005). For further detail on BMP references see Appendix E. Potential costs were calculated by multiplying the number of acres available for different BMPs by anticipated cost per acre estimates (estimates were rounded to the nearest $10 increment). As described in the Loading Capacity and SWAT modeling sections, the majority of the phosphorus load is delivered to the lake as a result of overland surface flow – primarily from spring snow-melt and early season precipitation. As a result, BMPs that focus on reducing surface runoff and/or erosion will have a greatest influence on water quality improvements. Recommendations described below are based a combination of a cost-benefit comparisons and direction from local city councils, planning commissions, and stakeholders on which BMP’s are most appropriate for their communities. Costs and associated pounds of phosphorus reduction are presented below as maximum or best-case scenario estimates. Total phosphorus reduction goals (either Wasteload Reductions, WLRs or Load Reduction, LRs) identified for each community generally exceed the respective individual WLAs or LAs. This excess is intended to account for partial implementation of different BMP types, overlap of BMP effectiveness, and possible joint projects where adjacent communities share the benefits and costs of a project. BMPs described are intended for existing conditions and do not address anticipated changes in land use. However, stormwater management rules and policies of the Pioneer-Sarah Creek Watershed Management Commission generally require mitigation to achieve, at a minimum, nondegradation when undeveloped land is converted to a developed land use. A summary of phosphorus reduction strategies for each entity receiving an allocation is presented below.
APPROVED FINAL
Medina (WLR 249 lbs P/yr) The most cost-effective options for phosphorus load reduction in the City of Medina are BMPs related to row crop management and instream/wetland restoration. Specific projects/activities recommended in Medina are:
1) nutrient management based on soil tests (up to 115 lbs P/yr; $2,880); 2) edge-of-field filter strips (buffers; up to 172 lbs P/yr; $8,600); 3) instream/wetland restoration of channelized reaches (up to 100 lbs P/yr;
$260,000*). *note: based on possible joint project between Medina and Loretto; projected phosphorus reduction and cost based on general project plan, split of benefits and costs are assumed and will be revised/updated as part of preliminary engineering/design.
Total potential phosphorus removal resulting from BMP implementation in Medina is 387 lbs P/yr. Independence (WLR 143 lbs P/yr) The most cost-effective options for phosphorus load reduction in the City of Independence are BMPs related to row crop management, feedlot and manure management and shoreline restoration. Specific projects/activities recommended in Independence are:
1) manure application guidance (up to 19 lbs P/yr; $530); 2) nutrient management based on soil tests (up to 38 lbs P/yr; $950); 3) edge-of-field filter strips (buffers; up to 38 lbs; $1,890); 4) shoreline buffering (up to 25 lbs P/yr; $2,900); 5) barnyard management* (up to 76 lbs P/yr; $45,000) *note: for details, see
Appendix D 6) urban raingarden installation (up to 64 lbs P/yr; $1,162,500)
Total potential phosphorus removal resulting from BMP implementation in Independence is 260 lbs P/yr. Greenfield (LR 528 lbs P/yr) The most cost-effective options for phosphorus load reduction in the City of Greenfield are BMPs related to row crop and feedlot/manure management. Specific projects/activities recommended in Greenfield are:
1) manure application guidance (up to 27 lbs P/yr; $740); 2) nutrient management based on soil tests (up to 264 lbs P/yr; $950/yr); 3) edge-of-field filter strips (buffers; up to 519 lbs; $25,970); 4) barnyard management* (up to 162 lbs P/yr; $215,000) *note: for details, see
Appendix D Total potential phosphorus removal resulting from BMP implementation in Greenfield is 972 lbs P/yr. Corcoran (WLR 109 lbs P/yr) The most cost-effective options for phosphorus load reduction in the City of Corcoran are BMPs related to row crop, feedlot/manure and commercial runoff management. Specific projects/activities recommended in Corcoran are:
1) nutrient management based on soil tests (up to 64 lbs P/yr; $1,600/yr); 2) edge-of-field filter strips (buffers; up to 140 lbs; $7,000); 3) barnyard management* (up to 28 lbs P/yr; $25,000) *note: for details, see
Appendix D 4) filtration of commercial runoff (up to 35 lbs P/yr; $1,027,500)
APPROVED FINAL
Total potential phosphorus removal resulting from BMP implementation in Corcoran is 267 lbs P/yr. Loretto (WLR 37 lbs P/yr) The most cost-effective options for phosphorus load reduction in the City of Loretto are BMPs related to urban and residential stormwater management and instream/wetland restoration. Specific, projects/activities recommended in Loretto are:
1) instream/wetland restoration of channelized reaches (up to 54 lbs P/yr; $140,000*) *note: based on possible joint project between Medina and Loretto; projected phosphorus reduction and cost based on general project plan, split of benefits and costs are assumed and will be revised/ updated as part of preliminary engineering/design.
Total potential phosphorus removal resulting from BMP implementation in Loretto is 54 lbs P/yr. Minnesota Department of Transportation (Mn/DOT; WLR 28 lbs P/yr) The most cost-effective options for phosphorus load reduction by Mn/DOT are the implementation of stormwater BMPs during roadway construction or reconstruction projects. Hennepin County (WLR 13 lbs P/yr) The most cost-effective options for phosphorus load reduction by Hennepin County is the implementation of stormwater BMPs during roadway development/redevelopment projects and/or cost-sharing with local municipalities during BMP implementation. 7.2 Internal Load Reduction Strategies The majority of the internal phosphorus load is considered anthropogenic from years of input from watershed loading. Implementation measures to reduce anthropogenic watershed loading will ultimately reduce the rate of accumulation of phosphorus in lake sediments that causes internal loading. Despite the required reductions in watershed load, additional management efforts will have to be implemented to control internal loading from enriched sediments presently in the lake in order to achieve in-lake water quality goals. Internal load reduction will be achieved through the implementation of a curlyleaf pondweed control program and/or in-lake phosphorus sequestration/removal. Effective control of internal loading will require the removal/sequestration of 3222 lbs P/year (described in further detail in the BATHTUB modeling section). 7.2.1 Curlyleaf Pondweed Control As described in the introduction, curlyleaf pondweed is present in approximately 373 acres of the littoral zone, and this corresponds to a potential phosphorus load from senescence of approximately 914 pounds of phosphorus per year. The two principle methods that could be used to try to control curly-leaf pondweed are harvesting and an early season, low dose aquatic herbicide treatment. Harvesting activities would likely need to be carried out on the lake almost every year and are estimated to cost approximately $52,500/year. Harvesting is likely to have low effectiveness in limiting turion production and in reducing phosphorus loading from senescing curlyleaf pondweed due to inherent limitations of the equipment on the depths and areas that can be harvested in a timely fashion. Herbicide treatments would likely need to be carried out on the lake for at least five consecutive years over most of the littoral area. Estimated costs are based on initial herbicide applications over 300 acres of the littoral area for the first two years, 150 acres the third year, and 75 acres each for the fourth and fifth year. At the rates presented in Appendix F, costs for a 5-year herbicide control program would total approximately $250,000, though cost could vary based on the efficacy of treatment from year to year. An early season, low dose aquatic herbicide
APPROVED FINAL
treatment has the potential for a high effectiveness in controlling both turion production and limiting phosphorus loading from curlyleaf pondweed as well as enhancing the native aquatic plant community in the lake. Prior to any whole-lake manipulation, the Lake Sarah Lake Vegetation Management Plan (LVMP) must be completed and approved by the Minnesota Department of Natural Resources and permits will need to be obtained. 7.2.2 In-lake Phosphorus Sequestration/Removal In addition to aquatic vegetation management, sediment release of nutrients during periods of anoxia may need to be addressed. Potential options for internal load control that may be considered are alum treatment and hypolimnetic withdrawal and treatment/irrigation. Specific cost estimates for control of sediment release of phosphorus have not been identified in Lake Sarah, but costs of projects (specifically alum treatments) in similar lakes range between $700/acre and $1900/acre of lake area. The actual cost for an alum treatment for Lake Sarah will depend on the outcome of sampling and analysis of lake sediments to determine the appropriate dose for the lake. For the purposes of this TMDL, the preliminary estimate to treat the deep area of the lake (about 180 acres) plus the deep half of the littoral area of the lake (about 190 acres) with alum is $481,000 based on a per acre cost at the mid-point of the range presented above ($1,300/ac.). In-lake phosphorus control is not being proposed as a recurring management activity, but rather as a “one-time” management tool to complement watershed and aquatic plant management efforts. A treatment to sequester phosphorus in the lake would be completed toward the end of the implementation schedule after curlyleaf pondweed and watershed source controls have been largely completed. Permits will need to be obtained in order to implement the treatment.
APPROVED FINAL
8. Public Participation The Lake Sarah TMDL has been developed in conjunction with an extensive public participation process. Starting in January of 2008, ten stakeholder meetings were conducted to inform TMDL development. Minutes and presentations from all TMDL stakeholder meetings are posted on the MPCA Lake Sarah TMDL project website http://www.pca.state.mn.us/water/tmdl/project-lakesarah-nutrients.html. Meetings have been coordinated by the Lake Sarah Stakeholders Committee and attended by representatives from local governments, local citizens, the Lake Sarah Improvement Association, Pioneer-Sarah Creek Watershed Management Commission, Hennepin County Environmental Services, Board of Water and Soil Resources, Minnesota Department of Natural Resources, Minnesota Pollution Control Agency and Three Rivers Park District. Note: starting in 2005, the Lake Sarah Stakeholders Committee also began meeting independent of the TMDL process to discuss water quality management in Lake Sarah. In addition to the broad Stakeholder Group meetings, a series of directed stakeholder meetings/presentations (15 in total) have also been conducted with local government city councils and/or planning commissions to discuss the TMDL process and identify opportunities for BMP implementation. Directed stakeholder meetings have been conducted with the City of Median, City of Loretto, City of Independence, City of Corcoran and City of Greenfield. Minutes and presentations from meeting with city councils and planning commissions are archived with the associated meeting summaries. This TMDL went through a formal public noticing process of the Minnesota Pollution Control Agency from October 11, 2010 through November 10, 2010. Five comment letters were received on the draft TMDL and the MPCA responded to all comments received during the Public Notice process.
9. References Almendinger, J.E., and Murphy, M.S. 2005. Land-use change and agricultural practices in the Willow River watershed, western Wisconsin, 1992-2004. Interim report to Legislative Commission on Minnesota Resources and Wisconsin Department of Natural Resources. St. Croix Watershed Research Station, Science Museum of Minnesota, St. Paul, MN. 28 pp plus 13 pp of tables and figures. Arnold, J.G., Srinivasan, R., Muttiah, R.S. and Williams, J.R. 1998. Large-area hydrologic modeling and assessment. I: Model development. Journal of American Water Resources Association 34(1): 73-89. Barr Engineering Company. 1987. Management Alternative Report on the Diagnostic Feasibility Study for Medicine Lake. Prepared for Bassett Creek Water Management Commission. April 1987. Barr Engineering. 2006. Burnsville stormwater retrofit study. Accessed online: http://www.ci.burnsville.mn.us/DocumentView.aspx?DID=449. Barr Engineering Company. 2007. Detail Assessment of Phosphorus Sources to Minnesota Watersheds – Atmospheric Deposition: 2007 Update. Technical Memorandum prepared for Minnesota Pollution Control Agency. Baumgart, P.D. 2005. Lower Green Bay and Lower Fox Tributary Modeling Report. Prepared for Oneida Tribe of Indians of Wisconsin and Green Bay Remedial Action Plan Science and Technical Advisory Committee. Bonestroo. 2009. Long and Farquar Lakes Nutrient TMDL. City of Apple Valley and Minnesota Pollution Control Agency. EPA approval: April 8, 2009. Brown, W., Schueler, T. 1997. The Economics of Storm Water BMPs in the Mid-Atlantic Region. Center for Watershed Protection. Elliot City, MD, 41 pp. Brezonik, P.L. and Stadelmann, T.H. 2002. Analysis and predictive models of stormwater runoff volumes, loads and pollutant concentrations from watersheds in the Twin Cities metropolitan area, Minnesota, USA. Water Research, 36:1743-1757. Canfield, D.E. Jr., and R.W. Bachmann. 1981. Prediction of total phosphorus concentrations, chlorophyll-a, and secchi depths in natural and artificial lakes. Canadian Journal of Fisheries and Aquatic Sciences. 38: 414-423. Carlson, R.E. 1977. A trophic status index for lakes. Limnology and Oceanography 22(2): 361-369. Czapar, G.F., Laflen, J.M., McIsaac, G.F., McKenna, D.P. 2008. Effects of erosion control practices on nutrient loss. Final Report: Gulf Hypoxia and Local Water Quality Concerns Workshop. St. Joseph, Michigan: ASABE. Pp 117-127. Devlin, D., Dhuyvetter, K., McVay, K. Kastens, T., Rice, C., Janssen, K., Pierzynski, G. 2003. Water quality best management practices, effectiveness, and cost for reducing contaminant losses from cropland. Kansas State University MF-2572 Accessed online: http://www.ksre.ksu.edu/library/h20ql2/mf2572.pdf.
Food and Agricultural Policy Research Institute (FAPRI). 2007. Estimating water quality, air quality, and soil carbon benefits of the Conservation Reserve Program. FAPRI-UMC Report #01-07. University of Missouri - Columbia. Gassman, P.W., M. Reyes, C.H. Green, and J.G. Arnold. 2007. The Soil and Water Assessment Tool: Historical development, applications, and future directions. Transactions of the American Society of Agricultural and Biological Engineers (Invited Paper Series) 50(4): 1211-1250. Heiskary, S., R. Anhorn, T. Noonan, R. Norrgard, J Solstad, and M. Zabel. 1994 Minnesota lake and watershed data collection manual. Environmental Quality Board-Lakes Task Force, Data and Information Committee. Minnesota Lakes Association. Heiskary, S. Hrubes, J., Kohlasch, F., Larson, T., Maschwitz, D., Risberg, J., Tomasek, M., Wilson, B., Trojan, M. and Findorff, M. 2007. Lake Nutrient TMDL Protocols and Submittal Requirements. Minnesota Pollution Control Agency. Heiskary, S. and Walker, W. 1988. Developing Phosphorus Criteria for Minnesota Lakes. Lake and Reservoir Management 4(1):1-9. Heiskary, S. and Wilson, C.B. 2005. Minnesota Lake Water Quality Assessment Report: Developing Nutrient Criteria, Third Edition, Minnesota Pollution Control Agency. Hennepin County. 2008. Hennepin County Traffic Flow Map. Online Access: http://www.co.hennepin.mn.us/portal/site/. Access Date: 10/10/2008. Hutjens, M.F. 1998. A cost-benefit analysis of changing to a TMR feeding system. Accessed online: http://www.livestocktrail.uiuc.edu/dairynet/paperDisplay.cfm?ContentID=243. ISCO, 2001. 4150 Flow Logger Instruction Manual. Part #60-3243-143 of Assembly #60-3244-074. ISCO, Inc., Lincoln, NE. ISCO, 2004. Flowlink version 4.16 for Windows. 69-2543-002 Rev. B. Teledyne ISCO, Inc. Lincoln, NE. Johnson, J., Vlach, B. and Barten, J. 2007. Lake Independence Phosphorus TMDL. Pioneer-Sarah Creek Watershed Commission and Minnesota Pollution Control Agency. EPA Approval Date: February, 23 2007. Krovang, B., Laubel, A., Larsen, S.E., Andersen, H.E., Djurhuus, J. 2005. Buffer zones as a sink for sediment and phosphorus between the field and stream: Danish field experiences. Water Science & Technology. 51 3-4:55-62. LimnoTech. 2009. Simple TP Model. Ann Arbor, MI. Low Impact Development (LID) Center. 2010. Data from the website: http://www.lid-stormwater.net/bio_costs.htm. Madsen, J. 1999. Aquatic Plant Control Technical Note MI-02: Point intercept and line intercept methods for aquatic plant management. US Army Engineer Waterway Experiment Station.
Metropolitan Council. 2010. 2030 Regional Development Framework – Revised forecasts as of December 31, 2009. Online Access: http://www.metrocouncil.org/metroarea/RDFforecasts.pdf. Access Date: February, 4, 2010. Minnesota Pollution Control Agency. 1999. Phosphorus in Minnesota’s Groundwater. Environmental Outcomes Division. Groundwater Monitoring and Assessment Program. Online Access: www.pca.state.mn.us/water/groundwater/gwmap/phospho.pdf. Minnesota Stormwater Steering Committee. 2008. Minnesota Stormwater Manual v. 2, January 2008. Minnesota Pollution Control Agency. Accessed online: http://www.pca.state.mn.us/publications/wq-strm9-01.pdf. Moore, P.A., Formica, S.J., Van Epps, M., Delaune, P.B. 2005. Effect of pasture renovation on nutrient runoff from pastures fertilized with manure. In: Proceedings of the 7th International Symposium on Livestock Environment, American Society of Agricultural Engineers, May 18-20, 2005, Beijing, China. p. 301. Naiman, R.J., Decamps, H., McClain, M.E. 2005. Riparia: ecology, conservation, and management of streamside communities. Burlington, MA: Elsevier Academic Press. 430 pp. Neitsch, S.L., Arnold, J.G., Kiniry, F.R., and Williams, J.R. 2005. Soil and Water Assessment Tool User’s Manual Version 2005. Grassland, Soil, and Water Research Laboratory, Temple, TX. Blackland Research Center, Temple, TX. Nürnberg, G.K., 1987. A comparison of internal phosphorus loads in lakes with anoxic hypolimnia: laboratory incubations versus hypolimnetic phosphorus accumulation. Limnological Oceanography. 32: 1160-1164. Nürnberg, G.K., 1994. Phosphorus release from anoxic sediments: What we know and how we can deal with it. Lemnetica. 10 (1): 1.4. Otak, Inc. 2007. Belfair urban growth area stormwater management plan. Accessed online: http://www.co.mason.wa.us/public_works/stormwater.php. Patty, L., Real, B., Gril, J.J. 1997. The use of grassed buffer strips to remove pesticides, nitrate, and soluble phosphorus compounds from runoff water. Pesticide Science 49(3):243-251. Pettersson, K., Bostrom, B. and Jacobsen, O. 1998. Phosphorus in Sediments – speciation and analysis. Hydrobiologia, 170. 91-101. Pitt, R. and Voorhees, J. 1995. Source Loading and Management Model (SLAMM) in: National conference on urban runoff management: enhancing urban watershed management at the local, county, and state levels. EPA publication EPA/625/R-95/003. Powell, J.M, McCrory, D.F., Jackson-Smith, D.B., and Saam, H. 2005. Manure collection and distribution on Wisconsin dairy farms. Journal of Environmental Quality 34:2036-2044. Prince George’s County Department of Environmental Resources Environmental Services Division (PGC-DERESD). 2007. The bioretention manual. Accessed online: http://www.princegeorgescountymd.gov/Government/AgencyIndex/DER/ESG/Bioretention/pdf/Bioretention%20Manual_2009%20Version.pdf.
Ramstack, J.M., S.C. Fritz, D.R. Engstrom, and S.A. Heiskary. 2003. The application of a diatom-based transfer function to evaluate regional water-quality trends in Minnesota since 1970. Journal of Paleolimnology 29: 79-94. Ramstack, J.M., S. Fritz, and D.R. Engstrom. 2004. Twentieth century water quality trends in Minnesota lakes compared with pre-settlement variability. Can. J. Fish. Aquat. Sci. 61: 561-576. Randall, G., Mulla, D., Rehm, G., Busman, L., Lamb, J., Schmitt, M. 1998. Phosphorus transport to and availability in surface waters. University of Minnesota Extension. FO-06796-GO. Rehm, G., Lamb, J., Schmitt, M., Randall, G., Busman, L. 2002. Agronomic and environmental management of phosphorus. University of Minnesota Extension publication WW-06797. Accessed online: http://www.extension.umn.edu/distribution/cropsystems/DC6797.html. Richfield Blacktop. 2010. Online Quick Quote for an Asphalt or Concrete Driveway in MN. Data from the website: http://www.richfieldblacktop.com/cost.html. Seeley, M., 2003. Climate trends: what are some implications for Minnesota’s air and water resources? Accessed online: http://www.pca.state.mn.us/air/pubs/climatechange-seeley1103.pdf. Standard Methods for the Examination of Water and Wastewater. 21st Edition. 2005. American Public Health Association (APHA), the American Water Works Association (AWWA), and the Water Environment Federation (WEF). Washington DC. Steffen, K. 2001. Soil survey of Hennepin County, Minnesota. United States Department of Agriculture, Natural Resources Conservation Service, in cooperation with the Minnesota Agricultural Experiment Station and Board of Water and Soil Resources. Accessed online: http://soildatamart.nrcs.usda.gov/Manuscripts/MN053/0/hennepin.pdf. Stormwater Manager’s Resource Center (SMRC). 2010a. Aquatic buffer fact sheet. Accessed online: http://www.stormwatercenter.net/. Stormwater Manager’s Resource Center (SMRC). 2010b. Stormwater Management Fact Sheet: Infiltration Basin. Accessed online: http://www.stormwatercenter.net/Assorted%20Fact%20Sheets/Tool6_Stormwater_Practices/Infiltration%20Practice/Infiltration%20Basin.htm. Tregoning, D. 2005. Pasture renovation and seeding. Accessed online: http://www.equinestudies.umd.edu/documents/UMSeminar/Tregoning.pdf. USACE (United States Army Corps of Engineers). 2006. Upper Mississippi River system environmental design handbook. Accessed online: http://www.mvp.usace.army.mil/environment/default.asp?pageid=74&subpageid=429. USDA-NRCS (U.S. Department of Agriculture. Natural Resources Conservation Service). 1964. National Engineering Handbook Section 4: Hydrology. USDA-NRCS (U.S. Department of Agriculture, Natural Resources Conservation Service). 1986. Urban Hydrology for Small Watersheds - Technical Release Number 55.
Lake Sarah Total Maximum Daily Load January 2011 DRAFT
68
USDA-NRCS (U.S. Department of Agriculture, Natural Resources Conservation Service). 2004. WinTR-55 Small Watershed Hydrology Model. Version 1.0. USDA-NRCS (U.S. Department of Agriculture, Natural Resources Conservation Service). 2008. Data downloaded from the website: http://www.nrcs.usda.gov/. Accessed 2008. USDOT-FHA (United States Department of Transportation Federal Highway Administration). 2010a. Stormwater Best Management Practices in an Ultra-Urban Setting: Selection and Monitoring Fact Sheet – Surface Sand Filters. Accessed online: http://www.fhwa.dot.gov/environment/ultraurb/3fs8.htm. USDOT-FHA (United States Department of Transportation Federal Highway Administration). 2010b. Stormwater Best Management Practices in an Ultra-Urban Setting: Selection and Monitoring Fact Sheet - Organic Media Filters. Accessed online: http://www.fhwa.dot.gov/environment/ultraurb/3fs9.htm. U.S. EPA 2000. Delivering Timely Water Quality Information to Your Community: The Lake Access-Minneapolis Project. EPA, Office of Research and Development. EPA/625/R-00/013, September 2000. USGS (United States Geologic Survey). 1998. Effectiveness of barnyard best management practices in Wisconsin. USGS Fact Sheet FS-051-98. Vlach, B.R., and Barten, J.M. 2007. Medicine Lake Endothall Treatment to Control Curlyleaf Pondweed 2004 - 2007. Status Report prepared by Three Rivers Park District. March 2008. Vadas, P.A. and White, M.J. Validating soil phosphorus routines in the SWAT model. U.S. Dairy Forage Research Center, unpublished paper. Walker, William W., "Empirical Methods for Predicting Eutrophication in Impoundments - Report 3: Model Refinements", prepared for Office, Chief of Engineers, U.S. Army, Washington, D.C., Technical Report E-81-9, U.S. Army Corps of Engineers, Waterways Experiment Station, Vicksburg, Mississippi, Draft 1983, published March 1985. Walker, W. W. (1996). "Simplified procedures for eutrophication assessment and prediction: User Manual," Instruction Report W-96-2, U.S. Army Engineer Waterways Experiment Station, Vicksburg, MS. (Updated September 1999). Wetzel, R. G. 1983. Limnology. 2nd Ed. Saunders College Publishing. Orlando, Florida. pp. 32. Williams, J.R. 1975. Sediment routing for agricultural watershed. Water Resources Bull. 11(5):965-974. Wilson, C. B. and W.W. Walker. 1989. Development of Lake Assessment Methods Based on the Aquatic Ecoregion Concept. Lake and Reservoir Management (1989 5(2): 11-22) Wortmann, C., Helmers, M., Mallarino, A., Barden, C., Devlin, D., Pierzynski, G., Lory, J., Massey, R., Holz, J., Shapiro, C., Kovar, J. Agricultural phosphorus management and water quality protection in the Midwest. 2005. University of Nebraska Extension Service Publication RP187. Accessed online: http://www.ianrpubs.unl.edu/epublic/live/rp187/build/rp187.pdf.
Appendix A - Comparison of General Water Quality Parameters between the East and West Bays of Lake Sarah in 2008
EpilimnionPhosphorus
0
50
100
150
200
Phosp
horu
s,μg
/l
Sarah East TP
Sarah East SRP
Sarah West TP
Sarah West SRP
MetalimnionPhosphorus
0
100
200
300
400
500
600
700
Phosp
horu
s,μg
/l
Sarah East TP
Sarah East SRP
Sarah West TP
Sarah West SRP
HypolimnionPhosphorus
0
200
400
600
800
1,000
1,200
1,400
4/2
9/2
008
5/1
3/2
008
5/2
7/2
008
6/1
0/2
008
6/2
4/2
008
7/8
/2008
7/2
2/2
008
8/5
/2008
8/1
9/2
008
9/2
/2008
9/1
6/2
008
9/3
0/2
008
10/1
4/2
008
Phosp
horu
s,μg
/l
Sarah East TP
Sarah East SRP
Sarah West TP
Sarah West SRP
APPROVED FINAL
Lake Sarah Surface Total Nitrogen
0
0.5
1
1.5
2
2.5
3
4/2
9/2
008
5/6
/2008
5/1
3/2
008
5/2
0/2
008
5/2
7/2
008
6/3
/2008
6/1
0/2
008
6/1
7/2
008
6/2
4/2
008
7/1
/2008
7/8
/2008
7/1
5/2
008
7/2
2/2
008
7/2
9/2
008
8/5
/2008
8/1
2/2
008
8/1
9/2
008
8/2
6/2
008
9/2
/2008
9/9
/2008
9/1
6/2
008
9/2
3/2
008
9/3
0/2
008
10/7
/2008
10/1
4/2
008
10/2
1/2
008
Tota
lN
itro
gen
,m
g/l
East TN
West TN
Total Nitrogen Profiles for Lake Sarah, 8/25/2008
0
2
4
6
8
10
12
14
16
18
0 0.5 1 1.5 2 2.5 3 3.5 4 4.5 5
Total Nitrogen, mg/l
Dep
th,m
East TNWest TN
APPROVED FINAL
Lake Sarah Chlorophyll-a
0
10
20
30
40
50
60
70
80
90
100
4/2
9/0
8
5/1
3/0
8
5/2
7/0
8
6/1
0/0
8
6/2
4/0
8
7/8
/08
7/2
2/0
8
8/5
/08
8/1
9/0
8
9/2
/08
9/1
6/0
8
9/3
0/0
8
10/1
4/0
8
Chlo
rophyll
a,
μg/l
East
West
APPROVED FINAL
Lake Sarah DO profiles, 4/29/2008
0
2
4
6
8
10
12
14
16
18
20
0 5 10 15 20 25
Dissolved Oxygen, mg/l
Depth
,m
East
West
Lake Sarah DO profiles, 6/23/2008
0
2
4
6
8
10
12
14
16
18
20
0 5 10 15
Dissolved Oxygen, mg/l
Depth
,m
East
West
Lake Sarah DO profiles, 7/7/2008
0
2
4
6
8
10
12
14
16
18
20
0 5 10 15
Dissolved Oxygen, mg/l
Depth
,m
East
West
Lake Sarah DO profiles, 5/27/2008
0
2
4
6
8
10
12
14
16
0 5 10 15
Dissolved Oxygen, mg/l
Depth
,m
East
West
Lake Sarah DO profiles, 6/10/2008
0
2
4
6
8
10
12
14
16
18
0 5 10 15
Dissolved Oxygen, mg/l
Depth
,m
East
West
Lake Sarah DO profiles, 5/12/2008
0
2
4
6
8
10
12
14
16
0 5 10 15
Dissolved Oxygen, mg/l
Depth
,m
East
West
APPROVED FINAL
Lake Sarah DO profiles, 8/18/2008
0
2
4
6
8
10
12
14
16
18
20
0 2 4 6 8 10
Dissolved Oxygen, mg/l
Depth
,m
East
West
Lake Sarah DO profiles, 8/25/2008
0
2
4
6
8
10
12
14
16
18
0 2 4 6 8
Dissolved Oxygen, mg/l
Depth
,m
East
West
Lake Sarah DO profiles, 9/3/2008
0
2
4
6
8
10
12
14
0 5 10 15
Dissolved Oxygen, mg/l
Depth
,m
East
West
Lake Sarah DO profiles, 9/15/2008
0
2
4
6
8
10
12
14
16
0 2 4 6 8
Dissolved Oxygen, mg/l
Depth
,m
10
East
West
Lake Sarah DO profiles, 8/4/2008
0
2
4
6
8
10
12
14
16
18
20
0 2 4 6 8
Dissolved Oxygen, mg/l
Depth
,m
10
East
West
Lake Sarah DO profiles, 7/21/2008
0
2
4
6
8
10
12
14
16
18
0 5 10 15
Dissolved Oxygen, mg/l
Depth
,m
East
West
APPROVED FINAL
Lake Sarah DO profiles, 9/29/2008
0
2
4
6
8
10
12
14
16
18
20
0 2 4 6 8 10
Dissolved Oxygen, mg/l
Depth
,m
East
West
Lake Sarah DO profiles, 10/21/2008
0
2
4
6
8
10
12
14
0 5 10
Dissolved Oxygen, mg/l
Depth
,m
15
East
West
APPROVED FINAL
Lake Sarah pH profiles, 4/29/2008
0
2
4
6
8
10
12
14
16
18
20
7.2 7.4 7.6 7.8 8
pH
Depth
,m
East
West
Lake Sarah pH profiles, 5/27/2008
0
2
4
6
8
10
12
14
16
8.8 8.9 9 9.1 9.2 9.3
pH
Depth
,m
East
West
Lake Sarah pH profiles, 6/10/2008
0
2
4
6
8
10
12
14
16
18
0 2 4 6 8
pH
Depth
,m
10
East
West
Lake Sarah pH profiles, 6/23/2008
0
2
4
6
8
10
12
14
16
18
20
6.5 7 7.5 8
pH
Depth
,m
East
West
Lake Sarah pH profiles, 7/7/2008
0
2
4
6
8
10
12
14
16
18
20
6.6 6.8 7 7.2 7.4 7.6 7.8
pH
Depth
,m
East
West
Lake Sarah pH profiles, 5/12/2008
0
2
4
6
8
10
12
14
16
8 8.2 8.4 8.6 8.8
pH
Depth
,m
9
East
West
APPROVED FINAL
Lake Sarah pH profiles, 7/21/2008
0
2
4
6
8
10
12
14
16
18
7.6 7.8 8 8.2 8.4
pH
Depth
,m
East
West
Lake Sarah pH profiles, 8/4/2008
0
2
4
6
8
10
12
14
16
18
20
7.2 7.4 7.6 7.8 8 8.2
pH
Depth
,m
East
West
Lake Sarah pH profiles, 9/15/2008
0
2
4
6
8
10
12
14
16
6.4 6.6 6.8 7 7.2
pH
Depth
,m
East
West
Lake Sarah pH profiles, 8/18/2008
0
2
4
6
8
10
12
14
16
18
20
7.2 7.4 7.6 7.8 8
pH
Depth
,m
East
West
Lake Sarah pH profiles, 8/25/2008
0
2
4
6
8
10
12
14
16
18
6.8 7 7.2 7.4 7.6 7.8
pH
Depth
,m
East
West
APPROVED FINAL
Lake Sarah pH profiles, 9/29/2008
0
2
4
6
8
10
12
14
16
18
20
6.5 7 7.5 8
pH
Depth
,m
East
West
Lake Sarah pH profiles, 10/21/2008
0
2
4
6
8
10
12
14
7.3 7.35 7.4 7.45 7.5 7.55
pH
Depth
,m
East
West
APPROVED FINAL
Lake Sarah Conductance profiles, 6/10/2008
0
2
4
6
8
10
12
14
16
18
420 440 460 480 500 520
Depth
,m
East
West
Lake Sarah Conductance profiles, 5/27/2008
0
2
4
6
8
10
12
14
16
470 480 490 500 510 520 530
Depth
,m
East
West
Lake Sarah Conductance profiles, 6/23/2008
0
2
4
6
8
10
12
14
16
18
20
300 350 400 450 500
Depth
,m
East
West
Lake Sarah Conductance profiles, 7/7/2008
0
2
4
6
8
10
12
14
16
18
20
300 350 400 450 500
Depth
,m
East
West
Lake Sarah Conductance profiles, 4/29/2008
0
2
4
6
8
10
12
14
16
18
20
270 280 290 300 310 320
Depth
,m
East
West
Spec ific Conductance, μS/cm Specific Conductance, μS/cm
Specific Conductance, μS/cm Specific Conductance, μS/cm
Specific Conductance, μS/cm Specific Conductance, μS/cm
Lake Sarah Conductance profiles, 5/12/2008
0
2
4
6
8
10
12
14
16
400 410 420 430 440
Depth
,m
East
West
APPROVED FINAL
Lake Sarah Conductance profiles, 7/21/2008
0
2
4
6
8
10
12
14
16
18
300 350 400 450 500 550
Depth
,m
East
West
Lake Sarah Conductance profiles, 8/4/2008
0
2
4
6
8
10
12
14
16
18
20
300 350 400 450 500 550
Depth
,m
East
West
Lake Sarah Conductance profiles, 8/18/2008
0
2
4
6
8
10
12
14
16
18
20
300 400 500 600
Depth
,m
East
West
Lake Sarah Conductance profiles, 8/25/2008
0
2
4
6
8
10
12
14
16
18
300 350 400 450 500 550
Depth
,m
East
West
Lake Sarah Conductance profiles, 9/3/2008
0
2
4
6
8
10
12
14
300 400 500 600 700 800
Depth
,m
East
West
Lake Sarah Conductance profiles, 9/15/2008
0
2
4
6
8
10
12
14
16
300 350 400 450 500 550
Depth
,m
East
West
Spec ific Conductance, μS/cm Specific Conductance, μS/cm
Specific Conductance, μS/cm Specific Conductance, μS/cm
Specific Conductance, μS/cm Specific Conductance, μS/cm
APPROVED FINAL
Lake Sarah Total Maximum Daily Load January 2011 DRAFT
A-12
Lake Sarah Conductance profiles, 9/29/2008
0
2
4
6
8
10
12
14
16
18
20
300 400 500 600
Depth
,m
East
West
Lake Sarah Conductance profiles, 10/21/2008
0
2
4
6
8
10
12
14
300 350 400 450
Depth
,m
East
West
Specific Conductance, μS/cm Spec ific Conductance, μS/cm
APPROVED FINAL
DRAFT
B-1
Appendix B – SWAT Input Parameters
Value Parameter Description Units Default Value Explanation File3 SMTMP Snow melt base temperature oC 1 Used to delay snowpack melting .bsn
2 SMFMX Melt factor for snow on June 21 mm H2O/oC-day 4.5 Used to slow snow melting .bsn
2.5 SMFMN Melt factor for snow on December 21 mm H2O/oC-day 4.5 Used to slow snow melting .bsn
0.25 TIMP Snow pack temperature lag factor 1 Used to delay snowpack melting .bsnPriestly-Taylor IPET PET method - Selection of potential
evapotranspiration method.bsn
0.92 ESCO Soil evaporation compensation factor 0.95 Adjusts soil evaporation .bsn1 SURLAG Surface runoff lag time days 4 Increased surface runoff travel time
to stream.bsn
0.0001 SPCON Linear parameter for calculating the maximum amount of sediment that can be reentrained during channel sediment routing
0.0001 No channel erosion or deposition .bsn
1.5 SPEXP Exponent parameter for calculating sediment reentrained in channel sediment routing
1 No channel erosion or deposition .bsn
0.23 PSP Phosphorus sorption coefficient 0.4 Changed partitioning between soluble and particulate phosphorus export
.bsn
0 IWQ In-stream water quality 1=model in-stream water quality
In-stream water quality was not modeled
.bsn
15 GW_DELAY Groundwater delay days 30 Used to calibrate baseflow response .gw
0.99 ALPHA_BF Baseflow alpha factor days 0.048 Used to calibrate stormflow recession
.gw
0.05 GWSOLP Concentration of soluble phosphorus in groundwater
mg P / L 0 Adjusted to literature value .gw
Default - 10% CN2 Initial SCS Curve Number II value varies Adjusted to increase infiltration .mgt0.25 USLE_P USLE support practice factor Adjusted to decrease phosphorus
and sediment loss from landscape.mgt
0.1 for roadways FILTERW Width of edge of field filter strip meters 0 Adjusted to match roadside swale phosphorus trapping
.mgt
2 IURBAN Urban simulation code; 1- USGS 2- Build up / wash off
1 Changed method to build up / wash off
.mgt
varies USLE_C Minimum CUSLE varies Increased CUSLE for Alfalfa and Brome to increase phosphorus loss to literature values
crop.dat
APPROVED FINAL
DRAFT
C-1
Appendix C - BATHTUB Model Input Data, Output Files and Diagnostic Parameters
Appendix C presents the details of the BATHTUB in-lake response modeling efforts. The model is presented in two forms to describe the process used to develop the TMDL and internal loading estimates (the process of model development is described in greater detail in Section III). The first version of the model presented below represents the initial calibration to existing conditions (including 1.79 mg P/m2/day of internal phosphorus loading above background levels). Since the in-lake goals of 40 μg/L (36 μg/L with the MOS) could not be achieved through a reduction in watershed load alone (the high rates of internal loading overwhelm the effect of changes in the watershed load), a second model was constructed to represent Lake Sarah if internal loading was controlled to the background levels implicit in the BATHTUB algorithms (i.e., the internal loading rate was set to zero). The load response relationship in the second BATHTUB model was used to identify the watershed load reductions necessary to achieve both the 40 and 36 μg/L goals. The difference in total annual internal loading between the two models was used to estimate the internal load reduction necessary to achieve in-lake goals. For each model, input data, output files and diagnostic parameters are presented.
APPROVED FINAL
DRAFT
C- 2
Lake SarahFile: C:\TMDL\Lake Sarah\Bathtub\Lake Sarah Bathtub TMDL Calibration 05-20-2010.btbDescription: Input Data Existing Conditions Calibration
Global Variables Mean CV Model Options Code DescriptionAveraging Period (yrs) 1 0.0 Conservative Substance 0 NOT COMPUTEDPrecipitation (m) 0.68 0.0 Phosphorus Balance 9 CANF& BACH, GENERALEvaporation (m) 0.69 0.0 Nitrogen Balance 0 NOT COMPUTEDStorage Increase (m) 0 0.0 Chlorophyll-a 5 P, JONES & BACHMAN
Secchi Depth 1 VS. CHLA & TURBIDITYAtmos. Loads (kg/km2-yr) Mean CV Dispersion 1 FISCHER-NUMERICConserv. Substance 0 0.00 Phosphorus Calibration 1 DECAY RATESTotal P 30 0.50 Nitrogen Calibration 1 DECAY RATESTotal N 1000 0.50 Error Analysis 1 MODEL & DATAOrtho P 15 0.50 Availability Factors 0 IGNOREInorganic N 500 0.50 Mass-Balance Tables 1 USE ESTIMATED CONCS
Output Destination 2 EXCEL WORKSHEET
Segment Morphometry Internal Loads ( mg/m2-day)Outflow Area Depth Length Mixed Depth (m) Hypol Depth Non-Algal Turb (m-1) Conserv. Total P Total N
Seg Name Segment Group km2 m km Mean CV Mean CV Mean CV Mean CV Mean CV Mean CV1 Lake Sarah 0 1 2.24 4.1 4.6 4 0 11 0 0.08 0 0 0 1.79 0 0 0
Segment Observed Water QualityConserv Total P (ppb) Total N (ppb) Chl-a (ppb) Secchi (m) Organic N (ppb) TP - Ortho P (ppb) HOD (ppb/day) MOD (ppb/day)
Seg Mean CV Mean CV Mean CV Mean CV Mean CV Mean CV Mean CV Mean CV Mean CV1 0 0 86.2 0 1800 0 50.7 0 1.34 0 0 0 14.7 0 114.2 0 27.2 0
Segment Calibration FactorsDispersion Rate Total P (ppb) Total N (ppb) Chl-a (ppb) Secchi (m) Organic N (ppb) TP - Ortho P (ppb) HOD (ppb/day) MOD (ppb/day)
Seg Mean CV Mean CV Mean CV Mean CV Mean CV Mean CV Mean CV Mean CV Mean CV1 1 0 1 0 1 0 1 0 1 0 1 0 1 0 1 0 1 0
Tributary DataDr Area Flow (hm3/yr) Conserv. Total P (ppb) Total N (ppb) Ortho P (ppb) Inorganic N (ppb)
Trib Trib Name Segment Type km2 Mean CV Mean CV Mean CV Mean CV Mean CV Mean CV1 Highway 55 1 1 9.63 1.46 0 0 0 302.9 0.1668 2449.37 0.06797 191.569 0.2011 0 02 County Road 11 1 1 4.439 1.03 0 0 0 305.5 0.08626 1684.14 0.1389 141.984 0.1672 0 03 North East 1 1 0.573 0.079 0 0 0 347 0 0 0 0 0 0 04 North 1 1 0.436 0.067 0 0 0 329.6 0 0 0 0 0 0 05 North West 1 1 0.061 0.015 0 0 0 201.3 0 0 0 0 0 0 06 South 1 1 0.745 0.07 0 0 0 330.8 0 0 0 0 0 0 07 Wedge 1 1 1.78 0.3 0 0 0 272.2 0 0 0 0 0 0 08 Direct 1 1 0.87 0.2 0 0 0 208.9 0 0 0 0 0 0 0
Model Coefficients Mean CVDispersion Rate 1.000 0.70Total Phosphorus 1.000 0.45Total Nitrogen 1.000 0.55Chl-a Model 0.930 0.26Secchi Model 1.800 0.10Organic N Model 1.000 0.12TP-OP Model 1.000 0.15HODv Model 1.000 0.15MODv Model 1.000 0.22Secchi/Chla Slope (m2/mg) 0.025 0.00Minimum Qs (m/yr) 0.100 0.00Chl-a Flushing Term 1.000 0.00Chl-a Temporal CV 0.620 0Avail. Factor - Total P 0.330 0Avail. Factor - Ortho P 1.930 0Avail. Factor - Total N 0.590 0Avail. Factor - Inorganic N 0.790 0
APPROVED FINAL
DRAFT
C-3
Lake SarahFile: C:\TMDL\Lake Sarah\Bathtub\Lake Sarah Bathtub TMDL Calibration 05-20-2010.btb
Segment Mass Balance Based Upon Predicted Concentrations
Component: TOTAL P Segment: 1 Lake SarahFlow Flow Load Load Conc
Trib Type Location hm3/yr %Total kg/yr %Total mg/m3
1 1 Highway 55 1.5 30.8% 442.2 17.8% 3032 1 County Road 11 1.0 21.7% 314.7 12.6% 3063 1 North East 0.1 1.7% 27.4 1.1% 3474 1 North 0.1 1.4% 22.1 0.9% 3305 1 North West 0.0 0.3% 3.0 0.1% 2016 1 South 0.1 1.5% 23.2 0.9% 3317 1 Wedge 0.3 6.3% 81.7 3.3% 2728 1 Direct 0.2 4.2% 41.8 1.7% 209
Lake Sarah Total Maximum Daily Load January 2011 DRAFT
C-5
Lake SarahFile: C:\TMDL\Lake Sarah\Bathtub\Lake Sarah Bathtub TMDL Calibration 05-20-2010.btbLoad / ResponseTributary: AllSegment: Area-Wtd MeanVariable: TOTAL P MG/M3
Lake SarahFile: C:\TMDL\Lake Sarah\Bathtub\Lake Sarah Bathtub TMDL Calibration 05-20-2010.btbDescription: Input Data TMDL Conditions without Internal Load
Global Variables Mean CV Model Options Code DescriptionAveraging Period (yrs) 1 0.0 Conservative Substance 0 NOT COMPUTEDPrecipitation (m) 0.68 0.0 Phosphorus Balance 9 CANF& BACH, GENERALEvaporation (m) 0.69 0.0 Nitrogen Balance 0 NOT COMPUTEDStorage Increase (m) 0 0.0 Chlorophyll-a 5 P, JONES & BACHMAN
Secchi Depth 1 VS. CHLA & TURBIDITYAtmos. Loads (kg/km2-yr) Mean CV Dispersion 1 FISCHER-NUMERICConserv. Substance 0 0.00 Phosphorus Calibration 1 DECAY RATESTotal P 30 0.50 Nitrogen Calibration 1 DECAY RATESTotal N 1000 0.50 Error Analysis 1 MODEL & DATAOrtho P 15 0.50 Availability Factors 0 IGNOREInorganic N 500 0.50 Mass-Balance Tables 1 USE ESTIMATED CONCS
Output Destination 2 EXCEL WORKSHEET
Segment Morphometry Internal Loads ( mg/m2-day)Outflow Area Depth Length Mixed Depth (m) Hypol Depth Non-Algal Turb (m-1) Conserv. Total P Total N
Seg Name Segment Group km2 m km Mean CV Mean CV Mean CV Mean CV Mean CV Mean CV1 Lake Sarah 0 1 2.24 4.1 4.6 4 0 11 0 0.08 0 0 0 0 0 0 0
Segment Observed Water QualityConserv Total P (ppb) Total N (ppb) Chl-a (ppb) Secchi (m) Organic N (ppb) TP - Ortho P (ppb) HOD (ppb/day) MOD (ppb/day)
Seg Mean CV Mean CV Mean CV Mean CV Mean CV Mean CV Mean CV Mean CV Mean CV1 0 0 86.2 0 1800 0 50.7 0 1.34 0 0 0 14.7 0 114.2 0 27.2 0
Segment Calibration FactorsDispersion Rate Total P (ppb) Total N (ppb) Chl-a (ppb) Secchi (m) Organic N (ppb) TP - Ortho P (ppb) HOD (ppb/day) MOD (ppb/day)
Seg Mean CV Mean CV Mean CV Mean CV Mean CV Mean CV Mean CV Mean CV Mean CV1 1 0 1 0 1 0 1 0 1 0 1 0 1 0 1 0 1 0
Tributary DataDr Area Flow (hm3/yr) Conserv. Total P (ppb) Total N (ppb) Ortho P (ppb) Inorganic N (ppb)
Trib Trib Name Segment Type km2 Mean CV Mean CV Mean CV Mean CV Mean CV Mean CV1 Highway 55 1 1 9.63 1.46 0 0 0 302.9 0.1668 2449.37 0.06797 191.569 0.2011 0 02 County Road 11 1 1 4.439 1.03 0 0 0 305.5 0.08626 1684.14 0.1389 141.984 0.1672 0 03 North East 1 1 0.573 0.079 0 0 0 347 0 0 0 0 0 0 04 North 1 1 0.436 0.067 0 0 0 329.6 0 0 0 0 0 0 05 North West 1 1 0.061 0.015 0 0 0 201.3 0 0 0 0 0 0 06 South 1 1 0.745 0.07 0 0 0 330.8 0 0 0 0 0 0 07 Wedge 1 1 1.78 0.3 0 0 0 272.2 0 0 0 0 0 0 08 Direct 1 1 0.87 0.2 0 0 0 208.9 0 0 0 0 0 0 0
Model Coefficients Mean CVDispersion Rate 1.000 0.70Total Phosphorus 1.000 0.45Total Nitrogen 1.000 0.55Chl-a Model 0.930 0.26Secchi Model 1.800 0.10Organic N Model 1.000 0.12TP-OP Model 1.000 0.15HODv Model 1.000 0.15MODv Model 1.000 0.22Secchi/Chla Slope (m2/mg) 0.025 0.00Minimum Qs (m/yr) 0.100 0.00Chl-a Flushing Term 1.000 0.00Chl-a Temporal CV 0.620 0Avail. Factor - Total P 0.330 0Avail. Factor - Ortho P 1.930 0Avail. Factor - Total N 0.590 0Avail. Factor - Inorganic N 0.790 0
APPROVED FINAL
DRAFT
C-10
Lake SarahFile: C:\TMDL\Lake Sarah\Bathtub\Lake Sarah Bathtub TMDL Calibration 05-20-2010.btb
Segment Mass Balance Based Upon Predicted Concentrations
Component: TOTAL P Segment: 1 Lake SarahFlow Flow Load Load Conc
Trib Type Location hm3/yr %Total kg/yr %Total mg/m3
1 1 Highway 55 1.5 30.8% 442.2 43.2% 3032 1 County Road 11 1.0 21.7% 314.7 30.8% 3063 1 North East 0.1 1.7% 27.4 2.7% 3474 1 North 0.1 1.4% 22.1 2.2% 3305 1 North West 0.0 0.3% 3.0 0.3% 2016 1 South 0.1 1.5% 23.2 2.3% 3317 1 Wedge 0.3 6.3% 81.7 8.0% 2728 1 Direct 0.2 4.2% 41.8 4.1% 209
Lake Sarah Total Maximum Daily Load January 2011 DRAFT
C-12
Lake SarahFile: C:\TMDL\Lake Sarah\Bathtub\Lake Sarah Bathtub TMDL Calibration 05-20-2010.btbLoad / ResponseTributary: AllSegment: Area-Wtd MeanVariable: TOTAL P MG/M3
Lake Sarah Total Maximum Daily Load January 2011 DRAFT
C-13
Lake SarahFile: C:\TMDL\Lake Sarah\Bathtub\Lake Sarah Bathtub TMDL Calibration 05-20-2010.btbLoad / Response: Bathtub Load Response without Internal Load for TMDLTributary: AllSegment: Area-Wtd MeanVariable: TOTAL P MG/M3
Lake Sarah Total Maximum Daily Load January 2011 DRAFT
C-16
Lake SarahFile: C:\TMDL\Lake Sarah\Bathtub\Lake Sarah Bathtub TMDL Calibration 05-20-2010.btbLoad / Response: Bathtub Load Response without Internal Load for TMDLTributary: AllSegment: Area-Wtd MeanVariable: SECCHI M
Appendix D - Summary of BMP Options for Individual Communities in the Lake Sarah Watershed
Row Crops Management Options
Best Management PracticeExpected reduction in total
phosphorus export Approximate cost
Row crop agricultureConversion from moldboard plow to continuous no-till 40-80% $20/acre 21 acres 8 - 17 $420Conversion from moldboard plow to ridge till 50% $20/acre 21 acres 11 $420Conversion from moldboard plow to chisel plow (at least 30% surface residue at planting)
30-35% $20/acre21 acres 6 $420
Conversion from chisel plow to continuous no-till 10%-50% $20/acre 21 acres 2 - 11 $420
Phosphate placement, broadcast to surface banding 20% $9/acre 42 acres 8 $378Phosphate placement, broadcast to injection/subsurface banding 30-50% $9/acre 42 acres 13 - 21 $378Nutrient management based on soil test phosphorus up to 40% $10/acre 95 acres up to 38 $950Setback zones for phosphorus fertilizer up to 25% $10/acre 15 acres up to 4 $150
Edge-of-field filter strips (buffers) 8-90% $210-$300/acre 42 acres 3 - 38 $1,323 - $1,890Hill contour farming 30% $7/acre 21 acres 6 $147Grassed waterways 22-89% $3700-$4300/acre 42 acres 9 - 37 $7,770 - $9,030Critical area planting up to 25% $0-$300/acre 42 acres up to 11 $12,600Stripcropping up to 70% $7-$25/acre 42 acres up to 29 $294 - $1,050
Cover cropping 7-15% $15/acre 60 acres 4 - 9 $900Add wheat into corn-soybean rotation 60% $30-$50/ac 42 acres 6 $1,260 - $2,100Add alfalfa into corn-soybean rotation 50% $30-$50/ac 42 acres 6 $1,260 - $2,100Permanent vegetative cover up to 80% $500/acre 95 acres up to 76 $47,500
IndependenceArea available for
treatmentTotal P reduction
possible, lbsCost for best possible
case
APPROVED FINAL
DRAFT
D-2
Best Management PracticeExpected reduction in total
phosphorus export Approximate cost
Row crop agricultureConversion from moldboard plow to continuous no-till 40-80% $20/acre 289 acres 115 - 231 $5,772Conversion from moldboard plow to ridge till 50% $20/acre 289 acres 144 $5,772Conversion from moldboard plow to chisel plow (at least 30% surface residue at planting)
30-35% $20/acre289 acres 87 $5,772
Conversion from chisel plow to continuous no-till 10%-50% $20/acre 289 acres 29 - 144 $5,772
Phosphate placement, broadcast to surface banding 20% $9/acre 577 acres 115 $5,195Phosphate placement, broadcast to injection/subsurface banding 30-50% $9/acre 577 acres 173 - 289 $5,195Nutrient management based on soil test phosphorus up to 40% $10/acre 661 acres up to 264 $6,610Setback zones for phosphorus fertilizer up to 25% $10/acre 192 acres up to 48 $1,924
Edge-of-field filter strips (buffers) 8-90% $210-$300/acre 577 acres 46 - 519 $18,182 - $25,974Hill contour farming 30% $7/acre 289 acres 87 $2,020Grassed waterways 22-89% $3700-$4300/acre 577 acres 127 - 514 $106,782 - $124,098Critical area planting up to 25% $0-$300/acre 577 acres up to 144 $173,160Stripcropping up to 70% $7-$25/acre 577 acres up to 404 $4,040 - $14,430
Cover cropping 7-15% $15/acre 602 acres 42 - 90 $9,026Add wheat into corn-soybean rotation 60% $30-$50/ac 577 acres 87 $17,316 - $28,860Add alfalfa into corn-soybean rotation 50% $30-$50/ac 577 acres 87 $17,316 - $28,860Permanent vegetative cover up to 80% $500/acre 661 acres up to 529 $330,500
Area available for treatment
Total P reduction possible, lbs
Cost for best possible case
Greenfield
APPROVED FINAL
DRAFT
D-3
Best Management PracticeExpected reduction in total
phosphorus export Approximate cost
Row crop agricultureConversion from moldboard plow to continuous no-till 40-80% $20/acre 114 acres 45 - 91 $2,271Conversion from moldboard plow to ridge till 50% $20/acre 114 acres 57 $2,271Conversion from moldboard plow to chisel plow (at least 30% surface residue at planting)
30-35% $20/acre114 acres 34 $2,271
Conversion from chisel plow to continuous no-till 10%-50% $20/acre 114 acres 11 - 57 $2,271
Phosphate placement, broadcast to surface banding 20% $9/acre 227 acres 45 $2,044Phosphate placement, broadcast to injection/subsurface banding 30-50% $9/acre 227 acres 68 - 114 $2,044Nutrient management based on soil test phosphorus up to 40% $10/acre 288 acres up to 115 $2,881Setback zones for phosphorus fertilizer up to 25% $10/acre 96 acres up to 24 $960
Edge-of-field filter strips (buffers) 8-90% $210-$300/acre 191 acres 15 - 172 $6,020 - $8,600Hill contour farming 30% $7/acre 114 acres 34 $795Grassed waterways 22-89% $3700-$4300/acre 227 acres 50 - 202 $42,014 - $48,827Critical area planting up to 25% $0-$300/acre 227 acres up to 57 $68,130Stripcropping up to 70% $7-$25/acre 191 acres up to 134 $1,338 - $4,778
Cover cropping 7-15% $15/acre 288 acres 20 - 43 $4,322Add wheat into corn-soybean rotation 60% $30-$50/ac 227 acres 34 $6,813 - $11,355Add alfalfa into corn-soybean rotation 50% $30-$50/ac 227 acres 34 $6,813 - $11,355Permanent vegetative cover up to 80% $500/acre 288 acres up to 230 $144,050
MedinaArea available for
treatmentTotal P reduction
possible, lbsCost for best possible
case
APPROVED FINAL
DRAFT
D-4
Feedlot/Manure Management Options
Best Management PracticeExpected reduction in
total phosphorus export Approximate costTotal P reduction
possible, lbsFeedlot/manure management
Combination of barnyard practices: runoff diversion, solids settling, filter strip, restricting cattle from the stream. Each operation with have a different set of needs.
85% $5,000 operation with <5 AU $15,000/operation with >5 AU 3 operations 76 $45,000
Use exclusion $15/acre Fencing $1.50-$5/ft Runoff diversion $3.50/ft Water and sediment control basin $4,000 Filter strip $210-300/acre Manure containment/composting $6000/facility,
$1000/individual systemManure application guidance (apply at low runoff potential) up to 60% $4-10/acre 53 acres 19 $211 - $527Subsurface inject manure instead of surface spread 20% $26/acre 53 acres 6 $1,370Incorporate manure before a runoff event 20% $7.50/acre 53 acres 6 $395Reduce dietary P fed to cattle to NRC recommendations up to 30% $425 3 operations 27 $1,275Intensive rotational grazing up to 50% varies 3 operations 45 variesPasture renovation 43% $150-$200/acre 20 acres 7 $3,000 - $4,000
IndependenceArea available for
treatmentCost for best possible
case
Best Management PracticeExpected reduction in total
phosphorus export Approximate cost
Row crop agricultureConversion from moldboard plow to continuous no-till 40-80% $20/acre 78 acres 31 - 62 $1,556Conversion from moldboard plow to ridge till 50% $20/acre 78 acres 39 $1,556Conversion from moldboard plow to chisel plow (at least 30% surface residue at planting)
30-35% $20/acre78 acres 23 $1,556
Conversion from chisel plow to continuous no-till 10%-50% $20/acre 78 acres 8 - 39 $1,556
Phosphate placement, broadcast to surface banding 20% $9/acre 156 acres 31 $1,400Phosphate placement, broadcast to injection/subsurface banding 30-50% $9/acre 156 acres 47 - 78 $1,400Nutrient management based on soil test phosphorus up to 40% $10/acre 160 acres up to 64 $1,597Setback zones for phosphorus fertilizer up to 25% $10/acre 52 acres up to 13 $519
Edge-of-field filter strips (buffers) 8-90% $210-$300/acre 156 acres 12 - 140 $4,901 - $7,002Hill contour farming 30% $7/acre 78 acres 23 $545Grassed waterways 22-89% $3700-$4300/acre 156 acres 34 - 138 $28,786 - $33,454Critical area planting up to 25% $0-$300/acre 156 acres up to 39 $46,680Stripcropping up to 70% $7-$25/acre 156 acres up to 109 $1,089 - $3,890
Cover cropping 7-15% $15/acre 157 acres 11 - 24 $2,355Add wheat into corn-soybean rotation 60% $30-$50/ac 156 acres 23 $4,668 - $7,780Add alfalfa into corn-soybean rotation 50% $30-$50/ac 156 acres 23 $4,668 - $7,780Permanent vegetative cover up to 80% $500/acre 160 acres up to 128 $79,850
Area available for treatment
Total P reduction possible, lbs
Cost for best possible case
Corcoran
APPROVED FINAL
DRAFT
D-5
Best Management PracticeExpected reduction in
total phosphorus export Approximate costTotal P reduction
possible, lbsFeedlot/manure management
Combination of barnyard practices: runoff diversion, solids settling, filter strip, restricting cattle from the stream. Each operation with have a different set of needs.
85% $5,000 operation with <5 AU $15,000/operation with >5 AU 3 operations 76 $45,000
Use exclusion $15/acre Fencing $1.50-$5/ft Runoff diversion $3.50/ft Water and sediment control basin $4,000 Filter strip $210-300/acre Manure containment/composting $6000/facility,
$1000/individual systemManure application guidance (apply at low runoff potential) up to 60% $4-10/acre 53 acres 19 $211 - $527Subsurface inject manure instead of surface spread 20% $26/acre 53 acres 6 $1,370Incorporate manure before a runoff event 20% $7.50/acre 53 acres 6 $395Reduce dietary P fed to cattle to NRC recommendations up to 30% $425 3 operations 27 $1,275Intensive rotational grazing up to 50% varies 3 operations 45 variesPasture renovation 43% $150-$200/acre 20 acres 7 $3,000 - $4,000
IndependenceArea available for
treatmentCost for best possible
case
Best Management PracticeExpected reduction in
total phosphorus export Approximate costTotal P reduction
possible, lbsFeedlot/manure management
Combination of barnyard practices: runoff diversion, solids settling, filter strip, restricting cattle from the stream. Each operation with have a different set of needs.
85% $5,000 operation with <5 AU $15,000/operation with >5 AU 3 operations 31 $35,000
Use exclusion $15/acre Fencing $1.50-$5/ft Runoff diversion $3.50/ft Water and sediment control basin $4,000 Filter strip $210-300/acre Manure containment/composting $6000/facility,
$1000/individual systemManure application guidance (apply at low runoff potential) up to 60% $4-10/acre 61 acres 22 $244 $610Subsurface inject manure instead of surface spread 20% $26/acre 61 acres 7 $1,586Incorporate manure before a runoff event 20% $7.50/acre 61 acres 7 $458Reduce dietary P fed to cattle to NRC recommendations up to 30% $425 3 operations 11 $1,275Intensive rotational grazing up to 50% varies 1 operation 9 variesPasture renovation 43% $150-$200/acre 14 acres 5 $2,100 - $2,800
MedinaArea available for
treatmentCost for best possible
case
APPROVED FINAL
DRAFT
D-6
Best Management PracticeExpected reduction in
total phosphorus export Approximate costTotal P reduction
possible, lbsFeedlot/manure management
Combination of barnyard practices: runoff diversion, solids settling, filter strip, restricting cattle from the stream. Each operation with have a different set of needs.
85% $5,000 operation with <5 AU $15,000/operation with >5 AU 29 operations 162 $215,000
Use exclusion $15/acre Fencing $1.50-$5/ft Runoff diversion $3.50/ft Water and sediment control basin $4,000 Filter strip $210-300/acre Manure containment/composting $6000/facility,
$1000/individual systemManure application guidance (apply at low runoff potential) up to 60% $4-10/acre 74 27 $296 - $740Subsurface inject manure instead of surface spread 20% $26/acre 74 9 $1,924Incorporate manure before a runoff event 20% $7.50/acre 74 9 $555Reduce dietary P fed to cattle to NRC recommendations up to 30% $425 29 operations 57 $12,325Intensive rotational grazing up to 50% varies 1 operation 15 variesPasture renovation 43% $150-$200/acre 110 acres 38 $16,500 - $22,000
Area available for treatment
Cost for best possible case
Greenfield
Best Management PracticeExpected reduction in
total phosphorus export Approximate costTotal P reduction
possible, lbsFeedlot/manure management
Combination of barnyard practices: runoff diversion, solids settling, filter strip, restricting cattle from the stream. Each operation with have a different set of needs.
85% $5,000 operation with <5 AU $15,000/operation with >5 AU 3 operations 28 $25,000
Use exclusion $15/acre Fencing $1.50-$5/ft Runoff diversion $3.50/ft Water and sediment control basin $4,000 Filter strip $210-300/acre Manure containment/composting $6000/facility,
$1000/individual systemManure application guidance (apply at low runoff potential) up to 60% $4-10/acre 4 acres 1 $16 - $40Subsurface inject manure instead of surface spread 20% $26/acre 4 acres 0 $104Incorporate manure before a runoff event 20% $7.50/acre 4 acres 0 $30Reduce dietary P fed to cattle to NRC recommendations up to 30% $425 3 operations 10 $1,275Intensive rotational grazing up to 50% varies 1 operation 13 variesPasture renovation 43% $150-$200/acre 13 acres 4 $1,950 - $2,600
Area available for treatment
Cost for best possible case
Corcoran
APPROVED FINAL
DRAFT
D-7
Residential and Commercial Land Management Options
Lake Sarah Total Maximum Daily Load January 2011 DRAFT
F-4
1Assumes that the entire littoral zone of the lake will be treated in Years 1 and 2 of the treatment, 50% of littoral zone will be treated in Year 3, and 25% of littoral zone would be treated in Years 4 and 5. 2Cost assumes alum application to the deep area of the lake (about 180 acres) plus the deep half of the littoral area of the lake (about 190 acres) with alum based on a per acre cost at the mid-point of the range presented ($1,300/ac.).
Appendix F – Summary of In-Lake BMP Options for Lake Sarah
Approximate Reduction in BMPBest Management Practice Total Phosphorus (lbs) Expenses/Acre Expenses/Year Number of Treatments Total Expenses EffectivenessControl of Curlyleaf Pondweed
Harvesting Minimal $280/Acre $52,500 Every Year $262,500/5yr. Minimal <10%Aquatic Herbicide Treatment 914 $220/Acre $82,500 max 5 $247,500 1 90%
Control of sediment-nutrient release during anoxia Alum Treatment2 3222 $1300/Acre 3 $481,000 1 $481,000 90%
Approximate CostsIn-Lake Management Options
3Actual dose and cost will likely be based on lab analysis of sediments in Lake Sarah and the desired longevity of treatment.