Page 1
Lake Tahoe TMDLScience Objectives
What are sources and relative contributions of “contaminants” causing clarity decline?
How much of a reduction is needed to achieve the desired conditions?
Page 2
Lake Clarity Model&
What Makes Us Think It’s Right
OR
Page 3
The Clarity Model History
1978 – DYRESM1996 – DLM-WQ1997 – INAUGURAL TAHOE SUMMIT
EPA WATERSHED GRANT2000 – FIRST PARTICLE SIZE DATA2002 – TMDL SCIENCE PROGRAM FUNDED MODELING/SCIENCE2004 – CLARITY MODEL PEER REVIEW2006 – REFINEMENT/CALIBRATION/VALIDATION
2007 – COMMENCING USE OF “FINAL” MODEL
Page 4
CLARITY MODEL
A PROCESS-BASED NUMERICAL MODEL
SEVERAL MODELS COMBINED INTO ONE:- HYDRODYNAMIC/THERMODYNAMIC MODEL- WATER QUALITY (ECOLOGICAL) MODEL- PARTICLE FATE MODEL- OPTICAL MODEL
IN ADDITION, IT HAS “INPUTS” FROM OTHER MODELS- WATERSHED MODEL- METEOROLOGY MODEL- ATMOSPHERIC MODEL
Page 5
Lake Tahoe Clarity Model
DLM Hydrodynamic/Thermodynamic Model
Tributaries
Climate,Precipitation
Land Use Atmospheric Deposition
AlgalGrowth
LakeN, P
Inorganic
Particles
LossLoss
SecchiDepth
LightScattering &Absorption
Groundwater
Tributaries
Climate,Precipitation
Land UseAtmospheric Deposition
Particle FateModel
OpticalModel
EcologicalModel
Page 6
INPUT VARIABLESCLIMATE
OUTFLOW
INFLOW – Q, N, P, PSD
ATMOSPHERIC – N, P, PSDGROUNDWATER – Q, N, P
BATHYMETRY
Page 7
Tetra Tech Watershed Model
Page 8
L
IGH
T
NU
TR
IEN
T
CY
CL
ING
STRATIFICATION & MIXING
AL
GA
L
GR
OW
TH
PAR
TIC
LE
DY
NA
MIC
S
ABSORPTION(i)SCATTERING (i)
SECCHI DEPTH
Clarity Model
Page 9
Base Case Do Nothing More in an Unchanging World
Page 10
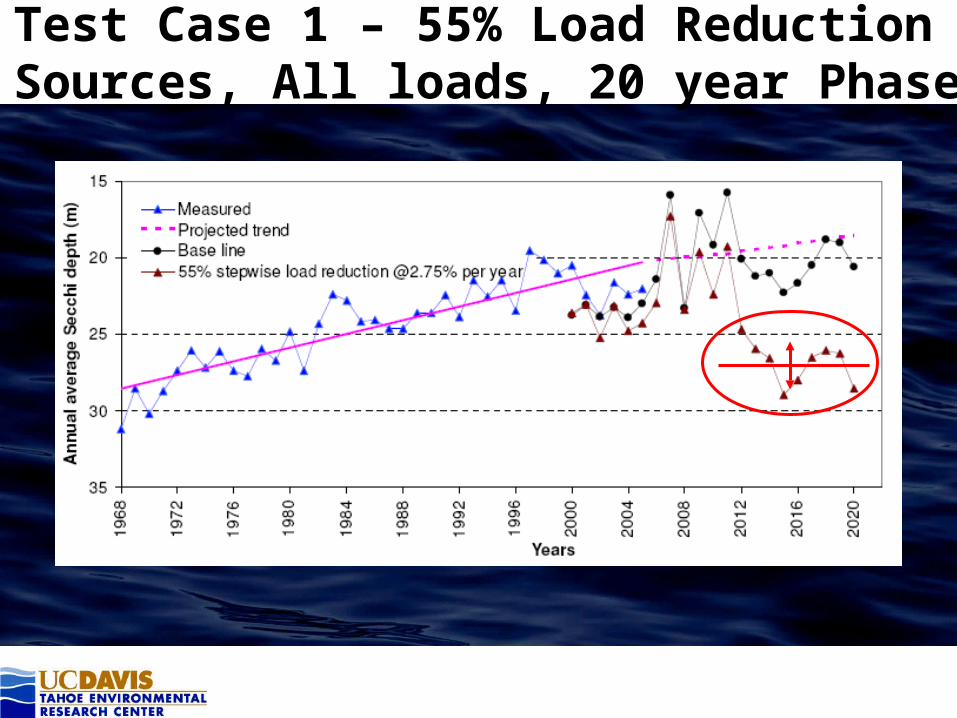
Test Case 1 – 55% Load ReductionAll Sources, All loads, 20 year Phase-in
Page 11
FINES, N, P
N, P ONLY
Combined ResultsAll Sources, All loads, 20 year Phase-in
Page 12
Test Case 2 – 75% Load ReductionUrban Sources, All loads, 20 year Phase-in
Page 13
Combined ResultsUrban Sources, All loads, 20 year Phase-in
Page 14
0
5
10
15
20
25
30
Atmosphere Urban Non-urban Stream Channelerosion
Shorelineerosion
Sec
chi d
epth
(m
)
0.5X Base case 2X
Sensitivity Analysis Loads
Particle load has largest impact on secchi depth
0.5X = half TMDL estimate 2X = double TMDL estimate
Page 15
Sensitivity Analysis Model Parameters
Coagulation rate
Light scattering (b*)
Algal growth rate
Secchi Depth
Secchi Depth
Secchi Depth
Page 16
Sensitivity Analysis Model Parameters
coagulation rate - light scattering – algal growth rate
0
5
10
15
20
25
300
-0-0
0-0
-L
0-0
-H
L-0
-0
H-0
-0
0-L
-0
0-H
-0
0-L
-L
0-L
-H
0-H
-L
0-L
-L
L-L
-L
L-L
-H
L-H
-L
L-H
-H
H-L
-L
H-L
-H
H-H
-L
H-H
-H
Scenario
Se
cc
hi
de
pth
(m
)
Mean/SD = 11%
L-L-H
Coagulation rateLight scattering
Algal growth rate
L = 0.75X 0 = X H = 1.25X
COV = MEAN/SD = 11%
Page 17
WHAT MAKES US THINK THE MODEL IS CORRECT?
Page 18
3 m in 2 years
LOOK AT THE RECORD
Page 19
STILL NOT CONVINCED?
Particles per ml
Sec
chi
Dep
th (
m)
Page 20
0 10 20 30 40 50 60 70 80 90100
0
10
20
30
4050
60
708090
100
0 10 20 304050 60 70 8090100% Nitrogen Reduction
% Phosphorus Reduction
% S
edim
ent
Red
uct
ion
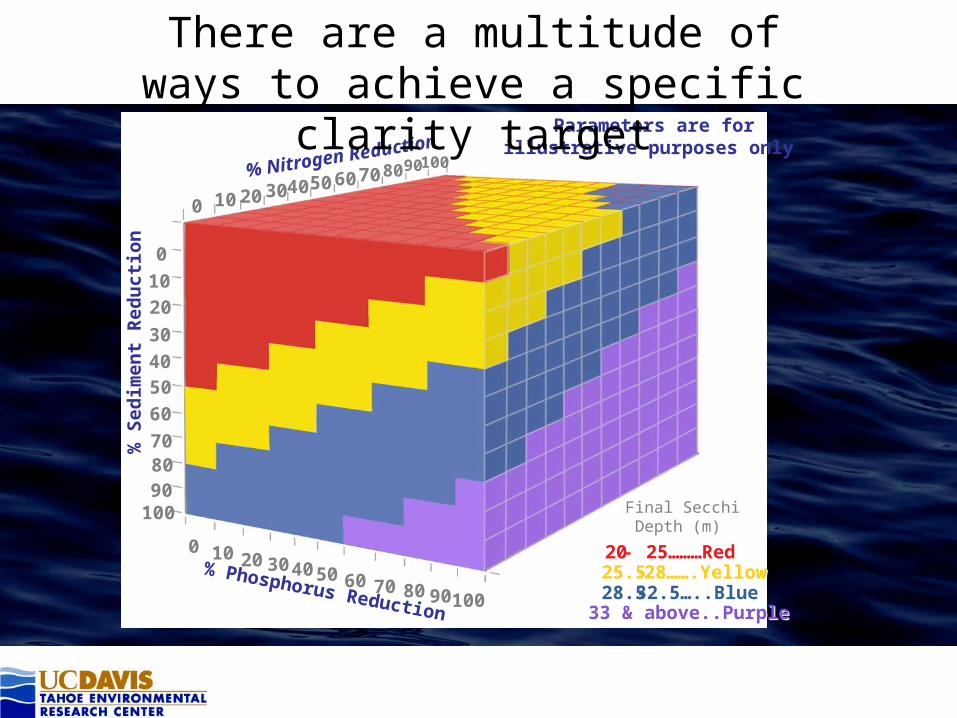
20- 25………Red25.5-28…….Yellow28.5-32.5…..Blue33 & above..Purple
20- 25………Red25.5-28…….Yellow28.5-32.5…..Blue33 & above..Purple
Final SecchiDepth (m)
Parameters are forillustrative purposes only
There are a multitude of ways to achieve a specific clarity target
Page 21
Process-based model – allows examination of the entire range of management, climate, disaster, growth etc. scenariosBuilt on an established and peer reviewed frameworkParticles dominate midlake clarity (nutrients secondary) – confirmed by dataUrban areas dominant source of particles – confirmed by dataModel results insensitive to uncertaintiesModel predicted level of pollutant load reduction to achieve clarity target is confirmed by dataThere are countless ways in which the desired load reductions can be achieved. The model can test them. The stakeholders must decide.
CONCLUSIONS
Page 23
16
18
20
22
24
26
28
30 100
1000
104
1980 1985 1990 1995 2000 2005
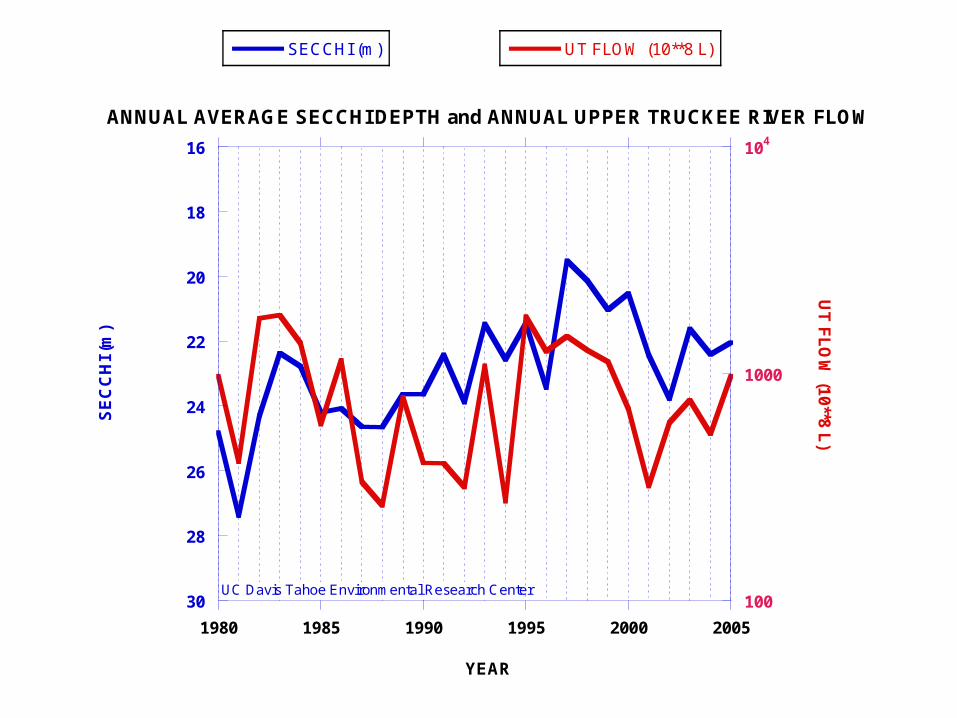
ANNUAL AVERAGE SECCHI DEPTH and ANNUAL UPPER TRUCKEE RIVER FLOW
SECCHI (m) UT FLOW (10**8 L)
SE
CC
HI
(m)
UT
FL
OW
(10
**8 L
)
YEAR
UC Davis Tahoe Environmental Research Center
Page 24
Runoff Fines Distribution Mass Land Use
Category Land Use Name or Watershed
(< 20 um) Residential_SF Residential_MF
Urban CICU 57 ± 18 % Roads_Primary Roads_Secondary General Creek
Non-Urban Blackwood Creek 13 ± 3 % Ward Creek Trout Creek
July 2006 Pathways Forum Received “Preliminary” Model Results
15
20
25
30
35
19
68
19
72
19
76
19
80
19
84
19
88
19
92
19
96
20
00
20
04
20
08
20
12
20
16
20
20
Years
Se
ch
hi
de
pth
(m
)
Measured Projected trend Base line 35% less fine and nutrients @1.75% per year
Calibration and validation years (1999-2004)
Fine Particle Numbers <20 µm5 x 1020/yr
Atmospheric Deposition
15%
Non-urban Upland
9%
Urban Upland 72%
Stream Channel Erosion
4%Shoreline Erosion
< 1%
Today there are different results – based on “Final” Model Results