196
Lake Whatcom Watershed Cooperative Drinking Water Protection Project Results of 1998 Water, Sediment and Fish Tissue Sampling September 1999 Publication No. 99-337

Lake Whatcom Watershed CooperativeDrinking Water Protection Project
Results of 1998 Water, Sedimentand Fish Tissue Sampling
September 1999Publication No. 99-337

The Department of Ecology is an equal opportunity agencyand does not discriminate on the basis of race, creed,
color, disability, age, religion, national origin,sex, marital status, disabled veteran's status,
Vietnam Era veteran's status, or sexual orientation.
If you have special accommodation needsor require this document in alternative format,
please contact theEnvironmental Assessment Program,
Shirley Rollins at (360) 407-6696 (voice).Ecology’s telecommunications device for the deaf
(TDD) number is (360) 407-6006.
For additional copies of this publication,please contact:
Department of EcologyPublications Distribution Office
PO Box 47600Olympia, WA 98504-7600
(360) 407-7472
Refer to Publication No. 99-337

Lake Whatcom Watershed CooperativeDrinking Water Protection Project
Results of 1998 Water, Sedimentand Fish Tissue Sampling
byDave Serdar and Dale Davis
Washington State Department of EcologyEnvironmental Assessment Program
andJulie Hirsch
Hirsch Consulting ServicesBellingham, Washington
Prepared forWashington State Department of Ecology Bellingham Field Office
Bruce Barbour, Project Manager
Waterbody Nos.Lake Whatcom – 122316448726 (formerly WA-01-9170)Whatcom Creek – 1224842487524 (formerly WA-01-3110)Austin Creek – 1223185487262; Cemetery Creek – 1224522487542Lincoln Creek – 1224582487542; Fever Creek – 1224580487548
September 1999Publication No. 99-337

This page is purposely left blank for duplex printing

Lake Whatcom Watershed Page i
Table of ContentsList of Figures......................................................................................................................iiList of Tables...................................................................................................................... ivAbstract................................................................................................................................ vPreface ................................................................................................................................viExecutive Summary...........................................................................................................viiRecommendations ..............................................................................................................xiAcknowledgements ...........................................................................................................xiiIntroduction ......................................................................................................................... 1
Background .................................................................................................................. 1Study Area.................................................................................................................... 1Objectives..................................................................................................................... 5
Methods ............................................................................................................................... 7Sampling Strategy and Site Selection .......................................................................... 7Sampling Methods........................................................................................................ 8Fish Tissue.................................................................................................................. 12Analytical Methods and Data Quality........................................................................ 13
Results and Discussion...................................................................................................... 15Runoff Conditions During Water Sampling............................................................... 15Fecal Coliforms in Water ........................................................................................... 15Conventional Parameters and Nutrients in Water and Sediments.............................. 17Metals in Water .......................................................................................................... 19Metals in Sediments ................................................................................................... 27Total Petroleum Hydrocarbons in Water and Sediments ........................................... 36Semivolatile Organics and Pesticides in Water.......................................................... 36Semivolatile Organics and Pesticides in Sediment .................................................... 44Metals, Pesticides, and PCBs in Fish Tissue.............................................................. 49
Summary and Conclusions ................................................................................................ 57Chemical and Biological Parameters of Concern ...................................................... 57Site-by-Site Summary ................................................................................................ 59
References ......................................................................................................................... 62Appendices

Page ii Lake Whatcom Watershed
List of Figures
Figure I-1: Study Area for the Lake Whatcom/Whatcom Creek Watershed Survey................ 2
Figure M-1: Location of Sampling Sites in the Lake Whatcom Watershed ............................... 9
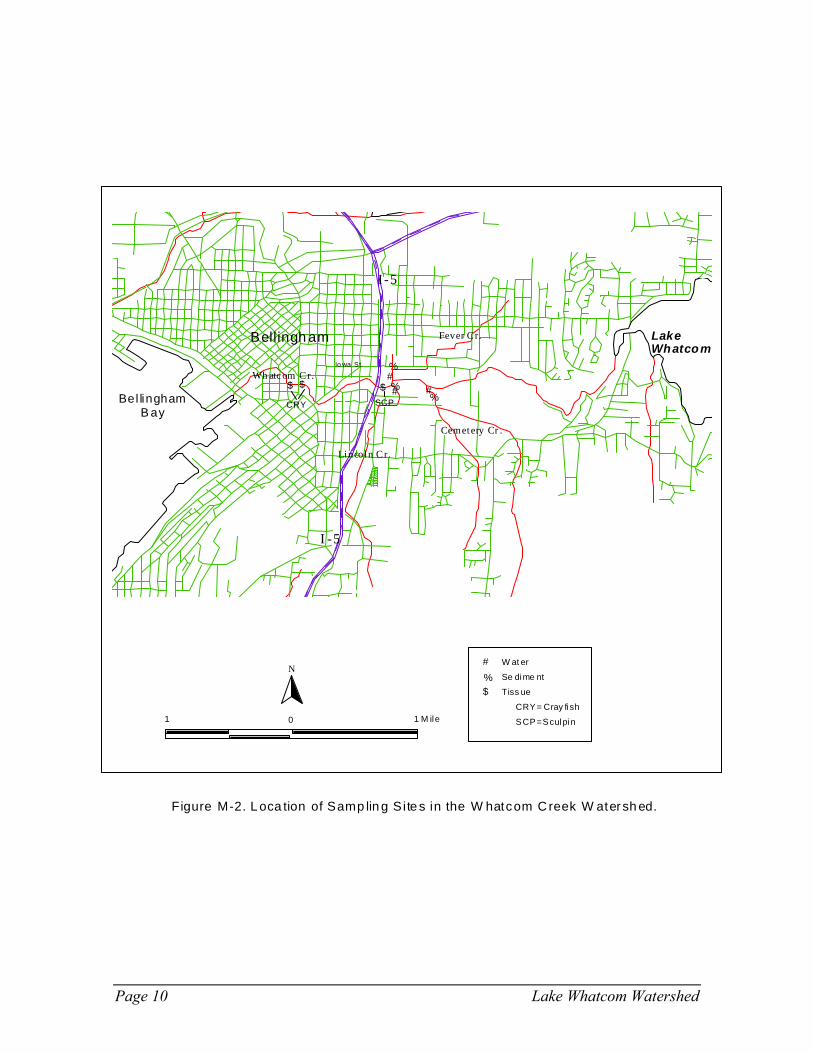
Figure M-2: Location of Sampling Sites in the Whatcom Creek Watershed............................ 10
Figure R-1: Fecal Coliform Levels in Water............................................................................ 16
Figure R-2: Concentrations of Total Suspended Solids (TSS)................................................. 18
Figure R-3: Total Organic Carbon (TOC) Concentrations in Water and Sediments ............... 18
Figure R-4: Total Phosporous (TP) Concentrations in Water and Sediments.......................... 20
Figure R-5: Total Persulfate Nitrogen (TPN) and Total Kjeldahl Nitrogen (TKN)................ 20
Figure R-6: Dissolved Cadmium Concentrations in Water...................................................... 21
Figure R-7: Dissolved Chromium Concentrations in Water .................................................... 21
Figure R-8: Dissolved Copper Concentrations in Water.......................................................... 23
Figure R-9: Dissolved Nickel Concentrations in Water ........................................................... 23
Figure R-10: Dissolved Lead Concentrations in Water.............................................................. 24
Figure R-11: Dissolved Zinc Concentrations in Water .............................................................. 24
Figure R-12: Total Recoverable Mercury Concentrations in Water .......................................... 25
Figure R-13: Concentration of Metals in Water Compared to 1997-1999 METRO Data ......... 26
Figure R-14: Arsenic Concentrations in Sediments ................................................................... 28
Figure R-15: Cadmium Concentrations in Sediments ................................................................ 28
Figure R-16: Chromium Concentrations in Sediments .............................................................. 29
Figure R-17: Copper Concentrations in Sediments .................................................................... 29
Figure R-18: Nickel Concentrations in Sediments ..................................................................... 30
Figure R-19: Lead Concentrations in Sediments........................................................................ 30
Figure R-20: Zinc Concentrations in Sediments ........................................................................ 31
Figure R-21: Mercury Concentrations in Sediments .................................................................. 31
Figure R-22a: Concentrations of Arsenic, Cadmium, and Chromium in SedimentsCompared to USGS Data ...................................................................................... 33
Figure R-22b: Concentrations of Copper, Nickel, and Lead in Sediments Compared toUSGS Data ............................................................................................................ 34
Figure R-22c: Concentrations of Zinc and Mercury in Sediments Compared toUSGS Data ............................................................................................................ 35
Figure R-23: Total Petroleum Hydrocarbons in Water and Sediments...................................... 37

Lake Whatcom Watershed Page iii
Figures (Cont’d)
Figure R-24: Frequency of Detection and Range of Concentrations of forSemivolatile Organics in Water ............................................................................ 38
Figure R-25: Frequency of Detection and Range of Concentrations of Pesticidesin Water................................................................................................................. 43
Figure R-26: Frequency of Detection and Range of Concentrations of Semivolatile Organics inSediments .............................................................................................................. 45
Page iv Lake Whatcom Watershed
List of Tables
Table ES-1: Sampling Sites, Land Use, and Contaminants of Concern ................................. viii
Table I-1: Drainage Areas and Land Use Types in the Study Area......................................... 3
Table M-1: Summary of Samples Analyzed .............................................................................. 8
Table M-2: Fish Species and Tissue Types Analyzed ............................................................. 12
Table R-1: Field Data for Stream Sampling............................................................................ 15
Table R-2: Summary of Fecal Coliform Data ......................................................................... 17
Table R-3: Freshwater Sediment Quality Values (FSQVs) .................................................... 32
Table R-4: Water Quality Criteria and Guidelines for Semivolatile Organics ....................... 40
Table R-5: Pesticides Detected in Water Samples .................................................................. 41
Table R-6: Water Quality Criteria and Guidelines for Pesticides ........................................... 44
Table R-7: Concentrations of Semivolatile Organics Detected in Sediments......................... 47
Table R-8: Freshwater Sediment Quality Values (FSQVs) .................................................... 48
Table R-9: Concentrations of Metals, Pesticides, and PCBs in Fish Tissues fromLake Whatcom ..................................................................................................... 53
Table R-10: Concentrations of Metals, Pesticides, and PCBs in Fish Tissues fromWhatcom Creek..................................................................................................... 54
Table R-11: Concentrations of Metals, Pesticides, and PCBs Detected in Whole Fish fromLake Whatcom and Whatcom Creek .................................................................... 55
Table R-12: EPA National Toxics Rule Criteria....................................................................... 56
Table S-1: Lake Whatcom and Whatcom Creek Study Sites and Contaminantsof Concern............................................................................................................. 58

Lake Whatcom Watershed Page v
AbstractThe Washington State Department of Ecology conducted a screening-level survey ofcontaminants in the Lake Whatcom and Whatcom Creek watersheds during 1998.Lake Whatcom is the sole drinking water source for more than 65,000 Whatcom Countyresidents, including the city of Bellingham. The project was funded as part of an EPA 319grant. Sampling included water collected from six streams or storm drains during spring andfall rainstorms; sediments from the same six stream/storm drain sites as well as from threesites in Lake Whatcom; and tissues from several species of fish found in Lake Whatcom andWhatcom Creek. Sites were assessed for a variety of contaminants including fecal coliformbacteria, nutrients, metals, total petroleum hydrocarbons, semivolatile organics (PAHs,phthalates, phenols), pesticides, and PCBs.
Results indicated that while some chemicals were present at levels of concern, overallcontamination was low-to-moderate and similar to other urban areas of the Puget Soundbasin. Contaminants of concern in water and sediments at one or more sites include fecalcoliform bacteria, copper, zinc, mercury, bis(2-ethylhexyl)phthalate, butylbenzylphthalate,di-n-octylphthalate, benzo(a)pyrene, benzofluoranthenes, chrysene,dibenzo(a,h)anthracene, indeno(1,2,3-c,d)pyrene, chlorpyrifos, diazinon, malathion, andpentachlorophenol. Mercury was elevated in one sample of smallmouth bass fromLake Whatcom. A number of chlorinated pesticides and PCBs were found in fish at lowconcentrations, although PCBs exceeded National Toxics Rule criteria.

Page vi Lake Whatcom Watershed
PrefaceThis report is written in the wake of the Olympic pipeline explosion at Whatcom Creek.More than 270,000 gallons of gasoline were spilled, more than a mile and a half of ripariancorridor and Whatcom Falls Park were burned, and three young lives were lost. In thefuture, the devastation of Whatcom Creek will be a reminder of the fragility of our lives,and the impact that our actions can reap upon the places and the people that we love. Wededicate this study to the spirit of stewardship, which surely will be the key to the healingand to the future of this community

Lake Whatcom Watershed Page vii
Executive SummaryLake Whatcom is a large, deep natural lake located in Whatcom County, Washington. Thelake's westernmost lobe is within the city of Bellingham where it drains via WhatcomCreek to Bellingham Bay, three miles to the west. Protection of Lake Whatcom waterquality is an ongoing concern because it is the sole drinking water source for more than65,000 Whatcom County residents, including the city of Bellingham. Increasingdevelopment pressure and population growth in the Lake Whatcom watershed haverecently elevated the importance of water quality protection.
To address concerns about water quality, the Washington State Department of Ecology(Ecology) conducted sampling during 1998 to support pollution prevention efforts in the LakeWhatcom and Whatcom Creek watersheds. Objectives of the project were to: a) screen fortoxic chemical input to Lake Whatcom and Whatcom Creek, b) collect data to supportongoing local Lake Whatcom and Whatcom Creek monitoring and habitat restoration efforts,and c) identify further monitoring/sampling needs.
Sampling included water collected from six streams or storm drains during spring and fallrainstorms, sediments from the same six stream/storm drain sites as well as from three sitesin Lake Whatcom, and tissues from several species of fish found in Lake Whatcom andWhatcom Creek. Land use in the sample drainages ranged from forestry to urban/industrial.Sites were assessed for a variety of contaminants including fecal coliform bacteria, nutrients,metals, total petroleum hydrocarbons, semivolatile organics (PAHs, phthalates, phenols),pesticides, and PCBs.
Results of water, sediment, and fish tissue analyses were compared to data from similarsurveys of urban streams in King County and the greater Puget Sound basin conducted bythe Municipality of Metropolitan Seattle (Metro) and the U.S. Geological Survey (USGS).Based on these comparisons, overall contamination of the Lake Whatcom and WhatcomCreek watersheds is low-to-moderate and appears similar to other urban areas of the PugetSound basin. However, some contaminants were elevated above standards or guidelines toprotect aquatic life or human health. While comparisons of results were made with urbanwatersheds and not with other drinking water reservoirs, even low levels of contaminationin a major water supply are a source of concern. Table ES-1 summarizes the contaminantsof concern at each sampling site.
Fecal coliform bacteria was the most common contaminant of concern, exceedingWashington State water quality standards at all sites where water was sampled. Waterquality violations for fecal coliforms have routinely been reported by the city ofBellingham and Western Washington University dating from as early as 1990. Fecalcoliform bacteria levels for the present study ranged from 470 to 11,000 colonies/100 mL.

Page viii Lake Whatcom Watershed
Table ES-1. Sampling Sites, Land Use, and Contaminants of Concern in theLake Whatcom and Whatcom Creek Watersheds.
Site Land Use in Drainage Contaminants of ConcernLake Whatcom WatershedLake Whatcom Basin 1 Urban residential Mercury, Indeno(1,2,3-c,d)pyrene, Dieldrin,
PCBsLake Whatcom Basin 2(DW Intake)
Urban residential Mercury, Dieldrin, PCBs
Lake Whatcom Basin 3 Forestry, Suburban/ruralresidential
Mercury, Dieldrin, PCBs
Park Place (drain, wet pondinfluent)
Urban residential Fecal coliforms, Zinc,Bis(2-ethylhexyl)phthalate,Butylbenzylphthalate,Di-n-octylphthalate, Benzo(a)pyrene,Benzo(b)fluoranthene,Benzo(k)fluorenthene, Chrysene,Dibenzo(a,h)anthracene, Diazinon
Cable Street (drain) Urban/suburban residential Fecal coliforms, Copper,Bis(2-ethylhexyl)phthalate, Benzo(a)pyrene,Chlorpyriphos, Diazinon, Malathion,Pentachlorophenol
Austin Creek Suburban residential Fecal coliforms
Whatcom Creek Watershed
Fever Creek Industrial, Urban residential Fecal coliforms, Copper, Zinc, Mercury,Bis(2-ethylhexyl)phthalate,Butylbenzylphthalate, Benzo(a)pyrene,Benzo(b)fluoranthene, Chrysene,Dibenzo(a,h)anthracene,Indeno(1,2,3-c,d)pyrene
Lincoln Creek Commercial, Urbanresidential
Fecal coliforms,Bis(2-ethylhexyl)phthalate,Butylbenzylphthalate, Benzo(a)pyrene,Benzo(b)fluoranthene, Chrysene,Indeno(1,2,3-c,d)pyrene
Cemetery Creek Public (undeveloped), Urbanresidential
Fecal coliforms, Butylbenzylphthalate,Indeno(1,2,3-c,d)pyrene, Diazinon
Copper, zinc, and mercury were the only metals found at concentrations of concern amongthe seven metals analyzed in water and 13 analyzed in sediments. Fever Creek had highconcentrations of all three of these metals, especially zinc. Dissolved zinc concentrationsin water exceeded chronic water quality standards during both sampling rounds and meetsthe criteria for Fever Creek to be added to the "water quality limited" [i.e. 303(d)] list.Copper and mercury in water also exceeded standards during one sampling round fromFever Creek, as did copper in water collected at Cable Street.

Lake Whatcom Watershed Page ix
Median concentrations of chromium, copper, and zinc from the Lake Whatcom/WhatcomCreek watersheds were higher than those reported for King County (Metro, unpublisheddata). However, average concentrations for most metals in sediments appear to be similarto representative urban streams or reference streams in the Puget Sound basin studied byUSGS (MacCoy and Black, 1998). Chromium and arsenic concentrations were generallylower than USGS reference sites.
Total petroleum hydrocarbons (TPH) were identified as heavy fuel oil (weathered BunkerC or #5 or #6 fuel oil) in water samples and lubricating oil (motor oil) in sediments. TPHconcentrations in water and sediments were elevated in the more heavily built-upresidential areas and were highest in Fever Creek (1.6 - 3.7 mg/L in water, 3,700 mg/kg insediment) which includes industrial land use. TPHs were not detected in sediments fromLake Whatcom or Austin Creek.
Maximum concentrations of semivolatile organic compounds in water were generally lessthan 1 µg/L. Exceptions to this include bis(2-ethylhexyl)phthalate, and caffeine, whichwere also the most frequently detected compounds. Total PAH concentrations in waterwere less than 1 µg/L except for Fever Creek where total PAH was 1.2 µg/L. However,PAHs were highest in sediments from Basin 1 of Lake Whatcom (14,600 µg/kg).
Concentrations of PAHs and other semivolatile organics were generally higher thanreference streams from the Puget Sound Basin. In all, five semivolatile organics - bis(2-ethylhexyl) phthalate, butylbenzylphthalate, di-n-octylphthalate, indeno(1,2,3-c,d)pyrene,and dibenzo(a,h)anthracene - were present at concentrations which may have an adverseaffect on aquatic organisms. Several PAHs - benzo(a)pyrene, benzofluoranthenes,chrysene, and indeno(1,2,3-c,d)pyrene - as well as bis(2-ethylhexyl)phthalate exceededNational Toxics Rule human health criteria in water, mainly at Lincoln Creek, FeverCreek, and Park Place. Austin Creek and Lake Whatcom Basins 2 & 3 were the only siteswhere one or more of these compounds were not present at concentrations of concern.
Fifteen pesticides were detected in water. Each sample from the four sites examined haddetectable levels of at least three pesticides. Although pesticide concentrations werelowest for organophosphorous pesticides – chlorpyriphos, diazinon, and malathion – thesewere the most likely to affect aquatic organisms due to their acute toxicity. These threepesticides were above recommended maximum concentrations (RMCs) to protect aquaticlife (NAS/NAE, 1973) in water samples from Cable Street. Cable Street also hadpentachlorophenol concentrations above criteria to protect human health. Park Place andCemetery Creek had concentrations of diazinon above RMCs.
The types and concentrations of pesticides detected in water bear a strong resemblance tocontamination of urban streams in King County (Voss et al., 1999) and are likely a resultof local home and garden use. Pesticides were not present at high enough concentrationsto be detected in sediments.
Chlorinated pesticides and PCBs, which were not analyzed in water or sediment samplesdue to their hydrophobic nature, were detected at low concentrations in fish tissues fromLake Whatcom and Whatcom Creek. Tissues analyzed were muscle fillet in kokanee and

Page x Lake Whatcom Watershed
smallmouth bass from Lake Whatcom, kokanee liver and whole longnose sucker fromLake Whatcom, whole sculpin from Whatcom Creek, and crayfish tail muscle fromWhatcom Creek. Concentrations were uniformly low (<10 µg/kg) except for PCBs inwhole sculpin (ΣPCB = 36 µg/kg). Comparisons to national surveys (Schmitt et al., 1990;EPA, 1992b) and data from Washington State (Davis and Serdar, 1996; Ecology, 1995)indicate that pesticide and PCB residues in fish represent sites with low levels ofcontamination. However, PCB-1254 and PCB-1260 in edible fish tissues fromLake Whatcom exceed National Toxics Rule criteria and will result in candidacy for the303(d) list.
Mercury was elevated to 0.5 mg/kg in one composite sample of large smallmouth bassfillet from Lake Whatcom. Although it is not unusual for a large piscivorous species tocontain relatively high concentrations of mercury, enrichment of mercury in sediment fromLake Whatcom Basin 1 (0.46 mg/kg) raises questions about possible external sources orbiogeochemical cycling of mercury within the lake.
Potential human health risks associated with mercury in Lake Whatcom fish cannot beassessed due to the paucity of residue data and lack of information on human exposure.However, mercury concentrations in the smallmouth bass sample are equal to or higherthan those which have led agencies outside Washington State to issue recommendations oradvisories to reduce health risks to human consumers (Foulke, 1994; MDH, 1994).

Lake Whatcom Watershed Page xi
Recommendations� Add the following waterbodies to the state's 303(d) list:
• Lake Whatcom for PCB-1254 and PCB-1260
• Austin Creek for fecal coliforms
• Cable Street drain for fecal coliforms and pentachlorophenol
• Park Place drain for fecal coliforms
• Cemetery Creek for fecal coliforms
• Lincoln Creek for fecal coliforms and benzo(a)pyrene
• Fever Creek for fecal coliforms and zinc
� Investigate sources of fecal coliforms in all drainages. Take steps and educate thepublic to reduce fecal coliforms from the various potential sources.
� Investigate the source(s) of pentachlorophenol in the Cable Street drain.
� Investigate the source(s) of copper, zinc, and mercury in Fever Creek.
� Investigate source(s) of mercury in Lake Whatcom sediments including potentialexternal sources. Conduct further sampling of Lake Whatcom sediments to detect"hotspots” or gradations in mercury levels and biogeochemical cycling of mercurywithin the lake.
� Collect and compile existing information on consumption of Lake Whatcom fish,especially smallmouth bass. Determine the feasibility of conducting a humanexposure assessment. Collect additional fish samples for mercury analysis if a riskassessment is warranted.
� Take steps to reduce further contamination of Lake Whatcom sediments via thePark Place and Cable Street drainages.
� Educate the public on wise and frugal use of home and garden pesticides in allresidential areas. Promote alternatives to pesticide use.

Page xii Lake Whatcom Watershed
AcknowledgementsWe appreciate the assistance we have received in conducting this study. First andforemost, we would like to thank those who collected water samples during rainstorms.Dave Rogowski and John Summers of Ecology’s Environmental Assessment Program(EAP) helped with collection of fish and sediments as did Jessica Jahns of theBellingham Field Office and Mindy Jo Bogden. Special thanks are also extended toDon Goheen and Pam Wallace of the Bellingham Public Works Department who madethe difficult installation of storm drain sediment traps seem like a snap. Karl Mueller,Washington Department of Fish and Wildlife (WDFW) and his crew provided hard-to-obtain fish samples from Lake Whatcom for which we are grateful. Staff at theManchester Environmental Laboratory exhibited the professional service we have cometo expect in tracking, analyzing, and reporting the sample results. We would especiallylike to thank Norm Olson for his work on method detection limits for pesticides andPCBs in fish tissues.
Throughout this project we received the full support and valuable advice from ProjectAdvisory Committee members Dr. Robin Matthews (WWU), Bill McCourt (city ofBellingham), as well as Richard Grout (Ecology), and Jim Johnston (WDFW). We wouldlike to acknowledge Steve Hood (Ecology), Robin Matthews, and Dale Norton (Ecology)for their peer review. Final word processing/formatting was done by Shirley Rollins forwhich we are grateful.

Lake Whatcom Watershed Page 1
Introduction
BackgroundLake Whatcom is a large, deep natural lake located in Whatcom County, Washington(Figure I-1). The lake's westernmost lobe is within the city of Bellingham where it drains viaWhatcom Creek to Bellingham Bay, three miles to the west. Protection of Lake Whatcomwater quality is an ongoing concern because it is the sole drinking water source for more than65,000 Whatcom County residents, including the city of Bellingham. More recently,increasing development pressure and population growth in the Lake Whatcom watershed haveelevated the importance of water quality protection.
To address concerns of water quality in the Lake Whatcom watershed, the Washington StateDepartment of Ecology (Ecology) received an Environmental Protection Agency (EPA) 319grant to conduct sampling in support of pollution prevention efforts in the Lake Whatcomand Whatcom Creek watersheds.
Study Area
Lake Whatcom Watershed
Table I-1 shows drainage areas and land use types in the study area. Lake Whatcom has asurface area of 4,992 acres with a watershed area of 32,251 acres. The lake can bemorphologically divided into three basins from north to south. Basin 1 is currently themost densely urbanized portion of the watershed, lying largely within Bellingham citylimits. Basins 2 and 3 lie mainly within the jurisdiction of Whatcom County and comprise94 percent of the watershed area. Basin 3, with a maximum depth of 328 feet, contains 96percent of the lake volume.
Land use in the Lake Whatcom Watershed is a mix of urban/suburban and forestry useswith approximately 30 percent of the watershed zoned for residential and commercialdevelopment. Approximately 11 percent of the watershed area has been developed forcommercial and residential uses (Whatcom County, 1999). Currently, there are 4,684 totaldwelling units in the watershed. Current city and county zoning will allow a 2.3-foldincrease to a total of 10,804 dwelling units. Basin 3 is dominated by commercial forestryuses with the exception of Sudden Valley, a suburban residential development. A portionof residential development in the watershed is served by septic systems.
The city of Bellingham supplies water to its residents and several additional water districtsfrom an intake located in Basin 2. Whatcom County Water District Number 10 servesSudden Valley from an intake in Basin 3. A small number of homes draw their drinkingwater directly from the lake.

Basin1
Basin2
Basin3
Whatcom Cr.Fever Cr.
Lincoln Cr.
Cemetery Cr.
Bellingham
BellinghamBay Lake
Whatcom
Austin Cr.
Park Place
Cable St.
DrinkingWaterIntake
Ñ
4 0 4 Miles
N
%
Figure I-1. Study Area for the Lake Whatcom/Whatcom Creek Watershed Survey.
Watershed Boundary
Page 2 Lake Whatcom Watershed

Lake Whatcom Watershed Page 3
Table I-1. Drainage Areas and Land Use Types in the Study Area.
Site WatershedDrainage Area
(acres)* Land Use TypesLake Basin 1 Lk. Whatcom 2,935 Urban residentialLake Basin 2(DW Intake)
Lk. Whatcom 945 Urban residential
Lake Basin 3 Lk. Whatcom27,371
Forestry, suburban/ruralresidential
Park Place (drain) Lk.Whatcom, Basin 1 98 Urban residentialCable Street (drain) Lk. Whatcom, Basin 2 200 Urban/suburban residentialAustin Cr. Lk. Whatcom, Basin 3 5,467 Suburban residentialFever Cr. Whatcom Cr.
1,260Industrial, urban residential
Lincoln Cr. Whatcom Cr.804
Commercial, urban residential
Cemetery Cr. Whatcom Cr.1,670
Public (undeveloped), urbanresidential
* Sources: Whatcom County Department of Planning and city of Bellingham Department of Public Works
Lake Whatcom waters are home to the only native kokanee trout stock in the state and tonative cutthroat trout (Jim Johnston, WDFW biologist, personal communication). It is adestination fishing spot, drawing smallmouth bass anglers and tournaments from acrossnorthwest Washington. The lake is also an attraction for primary contact recreationincluding public and private beaches and boating. Lake Whatcom was ranked third amongall publicly owned lakes in the state for its value to the public (Rector and Hallock, 1995),and it is recognized as a Shoreline of the State under the Shoreline Management Act of1971 (Chapter 172-26 WAC and RCW 90.58.200).
With continuing pressure to develop real estate in the Lake Whatcom watershed, there ismuch great deal of community concern for the potential threat posed to water quality andto public health due to urbanization. Known effects of urbanization include increasedinput of toxic chemicals, nutrients, and sediment and fecal material from street runoff,application of yard and garden chemicals, earth disturbance, and other activities that gohand in hand with increased development. While multiple uses are permitted in the LakeWhatcom Watershed, there are several other drinking supply basins in western Washingtonwhere development is not permitted. In Seattle’s Cedar and Tolt River watershedspermitted uses are limited to minimal recreational and supervised activities and currentlyonly limited recreational use is permitted in Everett’s watershed at Spada Lake (Flagel,1999; Berger, 1999). The Lake Whatcom Management Committee, consisting ofrepresentatives from Whatcom County, the city of Bellingham, and Water District #10recently hired a consultant to develop a comprehensive stormwater management strategy.To date, early action items have been identified.
Ecology has placed Lake Whatcom on the state’s 1998 proposed 303(d) list of impaired orthreatened water bodies for dissolved oxygen. It is of imminent concern that potentiallytoxic inputs could enter public water supplies, accumulate in fish, and further degrade theresource and its ability to support fish and wildlife populations.

Page 4 Lake Whatcom Watershed
Existing Water Quality Data for Lake Whatcom
The existing body of water quality data for Lake Whatcom includes three decades ofmonitoring conducted by Western Washington University (WWU), source watermonitoring for city of Bellingham and Water District #10 drinking water systems, andvarious master’s degree theses. Data collected by Dr. Robin Matthews at WWU from1988 to the present under the Lake Whatcom Monitoring Program is designed to detectchanges in lake productivity with an emphasis on dissolved oxygen and temperatureprofiling. These data indicate water quality degradation is occurring as reflected bysummer/fall oxygen depletion near the lake bottom in certain areas (Matthews et al., 1997).These data also indicate that the lake is phosphorous and nitrogen co-limited in Basin 1during the fall.
Elevated metals and nutrient concentrations have been detected in autumn samplescollected near the lake bottom during anoxic conditions in the fall. Streams drainingresidential areas in the Lake Whatcom watershed have shown elevated concentrations ofcoliforms (total and fecal), nutrients, suspended solids, conductivity, and metals whencompared with creeks in less developed watershed sites. Metals detection has occurredconsistently in tributary creek samples collected from 1990-1996 (Matthews et al., 1997).
Organic priority pollutants were measured in some Lake Whatcom tributary creeks in1986-1987 with detection of trace amounts of polycyclic aromatic hydrocarbons (PAHs),phenols and phthalates (Rector and Matthews, 1987). PAHs and metals were detected inlake surface microlayer samples in 1993 during a thesis study conducted by KarenClement-Christner (Christner, 1995). The city of Bellingham tests its source water forsynthetic organic chemicals and inorganic chemicals under the Safe drinking Water Act.Contaminants detected in at least one raw source water sample since 1983 includecadmium, lead, mercury, nickel, zinc, polychlorinated biphenyls (PCBs), and severalphthalate compounds (city of Bellingham, 1997).
Ongoing sampling includes source water monitoring required by EPA for public drinkingwater supplies and the City of Bellingham/WWU Lake Whatcom monitoring program.Under the Lake Whatcom monitoring program, water samples collected from the lake,selected streams, and a stormwater treatment pond are analyzed for conventionalparameters, microbiology, nutrients, and metals.
Whatcom Creek Watershed
Whatcom Creek is located within the city of Bellingham and flows 4.3 miles from theoutlet of Lake Whatcom, through downtown Bellingham to Bellingham Bay (Figure I-1).Flow is regulated by a dam operated by the city of Bellingham located near the lake outletfor the purpose of controlling the lake level.
Land use in the 5,800-acre Whatcom Creek watershed spans the spectrum of intensity fromparkland to industrial uses. The upper portion of the watershed is a mix of residential useand Whatcom Falls Park, the only freshwater shoreline in Bellingham given a naturaldesignation under the City’s Shoreline Management Master Program. Land use in the

Lake Whatcom Watershed Page 5
lower portion of the watershed has been developed for commercial and industrial uses.The Whatcom Creek sub-basins are also diverse in land use; from Cemetery Creek whichremains largely in public ownership, to industrialized Fever Creek, and Lincoln Creekwhich chiefly drains commercial areas.
Whatcom Creek provides habitat for native cutthroat trout, and hatchery spawned andreared chinook salmon, coho salmon, chum salmon, pink salmon and steelhead trout. TheMaritime Heritage Fish Hatchery (MHFH) is located near the mouth of Whatcom Creekand the Bellingham (State) rainbow trout hatchery is located upstream near the lake outlet.Potential for high quality salmon habitat has been identified, especially near the mouth ofCemetery Creek. Other recreational uses of Whatcom Creek include fishing and boating(kayaking) and swimming. Whatcom Creek is recognized as a Shoreline of the State underthe Shoreline Management Act of 1971 (Chapter 172-26 WAC and RCW 90.58.200).
Existing Water Quality Data for Whatcom Creek
Water quality degradation has been a factor in the decline of fish populations inWhatcom Creek and is a potential threat to public health. Whatcom Creek was listed onthe 1996 state 303(d) list of impaired water bodies for pentachlorophenol, temperatureand fecal coliform violations of water quality standards. It remains on the state’sproposed 303(d) list for 1998.
Past sampling efforts have identified water quality contaminants originating from urbanstormwater runoff. In 1981 a spill of pentachlorophenol tainted oil from the BrooksLumber facility resulted in a fish kill at the MHFH. Recurrent MHFH fish kills have beenlinked with metals and pentachlorophenol from stormwater tributaries and creek sediments(Kendra, 1988, Ostergaard, 1992). Kendra (1988) also detected PAHs and pesticides.Metals, PAHs, and chlorinated phenols were detected in Whatcom Creek during tributarydrainage basin studies (PTI, 1991a, Cubbage, 1994). Hirsch (1996) also detected metals inWhatcom Creek near its mouth. The city of Bellingham urban streams monitoring datashow state surface water quality violations (173-201A WAC) for fecal coliforms,temperature, and dissolved oxygen in more than 10 percent of samples collected between1991 and 1995 for Whatcom Creek and its tributaries.
ObjectivesProject objectives include:
• Screening for toxic chemical input to Lake Whatcom and Whatcom Creek bymeasuring concentrations in stormwater runoff, sediment, and fish, which may indicatepotential influences of residential, commercial, and industrial land uses.
• Collection of data to support ongoing local Lake Whatcom and Whatcom Creek
monitoring and habitat restoration efforts (as described previously).

Page 6 Lake Whatcom Watershed
• Identification of further monitoring/sampling needs. This sampling project isessentially a screening tool to identify potential problems that may require furthermonitoring and/or verification. Sampling will contribute to an existing body of data,which can be used to evaluate water quality trends and the effectiveness of pollutionprevention and restoration efforts over time.

Lake Whatcom Watershed Page 7
Methods
Sampling Strategy and Site SelectionTable M-1 summarizes the sampling strategy and chemical analysis for this project.Figures M-1 and M-2 show the general locations of each sampling site. A detaileddescription of each site is included in Appendix A
Water was sampled at six sites during the spring and fall of 1998 - three sites each intributaries to Lake Whatcom and Whatcom Creek. Sediment samples were collected ateach of the six water collection sites as were bottom sediments from each of the threebasins of Lake Whatcom. The Lake Whatcom sediment sites match locations used byWWU for water column sampling; one of these sites is located at Basin 2 at the city’sdrinking water intake. Water was sampled the Park Place drain upstream of the wet pondand sediment was sampled from cell #1 to represent untreated stormwater inputs. It wasnot the intent of this study to evaluate the efficacy of stormwater treatment.
Water and sediment samples were analyzed for metals, total petroleum hydrocarbons, andsemivolatile organic compounds since these groups of chemicals represent the mostcommon urban toxicants. Nutrients and fecal coliform bacteria are also commoncontaminants in urban runoff. Pesticide analysis was conducted on water draining toLake Whatcom since these areas are mostly residential where pesticide usage may besubstantial. Cemetery Creek water was also analyzed for pesticides. Due to the difficulty indetecting commonly used pesticides in sediments, analysis was limited to the two sites -Austin Creek and Park Place - thought to have the greatest probability of detection. Thesampling site for Austin Creek was near a golf course at the creek mouth. Water samplesprovide a snapshot of the type and concentrations of these toxicants being transported in awatershed whereas sediments may indicate the accumulation of contaminants over time.
Fish tissues were analyzed because they provide an excellent means to assess accumulationof certain chemicals over time and space. Analysis of fish tissues from Lake Whatcom andWhatcom Creek was limited to bioaccumulative chemicals; metals, chlorinated pesticides,and PCBs. Fillets of Lake Whatcom kokanee and smallmouth bass, and crayfish tailmuscle from Whatcom Creek were analyzed to identify possible human health concernsrelated to fish consumption.
Other tissues analyzed include whole longnose suckers and kokanee livers from Lake Whatcom,and whole sculpin from Whatcom Creek. These tissues provide a means for detectingcontaminants that may not be accumulating in fillet tissue.

Page 8 Lake Whatcom Watershed
Table M-1. Summary of Samples Analyzed for the Lake Whatcom/Whatcom Creek Watershed Survey.
Sample TypeNo. ofSites Metals
TotalPetroleum
HydrocarbonsSemivolatile
Organics Pesticides NutrientsFecal
Coliforms
Lake WhatcomSediments 3 XXX XXX XXX XXXFish Tissue (3 species)
multiplelocations
XXX XXX
Lake Whatcom TributariesStormwater 3 XXX XXX XXX XXX XXX XXXSediments 3 XXX XXX XXX XX XXX
Whatcom CreekFish Tissue(2 species)
2 XX XX
Whatcom Creek TributariesStormwater 3 XXX XXX XXX X XXX XXXSediments 3 XXX XXX XXX XXX
Note: The number of Xs represents the number of samples analyzed for a given parameter at a given site.
Sampling Methods
Stormwater
Water samples were collected during sizeable runoff events in June and October 1998.June was selected to capture representative late-spring runoff event during the window ofseasonal pesticide applications. October samples were collected to represent a “first flush”storm following the dry summer season. Criteria for sampling were several days of dryweather followed by precipitation of sufficient magnitude and duration to induceobservable increases in channel stage. Field measurements included temperature, pH, andflow.
Samples were collected using U.S. Geological Survey (USGS) depth-integrating samplersor a hand held bottle for water less than one foot deep. Depth-integrating samplers consistof a DH-81 adapter with a D-77 cap and priority pollutant-cleaned 1-L jar assembled sothat sample water contacted only Teflon or glass. Samples were collected by slowlylowering the sampler to the bottom and immediately raising the sampler at the same ratefrom three points (quarter point transects) across each site. Water was split into samplecontainers, filling each container one-third full from each quarter point. The depth-integrating samplers were cleaned prior to sampling by scrubbing with Liquinoxdetergent followed by sequential rinses with tap water, 10% nitric acid, deionized water,pesticide-grade acetone, and spectro-grade hexane.

Cable St#%
%#
Au stin Cr.#%
%
Lake Whatcom%
%
$$
K OK
KO K$
LN S
$LN S
$S MB
$S MB
$ SMB
$
$$
S MB
Pa rk Plac e
Wh atcom Cr.
2 0 2 Miles
N
N
N Wat er
Se dime nt
Tiss ue
KOK =Ko kanee
SMB=Sm al lmouth b as s
LNS =Longn os e suc ke r
#
%
$
Figure M-1. Loca tion of Sampling Site s in the La ke W hatcom W aters hed .
Lake Whatcom Watershed Page 9
Fever Cr.
Lincoln Cr.
Cemetery Cr .
Wh atc om Cr.
LakeWhatcom
I-5
I-5
Bellingh am
#%
%
Io wa St. %
##$ $ $
Bel linghamB ay
CRY SCP
N
Figure M-2. L oca tion of Samp lin g S ite s in the W hatcom Creek W atersh ed.
W at er
Se dime nt
Tiss ue
CRY= Cray fish
SCP=Sculpin
#
%
$
0 1 M ile1
Page 10 Lake Whatcom Watershed

Lake Whatcom Watershed Page 11
Sample bottles, preservatives, and holding times are listed in Appendix B. Metals sampleswere collected in Teflon bottle and acidified in the field. Dissolved metals samples werefiltered in the field using a vacuum pump and disposable 0.45 µm filters. Prior tosampling, Teflon bottles were acid-washed at Manchester Environmental Laboratory forlow-level metals analysis. Ultra-pure acid in pre-washed Teflon vials was used for metalspreservation. Organics samples were collected in glass bottles certified for low-levelorganics analysis with Teflon lid-liners. All stormwater samples were immediately put onice and delivered to the Manchester Environmental Laboratory within 24 hours ofcollection. Fecal coliform samples were collected in sterile bottles provided by the city ofBellingham, stored on ice, and analyzed at the accredited Water Treatment PlantLaboratory within 24 hours of sample collection.
Stream flow was measured using USGS Stream Gaging Procedure (196) and a SwofferModel 2100 TSR or a Marsh-McBirney, Inc. Model 201 flow meter. Austin Creek flowmeasurements were checked against a stream gage operated by WWU for the city ofBellingham. Park Place and Cable Street storm drain flows were measured using timedvolumes. Precipitation data were obtained from several rain gages operated by the city ofBellingham in the Lake Whatcom and Whatcom Creek watersheds. Temperature wasmeasured with a long-line thermometer. pH was measured using an Orion Model 250temperature compensating pH meter. Sample location coordinates were recorded using aMagellan NAV 5000 global positioning receiver.
Sediments
Lake Whatcom sediments were collected during September 1998. Sampling sites anddates were selected to correspond with WWU lake water sampling. Bottom sedimentswere collected using three casts from a 0.02 m2 stainless steel Ponar grab followingprocedures prescribed in the Puget Sound Protocols (PSEP, 1986). Depths were measuredusing an Apelco Model 265 depth sounder and locations were fixed using a MagellanNAV 5000 global positioning receiver (locations and depths shown in Appendix A). Thetop two centimeters not touching the sides of the grab were extracted and composited in astainless steel bucket. Samples from each grab were homogenized with a stainless steelspoon prior to filling the appropriate sample containers.
Sediment samples from tributary channels were collected at approximately the samelocations as stormwater. Sediments from Austin Creek, Cemetery Creek, Lincoln Creek,and Fever Creek were scooped directly from the channel bottom using a large stainlesssteel spoon. An attempt was made to sample the top two centimeters from fine-graineddeposits. Samples were homogenized in a stainless steel bucket prior to filling sample jars.Sediments from Park Place were collected from detention cell #1 using three casts from a4-in (i.d.) stainless steel pipe dredge. All sediment samples were placed on ice while in thefield, then frozen at -20 °C (except samples for grain size analysis) upon return to theEcology Headquarters building.
Sediment traps were used to collect suspended sediments from stormwater at the CableStreet site since suitable depositional material could not be found in this storm drainsystem. The sediment traps consisted of a 1-L pre-cleaned Teflon bottle mounted in astainless steel bracket fastened to the base of the Cable Street manhole. Two traps were

Page 12 Lake Whatcom Watershed
deployed at this site over a period of 20 weeks (7/15/98- 11/30/98). The traps weremounted away from the main stormwater channel to prevent their destruction and tocapture backwater material. The traps allow particulate matter to settle into the bottlesduring storm events and prevent material from flushing out during subsequent high flows.More detail on this type of sediment trap may be found in Wilson and Norton (1996).
Upon retrieval of the traps, the Teflon bottles were capped and placed on ice. Materialcaptured in the sediment traps was then centrifuged at 1000 RPM (225 x g) for 20 minutesto prevent loss of fine materials suspended in overlying water. The Cable Street trapsyielded a total of approximately 500 g of dewatered material. Following centrifugation,sediments were placed in sample containers and frozen at -20 °C (except samples for grainsize analysis).
Fish TissueMethods for collection and preparation of tissue samples were consistent with thoseoutlined by EPA (1995). Table M-2 summarizes the species and samples analyzed.Biological information and a description of the collection sites are shown in Appendix C.
Table M-2. Fish Species and Tissue Types Analyzed for Lake Whatcom/Whatcom Creek Watershed Survey.
Species Scientific name LocationTissuetype
No.compositesamples
No. fishpercomposite
Kokanee Oncorhynchus nerka Lk.What. F 2 7 - 8" " " L 1 15Smallmouthbass
Micropterus dolomieui " F 2 8
Longnosesucker
Catostomus catostomus " WB 1 7
Sculpin Cottus spp. What.Cr. WB 1 7Crayfish Pacifastacus leniusculus " TM 1 29
F=Fillet; L=Liver; WB=Whole Body; TM=Tail Muscle
Fish from Lake Whatcom were captured by electroshocking or gillnet during August-September 1998. Longnose suckers and some of the smallmouth bass were provided bythe Washington State Department of Fish and Wildlife. Sculpin from Whatcom Creekwere captured by electroshocking and crayfish were caught in wire-mesh crayfish traps.
Weights and measurements were recorded in the field. Fish were then assigned a samplenumber, double wrapped in aluminum foil, placed in double-layer zip-lock bags, and puton ice for transport to Ecology Headquarters for additional processing.
Once at Ecology HQ, fish were frozen at -20 °C except for kokanee. Fresh kokanee liverswere removed from all 15 fish captured and placed in a pre-cleaned 8-oz glass container,

Lake Whatcom Watershed Page 13
iced finely then homogenized using stainless steel scalpels and spatulas, then frozen.Kokanee carcasses were then re-wrapped in foil and frozen.
Composite fillet homogenates were prepared by removing the scales then removing theentire fillet from the left side of each fish. The fillet sample thus contained the skin andsome of the belly flap and dorsal fat, consistent with EPA recommendations for assessingchemical contaminants in fish (EPA, 1995).
Tissues were homogenized with three passes through a Kitchen-Aid food processor.Ground tissue was thoroughly mixed following each pass through the grinder. Whole fishand crayfish muscle samples were prepared in an identical manner.
All equipment used for tissue preparation was thoroughly washed with Liquinoxdetergent, rinsed in hot water, deionized water, pesticide-grade acetone, and finally,pesticide-grade hexane. This decontamination procedure was repeated between processingof each composite sample. Fully homogenized tissues were stored frozen (−20°C) in two8-oz. glass jars with Teflon lid liners certified for trace organics analysis; one containersubmitted for analysis and the other archived at -20 °C.
Analytical Methods and Data QualityAnalytical Methods are shown in Appendix B. Appendix D contains case narratives ondata quality from Manchester Environmental Laboratory chemists. Appendix E showsresults of field and laboratory replicate analyses and matrix spike recoveries.
Overall quality of the data for this project was good. The following discussion describesinstances where data quality did not meet control limits or otherwise required qualification.
Conventionals
Data quality for conventionals was good with few exceptions. Total suspended solids(TSS) and total phosphorous (TP) were imprecise in field replicate water samples (relativepercent differences [RPDs] = 115% and 74%, respectively). The differences were mostlikely due to sampling variability since laboratory duplicates for this parameter agreedwell. Although there are no data to further assess precision of water sampling, these dataillustrate the difficulty of obtaining consistent samples during runoff events.
Metals
Quality of the metals data was excellent in most cases. The following exceptions areconsidered minor and do not affect usability or interpretation of the data. Continuingcalibration standards in one batch of sediment samples were 113% and 132% of theoreticalfor silver. Therefore, silver data are qualified as estimates (j). Also for sediments,recoveries of thallium and antimony were low in one batch and lead recoveries were highin another batch resulting in qualifications of these data as estimates.

Page 14 Lake Whatcom Watershed
Organics
Quality of the organics data varied considerably. However, all data were useable exceptwhere qualified REJ (rejected). Deviations from QA/AC criteria are as follows:
• TPHs in some sediment samples may be slightly biased high based on higher thanacceptable control sample recoveries. Results are qualified (j).
• TPHs in water samples are qualified as estimates (j) because the weathered oil in thesesamples was not an identical match to the unweathered standards (Bunker C or #5 fueloil).
• All of the semivolatile organic analyses were plagued by low spike recoveries.Analytes with recoveries below 50% are qualified as estimates (j) and should beconsidered biased low. Data were rejected (REJ) where analyte recoveries were below10%. Analytes detected below the practical quantitation limit (PQL) are also qualifiedas estimates (j).
• Precision of semivolatile results from replicate field water samples was poor.However, duplicate analyses of matrix spikes showed good precision, suggesting ahigh degree of sampling/environmental variability for water samples.
• For water samples, the pentachlorophenol data produced using EPA 8085(chlorophenoxy herbicide analysis) was of higher quality then those produced usingEPA 8270 (semivolatile analysis). Pentachlorophenol results produced from thesemivolatile analysis method are therefore not included in the Results and Discussionsection of this report, although they are included in the Appendix F.
• Pesticides detected below the PQL are qualified as estimates (j).
• Results for triclopyr in spring water samples may be biased high based on matrix spikeresults.

Lake Whatcom Watershed Page 15
Results and DiscussionResults of all field parameters and laboratory analyses are in Appendix F.
Runoff Conditions During Water SamplingFall sampling occurred during a much larger rainfall event than the spring (Table R-1),although antecedent rainfall occurred for 99 hours at the time of the spring sampling and for50 hours preceding fall sampling. Rainfall for each event was within a range frequentlyexperienced in Whatcom County. Flows in Whatcom Creek drainages during fall samplingwere generally an order of magnitude higher than the spring. Because it is relativelyundeveloped, Austin Creek probably demonstrates a much broader hydrograph compared tothe compressed hydrographs of watersheds with more impervious surfaces. Temperatureand pH were fairly consistent in all cases and within ranges normally found in westernWashington streams.
Table R-1. Field Data for Stream Sampling.
Site Date TimeRainfall
(in.)*Discharge
(cfs)Temp.
(C) pH
Lake Whatcom Watershed
Austin Creek 6/24/98 11:35 0.14 9.77 13.6 7.5710/12/98 14:00 0.76 8.17 11.8 7.27
Park Place 6/24/98 08:35 0.15 0.13 13.9 7.8710/12/98 11:30 0.55 0.28 12.9 7.56
Cable Street 6/24/98 07:45 0.15 0.10 14.0 7.4510/12/98 10:30 0.50 > 0.2 13.0 7.26
Whatcom Creek Watershed
Cemetery Creek 6/24/98 09:45 0.13 0.90 13.9 7.7410/12/98 13:20 0.56 7.04 10.5 7.32
Lincoln Creek 6/24/98 09:00 0.13 0.40 15.0 7.5410/12/98 11:20 0.47 6.83 nm 7.33
Fever Creek 6/24/98 07:10 0.13 1.16 10.6 7.5910/12/98 09:45 0.42 11.88 13.1 7.42
*Cumulative rainfall from midnight to time of sampling nm=not measured
Fecal Coliforms in WaterFecal coliform densities in creek and storm drain samples are shown in Figure R-1.Densities ranged from 472 - 11,000 colonies/100 mL. Under 172-201A WAC, LakeWhatcom tributaries are subject to the Class AA water quality standard for fecal coliformswhere geometric means shall not exceed 50 colonies/100 mL and no more than 10% of

Figure R-1. Fecal Coliform Levels in Water
1
10
100
1000
10000
100000
Austin Cr. Cable St. Park Place Cemetery Cr. Lincoln Cr. Fever Cr.
Feca
l Col
iform
s (c
olon
ies/
100m
L)
Fecal Coliforms in Water 6/24/98 Fecal Coliforms in Water 10/12/98
Class AA Water Qual. Std. Class A Water Qual. Std.
Page 16 Lake Whatcom Watershed

Lake Whatcom Watershed Page 17
samples shall exceed 100 colonies/100mL. To comply with standards, fecal coliformlevels in tributaries of Whatcom Creek, a Class A waterbody, shall not exceed a geometricmean of 100 colonies/100mL and no more than 10% of samples shall exceed 200colonies/100mL. All waterbodies sampled during this project violated both Class A andClass AA standards for fecal coliforms.
Table R-2 shows a summary of fecal coliform data collected by local agencies forcomparison purposes. In light of historical data, all of the creeks sampled have consistentlyviolated the Class A Surface Water Quality Standard with 28-57% of samples exceeding 200fecal coliforms/100 mL.
High fecal coliform densities can pose potential public health risks for contact recreation.Historical data show some of the highest fecal coliform densities for Lake Whatcomtributaries and Bellingham urban streams during summer months when contact is mostlikely. Sources of fecal coliform input in urban and suburban areas include runoff from petwaste, hobby farms, failing septic systems, leaking sewage pipes, combined seweroverflows, and wildlife. Excessive fecal coliform input to Lake Whatcom is significantbecause it is an indicator of potential sewage sources which can result in increasedoccurrence of Cyrptosporidium, a pathogen of concern for surface drinking water supplies(Le Chevalier and Norton, 1995).
Table R-2. Summary of Fecal Coliform Data for Whatcom Creek and Lake Whatcom Tributaries Collected by the city of Bellingham and Western Washington University, Institute for Watershed Studies (fecal coliform colonies/100mL).
Site Period n Min. Max.Geometric
Mean %>200 %>400Austin Cr. 2/94-7/98a 10 4 804 76 30 30Austin Cr. 5/90-4/91b 30 7 5000 108 40 33Park Place 2/95-8/97a 6 13 1,192 188 50 33Park Place 5/90-4/91b 30 8 16,000 259 57 30Cemetery Cr. 1/95-2/99c 32 4 4,780 101 28 22Lincoln Cr. 1/95-2/99c 32 1 3,620 82 34 16Fever Cr. 1/95-2/99c 27 12 2,620 202 48 41Whatcom Cr. 1/95-2/99c 32 2 2,880 88 41 9a Matthews et al., 1999b Walker et al., 1992c city of Bellingham, 1999
Conventional Parameters and Nutrients in Waterand SedimentsFigures R-2 - R-5 show conventional parameters and nutrients measured in water andsediments. TSS concentrations were two to ten times higher in the fall samples, probablydue to higher flows but possibly also caused by flushing of residues built up over dryweather (Figure R-2). The distribution of grain sizes suggest that lake and impoundment(i.e. Park Place) sediments were primarily composed of silt and clay while streamsediments were mainly sand. The Cable Street sediment trap captured a relatively high

Figure R-2. Concentrations of Total Suspended Solids (TSS) in Water and Percent Fine Material (<62.5 um) in Sediments.
0
50
100
150
200
250
AustinCr.
LW#3 Cable St. DWIntake
ParkPlace
LW#1 CemeteryCr.
LincolnCr.
Fever Cr.
Tota
l Sus
pend
ed S
olid
s in
Wat
er (
mg/
L)
0
10
20
30
40
50
60
70
80
90
100
Per
cent
Fin
es in
Sed
imen
t (%
)
TSS in Water 6/24/98 TSS in Water 10/12/98 Percent Fines in Sediment
Figure R-3. Total Organic Carbon (TOC) Concentrations in Water and Sediments.
0
5
10
15
20
25
Austin Cr. LW#3 Cable St. DWIntake
ParkPlace
LW#1 CemeteryCr.
LincolnCr.
Fever Cr.
To
tal O
rgan
ic C
arb
on
in W
ater
(m
g/L
)
0.00
2.00
4.00
6.00
8.00
10.00
12.00
To
tal O
rgan
ic C
arb
on
In S
edim
ent
(%)
TOC in Water 6/24/98 TOC in Water 10/12/98 TOC in Sediment
Page 18 Lake Whatcom Watershed

Lake Whatcom Watershed Page 19
percentage of gravel (15%) which is not surprising given the high-energy hydraulics of thissystem. However, the trap also captured fine material (≤ 62.5 µm) similar to creeksediments with the exception of Fever Creek. Fine material made up 70% of the sampleweight at Fever Creek.
Total organic carbon (TOC) levels in Lake Whatcom were much higher in Basin 1compared to the other basins (Figure R-3). High TOC in Basin 1 may also be attributableto historic log storage even though the sediment sample from this location did not appearto contain excessive woody debris.
Nutrient concentrations were generally low to moderate. Total phosphorousconcentrations in water ranged from less than 0.010 mg/L to 0.165 mg/L (Figure R-4) andtotal persulfate nitrogen levels ranged from 0.364 mg/L to 1.4 mg/L (Figure R-5).Concentrations were within ranges reported for residential drainages in the Lake Whatcomwatershed by Matthews et al. (1999). In all cases TP was much higher in spring comparedto fall, possibly a reflection of seasonal fertilizer applications. Nitrogen was found athigher concentrations during the fall in the Lake Whatcom drainages and at equal or lowerconcentrations during the fall in the Whatcom Creek drainages.
Basin 1 sediments appear to be enriched with phosphorous from the Park Place drainagebased on results of both sediment and water samples. A pattern of increasing sedimentphosphorus concentrations appears to exist from Basin 3 to Basin 1, and also from theupper to lower Whatcom Creek drainage. This pattern also appears in sediment nitrogenconcentration in the Lake Whatcom basin, although nitrogen concentrations in watersamples do not appear to follow any specific gradient.
Single measurements of nutrients in surficial sediments cannot be used to determine nutrientflux, however hypolimnion conditions in Lake Whatcom Basin 1 were ideal for release ofsediment phosphorous and ammonia into the water column (Wetzel, 1983). When lakebottom sediments were sampled in late September, water overlying the sediments in LakeWhatcom Basin 1 had been anoxic for three months, and hypolimnetic total phosphorous andammonia were elevated indicating likely sediment nutrient release (Matthews et al., 1999).
Metals in WaterCreeks and storm drains were sampled for dissolved cadmium, chromium, copper, nickel,lead, zinc, and total recoverable mercury. Concentrations in water during storm events areshown in Figures R-6 - R-12. All six metals were detected at each location with theexception of cadmium which was detected at three of the six sample sites. Cadmiumdetections ranged from 0.026 µg/L to 0.11 µg/L, chromium ranged from 0.38 µg/L to 1.8µg/L, copper ranged from 0.70 µg/L to 9.0 µg/L, nickel ranged from 0.77 to 2.2 µg/L, leadranged from 0.027 µg/L to 0.33 µg/L, zinc ranged from 2.7 µg/L to 100 µg/L and mercurylevels ranged from 0.0039 µg/L to 0.015 µg/L.
Concentrations were generally highest in Fever Creek and lowest in Austin Creek,especially during spring sampling. Springtime water samples from the Whatcom Creekdrainages tended to have higher metals concentrations than those from the Lake Whatcom

Figure R-4. Total Phosporous (TP) Concentrations in Water and Sediments.
0
0.02
0.04
0.06
0.08
0.1
0.12
0.14
0.16
0.18
AustinCr.
Cable St. ParkPlace
CemeteryCr.
Fever Cr.
To
tal P
ho
sph
oro
us
in W
ater
(m
g/L
)
0
500
1000
1500
2000
2500
To
tal P
ho
sph
oro
us
in S
edim
ent
(mg
/kg
, dw
)
TP in Water 6/24/98 TP in Water 10/12/98 TP in Sediment
ND NDNot
AnalyzedNot
AnalyzedNot
Analyzed
Figure R-5. Total Persulfate Nitrogen (TPN) in Water and Total Kjeldahl Nitrogen (TKN) in Sediments.
0
0.2
0.4
0.6
0.8
1
1.2
1.4
1.6
AustinCr.
LW#3 Cable St. DWIntake
ParkPlace
LW#1 CemeteryCr.
LincolnCr.
Fever Cr.
To
tal P
ersu
lfat
e N
itro
gen
in W
ater
(m
g/L
)
0
1000
2000
3000
4000
5000
6000
7000
To
tal K
jeld
ahl N
itro
gen
in S
edim
ent
(mg
/kg
, dw
)
TPN in Water 6/24/98 TPN in Water 10/12/98 TKN in Sediment
NotAnalyzed
NotAnalyzed
NotAnalyzed
Page 20 Lake Whatcom Watershed

Figure R-6. Dissolved Cadmium Concentrations in Water.
0
0.02
0.04
0.06
0.08
0.1
0.12
Austin Creek Cable Street Park Place CemeteryCreek
Lincoln Creek Fever Creek
Dis
solv
ed C
adm
ium
(ug
/L)
Water Conc. 6/24/98 Water Conc. 10/12/98 Detection Limit
ND ND NDN
ND ND ND ND
Figure R-7. Dissolved Chromium Concentrations in Water.
0
0.4
0.8
1.2
1.6
2
2.4
Austin Creek Cable Street Park Place CemeteryCreek
Lincoln Creek Fever Creek
Dis
solv
ed C
hro
miu
m (u
g/L
)
Water Conc. 6/24/98 Water Conc. 10/12/98
Lake Whatcom Watershed Page 21

Page 22 Lake Whatcom Watershed
basin. A pattern of increasing metals concentrations was evident in the spring samplesfrom the Lake Whatcom Basin where Austin Creek < Cable Street < Park Place and alsofrom the Whatcom Creek drainages where Cemetery Creek < Lincoln Creek < FeverCreek. These patterns did not appear to hold for fall samples where Cable Street had thehighest concentrations of chromium, nickel, and lead among all sites.
With few exceptions, metals concentrations in the less-developed Austin Creek andCemetery Creek were lowest in their respective watersheds. One notable inconsistencywas in the total recoverable mercury concentrations in fall samples which were highest inAustin and Cemetery Creeks. Elevated mercury in these samples could not be explainedby TSS concentrations since they were among the lowest found during this sampling event.
The significance of metals in water was assessed by comparison to the Washington waterquality standards for the protection of aquatic life (WAC 173-201A). Water quality standardsshown in Figures R-8 and R-10 - R-12 are for chronic exposure, defined as a 4-day averagenot to be exceeded more than once every three years on average, and are hardness-dependentexcept for mercury. Standards for cadmium, chromium, and nickel were much higher thanconcentrations found during this survey and are therefore not shown.
Copper, mercury, and zinc concentrations in water exceeded standards from at least onesite each. Dissolved copper at Cable Street during fall sampling was slightly above thestandard; Fever Creek was the only other site with an exceedance for copper. Fever Creekexceeded water quality standards for copper and mercury during spring, and zinc in bothfall and spring.
Metals concentrations for Austin Creek and Park Place were compared with samplescollected annually from 1995-1997 (Matthews et al., 1998) by translating total recoverablemetals to dissolved metals using Ecology’s default translators. Although detection limitsfor historical data were often inadequate for comparison, when detected, copperconcentrations were within the range found during this study, while lead and zinc levelswere up to 10 times greater for the 1995-1997 data. Cadmium, copper, lead and mercuryhave been detected in Whatcom Creek (city of Bellingham, 1999) at levels higher thanconcentrations found for tributaries in this study, however, detected zinc concentrationsappear comparable. Discrepancies in metals concentrations among studies may beattributed to variations among methods and intrinsic data variability. Toxic metals werelisted as the most prevalent priority pollutant constituents in urban runoff by the NationalUrban Runoff Program (EPA, 1983). Possible sources may include atmosphericdeposition from vehicles and industry, tire wear, corrosion products, industrial discharges,and erosion of geologic deposits.
Concentrations from all sites were also compared to data collected by the Municipality ofMetropolitan Seattle (Metro) during winter 1997 to winter 1999 (Metro, unpublisheddata)(Figure R-13). The Metro data represent samples from 30 stream sites in King County,the most heavily populated and urbanized county in Washington. Median concentrations ofdissolved chromium, copper, and zinc from the present survey were about double those fromMetro. For copper and zinc, maximum concentrations were also higher than those reportedby Metro. Median nickel concentrations were similar. Comparisons for cadmium, lead, and

Figure R-8. Dissolved Copper Concentrations in Water.
0
2
4
6
8
10
12
14
Austin Creek Cable Street Park Place CemeteryCreek
Lincoln Creek Fever Creek
Dis
solv
ed C
op
per
(u
g/L
)
Water Conc. 6/24/98 Water Conc. 10/12/98
Water Qual. Std. 6/24/98 Water Qual. Std. 10/12/98
Figure R-9. Dissolved Nickel Concentrations in Water.
0
0.4
0.8
1.2
1.6
2
2.4
Austin Creek Cable Street Park Place CemeteryCreek
Lincoln Creek Fever Creek
Dis
solv
ed N
icke
l (u
g/L
)
Water Conc. 6/24/98 Water Conc. 10/12/98
Lake Whatcom Watershed Page 23

Figure R-10. Dissolved Lead Concentrations in Water.
0
0.5
1
1.5
2
2.5
3
Austin Creek Cable Street Park Place CemeteryCreek
Lincoln Creek Fever Creek
Dis
solv
ed L
ead
(u
g/L
)
Water Conc. 6/24/98 Water Conc. 10/12/98
Water Qual. Std. 6/24/98 Water Qual. Std. 10/12/98
Figure R-11. Dissolved Zinc Concentrations in Water.
0
20
40
60
80
100
120
Austin Creek Cable Street Park Place CemeteryCreek
Lincoln Creek Fever Creek
Dis
solv
ed Z
inc
(ug
/L)
Water Conc. 6/24/98 Water Conc. 10/12/98
Water Qual. Std. 6/24/98 Water Qual. Std. 10/12/98
Page 24 Lake Whatcom Watershed

Figure R-12. Total Recoverable Mercury Concentrations in Water.
0
0.002
0.004
0.006
0.008
0.01
0.012
0.014
0.016
Austin Creek Cable Street Park Place CemeteryCreek
Lincoln Creek Fever Creek
To
tal R
eco
vera
ble
Mer
cury
(ug
/L)
Water Conc. 6/24/98 Water Conc. 10/12/98 Water Conc. Water Qual. Std.
N
Lake Whatcom Watershed Page 25

Figure R-13. Concentrations of Metals in Water Compared to 1997-1999 METRO Data (n=142 for Cd,Cr,Cu,Pb,Ni,Zn; n=286 for Hg).
0.001
0.01
0.1
1
10
100
DissolvedCadmium
DissolvedChromium
DissolvedCopper
DissolvedNickel
DissolvedLead
DissolvedZinc
Tot.Recov.Mercury
Co
nce
ntr
atio
n (
ug
/L)
Detect. Lim. - Lake Whatcom/Whatcom
Detect. Lim. - Metro
Max.
Min.
Median
Page 26 Lake Whatcom Watershed

Lake Whatcom Watershed Page 27
mercury are difficult due to the much higher detection limits reported by Metro; up to twoorders of magnitude higher in the case of mercury.
These comparisons should be used with caution because monitoring sites in King Countymay be different from the present survey, at least in terms of land use. However, the datado suggest that copper and zinc in streams monitored during this survey are elevated abovewhat might be normally anticipated in urban areas of western Washington.
Metals in SedimentsConcentrations of 13 metals in sediments are shown in Figures R-14 - R-21. In mostcases, concentrations of metals were low. The distribution of metals concentrationsappeared to follow the same geographical pattern seen in springtime water samples,suggesting that stormwater is a factor in metal enrichment of sediment. However, unlikethe springtime water samples, Park Place had the highest concentrations of chromium,copper, and nickel. Fever Creek had the highest concentrations cadmium, lead, and zinc.Arsenic concentrations were highest in Lake Whatcom Basins 3 and 1.
Of the three Lake Whatcom sites, Basin 1 sediments had the highest concentrations of allmetals except chromium and nickel (Basin 3). Mercury concentrations in Basin 1 werenearly double those found at any other site. In general, mercury in the Lake Whatcom basinwas higher than sites in the Whatcom Creek basin, a pattern observed for most metals.
One confounding factor when considering metals concentrations is their dependence on theproportion of fine material (i.e. ≤ 62.5 µm) in the samples. Regression of metals on %fines showed significant relationships for all metals analyzed (range of R2 values = 0.61 -0.87). Therefore, lower metals concentrations at Austin Creek, Cable Street, CemeteryCreek, and Lincoln Creek may be due to a relative lack of fine material in these sediments.
Other metals detected in sediments include silver, antimony, beryllium, selenium, andthallium. Among these metals, only beryllium was detected at all nine sites. Seleniumwas detected at four sites, antimony and silver were detected at two sites each, andthallium was detected at one site. All of these metals were found at low concentrations anddo not appear to have major environmental significance.
In terms of toxicity, the ecological significance of arsenic, cadmium, chromium, copper,nickel, lead, zinc, and mercury concentrations in sediments is difficult to ascertain becauseno national or state sediment criteria or standards have been established for freshwater. Inan effort to guide development of criteria specific to Washington State, Cubbage et al.(1997) derived freshwater sediment quality values (FSQVs) by analyzing bioassay andchemistry data sets collected in Washington, and by reviewing freshwater and marinesediment criteria developed in the U.S and Canada including Washington standards formarine waters. The authors concluded that, when applied to freshwater, the existing theSediment Management Standards (SMS; Ch. 173-204 WAC) for marine waters providedthe best mix of sensitivity and efficiency in predicting effects to the bioassay organismHyallela azteca and miscellaneous effects related to metals. Numerical criteria

Figure R-16. Chromium Concentrations in Sediments
0
20
40
60
80
100
120
AustinCr.
LW#3 Cable St. DWIntake
ParkPlace
LW#1 CemeteryCr.
LincolnCr.
Fever Cr.
Chr
omiu
m (m
g/kg
, dw
)
Figure R-17. Copper Concentrations in Sediments
0
20
40
60
80
100
120
AustinCr.
LW#3 Cable St. DWIntake
ParkPlace
LW#1 CemeteryCr.
LincolnCr.
Fever Cr.
Cop
per
(mg/
kg, d
w)
Lake Whatcom Watershed Page 29

Figure R-18. Nickel Concentrations in Sediments
0
20
40
60
80
100
120
AustinCr.
LW#3 Cable St. DWIntake
ParkPlace
LW#1 CemeteryCr.
LincolnCr.
Fever Cr.
Nic
kel (
mg
/kg
, dw
)
Figure R-19. Lead Concentrations in Sediments
0
10
20
30
40
50
60
70
80
90
100
AustinCr.
LW#3 Cable St. DWIntake
ParkPlace
LW#1 CemeteryCr.
LincolnCr.
Fever Cr.
Lead
(mg/
kg, d
w)
ND ND
Page 30 Lake Whatcom Watershed

Figure R-20. Zinc Concentrations in Sediments
0
100
200
300
400
500
600
700
AustinCr.
LW#3 Cable St. DWIntake
ParkPlace
LW#1 CemeteryCr.
LincolnCr.
Fever Cr.
Zin
c (m
g/k
g, d
w)
Figure R-21. Mercury Concentrations in Sediments
0
0.05
0.1
0.15
0.2
0.25
0.3
0.35
0.4
0.45
0.5
AustinCr.
LW#3 Cable St. DWIntake
ParkPlace
LW#1 CemeteryCr.
LincolnCr.
Fever Cr.
Mer
cury
(mg
/kg
, dw
)
Lake Whatcom Watershed Page 31

Page 32 Lake Whatcom Watershed
promulgated in the SMS are essentially minimum chemical concentrations expected tocause adverse effects on biological resources.
Table R-3 shows FSQVs for metals and sites in the present survey which exceed thesevalues. For all but zinc and mercury, metals concentrations do not approach the FSQVs.Zinc exceeds the FSQV at Fever Creek and Park Place; mercury concentrations exceed theFSQV at Lake Whatcom Basin 1. Although FSQVs may have limited applicability here, theweight of evidence strongly suggests that aquatic life in Fever Creek is compromised due tozinc contamination. Aquatic life in the Park Place detention pond may also be affected byzinc, but there is apparently no widespread enrichment of zinc in Lake Whatcom sedimentsas a result of inputs from the Park Place drainage. The source of mercury in Lake Whatcomsediments is unknown.
Table R-3. Freshwater Sediment Quality Values (FSQVs)* for Metals in Washington State Compared to Metals in Sediment Samples from the Lake Whatcom/Whatcom Creek Watershed (mg/kg, dry).
FSQVRange of Concentrations in
Present Study Sites Exceeding FSQVArsenic 57 2 - 15 --Cadmium 5.1 <0.4 - 1.7 --Chromium 260 30 - 96 --Copper 390 11 - 96 --Nickel N/A 19 - 113 --Lead 450 <3 - 90 --Zinc 410 44 - 600 Fever Cr.
Park PlaceMercury 0.41 .0.04 - 0.46 Lake Whatcom #1
*FSQVs derived by Cubbage et al. (1997)
The degree of metals contamination in the Lake Whatcom and Whatcom Creek basins wasalso assessed by comparison with metals concentrations in sediments from streams in thePuget Sound Basin (Figure R-22). These data were reported as part of the Puget Soundbasin study being conducted by the U.S. Geological Survey's (USGS) National WaterQuality Assessment (NAWQA) Program. Data selected for comparison include all nineurban sites and three reference sites studied by USGS investigators during 1995 (MacCoyand Black, 1998).
Sediments analyzed for the present study do not appear to have metals concentrationselevated above representative Puget Sound urban areas in most cases. Chromium andarsenic concentrations are generally lower than both urban and reference areas. With theexception of outliers, lead and nickel concentrations resemble those reported by the USGSin urban areas. Copper concentrations bracketed both USGS urban and reference areas,but maximum concentrations were only double those in reference areas.
Based on comparison with the USGS data, sediment zinc concentrations at most sitesclosely matched zinc in reference sediments. However, the elevation of zincconcentrations at Fever Creek and Park Place above all Puget Sound NAWQA urban sitesillustrate the degree of contamination at these locations.

0
30
60
90
120
150
Chr
omiu
m (m
g/kg
, dry
)
Lake Whatcom and Whatcom Creek Watershed
USGS Urban Sites in Puget Sound Basin
USGS Reference Sites in Puget Sound Basin
0
10
20
30
40
Ars
enic
(mg
/kg
, dry
)
0
0.5
1
1.5
2
Cad
miu
m (m
g/kg
, dry
)
Figure 22a. Concentrations of Arsenic, Cadmium, and Chromium in Sediments Compared to Urban and Reference Areas Analyzed by USGS During the 1995 Puget Sound Basin NAWQA Study.
AsAs
Cr
Cd
Lake Whatcom Watershed Page 33

0
40
80
120
160
200
Lea
d (m
g/k
g, d
ry)
Lake Whatcom and Whatcom Creek Watershed
USGS Urban Sites in Puget Sound Basin
USGS Reference Sites in Puget Sound Basin
0
20
40
60
80
100
120
Nic
kel (
mg
/kg
, dry
)
0
20
40
60
80
100
Co
pp
er (m
g/k
g, d
ry)
Figure 22b. Concentrations of Copper, Nickel, and Lead in Sediments Compared to Urban and Reference Areas Analyzed by USGS During the 1995 Puget Sound Basin NAWQA Study.
Pb
Cu
Ni
Page 34 Lake Whatcom Watershed

0
0.1
0.2
0.3
0.4
0.5
0.6
Mer
cury
(mg/
kg, d
ry)
Lake Whatcom and Whatcom Creek Watershed
USGS Urban Sites in Puget Sound Basin
USGS Reference Sites in Puget Sound Basin
0
100
200
300
400
500
600
Zin
c (m
g/k
g, d
ry)
Figure 22c. Concentrations of Zinc and Mercury in Sediments Compared to Urban and Reference Areas Analyzed by USGS During the 1995 Puget Sound Basin NAWQA Study.
HgHg
Zn
Lake Whatcom Watershed Page 35
Page 36 Lake Whatcom Watershed
Sediment mercury concentrations were below the USGS reference site median forCemetery Creek, Lincoln Creek, Austin Creek, and Cable Street. However, Park Place,Fever Creek, and the three Lake Whatcom sites fell within the range for USGS urban sites.This result was somewhat surprising because Lake Whatcom Basin 3 is relativelyundeveloped and essentially represents a reference site for sediment sampling in this study.
Total Petroleum Hydrocarbons in Water andSedimentsPetroleum hydrocarbons in urban environmental samples generally originate from gasoline,diesel fuel, kerosene, jet fuels, and lubricating oils. Total petroleum hydrocarbon (TPH)analysis conducted for the present study was focused toward Diesel and kerosene. It shouldbe noted that TPH analysis does not include identification and quantification of discretecompounds, but rather quantifies a group of compounds eluting in a signature range on achromatogram.
Results showed that heavy fuel oil in water samples - specifically weathered Bunker C orFuel oil #5 or #6 - was the only TPH constituent detected. This is a somewhat unusualfinding in urban residential areas where spilled crude or minimally refined oil would not beexpected. Lubricating oil was the only constituent detected in sediments. Since thisfinding was quantitated against a Penzoil 30 weight motor oil standard, it is likely thesehydrocarbons originated from motor oil.
TPH concentrations in water and sediments were highest in Fever Creek (1.6 - 3.7 mg/L inwater, 3,700 mg/kg in sediment)(Figure R-23). No TPHs were detected in Austin Creek,Lake Whatcom sediments, or sediment from Cemetery Creek. Seasonal differencesshowed that for all sites but Cable Street, TPH concentrations were higher in springtimewater samples compared to fall.
Semivolatile Organics and Pesticides in WaterComplete results of water sample analysis for 184 organic compounds, includingpesticides, are shown in Appendix F.
Semivolatiles
The semivolatile organics analysis yielded the greatest number of compounds detected. Thisgroup of chemicals, categorized by the extraction method used for analysis, includes polycyclicaromatic hydrocarbons (PAHs), phenols, and phthalates. Semivolatile organics are commonlyfound in environmental samples from urban areas. Sources are diffuse and may includeincomplete combustion of fossil fuels and wood, petroleum products, plastics, and adhesives.
Maximum concentrations of semivolatiles in water were generally less than 1 µg/L.Exceptions to this include bis(2-ethylhexyl)phthalate and caffeine, which were also themost frequently detected compounds (Figure R-24). Bis(2-ethylhexyl)phthalate is a widelyused plasticizer and one of the most commonly detected EPA Priority Pollutant organics.
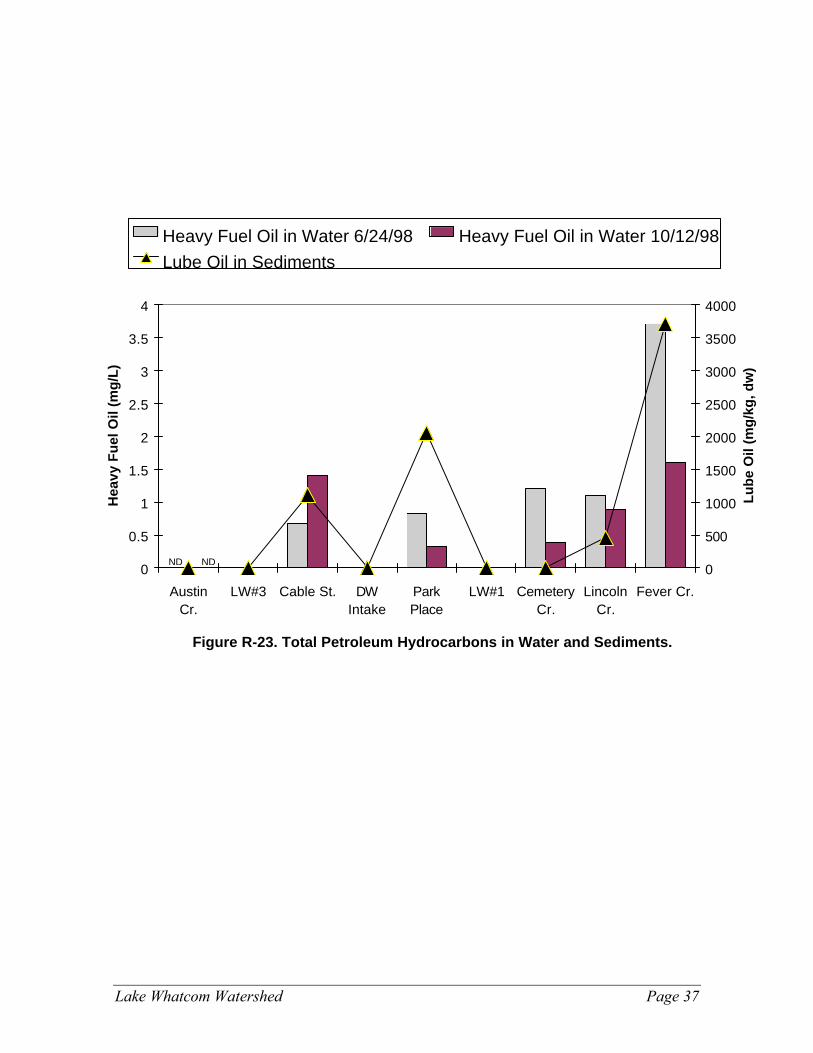
Figure R-23. Total Petroleum Hydrocarbons in Water and Sediments.
0
0.5
1
1.5
2
2.5
3
3.5
4
AustinCr.
LW#3 Cable St. DWIntake
ParkPlace
LW#1 CemeteryCr.
LincolnCr.
Fever Cr.
Hea
vy F
uel
Oil
(mg
/L)
0
500
1000
1500
2000
2500
3000
3500
4000
Lu
be
Oil
(mg
/kg
, dw
)
Heavy Fuel Oil in Water 6/24/98 Heavy Fuel Oil in Water 10/12/98Lube Oil in Sediments
ND ND
Lake Whatcom Watershed Page 37

0% 20% 40% 60% 80% 100%
Bis(2-Ethylhexyl) Phthalate
Caffeine
4-Methylphenol
Benzoic Acid
Naphthalene
2-Methylphenol
Butylbenzylphthalate
Phenanthrene
Phenol
Pyrene
1-Methylnaphthalene
2-Methylnaphthalene
Benzo(a)pyrene
Fluoranthene
2,4-Dimethylphenol
Benzo(ghi)perylene
Benzyl Alcohol
Diethylphthalate
Acenaphthene
Benzo(b)fluoranthene
Chrysene
Indeno(1,2,3-cd)pyrene
2,4-Dichlorophenol
Acenaphthylene
Anthracene
Dibenzofuran
Di-N-Butylphthalate
Fluorene
Isophorone
N-Nitrosodiphenylamine
3B-Coprostanol
Benzo(k)fluoranthene
Di-N-Octyl Phthalate
Retene
Min.= Max.= Max. Site
0.045 3.6 Park Pl.
0.011 1.4 Fever Cr.
0.011 0.15 Fever Cr.
0.18 0.52 Cable St.
0.016 0.083 Park Pl.
0.027 0.078 Cable St.
0.036 0.5 Cemetery Cr.
0.026 0.18 Park Pl.
0.039 0.15 Lincoln Cr.
0.068 0.18 Park Pl.
0.0054 0.046 Fever Cr.
0.016 0.12 Fever Cr.
0.023 0.04 Lincoln Cr.
0.045 0.18 Park Pl.
0.0084 0.1 Fever Cr.
0.012 0.038 Cable St.
0.082 0.22 Cemetery Cr.
0.015 0.34 Fever Cr.
0.022 0.1 Fever Cr.
0.019 0.07 Lincoln Cr.
0.05 0.063 Lincoln Cr.
0.35 0.39 Lincoln Cr.
0.12 0.12 Lincoln Cr.
0.014 0.015 Lincoln Cr.
0.04 0.047 Fever Cr.
0.065 0.079 Fever Cr.
0.16 0.2 Fever Cr.
0.096 0.12 Fever Cr.
0.069 0.13 Fever Cr.
0.0067 0.042 Park Pl.
1.6 1.6 Cemetery Cr.
0.015 0.015 Park Pl.
0.58 0.58 Park Pl.
0.013 0.013 Cemetery Cr.
Detection Frequency
Figure R-24. Frequency of Detection and Range of Concentrations (ug/L) for Semivolatile Organic Compounds Detected in Water from the Lake Whatcom/Whatcom Creek Watershed.
Page 38 Lake Whatcom Watershed

Lake Whatcom Watershed Page 39
Caffeine was detected at all sites except fall samples from Cable Street and Park Place.Detection of caffeine could conceivably be an indicator of human sewage, possibly in theform of septic tank leachate, combined sewer overflows (CSOs), or illegal domestic sewerconnections. Metro reported that they detected caffeine in less than 3% of 451 receivingwater samples at a maximum concentration of 0.11 µg/L (Scott Mickelson, Metro/KingCounty Government, written communication to Debby Sargeant [Ecology], October 1998).Sites where caffeine was detected were always close to CSO discharges. Metro normallyfinds caffeine in CSO effluent samples at concentrations in the 5-20 µg/L range.
3β-Coprostanol was the only additional compound detected in the present study at aconcentration greater than 1 µg/L (1.6 µg/L in Cemetery Creek). 3β-Coprostanol is foundin the feces of humans and carnivorous animals (Merck, 1976) and therefore is also apotential indicator of human waste.
Fourteen of the 16 Priority Pollutant PAHs were detected in water samples during thepresent study, with most being detected at Park Place and Lincoln Creek. PAHs aregenerally found as a result of incomplete combustion of fossil fuels, yet they also may bepresent in uncombusted fossil fuels, especially the lower molecular weight PAHs (LPAH;acenaphthene, acenaphthylene, anthracene, fluorene, naphthalene, phenanthrene)(PTIEnvironmental Services, 1991b).
In general, PAH concentrations were low with total PAHs (i.e. the sum of individual PAHs)less than 1 µg/L except for Fever Creek (1.2 µg/L). One notable pattern that emerges fromthe PAH data is that for all sites where these compounds were detected, concentrations oftotal PAH were an order magnitude higher in fall samples compared to those collectedduring spring. This may be related to TSS concentrations since these compounds tend tosorb to particulate matter (Zawlocki, 1981) or it may be that more of these compounds weremobilized as a result of higher runoff volumes produced during the fall sampling event.
The significance of semivolatile organic compounds in water was assessed by comparison towater quality criteria and guidelines for the protection of freshwater aquatic life and humanhealth (Table R-4). Compounds exceeding recommended maximum concentrations (RMCs)in Lake Whatcom/Whatcom Creek drainages were limited to phthalate esters, specificallybis(2-ethylhexyl)phthalate, butylbenzylphthalate, and di-n-octylphthalate. All three of thesecompounds exceeded Canadian Water Quality Guideline RMCs (CCREM, 1987) at ParkPlace; bis(2-ethylhexyl)phthalate and butylbenzylphthalate both exceeded RMCs at FeverCreek, and Lincoln Creek; Cable Street and Cemetery Creek exceeded RMCs forbis(2-ethylhexyl)phthalate and butylbenzylphthalate, respectively. It is noteworthy thatwhile Canada's RMCs were exceeded for these compounds, these guidelines are basedderived from very limited data and are probably over-conservative (CCREM, 1987).
Water samples also exceeded human health criteria for a number of organic compounds.Benzo(a)pyrene, benzofluoranthenes, chrysene, and indeno(1,2,3-c,d)pyreneconcentrations were above the National Toxics Rule (NTR) criterion of 0.0028 µg/L for atleast one sampling round, mainly at Lincoln Creek, Fever Creek, and Park Place.Bis(2-ethylhexyl)phthalate also exceeded the NTR criterion (1.8 µg/L) in October samplesfrom Park Place, Fever Creek, and Cable Street. The NTR was promulgated by EPA in1992 to establish numeric, chemical-specific criteria for all priority pollutants in order to

Page 40 Lake Whatcom Watershed
bring states into compliance with the Clean Water Act. As such, they are the legalstandards in Washington in cases where the state has not adopted acceptable numericalstandards for chemicals, including those listed in Table R-4.
Table R-4. Water Quality Criteria and Guidelines for Semivolatile Organics to Protect Freshwater Aquatic Life and Human Health Compared to Semivolatiles in
Water Samples from the Lake Whatcom/ Whatcom Creek Watershed (µµµµg/L).
Criteria or Guidelines Aquatic LifeAcute Chronic RMC
HumanHealth
Range ofConcentrations inPresent Study
Sites ExceedingCriteria orGuidelines
2,4-Dichlorophenol 2,020 a,b 365 a,b 0.2c 93 d 0.12 --
2,4-Dimethylphenol 2,120 a,b ne ne ne 0.0084 - 0.1 --
Acenaphthene 1,700 a,b 520 a,b ne ne 0.022 - 0.1 --
Anthracene ne ne ne 9,600 d 0.04 - 0.047 --
Benzo(a)pyrene ne ne ne 0.0028 d 0.023 - 0.04 Lncln., Cable,Prk.Pl., Fever
Benzo(b)fluoranthene ne ne ne 0.0028 d 0.019 - 0.07 Lncln., Prk.Pl.,Fever
Benzo(k)fluoranthene ne ne ne 0.0028 d 0.015 Prk.Pl.
Bis (2-Ethylhexyl)Phtalate ne ne 0.6 c 1.8 d 0.045 - 3.6 Prk.Pl., Fever,Cable, Lncln.
Butylbenzylphthalate ne ne 0.2 c ne 0.036 - 0.5 Cemtry., Lncln.,Prk.Pl., Fever
Chrysene ne ne ne 0.0028 d 0.05 - 0.063 Lncln., Prk.Pl.,Fever
Di-N-Butylphthalate ne ne 4 c 2,700 d 0.16 - 0.2 --
Di-N-OctylPhthalate ne ne 0.2 c ne <0.24 - 0.58 Prk.Pl.
Fluoranthene 3,980 a,b ne ne 300 d 0.045 - 0.18 --
Fluorene ne ne ne 1,300 d 0.096 - 0.12 --
Indeno(1,2,3-c,d)pyrene ne ne ne 0.0028 d 0.35 - 0.39 Lncln., Fever,Cemtry.
Isophorone 117,000 a,b ne ne 8.4 d 0.069 - 0.13 --
Naphthalene 2,300 a,b 620 a,b ne ne 0.016 - 0.083 --
N-Nitrosodiphenylamine ne ne ne 5.0 d 0.0067 - 0.042 --
Phenanthrene ne ne 1.0 c ne 0.026 - 0.18 --
Phenol ne ne ne 21,000 d 0.039 - 0.15 --
Pyrene ne ne ne 960 d 0.068 - 0.18 --
RMC=Recommended Maximum Concentrationne=not establisheda EPA, 1986b Insufficient data to develop criteria. Value presented is lowest observed effect level (LOEL).c CCREM, 1987d National Toxics Rule (EPA, 1992a)

Lake Whatcom Watershed Page 41
Pesticides
Concentrations of pesticides detected in water samples are shown in Table R-5. A total of15 of the 110 pesticides analyzed were detected in at least one sampling round. Of the foursites sampled, all had detectable levels of at least three pesticides in each sample.Concentrations were low; generally less than 0.1 µg/L and below practical quantitationlimits in most cases.
Chlorophenoxy herbicides were the most frequently detected class of pesticide, followedby nitrogen and organophosphorous pesticides, the latter generally having insecticidalproperties. MCPP, pentachlorophenol, 2,4-D, 4-nitrophenol, 2,6-dichlorobenzamide, anddiazinon were the most frequently detected pesticides. MCPP, 2,4-D, 4-nitrophenol, andpentachlorophenol were detected in at least one sample from all four sites. MCPP was theonly pesticide detected in all eight samples.
Table R-5. Pesticides Detected in Water Samples (µµµµg/L).Location: Austin Creek Cable Street Park Place Cemetery CreekDate: 6/24/98 10/12/98 6/24/98 10/12/98 6/24/98 10/12/98 6/24/98 10/12/98
Chlorophenoxy Herbicides2,4-D 0.040 u 0.029 nj 0.016 nj 0.078 u 0.060 0.12 0.13 0.114-Nitrophenol 0.021 j 0.096 nj 0.044 nj 0.14 u 0.067 j 0.18 nj 0.11 0.14 uDicamba 0.040 u 0.037 nj 0.041 u 0.078 u 0.040 u 0.078 u 0.041 u 0.081 uDichlorprop 0.044 u 0.085 u 0.045 u 0.085 u 0.044 u 0.020 nj 0.045 u 0.089 uMCPP (Mecoprop) 0.0065 j 0.056 nj 0.015 nj 0.047 nj 0.11 0.087 j 0.10 0.19Pentachlorophenol 0.0081 j 0.028 j 0.42 0.33 0.020 u 0.15 0.042 nj 0.22Triclopyr 0.034 u 0.065 u 0.034 u 0.065 u 0.033 u 0.038 j 0.093 j 0.10
Organophosphorous PesticidesChlorpyrifos 0.016 u 0.031 u 0.016 u 0.003 nj 0.016 u 0.023 u 0.016 u 0.033 uDiazinon 0.016 u 0.031 u 0.049 j 0.031 j 0.023 0.031 u 0.082 0.42Malathion 0.016 u 0.031 u 0.016 u 0.038 0.016 u 0.038 uj 0.016 u 0.033 u
Nitrogen Pesticides2,6-Dichlorobenzamide 0.081 u na 0.013 j na 0.002 j na 0.023 j naAtrazine 0.020 u 0.039 u 0.027 j 0.039 u 0.007 j 0.038 u 0.019 j 0.041 uDichlobenil 0.040 u 0.078 u 0.063 j 0.079 u 0.029 j 0.029 j 0.041 u 0.082 uOxadiazon 0.081 u na 0.079 u na 0.016 j 0.058 j 0.082 u naSimazine 0.020 u 0.039 u 0.020 u 0.039 u 0.020 u 0.038 u 0.020 u 0.033 nj
detected values in boldu=not detected at or above reported valuej=estimated value, analyte positively identifiednj=estimated value, evidence that the analyte is presentna=not analyzed
Concentrations were generally highest in chlorophenoxy herbicides compared to the otherpesticide classes. One notable exception was the relatively high concentration of diazinondetected in the fall sample from Cemetery Creek. Fall samples in Cemetery Creek also
Page 42 Lake Whatcom Watershed
contained the highest concentrations of MCPP, triclopyr, and simazine of any samplesanalyzed, as well as relatively high concentrations of 2,4-D and pentachlorophenol.Pentachlorophenol from both spring and fall water samples from Cable Street were higherthan any other site. Pentachlorophenol was a common wood preservative until its useswere largely restricted in the 1980s. However, it remains allowed for log treatment whennot used in homes or interiors, oil field flood waters, and pulp and paper production.
Overall, there does not appear to be a substantial difference in detection frequency orconcentrations between spring and fall samples, a finding somewhat unexpected becausedomestic pesticide applications are greater in the spring than other times of the year(Voss et al., 1999). However, the nitrogen pesticides, which are primarily for herbicideuse, were detected more frequently in spring samples compared to fall.
Prior to the present study, a survey of pesticides found in Bellingham retail stores was doneto determine which compounds were likely to be applied in the study area (Appendix I). Sixof the 15 organic pesticides detected in water samples were listed as active ingredients inretail products; 2,4-D, triclopyr, chlorpyrifos, diazinon, malathion, and dichlobenil.Chlorpyrifos, diazinon, and 2,4-D were the most commonly listed active ingredients.Frequently detected pesticides that were not found in the survey of Bellingham storesincluded MCPP, pentachlorophenol, 4-nitrophenol and 2,6-dichlorobenzamide. Asmentioned previously, pentachlorophenol is essentially banned for home use.
USGS also conducted a survey of pesticides on retail store shelves as part of their PugetSound NAWQA study of pesticides in urban streams (Voss et al., 1999). They too found2,4-D, diazinon, and chlorpyrifos to be among the most commonly sold pesticides in theirstudy area. Unlike Bellingham stores, however, they found that MCPP made up nearly40% of the unit retail sales of herbicides in a survey of ten home and garden stores inurban/suburban King and south Snohomish counties.
Detection frequency and concentrations of pesticides from the present study werecompared to results from the USGS NAWQA study (Figure R-25). Results show thaturban streams in King County have many of the same pesticides and similar concentrationsas those found in Cemetery Creek and Lake Whatcom drainages. Like the present study,USGS found MCPP, pentachlorophenol, 2,4-D, and diazinon to be among the mostcommonly detected in stream waters. Overall, they detected 23 different pesticides, mostof which were analyzed for the present survey. USGS did not report whether theyanalyzed 4-nitrophenol or 2,6-dichlorobenzamide.
Pesticide concentrations in water were compared to water quality criteria and guidelines toprotect aquatic life (Table R-6). The acutely toxic organophosphorous insecticides -chlorpyrifos, diazinon, and malathion - were the only pesticides above RMCs. RMCs wereexceeded for all three pesticides at Cable Street. Water quality criteria were not exceededfor pesticides. Pentachlorophenol concentrations in both rounds of sampling from CableStreet also exceed the NTR human health criterion of 0.28 µg/L. NTR criteria have notbeen established for other chemicals in Table R-6.

Detection Frequency20% 40% 60% 80% 100%
MCPP
Pentachlorophenol
2,4-D
4-Nitrophenol
2,6-Dichlorobenzamide
Diazinon
Oxadiazon
Trichlopyr
Atrazine
Dichlobenil
Dicamba
Dichlorprop
Chlorpyrifos
Malathion
Simazine
0.001 0.01 0.1 1 10
0%
Concentration Range (ug/L)
= Median Conc.
Figure R-25. Frequency of Detection and Range of Concentrations (ug/L) of Pesticides in Water Compared to King County Streams Analyzed by USGS During 1998.
USGS not reported
USGS not reported
Lake Whatcom/Whatcom Creek
USGS - King County
Lake Whatcom Watershed Page 43

Page 44 Lake Whatcom Watershed
Table R-6. Water Quality Criteria and Guidelines for Pesticides to Protect Freshwater Aquatic Life Compared to Pesticides in Water from the Lake Whatcom/ Whatcom Creek Watershed (µµµµg/L).
Criteria or Guidelines
Acute Chronic RMC
Range ofConcentrations inPresent Study
Sites ExceedingCriteria orGuidelines
2,4-D 10a 1a 3b/4c 0.016 - 0.13 --Atrazine 70a 7a ne 0.007 - 0.027 --Chlorpyrifos 0.083d 0.041d 0.001b 0.003 Cable StreetDiazinon ne ne 0.009b 0.023 - 0.42 Cemetery Creek
Cable StreetPark Place
Dicamba 390a 39a 200b 0.037 --Dichlobenil ne ne 37b 0.029 - 0.063 --Malathion ne 0.1e 0.008b <0.016 - 0.038 Cable StreetPentachlorophenol 9.07d,f 5.73d,f 0.5c 0.0081 - 0.42 Cable Streetg
Simazine 100a 10a 10b 0.033 --Triclopyr 5,600a 560a ne 0.038 - 0.10 --
RMC=Recommended Maximum Concentrationne=not establisheda Norris and Dost, 1991b NAS/NAE, 1973c CCREM, 1987d State of Washington, 1992e EPA, 1986f pH dependent criteria. Value presented is based on pH=7.0.g pentachlorophenol concentrations exceeded the National Toxics Rule (EPA, 1992a) human health criterion of 0.28 µg/L at Cable Street. NTR criteria have not been established for other chemicals in Table R-6.
USGS found similar results when comparing their data to the same RMCs listed here (Voss etal., 1999). They found diazinon, malathion, and chlorpyrifos to be among the most commonpesticides exceeding RMCs, with the most exceedances for diazinon. They also found γ-HCHand carbaryl, which were not analyzed for the present survey, to exceed RMCs.
Semivolatile Organics and Pesticides in Sediment
Semivolatiles
Thirty-seven of the 74 semivolatile organic compounds analyzed were detected insediments. Many of the same semivolatile detected in sediments were also detected inwater (30 of 35). Figure R-26 shows the frequency with which compounds were detectedin sediments. Substituted and non-substituted PAHs made up the most common class oforganic compound in sediments, generally being detected in 50% or more of the samples.In contrast, naphthalene was the only PAH detected in more than 50% of water samples.PAHs are preferentially sorbed to sediments, especially those containing relatively highorganic carbon (OC), as reflected by their high OC-normalized sediment-water partitioncoefficients (Koc)(Mabey et al., 1982). Therefore it is not surprising that total PAHconcentrations in sediments appear to be dictated somewhat by TOC concentrations, as

Detection Frequency0% 20% 40% 60% 80% 100%
2-Methylnaphthalene
4-Methylphenol
Fluoranthene
Pyrene
1-Methylnaphthalene
Benzo(a)pyrene
Chrysene
Naphthalene
Phenanthrene
Retene
Benzo(b)fluoranthene
Benzo(ghi)perylene
Acenaphthylene
Benzo(k)fluoranthene
Bis(2-Ethylhexyl) Phthalate
Di-N-Butylphthalate
Fluorene
Indeno(1,2,3-cd)pyrene
Anthracene
Benzo(a)anthracene
Dibenzofuran
Benzyl Alcohol
Acenaphthene
Butylbenzylphthalate
Carbazole
Dibenzo(a,h)anthracene
2-Methylphenol
3B-Coprostanol
Benzoic Acid
Diethylphthalate
Pentachlorophenol
Phenol
4-Chloroaniline
Caffeine
Dimethylphthalate
Di-N-Octyl Phthalate
Isophorone
Min.= Max.= Max. Site2.9 214 LW#114 2450 Fever Cr.
4.2 1840 LW#14.7 2100 LW#1
0.88 69 LW#111 625 Lincoln Cr.
6.4 699 Lincoln Cr.5 4330 LW#1
11 1930 LW#114 1600 LW#118 750.5 Lincoln Cr.10 436 Fever Cr.
2.9 1020 LW#19.2 279 Lincoln Cr.69 13000 Park Pl.
244 12800 DW Intake4.9 205 LW#196 1000 LW#123 248 LW#157 387.5 Lincoln Cr.
2.8 339 LW#134 331 Fever Cr.32 154 LW#158 451 Fever Cr.
8.2 119 Lincoln Cr.107.5 553 Park Pl.
16 27 Park Pl.588 20500 Park Pl.567 3090 Cable St.
30 52 Cable St.1380 1590 Fever Cr.
52 1190 Cable St.82 82 Park Pl.
22.5 22.5 Lincoln Cr.153 153 Lincoln Cr.588 588 Fever Cr.358 358 LW#3
Figure R-26. Frequency of Detection and Range of Concentrations (mg/kg, dry) for Semivolatile Organic Compounds Detected in Sediments from the Lake Whatcom/Whatcom Creek Watershed.
Lake Whatcom Watershed Page 45

Page 46 Lake Whatcom Watershed
demonstrated by the regression of PAH on TOC (R2=0.72). Other semivolatilecompounds, such as some phthalate esters and mono- and di-substituted phenols andbenzenes, tend to have much lower Koc values.
Lake Whatcom Basin 1 sediments showed the highest concentrations of 12 of the 19 non-substituted and substituted PAHs detected, including retene. PAH concentrations werelowest at Cemetery Creek and Austin Creek. Although this pattern may be a reflection ofTOC concentrations (see Figure R-3), Lake Whatcom Basin 1 was also the only site wherethe sum of low molecular weight PAHs (LPAH) concentrations was higher than the highmolecular weight PAHs (HPAH). As mentioned previously, PAHs in environmentalsamples generally originate from the incomplete combustion of fossil fuels, although LPAHmay also be present in uncombusted fossil fuels. Concentrations of some LPAHs(naphthalene and phenanthrene) and HPAHs (fluoranthene and pyrene) in water samplesfrom Park Place were found at the highest concentrations, suggesting that this drainage maybe a significant ongoing source of PAH enrichment of Lake Whatcom Basin 1 sediments.
To put concentrations of semivolatile compounds in perspective, they were compared tosediment data from urban and reference streams analyzed by USGS (Table R-7). TheUSGS samples were collected in 1995 as part of the Puget Sound NAWQA Program andare intended to provide representative samples of streams in the Puget Sound Basin(MacCoy and Black, 1998).
Results of the comparison show that most of the compounds detected in the present studywere found to have similar detection frequencies as those in urban Puget Sound NAWQAstreams. However, median concentrations found in the Lake Whatcom/Whatcom Creekdrainages were generally higher than those from NAWQA sites. One apparent reason is thaturban sites selected for the NAWQA study were not particularly contaminated; concentrationsfrom reference sites were similar to or higher than urban sites in most cases. Semivolatileorganic compounds found in this study that are probably not elevated compared to sedimentsfrom reference areas include benzo(a)anthracene, diethylphthalate, and fluorene; otherdetected compounds are probably elevated above reference conditions to varying degrees.
Although sediments sampled during this survey may be enriched with a variety of potentiallytoxic organic chemicals, only three - indeno(1,2,3-c,d)pyrene, dibenzo(a,h)anthracene, andbis(2-ethylhexyl)phthalate - were at concentrations likely to elicit toxic effects in benthicorganisms. This conclusion is based on a comparison to the freshwater sediment qualityvalues (FSQVs) for Washington State (Cubbage et al., 1997)(Table R-8). FSQVs fororganics are based on Microtox probable apparent effects thresholds derived from a varietyof bioassay and chemistry data sets from freshwater sediments in Washington. Like FSQVsfor metals, the FSQVs for organics are not codified standards. However, developers of theFSQVs conclude they perform better in predicting biological effects than other sets of values,including other sediment quality criteria and guidelines.
Park Place and Fever Creek sediments exceeded FSQVs for two chemicals,dibenzo(a,h)anthracene and bis(2-ethylhexyl)phthalate. Cable Street and Lincoln Creeksediments also surpassed the bis(2-ethylhexyl)phthalate value. Lake Whatcom Basin 1sediment exceeded the indeno(1,2,3-cd)pyrene FSQV. Other compounds detected insediments generally did not approach FSQVs. FSQVs have not been derived for the other

Lake Whatcom Watershed Page 47
compounds detected but not listed in Table R-8, nor have other sediment quality guidelinesor criteria been established for most of these chemicals (Batts and Cubbage, 1995).
Table R-7. Concentrations of Semivolatile Organics Detected in Sediments Compared to Sediments from Urban and Reference Areas Analyzed by USGS During the 1995 Puget Sound Basin NAWQA Study [median (range); µµµµg/kg, dry].
This Study USGS - Puget Sound Basin
(n=9)Urban(n=9)
Reference(n=3)
1-Methylnaphthalene 8 (0.9-69) na na2-Methylnaphthalene 48 (3-214) na na2-Methylphenol 22 (16-27) na na3B-Coprostanol 10,544 (588-20500) na na4-Chloroaniline 82 na na4-Methylphenol 106 (14-2450) 34 (28-330) 76 (23-130)Acenaphthene 69 (32-154) 21 (19-41) 18Acenaphthylene 19 (3-1020) 38 (38-39) 20Anthracene 81 (23-248) 32 (23-160) 46 (9-84)Benzo(a)anthracene 204 (57-388) 66 (31-680) 160 (50-270)Benzo(a)pyrene 180 (11-625) 68 (27-1700) 54Benzo(b)fluoranthene 448 (18-750) 88 (41-970) 55Benzo(g,h,i)perylene 331 (10-436) 58 (35-440) nd(50-250)Benzo(k)fluoranthene 128 (9-279) 66 (25-790) 34Benzoic Acid 1828 (567-3090) na naBenzyl Alcohol 96 (34-331) na naBis(2-Ethylhexyl)Phthalate 1630 (69-13000) 170 (22-2400) 84 (51-1100)Butylbenzylphthalate 188 (58-451) 46 (39-110) 42 (25-50)Caffeine 22 na naCarbazole 40 (8-119) 34 (20-180) 12Chrysene 247 (6-699) 74 (25-950) 132 (63-200)Dibenzo(a,h)anthracene 409 (108-553) 93 (36-280) nd(50-250)Dibenzofuran 49 (3-339) 27 (20-63) 25Diethylphthalate 41 (30-52) 25 (20-29) 23 (16-150)Dimethylphthalate 153 14 (10-19) 50Di-N-Butylphthalate 406 (244-12800) 55 (45-62) 53 (38-300)Di-N-OctylPhthalate 588 98 (55-140) 53Fluoranthene 400 (4-1840) 125 (42-2800) 178 (36-320)Fluorene 41 (5-205) 25 (17-69) 74 (18-130)Indeno(1,2,3-c,d)pyrene 318 (96-1000) 68 (33-1600) nd(50-250)Isophorone 358 nd(50) nd(50-250)Naphthalene 54 (5-4330) 11 50 (30-71)N-Nitroso-Di-n-PropylAmine nd(19-1420) 36 29Pentachlorophenol 1485 (1380-1590) nd(50) 21Phenanthrene 299 (11-1930) 64 (28-850) 155 (150-160)Phenol 621 (52-1190) 28 (16-45) 18 (11-120)Pyrene 265 (5-2100) 107 (37-2300) 140 (39-240)Retene 138 (14-1600) na na
na =not analyzednd=not detected at or above value in parentheses.

Page 48 Lake Whatcom Watershed
Table R-8. Freshwater Sediment Quality Values (FSQVs)* for Organics in Washington State Compared to Organics in Sediment Samples from the Lake Whatcom/Whatcom Creek Watershed (µµµµg/kg, dry).
FSQVRange of Concentrations
in Present StudySites Exceeding
FSQV
PAHsNaphthalene 37,000 5 - 4330 --Acenaphthylene 1,900 3 - 1020 --Acenaphthene 3,500 32 - 154 --Fluorene 3,600 5 - 205 --Phenanthrene 5,700 11 - 1930 --Anthracene 2,100 23 - 248 --LPAHa 27,000 5 - 7890 --Fluoranthene 11,000 4 - 1840 --Pyrene 9,600 5 - 2100 --Benzo(a)anthracene 5,000 57 - 388 --Chrysene 7,400 6 - 699 --Total Benzofluoranthenes 11,000 nd - 1,030 --Benzo(a)pyrene 7,000 11 - 625 --Indeno(1,2,3-c,d)pyrene 730 96 - 1000 LW Basin 1Dibenzo(a,h)anthracene 230 108 - 553 Park Place
Fever Cr.Benzo(g,h,i)perylene 1,200 10 - 436 --HPAHb 36,000 63 - 6,690 --Total PAHc 60,000 74 - 14,600 --
Other Semivolatile OrganicsBis(2-Ethylhexyl)Phthalate 640 69 - 13,000 Park Place
Fever Cr.Cable St.
Lincoln Cr.Carbazole 140 8 - 119 --
*FSQVs derived by Cubbage et al. (1997).aRepresents the sum of Anthracene, Acenaphylene, Acenaphthene, Phenanthrene, Fluorene, andNaphthalene. The LPAH criterion is not the sum of the criterion values for individual LPAH as listed above.bRepresents the sum of Pyrene, Benzo(g,h,i)perylene, Indeno(1,2,3-c,d)pyrene, Benzofluoranthene(s),Fluoranthene, Chrysene, Benzo(a)pyrene, Dibenzo(a,h)anthracene, and Benzo(a)anthracene. The HPAHcriterion is not the sum of the criterion values for individual HPAH as listed above.
Pesticides
No pesticides were detected in sediments from the two sites examined, Austin Creek andPark Place. Detection limits for chlorophenoxy herbicides were fairly low (26 - 200 µg/kg,dry), moderate for organophosphorous pesticides (66 - 490 µg/kg, dry), and high fornitrogen pesticides (110 - 2,000 µg/kg, dry)(Appendix G). Therefore, the only conclusionsthat can be drawn concerning the latter two classes of pesticides is that they are not presentat high concentrations in sediments.

Lake Whatcom Watershed Page 49
Metals, Pesticides, and PCBs in Fish TissueTables R-9 and R-10 show complete results for metals, pesticide, and PCB analysis of fishtissues from Lake Whatcom and Whatcom Creek, respectively.
Metals
Concentrations of cadmium, chromium, lead, and nickel were low in fish tissues; theywere not detected in any samples except for 4.9 mg/kg chromium in Whatcom Creekwhole sculpin. Copper concentrations in kokanee and crayfish muscle appear to besomewhat elevated (range 3.3 - 19 mg/kg). Zinc concentrations are also elevated in muscleand whole body tissues (range 8.9 - 22 mg/kg). By way of comparison, Johnson et al.(1988) found copper concentrations generally less than 0.7 mg/kg and zinc concentrationsless than 6 mg/kg in 94% (n=18) of sportfish muscle samples from Lake Roosevelt, awaterbody known to have significant copper and zinc contamination. Hopkins (1991)found copper concentrations less than 1 mg/kg in fish fillets collected from one river eachin western, central, and eastern Washington. However, Hopkins also found zincconcentrations similar to the range found in the present study (10.5 - 15.9 mg/kg).
Since these chemicals do not normally pose risks to human health there are few data ontheir accumulation in "edible" (i.e. muscle fillet) fish tissues. Likewise, there is little ornothing in the way of established criteria to protect consumers of fish tissues containingcopper and zinc. The Food and Drug Administration (FDA) has no regulatory limits forcopper and zinc in seafood. Nauen (1983) reported that median international limits forcopper and zinc in commercially sold seafood were 20 mg/kg and 45 mg/kg, respectively.
Mercury concentrations in muscle fillet were generally found at moderate concentrationswith the exception of one smallmouth bass sample from Lake Whatcom (0.5 mg/kg). Thissample was a composite of eight very large specimens collected from Basins 2 and 3, withan average weight of two pounds. Therefore, mercury in this sample probably reflects thesize of the specimens and feeding habits of smallmouth bass. Since mercury biomagnifiesin the food-chain, it would be expected to concentrate at higher levels in older and largersmallmouth bass which are primarily piscivorous (fish-eating)(Wydoski and Whitney,1979). Although this sample was collected from areas in Basins 2 and 3, these locationsprobably do not represent local sources of mercury contamination since smallmouth bassare wide-ranging and probably utilize much of the shallower waters and shoreline of LakeWhatcom.
Mercury exposure poses a threat to humans primarily due to neurodevelopmental effects(Foulke, 1994). Concentrations of concern to human consumers may vary due toconsumption rates and populations at risk, but criteria and standards are generally higherthan 0.5 mg/kg. The FDA action level for removing fish from the marketplace is 1.0mg/kg (FDA, 1985). The EPA National Toxics Rule (40 CFR 131) criterion for mercuryin edible fish tissue is 0.825 mg/kg. Although concentrations of mercury in the presentstudy do not exceed these values, lower concentrations in fish tissues have led some statesto recommend that humans limit consumption to reduce risk. Risk-based approaches not

Page 50 Lake Whatcom Watershed
only take into account concentrations of mercury in tissue, but also the consumption rate,the population at risk, and the level of risk or safety associated with mercury exposure.For instance, Minnesota Department of Health uses a graduated consumption advisorydepending on variables such as sport-fishing frequency and whether the consumer is a youngchild or woman of child-bearing age (MDH, 1994). MDH advises that, for the generalpopulation, fish with mercury concentrations 0.16 - 0.65 mg/kg should be eaten at a rate ofnot more than 2 meals/week for a seasonal consumer; 1 meal/week for an annual consumer.The same consumption advice is given for young children or women of child-bearing ageeating fish with 0.038 - 0.16 mg/kg mercury. FDA recommends that the general population(excluding young children and potential child-bearing or pregnant women) should limit theirconsumption of fish with 0.5 mg/kg mercury to 14 ounces/week (Foulke, 1994).
There are currently no consumption advisories due to mercury contamination inWashington. However, the Washington State Department of Health (DOH) is currentlyconsidering whether to issue an advisory or recommendations to protect consumers of fishfrom Lake Roosevelt in northeast Washington (Konraad Marien, DOH Toxicologist,personal communication). Concentrations of mercury in walleye (Stizostedion vitreum)from Lake Roosevelt ranged from 0.11 to 0.44 mg/kg (Munn and Short, 1997). Likesmallmouth bass, walleye are also piscivorous species whose concentrations of mercury inmuscle were found to positively correlate with age, length, and weight.
Unfortunately, little can be concluded about risks to humans eating Lake Whatcom fish.This study, the sole source of data on mercury in Lake Whatcom fish, merely provides ascreening-level assessment of contaminants in fish. In addition, little is known aboutexposure of humans to fish from the lake. Exposure assessment may take the form of acreel census or consumption survey and is a necessary element of risk assessment.Additional data on mercury concentrations in fish would therefore not likely provide usefulinformation about human health risks unless a companion exposure assessment is alsoconducted.
Pesticides and PCBs
Twelve pesticides and two Aroclors (PCBs) were detected among the 32 chlorinatedpesticides and PCBs analyzed in fish tissues. Concentrations of all compounds wereuniformly low: alpha- and gamma-BHCs ≤ 0.34 µg/kg; ΣDDT (DDT+DDE+DDD) ≤ 8.6µg/kg; dieldrin ≤ 0.95 µg/kg; hexachlorobenzene ≤ 2 µg/kg;Σchlordanes+metabolites+impurities (nonachlors, oxychlordane) ≤ 15 µg/kg; and ΣPCBs≤ 9.5 µg/kg except for ΣPCBs = 36 µg/kg in whole sculpin. Detection limits achieved inthese analyses were very low, with practical quantitation limits ≤ 0.5 µg/kg for all buttoxaphene (≤ 15 µg/kg) and PCBs (≤ 2.5 µg/kg).
The overall occurrence and concentrations among species and tissue types was remarkablysimilar with the exception of Whatcom Creek crayfish muscle which had no detectablelevels of these compounds. In contrast, whole sculpin from Whatcom Creek had thehighest concentrations of all compounds except BHCs and dieldrin. Differences inchlorinated pesticide/PCB levels between the crayfish and sculpin samples is likely due tothe differences in lipid content (<0.1% vs. 5.5% respectively) since these compounds are

Lake Whatcom Watershed Page 51
highly lipophilic ("fat-loving") and are therefore preferentially sequestered in fattiertissues. Female and male kokanee samples from Lake Whatcom showed little difference inpesticide levels.
Many of the pesticides found in Lake Whatcom and Whatcom Creek fish are routinelydetected in fish monitoring programs although they all have either been banned, had theiruses severely restricted, or have had their registrations voluntarily cancelled for over adecade. For example, DDE is a breakdown product of DDT which has been banned forcommercial use in the U.S. since 1972, yet was the most commonly detected chemicalresidue in a 1987 study of fish nationwide (99% of sites; EPA, 1992b), and remains one ofthe most frequently detected pesticides in Washington fish (Davis and Serdar, 1996).
Pesticides in the present study were analyzed using exceptionally low detection limitscompared to other studies where similar analyses were conducted - U.S. Fish & WildlifeService National Contaminant Biomonitoring Program (Schmitt et al., 1990), EPANational Study of Chemical Residues in Fish (EPA, 1992b), and Washington StatePesticide Monitoring Program (Davis and Serdar, 1996) – which explains thecomparatively high rates of detection for the present study. This point is illustrated inTable R-11 which shows concentrations of pesticides detected in Lake Whatcom wholesucker and Whatcom Creek whole sculpin compared to results from the Puget SoundNAWQA Program. Fish from the NAWQA were sculpins analyzed whole from nineurban and three reference streams (the same as sediments) during 1995 (MacCoy andBlack, 1998).
The types of pesticides detected in both studies were similar, but concentrations in fishfrom the NAWQA study were much higher than those found in Lake Whatcom andWhatcom Creek. These comparisons illustrate the ubiquitous nature and persistence ofthese chemicals, and the relatively low levels of contamination of the Lake Whatcom andWhatcom Creek basins compared to other urban waterbodies in the region.
Table R-12 shows a summary of chemicals detected in fish muscle compared to criteriafrom the EPA National Toxics Rule (NTR). Criteria in Table R-12 were established toprotect human health, and therefore only apply to edible tissues. Each values is based on aparticular pesticide's potential to cause no more than one excess cancer per million people(i.e., an acceptable upper-bound cancer risk of 10-6) for a lifetime exposure; a risk leveladopted by Ecology and codified in WAC 173-201A. It should be noted that these risklevels are partially based on default exposure values set out in the Federal Register(45 FR 231 part V; for the general U.S. population, average consumption of fish andshellfish from estuarine and freshwaters is 6.5 g/day) and therefore do not necessarilyreflect consumer habits of the local population.
All Lake Whatcom kokanee and smallmouth bass fillet samples exceed the NTR criteriafor both PCB-1254 and PCB-1260. The female kokanee sample exceeded NTR fordieldrin. Although these compounds exceed NTR criteria they are present at very lowlevels by almost any standard and probably reflect background levels of these ubiquitouschemicals. For instance, in their national study EPA found total PCBs and dieldrin

Page 52 Lake Whatcom Watershed
concentrations averaging 47 µg/kg and 14 µg/kg, respectively, in 20 whole fish collectedfrom background sites (EPA, 1992b). PCBs, especially Aroclors 1254 and 1260, areroutinely detected in fish tissue throughout Washington, with a state average of 67 µg/kgtotal PCBs for fillets (Davis and Serdar, 1996). State dieldrin averages for fillets areapproximately 4 µg/kg.
In contrast, sites with known PCB sources, or in heavily urbanized/industrialized areas,PCB concentrations are reported to be much higher. Nineteen finfish fillets from theSpokane River in the vicinity of a large aluminum mill and other industrial facilities nearSpokane were found to have total PCB concentrations averaging 390 µg/kg1 (Ecology,1995). Median total PCB concentrations in 36 sport fish fillets from urban/industrial sitesnationwide were reported at 290 µg/kg (EPA, 1992b), although concentrations were ashigh as 5,100 µg/kg, three orders of magnitude higher than those in Lake Whatcom fish.
1 WDOH has not issued a consumption advisory for Spokane River fish.

Lake Whatcom Watershed Page 53
Table R-9. Concentrations of Metals, Pesticides, and PCBs in Fish Tissues from Lake Whatcom.
Kokanee(female)
Kokanee(male) Kokanee
SmallmouthBass
SmallmouthBass
LongnoseSucker
Tissue type fillet fillet liver fillet fillet wholeBiological Data (mean ± SD)Total length 235 ± 9 228 ± 17 233 ± 14 246 ± 32 393 ± 6 228 ±Weight (g) 125 ± 16 110 ± 22 117 ± 20 233 ± 93 925 ± 154 ±Lipid content 4.7 4.0 7.1 1.1 1.8 4.9Metals (mg/kg,wet)Cadmium 1 u 1 u 1 u 1 u 1 u 1 uChromium 1 u 1 u 1 u 1 u 1 u 1 uCopper 3.6 3.3 68.2 3 u 3 u 3 uLead 6 u 6 u 6 u 6 u 6 u 6 uNickel 3 u 3 u 3 u 3 u 3 u 3 uZinc 15.5 15.8 55.7 8.9 11.5 18.2Mercury 0.121 0.0987 0.129 0.145 0.504 0.0656Chlorinated Pesticides/PCBs (µg/kg, wet)Alpha-BHC 0.32 j 0.31 0.34 0.25 u 0.23 u 0.24 jBeta-BHC 0.25 u 0.24 u 0.24 u 0.25 u 0.23 u 0.24 uGamma-BHC 0.12 nj 0.15 j 0.17 j 0.25 u 0.23 u 0.12 jDelta-BHC 0.25 u 0.24 u 0.24 u 0.25 u 0.23 u 0.24 uHeptachlor 0.25 u 0.24 u 0.24 u 0.25 u 0.23 u 0.24 uAldrin 0.25 u 0.24 u 0.24 u 0.25 u 0.23 u 0.24 uHeptachlor Epoxide 0.25 u 0.24 u 0.24 u 0.25 u 0.23 u 0.24 uEndosulfan I 0.50 uj 0.48 uj 0.49 uj 0.50 uj 0.46 uj 0.48 uj4,4'-DDE 3.9 2.5 2.6 1.3 3.0 3.8Dieldrin 0.95 j 0.33 nj 0.58 nj 0.50 uj 0.23 nj 0.30 njEndrin 0.50 uj 0.48 uj 0.49 uj 0.50 uj 0.46 uj 0.48 ujEndosulfan II 0.50 uj 0.48 uj 0.49 uj 0.50 uj 0.46 uj 0.48 uj4,4'-DDD 1.4 0.85 1.3 0.17 j 0.32 j 1.0Endrin 0.50 uj 0.48 uj 0.49 uj 0.50 uj 0.46 uj 0.48 uj4,4'-DDT 0.70 nj 0.90 0.24 nj 0.25 u 0.40 j 0.24 ujEndosulfan 0.50 uj 0.96 uj 0.49 uj 0.50 uj 0.46 uj 0.48 ujEndrin Ketone 0.50 uj 0.48 uj 0.49 uj 0.50 uj 0.46 uj 0.48 ujMethoxychlor 0.50 uj 0.48 uj 0.49 uj 0.50 uj 0.46 uj 0.48 ujToxaphene 15 u 14 u 15 u 15 u 14 u 14 uPCB-1016 2.5 u 2.4 u 2.4 u 2.5 u 2.3 u 2.4 uPCB-1221 2.5 u 2.4 u 2.4 u 2.5 u 2.3 u 2.4 uPCB-1232 2.5 u 2.4 u 2.4 u 2.5 u 2.3 u 2.4 uPCB-1242 2.5 u 2.4 u 2.4 u 2.5 u 2.3 u 2.4 uPCB-1248 2.5 u 2.4 u 2.4 u 2.5 u 2.3 u 2.4 uPCB-1254 6.7 5.0 5.1 1.6 j 3.8 j 4.4PCB-1260 2.8 2.6 2.3 j 1.8 j 5.2 5.1Hexachlorobenzene 1.6 j 1.2 j 1.5 j 0.66 j 0.86 j 1.3 jCis-Chlordane 1.2 0.86 1.0 0.27 0.63 0.74Trans-Chlordane 0.62 0.47 0.57 0.13 j 0.32 0.35Cis-Nonachlor 1.2 0.89 0.84 0.53 1.9 0.98Trans- 2.4 1.5 1.4 1.0 3.6 1.3Oxychlordane 0.40 0.31 j 0.35 0.33 j 0.69 0.61detected values in boldu=not detected at or above reported valuej=estimated value, analyte positively identifieduj=not detected at or above reported estimated valuenj=estimated value, evidence that the analyte is present

Page 54 Lake Whatcom Watershed
Table R-10. Concentrations of Metals, Pesticides, and PCBs in Fish Tissues from Whatcom Creek.
Sculpin CrayfishTissue type whole tail muscleBiological Data (mean ± SD)Total length (mm) 122 ± 13 nrWeight (g) 29 ± 9 27 ± 15Lipid content (%) 5.5% <0.1%Metals (mg/kg,wet)Cadmium 1 u 1 uChromium 4.9 1 uCopper 3 u 19Lead 6 u 6 uNickel 3 u 3 uZinc 19.4 21.5Mercury 0.376 0.15Chlorinated Pesticides/PCBs (µg/kg, wet)Alpha-BHC 0.19 j 0.25 uBeta-BHC 0.24 u 0.25 uGamma-BHC 0.11 j 0.25 uDelta-BHC 0.24 u 0.25 uHeptachlor 0.24 u 0.25 uAldrin 0.24 u 0.25 uHeptachlor Epoxide 0.24 u 0.25 uEndosulfan I 0.49 uj 0.49 uj4,4'-DDE 4.9 0.25 uDieldrin 0.74 j 0.49 ujEndrin 0.49 uj 0.49 ujEndosulfan II 0.49 uj 0.49 uj4,4'-DDD 1.8 0.25 uEndrin Aldehyde 0.49 uj 0.49 uj4,4'-DDT 1.9 0.25 uEndosulfan Sulfate 0.49 uj 0.49 ujEndrin Ketone 0.49 uj 0.49 ujMethoxychlor 0.49 uj 0.49 ujToxaphene 15 u 15 uPCB-1016 2.4 u 2.5 uPCB-1221 2.4 u 2.5 uPCB-1232 2.4 u 2.5 uPCB-1242 2.4 u 2.5 uPCB-1248 2.4 u 2.5 uPCB-1254 28 2.5 uPCB-1260 7.7 2.5 uHexachlorobenzene 2.0 j 0.25 ujCis-Chlordane 4.1 0.25 uTrans-Chlordane 2.4 0.25 uCis-Nonachlor 2.3 0.25 uTrans-Nonachlor 5.2 0.25 uOxychlordane 0.98 0.25 u
detected values in boldnr=not reportedu=not detected at or above reported valuej=estimated value, analyte positively identifieduj=not detected at or above reported estimated value

Lake Whatcom Watershed Page 55
Table R-11. Concentrations of Metals, Pesticides, and PCBs Detected in Whole Fish from Lake Whatcom and Whatcom Creek Compared to Whole Fish from Urban and Reference Areas Analyzed by USGS During the 1995 Puget Sound Basin NAWQA Study.
Present Study USGS – Puget Sound BasinUrban Streams (n=9) Reference Streams (n-3)
Lk.WhatcomLongnose
SuckerWhatcom
Cr. SculpinDet.
Freq.
MedianConc.
(Range)Det.
Freq.
MedianConc.
(Range)Metals (mg/kg, wet)Cadmium nd(1) nd(1) 22% 0.066
(0.050-0.082)0% nd(0.2)
Chromium nd(1) 4.9 100% 0.30(0.22-0.37)
100% 0.40(0.35-0.46
Copper nd(3) nd(3) 100% 0.49(0.36-1.7)
100% 0.46(0.30-0.52)
Lead nd(6) nd(6) 44% 0.06(0.05-0.24)
0% nd(0.2)
Nickel nd(3) nd(3) 100% 0.27(0.16-0.39)
100% 0.31(0.20-0.46)
Zinc 18.2 19.4 100% 14(12-32)
100% 16(14-16)
Mercury 0.0656 0.376 89% 0.066(0.030-0.21)
67% 0.058(0.022-0.094)
Pesticides (µg/kg, wet)Alpha-BHC 0.24 0.19 0% nd(5) 0% nd(5)Gamma-BHC 0.12 0.11 0% nd(5) 0% nd(5)4,4’-DDE 3.8 4.9 67% 13
(<5-97)0% nd(5)
Dieldrin 0.3 0.74 44% 10(7.9-27)
0% nd(5)
4,4’-DDD 1.0 1.8 0% nd(5) 0% nd(5)4,4’-DDT nd(0.24) 1.9 22% 36
(<5-64)0% nd(5)
Total PCB 9.5 36 0% 120<50-310)
0% nd(50)
Hexachlorobenzene 1.3 2.0 11% 7.1(<5-7.1)
0% nd(5)
Cis-Chlordane 0.74 4.1 56% 12(<5-30)
0% nd(5)
Trans-Chlordane 0.35 2.4 22% 11(<5-14)
0% nd(5)
Cis-Nonachlor 0.98 2.3 22% 8.9(<5-12)
0% nd(5)
Trans-Nonachlor 1.3 5.2 56% 14(<5-32)
0% nd(5)
Oxychlordane 0.61 0.98 22% 10(<5-12)
0% nd(5)
Heptachlorepoxide
nd(0.24) nd(0.24) 11% 6.9(<5-6.9)
0% nd(5)
nd=not detected at or above value in parentheses.

Page 56 Lake Whatcom Watershed
Table R-12. EPA National Toxics Rule Criteria Compared to Contaminants Detected in Fish Muscle Fillet.
NTRCriteria
Range of Concentrationsin Present Study
Sites – SpeciesExceeding NTR Criteria
Metals (mg/kg, wet)Copper ne 3.3 - 19 --Zinc ne 8.9 – 22 --Mercury 0.825 0.099 - 0.50 --
Pesticides (µg/kg, wet)Alpha-BHC 1.69 <0.23 – 0.32 --Gamma-BHC 8.19 0.12 – 0.15 --4,4’-DDE 32 <0.25 – 3.9 --Dieldrin 0.65 0.23 – 0.95 Lk. Whatcom Kokanee4,4’-DDD 45 0.17 – 1.4 --4,4’-DDT 32 <0.25 – 0.90 --PCB-1254 1.4 1.6 – 6.7 Lk. Whatcom Kokanee
Lk. Whatcom SM BassPCB-1260 1.4 1.8 – 5.2 Lk. Whatcom Kokanee
Lk. Whatcom SM BassHexachlorobenzene 6.7 <0.25 – 1.6 --Total Chlordane* 8.3 <0.25 - 7.1 --
ne=not established*Total chlordane=sum of cis- and trans-chlordane, cis- and trans-nonachlor, and oxychlordane

Lake Whatcom Watershed Page 57
Summary and ConclusionsResults of this survey were a first step in characterizing chemical and biologicalcontaminants in the Lake Whatcom and Whatcom Creek drainages. Overall, it appearsthat these drainages have low-to-moderate levels of contamination when compared to otherurban sites in King County and the greater Puget Sound basin. A more important aspect ofthis study was identifying chemicals and sites that may be of particular concern, and is thefocus of this section. A summary is shown in Table S-1.
Chemical and Biological Parameters of Concern
Fecal Coliform Bacteria and Conventional Parameters
Fecal coliform bacteria were found at levels exceeding Washington water qualitystandards at all sites in tributaries of Lake Whatcom, and in Whatcom Creek and itstributaries. Present and historic results meet the criteria for including Lake Whatcom andWhatcom Creek on the "water quality-limited" list under section 303(d) of the Clean WaterAct.
Nutrient concentrations were generally low. However, there appears to be some nitrogenand phosphorous enrichment of sediments in Lake Whatcom Basin 1. The Park Placedrainage appears to be a significant source of nutrients to the lake.
Metals
There is significant copper, zinc, and mercury contamination in at least one sub-basineach from the Lake Whatcom and Whatcom Creek watersheds. In some cases, thesemetals were at concentrations that cause deleterious effects to aquatic organisms.Dissolved copper and zinc, as well as chromium, are higher than what normally might beexpected in urban streams in this region. Zinc appears to be especially high in both waterand sediments from Fever Creek and qualifies for inclusion on the 303(d) list. Mercuryalso appears high at several sites – in water from Fever Creek and in sediments in LakeWhatcom Basin 1 – but its accumulation in Lake Whatcom smallmouth bass is mosttroubling, although the concentration does not exceed standards or criteria to protectconsumers.
Organic Compounds
Total petroleum hydrocarbons (TPH) were found in water and sediments from the moreheavily urbanized areas, but were especially high at Fever Creek which includes industrialland-use. Lake Whatcom sediments do not contain detectable concentrations of TPH. Oneof the puzzling findings of this survey is the presence of heavy fuel oil in water samplesfrom several sites. The source of this oil is unknown.

LAKE WHATCOM WATERSHED WHATCOM CREEK WATERSHEDTable S-1. Lake Whatcom and Whatcom Creek Study Sites and Contaminants of Concern.
Austi
n Cr.
LW B
asin 1
Cable
St.
DW In
take
Park
Plac
e
LWBa
sin 3
Cem
etery
Cr.
Linc
oln C
r.
Feve
r Cr.
Fecal Coliform Bacteria Xa,b Xa,b Xa,b Xa,b Xa,b Xa,b
Copper Xb Xb
Zinc Xc Xa,b,c
Mercury Xc,d Xd Xd Xb
Bis(2-ethylhexyl)phthalate Xc,e,f Xc,e,f Xc,e Xc,e,f
Butylbenzylphthalate Xe Xe Xe Xe
Di-N-Octylphthalate Xe
Benzo(a)pyrene Xf Xf Xa,f Xf
Benzo(b)fluoranthene Xf Xf Xf
Benzo(k)fluoranthene Xf
Chrysene Xf Xf Xf
Dibenzo(a,h)anthracene Xc Xc
Indeno(1,2,3-c,d)pyrene Xc Xf Xf Xf
Chlorpyrifos Xe
Diazinon Xe Xe Xe
Malathion Xe
Pentachlorophenol Xa,f
Dieldrin Xg Xg Xg
PCB-1254 Xa,g Xa,g Xa,g
PCB-1260 Xa,g Xa,g Xa,g
bViolates Washington State water quality standardscExceeds freshwater sediment quality valuesdElevated levels in edible fish tissueeAbove recommended maximum concentration in water to protect aquatic lifefExceeds National Toxics Rule water criteria to protect human healthgExceeds National Toxics Rule edible fish tissue criteria to protect human health
aMeets criteria for inclusion on 303(d) list.
Page 58 Lake Whatcom Watershed

Lake Whatcom Watershed Page 59
Semivolatile organic compounds, including PAHs and phthalates, were found atconcentrations higher than reference streams from the Puget Sound Basin. Fivesemivolatile organics – bis(2-ethylhexyl)phthalate, butylbenzylphthalate,di-n-octylphthalate, indeno(1,2,3-c,d)pyrene, and dibenzo(a,h)anthracene – were present atconcentrations which may have an adverse affect on aquatic organisms. Several PAHs –benzo(a)pyrene, benzofluoranthenes, chrysene, and indeno(1,2,3-c,d)pyrene – alsoexceeded human health criteria in water, as did bis(2-ethylhexyl)phthalate. However, thesecompounds were not found at alarmingly high concentrations and semivolatiles in generalwere present at low levels.
Pesticides were widely detected in water and are most likely a result of residentialapplications. The types and concentrations of pesticides detected bear a strongresemblance to contamination of urban streams in King County. Chlorophenoxyherbicides were detected most frequently and at the highest concentrations, but the highlytoxic organophosphorous pesticides – chlorpyrifos, diazinon, and malathion – were themost likely to affect aquatic organisms. Chlorpyrifos and diazinon are among the mostcommon active ingredients in pesticides for home and garden use.
Chlorinated pesticides and PCBs were present in fish from Lake Whatcom and WhatcomCreek, yet they are not at levels that constitute a serious threat to human consumers.Levels of the 12 pesticides and 2 PCB Aroclors were very low compared to results ofstatewide and nationwide surveys, including data from background sites. However,PCB-1254 and PCB-1260 in edible fish tissue from Lake Whatcom exceed NationalToxics Rule criteria and will result in candidacy for the 303(d) list.
Site-by-Site Summary
Austin Creek
With few exceptions, Austin Creek had the lowest levels of contaminants among drainagessampled for this study. Fecal coliform levels exceeded water quality standards as they didat all sites. One unusual finding was total recoverable mercury concentrations elevatedabove all other sites during fall water sampling, although Austin Creek had the lowestmercury level in samples collected during spring.
Cable Street
Cable Street had potentially toxic concentrations of all three organophosphorouspesticides – more than any other site examined. Pentachlorophenol concentrations werealso above the National Toxics Rule criterion to protect human health. The highestconcentrations of dissolved chromium, nickel, and lead were found at Cable Street duringfall sampling. TPH concentrations in water were also high in the fall. One copper sampleexceeded the Washington water quality standard, and bis(2-ethylhexyl)phthalate exceededCanadian guidelines and freshwater sediment quality values (FSQVs); however, neither of

Page 60 Lake Whatcom Watershed
these chemicals were detected at remarkably high concentrations. In fact, mostsemivolatile organic compounds were found at low-to-moderate concentrations relative toother sites, especially in sediments. Cable Street was one of the two sites where caffeinewas not detected in water samples (during fall).
Park Place
Park Place (wet pond influent) was the most contaminated site overall in the LakeWhatcom watershed. This conclusion is based on comparative levels of a variety ofcontaminants: fecal coliforms, nutrients, cadmium, chromium, copper, nickel, zinc,lubricating oil, bis(2-ethylhexyl)phthalate, pentachlorophenol, and other semivolatileorganics, especially PAHs. Caffeine was not detected in the Park Place water samplecollected in the fall.
Lake Whatcom
Sediments from Lake Whatcom Basin 1 appear to be enriched with a number of chemicalsincluding nitrogen, lead, mercury, and PAHs. It appears that the Park Place drainage maybe a source for some of these chemicals. Sediments from Basin 2 (drinking water intake)and Basin 3 have generally much lower levels of contamination with a geographical patternof contaminants appearing as Basin 1 > Basin 2 > Basin 3. As mentioned earlier, elevatedmercury levels in a sample of large Lake Whatcom bass is a concern. The elevated mercuryconcentration in Basin 1 sediment raises questions about possible external sources orbiogeochemical cycling of mercury within the lake. PCB concentrations in kokanee andsmallmouth bass were low but exceed National Toxics Rule criteria.
Cemetery Creek
Cemetery Creek was the least contaminated site overall in the Whatcom Creek drainage,although pesticides were present at relatively high concentration. The diazinonconcentration in the fall water sample from Cemetery Creek was an order of magnitudehigher than concentrations at other sites. Other contaminants of concern in CemeteryCreek were fecal coliforms, butylbenzylphthalate, and indeno(1,2,3-c,d)pyrene. Fall watersamples from Cemetery Creek also contained the highest concentrations of MCPP,triclopyr, and simazine of any samples analyzed, as well as relatively high concentrationsof 2,4-D and pentachlorophenol.
Lincoln Creek
Lincoln Creek had intermediate levels of metals and TPH among Whatcom Creekwatershed sites, but PAH concentrations tended to be among the highest of all sitesexamined. Although concentrations of some PAHs exceed human health criteria in water,they were not present at levels that constitute a major concern. Other contaminants ofconcern are fecal coliforms, butylbenzylphthalate, and bis(2-ethylhexyl)phthalate.

Lake Whatcom Watershed Page 61
Fever Creek
Fever Creek contains a variety of metals and organic compounds at substantialconcentrations and is the most overall contaminated site examined in this study. Zincconcentrations in Fever Creek are probably toxic to aquatic life and meet the criteria forinclusion on the 303(d) list. Other chemicals possibly compromising aquatic life arecopper, mercury, butylbenzylphthalate, bis(2-ethylhexyl)phthalate, and PAHs. Totalpetroleum hydrocarbons are also remarkably high in Fever Creek. Fecal coliform bacteriaconcentrations exceed water quality standards.

Page 62 Lake Whatcom Watershed
ReferencesBatts, D. and J. Cubbage, 1995. Summary of Guidelines for Contaminated Freshwater
Sediments. Washington State Department of Ecology, EnvironmentalInvestigations and Laboratory Services Program, Olympia, WA.
Berger, P., 1999. Percommunication communication. City of Everett, Public WorksDepartment.
CCREM, 1987. Canadian Water Quality Guidelines. Task Force on Water QualityGuidelines, Canadian Council of Resource and Environment Ministers, Ottawa,Ontario, Canada.
Christner, K., 1995. Concentrations of Metals and Organic Compounds in the Microlayerand Bulk Water of Lake Whatcom, Washington. Master's Degree Thesis, WesternWashington University, Bellingham, WA.
City of Bellingham, 1997. Source water monitoring data, Department of Public Works,Bellingham, WA.
City of Bellingham, 1999. City of Bellingham Department of Public Works Engineering,Bellingham, WA.
Cubbage, J., 1994. Drainage Basin Tracing Study: Phase II Chemicals Found in StormDrains, Whatcom Creek and Squalicum Harbor in Bellingham, Washington.Washington State Department of Ecology, Environmental Investigations andLaboratory Services Program, Olympia, WA. Publication No. 94-90.
Cubbage, J., D. Batts, and S. Breidenbach, 1997. Creation and Analysis of FreshwaterSediment Quality Values in Washington State. Washington State Department ofEcology, Environmental Investigations and Laboratory Services Program,Olympia, WA. Publication No. 97-323a.
Davis, D. and D. Serdar, 1996. Washington State Pesticide Monitoring Program - 1994Fish Tissue and Sediment Sampling Report. Washington State Department ofEcology, Environmental Investigations and Laboratory Services Program,Olympia, WA. Publication No. 96-352.
Ecology, 1995. Department of Ecology 1993-1994 Investigation of PCBs in the SpokaneRiver. Washington State Department of Ecology, Environmental Investigationsand Laboratory Services Program, Olympia, WA. Publication No. 95-310.
EPA, 1983. Results of the Nationwide Urban Runoff Program, Volume 1, Final Report.U.S. Environmental Protection Agency, Washington, DC.
EPA, 1986. Quality Criteria for Water. U.S. Environmental Protection Agency, Office ofWater Regulations and Standards, Washington, DC. EPA 440/5-86-001.

Lake Whatcom Watershed Page 63
EPA, 1992a. "National Toxics Rule." 40 CFR part 131.
EPA, 1992b. National Study of Chemical Residues in Fish. U.S. EnvironmentalProtection Agency, Office of Science and Technology, Washington, DC. EPA823-R-92-008a.
EPA, 1995. Guidance for Assessing Chemical Contaminant Data for Use in FishAdvisories - Volume 1, Fish Sampling and Analysis, Second Edition. U.S.Environmental Protection Agency, Office of Science and Technology, Office ofWater, Washington, DC. EPA 823-R-95-007.
FDA, 1985. Action Levels for Poisonous or Deleterious Substances in Human Food andAnimal Feed. U.S. Food and Drug Administration Center for Food Safety Hopkins,B., 1991and Applied Nutrition, Industry Programs Branch, Washington, DC.
Flagel, S., 1999. Personal communication. City of Seattle, Watershed Management Division.
Foulke, J. E., 1994. Mercury in Fish: Cause for Concern? FDA Consumer, September, 1994.
Galvin, D. and R. Moore, 1982. Toxicants in Urban Runoff. Metro Toxicant Report No. 2,Water Quality Division, Municipality of Metropolitan Seattle.
Hirsch, J., 1996. City of Bellingham Urban Streams Monitoring: Summary and ProgramReview. Prepared for the City of Bellingham, Department of Public Works,August 1996, Bellingham, WA.
Hopkins, B., 1991. Basic Water Monitoring Program Fish Tissue and Sediment Samplingfor 1989. Washington State Department of Ecology, Environmental Investigationsand Laboratory Services Program, Olympia, Washington
Johnson, A., D. Norton, and B.Yake, 1988 (Revised 1989). An Assessment of MetalsContamination in Lake Roosevelt. Washington State Department of Ecology,Toxics Investigations/Groundwater Monitoring Section, Olympia, WA.
Johnston, J., 1997. Personal communication. Washington State Department of Fishand Wildlife.
Kendra, W., 1988. Investigation of Recurrent Coho Salmon Mortality at the MaritimeHeritage Fish Hatchery. Washington State Department of Ecology, WaterQuality Investigations Section, Olympia, WA.
LeChevalier, M. W. and W. D. Norton, 1995. Giardia and Cryptosporidium in Rawand Finished Water. J. Am. Waterworks Assoc. 87:54-68.

Page 64 Lake Whatcom Watershed
Mabey, W.R., J. H. Smith, R. T. Podoll, H. L. Johnson, T. Mill, T. W. Chou, J. Gates, I.Waight Partridge, H. Jaber, and D. Vandenberg, 1982. Aquatic Fate Process Datafor Organic Priority Pollutants. Prepared by SRI International, Menlo Park, CA forU.S. Environmental Protection Agency Office of Water Regulations and Standards,Washington, DC.
MacCoy, D. E., and Black, R. W., 1998. Organic Compounds and Trace Elements inFreshwater Streambed Sediment and Fish from the Puget Sound Basin. U.S.Geological Survey Fact Sheet 105-98
Matthews, R. A., M. Hilles, and G. B. Matthews, 1997. Lake Whatcom MonitoringProject 1995/1996 Final Report. Prepared for the City of Bellingham Public WorksDepartment, Bellingham, WA.
Matthews, R. A., M. Hilles, and G. B. Matthews, 1998. Lake Whatcom MonitoringProject 1996/1997 Final Report. Prepared for the City of Bellingham Public WorksDepartment, Bellingham, WA.
Matthews, R. A., M. Hilles, and G. B. Matthews, 1999. Lake Whatcom MonitoringProject 1997/1998 Final Report. Prepared for the City of Bellingham Public WorksDepartment, Bellingham, WA.
MDH, 1994. Minnesota Fish Consumption Advisory. Minnesota Department of Health,Minneapolis, MN.
Merck, 1976. Merck Index, 9th Ed. Merck & Co., Rahway, NJ.
Munn, M. D. and T. M. Short, 1997. Spatial Heterogeneity of Mercury Bioaccumulationby Walleye in Franklin D. Roosevelt Lake and the Upper Columbia River,Washington. Trans. Am. Fish. Soc. 126(3): 477-487.
NAS/NAE, 1973. Water Quality Criteria, 1972. A Report of the Committee on WaterQuality Criteria, Environmental Studies Board, National Academy of Science andNational Academy of Engineering, Washington, DC.
Nauen, C. C., 1983. Compilation of Legal Limits for Hazardous Substances in Fish andFishery Products. United Nations Food & Agriculture Organization.
Norris, L. and F. Dost, 1991. Proposed Surface water Quality Criteria for SelectedPesticides Used for Forest Management and Management of Forest Tree Seedlingand Christmas Tree Plantations in Oregon and Washington. Oregon StateUniversity, Corvallis, OR.
Ostergaard E., 1992. Investigation of Recurrent Fish Kills at the Maritime Heritage FishHatchery in Bellingham: Fall 1990. Washington State Department of Ecology,Environmental Investigations and Laboratory Services Program, WatershedAssessments Section, Olympia, WA.

Lake Whatcom Watershed Page 65
PTI Environmental Services, 1991a. Drainage Basin Source Tracing Study, Phase 1Technical Memorandum. Prepared for U.S. Environmental Protection Agency,Seattle, WA.
PTI Environmental Services, 1991b. Pollutants of Concern in Puget Sound. Prepared forU.S. Environmental Protection Agency Region 10, Office of Puget Sound, Seattle WA.
Puget Sound Estuary Program (PSEP), 1986. Recommended Protocols for MeasuringConventional Sediment Variables in Puget Sound. Final Report No. TC-3991-04.Prepared by Tetra Tech, Inc., Bellevue, Washington for U.S. EnvironmentalProtection Agency, Region 10, Office of Puget Sound, Seattle, Washington, andU.S. Army Corp of Engineers, Seattle District, Seattle, Washington.
Rector, J.M. and R.A. Matthews, 1987. Lake Whatcom Monitoring Program August 1987Final Report. Prepared for the City of Bellingham Public Works Department.
Rector, J. and D. Hallock, 1995. 1994 Statewide Water Quality Assessment. WashingtonState Department of Ecology, Olympia, Washington. Publication No. 95-311.
State of Washington, 1992. Water Quality Standards for Surface Waters of the State ofWashington. Chapter 173-201A, Washington Administrative Code.
Schmitt, C.J., J.L. Zajicek, and P.H. Peterman, 1990. National Contaminant BiomonitoringProgram: Residues of Organochlorine Chemicals in U.S. Freshwater Fish, 1976-1984. Arch. Environ. Contam. Toxicol. 19: 748-781.
Voss, F.D., S.S. Embry, J.C. Ebbert, D. Davis, A.M. Frahm, and G.H. Perry, 1999.Pesticides Detected in Urban Streams During Rainstorms and Relations to RetailSales of Pesticides in King County, Washington. U. S. Geological Survey FactSheet 097-99.
Walker, S. J., R. A. Matthews, and G. B. Matthews, 1992. Lake Whatcom WatershedStorm Runoff Monitoring Project Final Report. Prepared for the City ofBellingham Public Works Department, Bellingham, WA.
Wetzel, R. G., 1983. Limnology. 2nd Ed. Saunders College Publishing, Philadelphia, PA.
Whatcom County, 1999. Whatcom County Department of Planning and Development,Bellingham, WA.
Wilson, C. and D. Norton, 1996. Stormwater Sediment Trap Pilot Study. WashingtonState Department of Ecology, Environmental Investigations and LaboratoryServices Program, Olympia, WA. Publication No. 96-347.
Wydoski, R.S. and R.R. Whitney, 1979. Inland Fishes of Washington. University ofWashington Press.

Page 66 Lake Whatcom Watershed
Zawlocki, K., 1981. A Survey of Trace Organics in Highway Runoff in Seattle,Washington. M.S. Thesis, University of Washington, Department of CivilEngineering. (Summarized in Galvin and Moore, 1982)

Appendices

Appendix A
Sample Site Descriptions

Table AA-1. Descriptions and Locations of Sampling Sites. (See Appendix C for FishCollection Locations)
Sample SiteSampleType Description Latitude x Longitude
Lake Whatcom Watershed
Lake WhatcomBasin 1
Sediment WWU monitoring Site 1, Lake WhatcomMonitoring Program. Depth = 77 ft.
48°45.74'N x 122°24.65'W
Lake WhatcomBasin 2(at DW Intake)
Sediment City of Bellingham drinking water intakeand WWU monitoring Intake Site, LakeWhatcom Monitoring Program. Depth =36 ft.
48°44.86'N x 122°23.539'W
Lake WhatcomBasin 3
Sediment WWU monitoring Site 3, Lake WhatcomMonitoring Program. Depth = 266 ft.
48°44.20'N x 122°20.139'W
Park PlaceInfluent
Water Casement on North Shore Drive,opposite Britton Rd.
48°46.15'N x 122°24.47'W
Park Place WetPond
Sediment Stormwater Cell #1 48°46.13'N x 122°24.47'W
Cable Street Water &Sediment
Manhole at Cable Street and LakeWhatcom Blvd.
48°44.90'N x 122°24.34'W
Austin Creek Water At furthest downstream golf coursefootbridge.
48°43.15'N x 122°19.41'W
Austin Creek Sediment Mouth of Austin Creek where the creekflows into Lake Whatcom.
48°43.182'N x 122°19.279'W
Whatcom Creek WatershedFever Creek Water Culvert terminus at mouth. 48°45.37'N x 122°27.48'WFever Creek Sediment Near culvert entrance on upstream side of
Iowa St.48°45.40'N x 122°27.48'W
Lincoln Creek Water &Sediment
Lincoln Creek mouth near confluencewith Whatcom Creek at the Haskellbusiness center.
48°45.25'N x 122°27.48'W
Cemetery Creek Water &Sediment
Mouth of Cemetery Creek nearconfluence with Whatcom Creek.
48°45.21'N x 122°27.11'W

Appendix B
Summary of Analytical Methods, SampleContainers, Holding Times,
and Quantitation Limits

Table AB
-1. Summ
ary of Analytical M
ethods, Sample C
ontainers, Holding Tim
es, and Quantitation Lim
its.Param
eterM
atrixD
escriptionM
ethodSam
ple Container
PreservationH
olding Time
Quantitation Lim
itsPesticides
Water
GC
/AED
EPA 8085 (draft)
glass/teflon lid liner 1gal.
4°C7 days
0.04 - 0.3 µg/L
PesticidesSedim
entG
C/A
EDEPA
8085 (draft)glass 8 oz jar, teflon lidliner
-20 °C1 year
25 - 2,000 µg/kg, dry
PesticidesTissue
GC
/ECD
EPA 8080
glass 8 oz jar, teflon lidliner
-20 °C1 year
0.24 - 14 µg/kg, wet
Polychlorinated Biphenyls
(PCBs)
TissueG
C/EC
DEPA
8080glass 8 oz jar, teflon lidliner
-20 °C1 year
2.4 µg/kg, wet
Semivolatile organics (Low
-level)
Water
Capillary
GC
/MS
EPA 8270
glass/teflon lid liner, 1gal
4°C7 days
0.1 - 3 µg/L
Semivolatile organics (Low
-level)
Sediment
Capillary
GC
/MS
EPA 8270
glass 8 oz jar, teflon lidliner
-20 °C1 year
25 - 500 µg/kg, dry
Extended Diesel R
angePetroleum
Hydrocarbons
Water
GC
/FIDM
anchester Method
NW
TPH-D
xglass/teflon lid liner 1gal
4 °C, H
Cl, <pH
27 days
0.1 mg/L
Extended Diesel R
angePetroleum
Hydrocarbons
Sediment
GC
/FIDM
anchester Method
NW
TPH-D
xglass 8 oz jar, teflon lidliner
4 °C14 days
200 mg/kg, dry
Metals -6 (D
issolved, low-
level)W
aterIC
P/MS
EPA 200.8, M
anchesterclean room
SOP
Pre-cleaned 500mL
TeflonFilter, 4°C
, HN
O3,
<pH 2
6 months
0.02 - 0.3 µg/L
Metals -6
TissueIC
PEPA
6010glass 8 oz jar, teflon lidliner
4°C6 m
onths1 - 6 m
g/kg, wet
Mercury (Total recoverable,
low level
Water
CV
AA
EPA 245.7, M
anchesterC
lean Room
SOP
Teflon 500 mL
filter, 4 °C, H
NO
3(purified), <pH
26 m
onths0.010 µg/L
Mercury
TissueC
VA
AEPA
245.5glass 8 oz jar, teflon lidliner
4°C28 days
0.005 mg/kg, w
et
Metals-13:
Sb,Be,C
d,Cr,C
u,Ni,A
g,Zn/A
s/Se/Pb/Tl/Hg
Sediment
ICP/G
FAA
(CV
AA
for Hg)
EPA 6010/EPA
206.2/EPA 270.2/EPA
239.2/EPA 279.2/EPA
245.5
glass 8 oz jar, teflon lidliner
-20°C6 m
onths0.005 - 3 m
g/kg, dry
Total PhosphorusW
aterA
scorbic acidEPA
365.3PE 125 m
L4 °C
, H2 SO
4, <pH 2
28 days10 µg/L
Total PhosphorusSedim
entIC
PEPA
6010glass 8 oz jar, teflon lidliner
-20 °C6 m
onths10 m
g/kg, dry
Total Nitrogen (TPN
)W
aterPersulfate
VA
LDER
RA
MA
PE 125 mL
4 °C, H
2 SO4, <pH
228 days
10 µg/LTotal N
itrogen (TKN
)Sedim
entK
jeldahlEPA
351.2Mglass 8 oz jar
4 °C28 days
100 mg/kg, dry
Hardness
Water
EDTA
Titrimetric
SM 2340B
PE 125 mL
4 °C, H
NO
3, <pH 2
6 months
0.2 mg/L
Total Organic C
arbonW
aterC
ombustion IR
EPA 415.1
PE 60 mL
4°C, H
2 SO4, <pH
228 days
1 mg/L
Total Organic C
arbonSedim
entC
ombustion IR
PSEP, 1986glass 4 oz
4 °C28 days
1mg/kg, dry
Total Suspended SolidsW
aterG
ravimetric
EPA 160.2
PE 1 L4 °C
7 days1.0 m
g/LG
rain SizeSedim
entSieve-pipet
PSEP, 1986PE W
hirl-Pak4 °C
Unspecified
-2-10 % phi size
Lipids (Percent)Tissue
Gravim
etricEPA
608.5subset of pesticidesam
ple-20 °C
1 year0.1%

Appendix C
Biological Data and Collection Sites for Fish

Table AC-1. Biological Data for Fish.
Field Lab Total FilletSample Sample Length Weight Size**No. No. (45-) Species (mm) (g) Sex Sample Type (g) Observations1 8130 Kokanee Oncorhynchus nerka 238 119 F Skin-on fillet, Liver* 39 Still bright5 " " " 236 129 " " 48 "6 " " " 227 102 " " 38 "7 " " " 241 123 " " 46 "9 " " " 230 118 " " 47 "10 " " " 249 133 " " 55 "11 " " " 250 153 " " 53 "
mean= 239 125 47s.d.= 9 16 6
2 8131 Kokanee Oncorhynchus nerka 239 128 M Skin-on fillet, Liver* 48 Still bright although males3 " " " 213 90 " " 38 are beginning to show slight4 " " " 210 83 " " 35 humped back and elongated8 " " " 238 133 " " 58 snout; testes fairly well12 " " " 212 90 " " 36 developed13 " " " 244 123 " " 46 "14 " " " 251 134 " " 47 "15 " " " 214 98 " " 41 "
mean= 228 110 44s.d.= 17 22 8
ECY-1 8133 Smallmouth bass Micropterus dolomieui 238 202 nd Skin-on fillet 33ECY-2 " " " 236 199 " " 28ECY-3 " " " 309 432 " " 57ECY-6 " " " 231 170 " " 26ECY-7 " " " 260 286 " " 50ECY-8 " " " 236 184 " " 27ECY-9 " " " 257 259 " " 40ECY-12 " " " 198 135 " " 20
mean= 246 233 35s.d.= 32 93 13

Table AC-1. Biological Data for Fish.
Field Lab Total FilletSample Sample Length Weight Size**No. No. (45-) Species (mm) (g) Sex Sample Type (g) Observations
WDFW-65 8134 Smallmouth bass Micropterus dolomieui 390 907.5 nd Skin-on fillet 139WDFW-66 " " " 388 858.5 " " 130WDFW-71 " " " 391 815 " " 120WDFW-72 " " " 393 938.5 " " 152WDFW-73 " " " 399 970 " " 154WDFW-74 " " " 392 839 " " 154WDFW-75 " " " 386 877.5 " " 154WDFW-96 " " " 405 1192.5 " " 156 Missing right eye
mean= 393 925 145s.d.= 6 120 14
WDFW-G29 8135/38 Longnose sucker Catostomus catostomus 225 169 nd Whole bodyWDFW-G29-1 " " " 230 151 " "WDFW-G45 " " " 241 148 " "WDFW-G45-1 " " " 246 145.5 " "WDFW-G45-2 " " " 239 139 " "WDFW-G45-3 " " " 264 167.5 " "WDFW-G45-4 " " " 149 155.5 " "
mean= 228 154s.d.= 37 11
ECY-1 8136 Sculpin Cottus spp. 125 32 nd Whole bodyECY-2 " " " 134 36 " "ECY-3 " " " 114 21 " "ECY-4 " " " 100 14 " "ECY-5 " " " 125 31 " "ECY-6 " " " 138 38 " "ECY-7 " " " 120 32 " "
mean= 122 29s.d.= 13 9

Table AC-1. Biological Data for Fish.
Field Lab Total FilletSample Sample Length Weight Size**No. No. (45-) Species (mm) (g) Sex Sample Type (g) Observations
1 8137 Crayfish Pacifastacus leniusculus nd 48 nd Tail muscle2 " " " " 37 " "3 " " " " 15 " "4 " " " " 61 " "5 " " " " 19 " "6 " " " " 61 " "7 " " " " 36 " "8 " " " " 37 " "9 " " " " 33 " "10 " " " " 31 " "11 " " " " 33 " "12 " " " " 37 " "13 " " " " 32 " "14 " " " " 12 " "15 " " " " 24 " "16 " " " " 15 " "17 " " " " 32 " "18 " " " " 23 " "19 " " " " 8 " "20 " " " " 18 " "21 " " " " 18 " "22 " " " " 4 " "23 " " " " 11 " "24 " " " " 22 " "25 " " " " 32 " "26 " " " " 7 " "27 " " " " 13 " "28 " " " " 26 " "29 " " " " 42 " "
mean= 27s.d.= 15
*Liver sample (45-8132) is a composite from all fifteen kokanee.**Fillets from kokanee taken from both sides of fish. Filets from smallmouth bass taken from one (left) side only.
total weight of composite sample = 67 g

Table AC-2. Fish Collection Locations and Methods.
Field LabSample Sample CollectionNo. No. (45-) Species Location Date Method1 8130 Kokanee Lk. Whatcom off island south of Austin Cr. 9/29-30/98 Gillnet5 " " " " "6 " " " " "7 " " " " "9 " " " " "10 " " " " "11 " " " " "
2 8131 Kokanee Lk. Whatcom off island south of Austin Cr. 9/29-30/98 Gillnet3 " " " " "4 " " " " "8 " " " " "12 " " " " "13 " " " " "14 " " " " "15 " " " " "
ECY-1 8133 Smallmouth bass Silver Beach area at north end of Lk. Whatcom 8/19/98 ElectroshockingECY-2 " " " " "ECY-3 " " " " "ECY-6 " " " " "ECY-7 " " " " "ECY-8 " " " " "ECY-9 " " " " "ECY-12 " " " " "
WDFW-65 8134 Smallmouth bass Lk. Whatcom off shore just west of Strawberry Pt. 8/17-18/98 GillnetWDFW-66 " " " " "WDFW-71 " " Lk. Whatcom off Austin Cr. mouth " "WDFW-72 " " " " "WDFW-73 " " " " "WDFW-74 " " " " "WDFW-75 " " " " "WDFW-96 " " Off west shore of Lk. Whatcom 3.5 km south of Reveille Is. 8/18-19/98 "
WDFW-G29 8135/38 Longnose sucker Off east shore of Lk. Whatcom directly across from Reveille Is. 8/17-18/98 GillnetWDFW-G29-1 " " " " "WDFW-G45 " " South end of Lk. Whatcom mdwy. btwn. South Bay and Anderson Cr. 8/18-19/98 "WDFW-G45-1 " " " " "WDFW-G45-2 " " " " "WDFW-G45-3 " " " " "WDFW-G45-4 " " " " "

Table AC-2. Fish Collection Locations and Methods.
Field LabSample Sample CollectionNo. No. (45-) Species Location Date Method
ECY-1 8136 Sculpin Whatcom Cr. Below Lincoln Cr. 8/20/98 ElectroshockingECY-2 " " " " "ECY-3 " " " " "ECY-4 " " " " "ECY-5 " " Whatcom Cr. Above Cornwall Ave. " "ECY-6 " " " " "ECY-7 " " " " "
1 8137 Crayfish Whatcom Cr. Below Cornwall Ave. 8/19-20/98 Trap2 " " " " "3 " " " " "4 " " " " "5 " " " " "6 " " " " "7 " " " " "8 " " " " "9 " " " " "10 " " " " "11 " " " " "12 " " " " "13 " " " " "14 " " " " "15 " " " " "16 " " " " "17 " " " " "18 " " " " "19 " " " " "20 " " " " "21 " " " " "22 " " " " "23 " " " " "24 " " " " "25 " " " " "26 " " " " "27 " " " " "28 " " " " "29 " " " " "

Appendix D
Narrative Quality Assurance/Quality Control Reviews

Washington State Department of EcologyManchester Laboratory
July 15, 1998
To: Dale Davis
From: Casey Maggart, Chemist
SUBJECT: General Chemistry Quality Assurance memo for Lake Whatcom.
SUMMARY
The data generated by the analysis of these samples can be used noting the data qualificationsdiscussed in this memo. All analyses requested were evaluated using USEPA ContractLaboratory Program (CLP) quality assurance requirements.
Sample Information
These samples from the Lake Whatcom project were received by the Manchester Laboratory on06/24/98 in good condition.
Holding Times
Analysis of all parameters was performed within USEPA established holding times.
ANALYSIS PERFORMANCE
Instrument Calibration
Where applicable, instrument calibration was performed before each analytical run and checkedby initial calibration verification standards and blanks. All initial and continuing calibrationverification standards were within the relevant USEPA (CLP) control limits. A correlationcoefficient of 0.995 or greater was met as stated in CLP calibration requirements.
Procedural Blanks
The procedural blanks associated with these samples showed no analytically significant levels ofanalytes.

Spiked Sample Analysis
Spike sample analyses were performed on the nutrients on this data set. All spike recoverieswere within the CLP acceptance limits of +/- 25%.
Precision Data
The results of the spike and duplicate samples were used to evaluate precision on this sample set.The Relative Percent Difference (RPD) for all parameters were within their acceptance windowsof +/- 20%.
Laboratory Control Sample Analyses
LCS analyses were within the windows established for each parameter.
Other Quality Assurance Measures and Issues
All nutrient samples with a “U” qualifier have a result less than the detection limit of 0.01 mg/L.
Please call Casey Maggart at SCAN 871-8824 to further discuss this project.

Washington State Department of EcologyManchester Laboratory
November 19, 1998
TO: Dave Serdar
FROM: Becky Bogaczyk, Chemist
SUBJECT: General Chemistry Quality Assurance memo for Lake Whatcom
SUMMARY
The data generated by the analysis of these samples can be used without qualification. Allanalyses requested were evaluated by established regulatory quality assurance guidelines.
SAMPLE INFORMATION
Samples 98428080 - 98428088, for Lake Whatcom project were received by Manchester.Laboratory on 10/13/98 in good condition.
HOLDING TIMES
All analyses were performed within established EPA holding times.
ANALYSIS PERFORMANCE
Instrument Calibration
Instrument calibration was checked by initial calibration verification standards and blanks and allinitial and continuing calibration verification standards were within control limits. A correlationcoefficient of 0.995 or greater was met. Balances are professional calibrated yearly, verifiedmonthly and calibrated in-house daily.
Procedural Blanks
The procedural blanks associated with these samples showed no significant analytical levels ofanalytes.
.Spiked Sample Analysis
Spike samples were performed where applicable with all spike recoveries within acceptancelimits of ± 25%.

Precision Data
Spike sample results and duplicate sample results were used to evaluate precision on this sampleset. Relative Percent Differences (RPD) for general chemistry parameters were within the 20%acceptance window for duplicate analysis. Laboratory duplication is performed at a frequency ofat least 10%.
Laboratory Control Sample (LCS) Analyses
LCS analyses were within the windows established for each parameter.
Other Quality Assurance Measures and Issues
The "U'' qualification indicates the analyte was not detected at or above the reported result.
Please call Becky Bogaczyk at (360) 871-8830 to further discuss this project.
cc: Project File

Washington State Department of EcologyManchester Laboratory
November 19,1998
TO: Dave Serdar
FROM: Becky Bogaczyk, Chemist
SUBJECT: General Chemistry Quality Assurance memo for Lake Whatcom
SUMMARYThe data generated by the analysis of these samples can be used without qualification. Allanalyses requested were evaluated by established regulatory quality assurance guidelines.
SAMPLE INFORMATION
Samples 98428105, 106,107, 108, 109, 111, and 112 for Lake Whatcom project were received byManchester Laboratory on 10/15/98 in good condition.
HOLDING TIMES
All analyses were performed within established EPA holding times.
ANALYSIS PERFORMANCE
Instrument Calibration
Instrument calibration was checked by initial calibration verification standards and blanks and allinitial and continuing calibration verification standards were within control limits. A correlationcoefficient of 0.995 or greater was met
Procedural Blanks
The procedural blanks associated with these samples showed no significant analytical levels ofanalytes.
Precision Data
Duplicate sample results were used to evaluate precision on this sample set. Relative PercentDifferences (RPD) for general chemistry parameters were within the 20% acceptance window forduplicate analysis. Laboratory duplication is performed at a frequency of at least 10%.
Laboratory Control Sgmple (LCS) Analvses
LCS analyses were within the windows established for each parameter.
Please call Becky Bogaczyk at (360) 871-8830 to further discuss this project.cc: Project File

State of Washington Department of EcologyManchester Environmental Laboratory
7411 Beach Dr. East Port Orchard WA. 983 66
November 16, 1998
Project: Lake Whatcom
Samples: 42-8105-09, 11-12
Laboratory: Rosa Environmental
By: Pam Covey
Case Summary
These samples required seven (7) Grain Size analyses on sediment using Puget Sound EstuaryProtocol (PSEP) method for gravel, sand, silt and clay fractions only. The samples were receivedat the Manchester Environmental Laboratory on October 15, 1998 and transported to the contractlab on October 19, 1998 for Grain Size analyses.
The analyses were reviewed for qualitative and quantitative accuracy, validity and usefulness.
The results are acceptable for use as reported.
1 of 1

400 Ninth Avenue N., Suite BSeattle, WA 98109-5187
Rosa Environmental & Geotechnical Laboratory, LLC (206) 287-9122
Client: Washington State Department of Ecology REGL Project No.: 1004-0015Manchester Lab
Client Project No.: Lake Whatcom Sample Batch No.: 1004-015-01
Case Narrative
1. The samples were received on October 19, 1998, and were in good condition. Therewere seven samples. A duplicate was run on one sample and is reported in the QASummary.
2. The testing was performed according to Puget Sound Estuary Program grain sizedistribution protocols, with modifications for only the major components (gravel, sand, silt,and clay).
3. Sample 42-8106 had a before/after Q/A ratio of 1.084, which is outside of Rosa'sacceptable range. There is not an acceptable range listed in the PSEP method. Thebefore sample weight is calculated from the wet weight and the moisture content. Theafter weight is calculated from the weight retained on the #230 sieve and the 20 secondpipette reading. When the before/after ratio is not within 5% (95.0-105.0) it is usually dueto the sample taken for the moisture content being slightly different than the grain sizesample. This results in moisture contents that are different for the two samples. Themoisture content was back calculated for the grain size sample and found to be 350.0,versus 315.0. This sample was mostly water, which is hard to split accurately for a grainsize test.
4. Sample 42-8108 had a before/after ratio of 0.940 which is outside Rosa's acceptablerange of 0.95-1.05. The moisture content was back calculated for the grain size sampleand found to be 143.3, versus 158.7. Also, this sample had fewer that 5 g of fines in thepipette portion of the analysis. PSEP requires between 5 and 25 g. Nearly the entiresample was used for the analysis. This lack of fines in the pipette portion may haveeffected the accuracy of the pipette analysis.

State of Washington Department of EcologyManchester Environmental Laboratory
7411 Beach Dr. East Port Orchard WA. 98366
February 9, 1999
Project: Lake Whatcom
Samples: 03-6090-92
Laboratory: Rosa Environmental
By: Pam Covey
Case Summary
These samples required three (3) Grain Size analyses on sediment using Puget Sound EstuaryProtocol (PSEP) method for gravel, sand, silt and clay fractions only. The samples were receivedat the Manchester Environmental Laboratory on January 21, 1999 and transported to the contractlab on January 25, 1999 for Grain Size analyses.
The analyses were reviewed for qualitative and quantitative accuracy, validity and usefulness.See narrative from Rosa for further explanation on sample analysis problems.
The results are acceptable for use as reported.

400 Ninth Avenue N., Suite BSeattle, WA 98109-5187
Rosa Environmental & Geotechnical Laboratory, LLC (206) 287-9122
Client: Washington State Department of Ecology REGL Project No.: 1004-018Manchester Lab
Client Project No.: Lake Whatcom Sample Batch No.: 1004-019
Case Narrative
1. The samples were received on January 27,1999, and were in good condition. Sampleswere prepared on January 29 and were finished February 3, 1999.
2. Very little sample was available for all samples. Sample 036091, 036092 and its duplicatehad less than 5 grams of Wt -230 Solids.
3. No other anomolies were found.

Washington State Department of EcologyManchester Laboratory
March 10, 1999
TO: Dave Serdar
FROM: Becky Bogaczyk, Chemist
SUBJECT: General Chemistry Quality Assurance memo for Lake Whatcom week 03
SUMMARY
The data generated by the analysis of these samples can be used without qualification. All analysesrequested were evaluated by established regulatory quality assurance guidelines.
SAMPLE INFORMATION
Samples for Lake Whatcom week 03 project were received by Manchester Laboratory on 01/21/99 ingood condition.
HOLDING TIMES
All analyses were performed within established EPA holding times.
ANALYSIS PERFORMANCE
Instrument Calibration
Instrument calibration was checked by initial calibration verification standards and blanks and all initial andcontinuing calibration verification standards were within control limits. A correlation coefficient of 0.995 orgreater was met.
Procedural Blank
The procedural blanks associated with these samples showed no significant analytical levels of analytes.
Spiked S ample Analysis
Spike samples were performed where applicable with all spike recoveries within acceptance limits of ± 25%.
Precision Data
Spike sample results and duplicate sample results were used to evaluate precision on this sample set.Relative Percent Differences (RPD) for general chemistry parameters were within the 20% acceptancewindow for duplicate analysis. Laboratory duplication is performed at a frequency of at least 10%.
Laboratory Control Sample (LCS) Analyses
LCS analyses were within the windows established for each parameter.
Other Quality Assurance Measures and Issues
Please call Jim Ross at (360) 871-8808 to further discuss this project.
cc: Project File
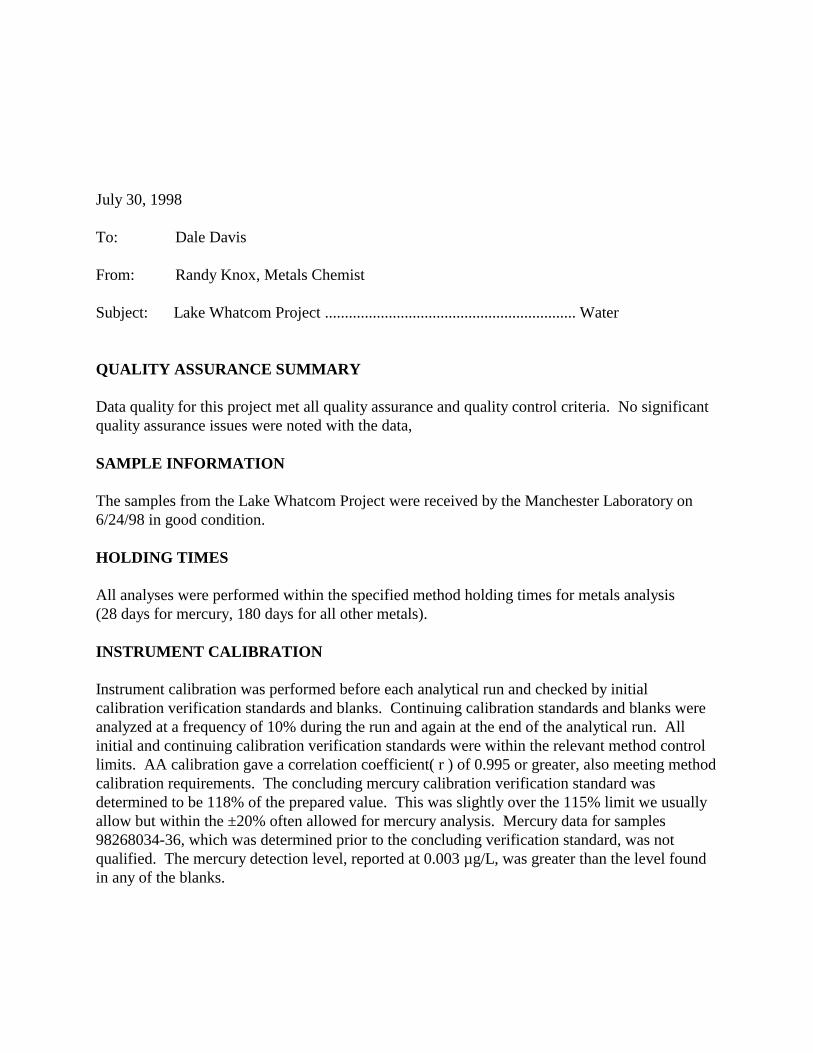
July 30, 1998
To: Dale Davis
From: Randy Knox, Metals Chemist
Subject: Lake Whatcom Project ............................................................... Water
QUALITY ASSURANCE SUMMARY
Data quality for this project met all quality assurance and quality control criteria. No significantquality assurance issues were noted with the data,
SAMPLE INFORMATION
The samples from the Lake Whatcom Project were received by the Manchester Laboratory on6/24/98 in good condition.
HOLDING TIMES
All analyses were performed within the specified method holding times for metals analysis(28 days for mercury, 180 days for all other metals).
INSTRUMENT CALIBRATION
Instrument calibration was performed before each analytical run and checked by initialcalibration verification standards and blanks. Continuing calibration standards and blanks wereanalyzed at a frequency of 10% during the run and again at the end of the analytical run. Allinitial and continuing calibration verification standards were within the relevant method controllimits. AA calibration gave a correlation coefficient( r ) of 0.995 or greater, also meeting methodcalibration requirements. The concluding mercury calibration verification standard wasdetermined to be 118% of the prepared value. This was slightly over the 115% limit we usuallyallow but within the ±20% often allowed for mercury analysis. Mercury data for samples98268034-36, which was determined prior to the concluding verification standard, was notqualified. The mercury detection level, reported at 0.003 µg/L, was greater than the level foundin any of the blanks.

PROCEDURAL BLANKS
The procedural blanks associated with these samples showed no analytically significant levels ofanalyte.
SPIKED SAMPLES ANALYSIS
Spiked and duplicate spiked sample analyses were performed on this data set. All spikerecoveries were within the acceptance limits of 25%.
PRECISION DATA
The results of the spiked and duplicate spiked samples, or in the case of hardness determination –duplicate sample results, were used to evaluate precision on this sample set. The relative percentdifference (RPD) for all analytes was within the 20% acceptance window for duplicate analysis.
LABORATORY CONTROL SAMPLE (LCS) ANALYSIS
LCS analyses were within the windows established for each parameter.
Please call Randy Knox at SCAN 360-871-8811 or Jim Ross at SCAN 360-871-8808 to furtherdiscuss this project.
RLK:rlk

November 30, 1998
To: Dave Serdar
From: Randy Knox, Metals Chemist
Subject: Lake Whatcom Project ........................................................... Water
QUALITY ASSURANCE SUMMARY
Data quality for this project met all quality assurance and quality control criteria. No significantquality assurance issues were noted with the data.
SAMPLE INFORMATION
The samples from the Lake Whatcom Project were received by the Manchester Laboratory on10/13/98 in good condition..
HOLDING TIMES
All analyses were performed within the specified method holding times for metals analysis(28 days for mercury, 180 days for all other metals).
INSTRUMENT CALIBRATION
Instrument calibration was performed before each analytical run and checked by initialcalibration verification standards and blanks. Continuing calibration standards and blanks wereanalyzed at a frequency of 10% during the run and again at the end of the analytical run. Allinitial and continuing calibration verification standards were within the relevant method controllimits. AA calibration gave a correlation coefficient ( r ) of 0.995 or greater, also meetingmethod calibration requirements.
PROCEDURAL BLANKS
The procedural blanks associated with these samples showed no analytically significant levels ofanalyte.

SPIKED SAMPLES ANALYSIS
Spiked and duplicate spiked sample analyses were performed on this data set. All spikerecoveries were within the acceptance limits of +/- 25%.
PRECISION DATA
The results of the spiked and duplicate spiked samples, or in the case of hardness determination –duplicate sample results, were used to evaluate precision on this sample set. The relative percentdifference (RPD) for all analytes was within the 20% acceptance window for duplicate analysis.
LABORATORY CONTROL SAMPLE (LCS) ANALYSIS
LCS analyses were within the windows established for each parameter.
Please call Randy Knox at SCAN 360-871-8811 or Jim Ross at SCAN 360-871-8808 to furtherdiscuss this project.
RLK:rlk

December 7, 1998
To: Dave Serdar
From: Randy Knox, Metals Chemist.
Subject: Lake Whatcom Project ..............................................Sediment
QUALITY ASSURANCE SUMMARY
Data quality for this project met all quality assurance and quality control criteria, with theexceptions that: 1. Recoveries of added antimony and thallium were low, 2. Recoveries ofantimony and silver were low from the LCS sample, and 3. Serial dilution results for nickelshowed a relative percent difference (RPD) of 12%. No other significant, quality assuranceissues were noted with the data.
SAMPLE INFORMATION
The samples from the Lake Whatcom Project were received by the Manchester Laboratory on10/15/98 in good condition.
HOLDING TIMES
All analyses were performed within the specified method holding times for metals analysis(28 days for mercury, 180 days for all other metals).
INSTRUMENT CALIBRATION
Instrument calibration was performed before each analytical run and checked by initial calibrationverification standards and blanks. Continuing calibration standards and blanks were analyzed at afrequency of 10% during the run and again at the end of the analytical run. All initial andcontinuing calibration verification standards were within the relevant method control limits. Anexception was that silver continuing calibration verification was 113% and 132% of theoretical fortwo determinations of the continuing calibration verification standard. Initial and concluding silverlevels in the verification standard were acceptable. Silver data was qualified UJ, as undetected atestimated detection level, or J, as estimated, if the determined level was in excess of the detectionlevel.

AA calibration gave a correlation coefficient ( r ) of 0.995 or greater, also meeting methodcalibration requirements.
PROCEDURAL BLANKS
The procedural blanks associated with these samples showed no analytically significant levels ofanalyte, except copper. Copper sample levels were greater than ten times that in the blanks, sodata was not qualified.
SPIKED SAMPLES ANALYSIS
Spiked and duplicate spiked sample analyses were performed on this data set. All spikerecoveries, except those for antimony and thallium were within the acceptance limits of 25%.Antimony data was qualified UJ, as undetected at estimated detection level due to failure torecover antimony from the matrix. Thallium data was qualified UJ or J, as estimated, due to lowrecoveries (13% and 9%) of added thallium.
PRECISION DATA
The results of the spiked and duplicate spiked samples were used to evaluate precision on thissample set. The relative percent difference (RPD) for all analytes was within the 20% acceptancewindow for duplicate analysis
SERIAL DILUTION
A five times serial dilution of one sample was analyzed by ICP and the analytical results,corrected for dilution, compared to the original sample analysis. The RPD (relative %difference) for analytes at levels 50X greater than the detection level was acceptable, within±10%. The RPD for nickel was 12%. Nickel data was not qualified for this marginal result.
LABORATORY CONTROL SAMPLE (LCS) ANALYSIS
LCS analyses were within the windows established for each parameter, except antimony andsilver. Antimony and silver data were qualified UJ, as undetected at estimated detection level, orJ, as estimated, if the result was in excess of the detection level. The LCS sample was notcertified for phosphorous.
Please call Randy Knox at SCAN 360-871-8811 or Jim Ross at SCAN 360-871-8808 to furtherdiscuss this project.
RLK:rlk

Washington Department of EcologyManchester Environmental Laboratory7411 Beach Drive EastPort Orchard, WA 98366
March 5, 1999
TO: Dave SerdarFROM: Jim Ross, Manchester labSUBJECT: Quality Assurance memo for the Lake Whatcom project.
SUMMARYData for this project met all quality assurance and quality control criteria with the followingexceptions. Antimony LCS and spike recovery were low, and all Antimony results qualified asestimated. Lead spike recovery was high. All lead data is qualified as estimated. All other datacan be used without qualification.
SAMPLE RECEIPTThe samples were received by the Manchester Laboratory on 1/21/99
HOLDING TIMESAll analyses were performed within the specified holding time (28 days for Hg, 180 days allother metals).
INSTRUMENT CALIBRATIONInstrument calibration was performed before each analytical run and checked by initialcalibration verification standards and blanks. Continuing calibration standards and blanks wereanalyzed at a frequency of 10% during the run and again at the end of the analytical run. Allinitial and continuing calibration verification standards and blanks were within the relevantcontrol limits.
PROCEDURAL BLANKSThe procedural blanks associated with these samples showed no analytically significant level ofanalyte.
SPIKED SAMPLE ANALYSESAll spike and duplicate spike recoveries met the acceptance criteria (75-125%) except antimonyand lead.
PRECISION DATAPrecision estimates were unavailable due to limited sample amount. As per clients request, onlysingle spikes were performed.
LABORATORY CONTROL SAMPLE (LCS) ANALYSESAll LCS analyses were within the acceptance criteria for the individual analytes except antimony.
Please call Jim Ross at (360) 871-8808 or Randy Knox at (360) 871-8811 to further discuss thisproject

December 14, 1998
To: Dave Serdar
From: Randy Knox, Metals Chemist
Subject: Lake Whatcom Project ................................................. Tissue
QUALITY ASSURANCE SUMMARY
Data quality for this project met all quality assurance and quality control criteria, with theexception that some copper carryover was noted in verification and procedure blanks and zincwas detected in the procedure blank. Copper recovery was high from the DORM-2 LCS sample.No other significant quality assurance issues were noted with the data.
SAMPLE INFORMATION
The samples from the Lake Whatcom Project were collected and were received by theManchester Laboratory from 8/18/98 to 9/30/98 in good condition. Samples were stored in afrozen condition at the laboratory.
HOLDING TIMES
All analyses were performed within the specified method holding times for metals analysis(28 days for mercury, 180 days for all other metals). Note the mercury holding time did notapply during the period when the sample was frozen.
INSTRUMENT CALIBRATION
Instrument calibration was performed before each analytical run and checked by initialcalibration verification standards and blanks. Continuing calibration standards and blanks wereanalyzed at a frequency of 10% during the run and again at the end of the analytical run. Allinitial and continuing calibration verification standards, except those for copper, were within therelevant method control limits. AA calibration gave a correlation coefficient ( r ) of 0.995 orgreater, also meeting method calibration requirements. Copper carryover was detected incalibration and verification blanks. The reported copper detection level was raised above thelevel detected in continuing calibration verification blanks. Results for continuing verificationblanks indicate less copper carryover during the period when the samples were analyzed than inthe, earlier period when the LCS samples were determined.

PROCEDURAL BLANKS
The procedural blanks associated with these samples showed no analytically significant levels ofanalyte, except zinc and copper. The reported zinc and copper detection levels were raised abovethe levels reported in the procedure blank.
SPIKED SAMPLES ANALYSIS
Spiked and duplicate spiked sample analyses were performed on this data set. All spikerecoveries were within the acceptance limits of 25%.
PRECISION DATA
The results of the spiked and duplicate spiked were used to evaluate precision on this sample set.The relative percent difference (RPD) for all analytes was within the 20% acceptance window forduplicate analysis.
LABORATORY CONTROL SAMPLE (LCS) ANALYSIS
LCS analyses were within the windows established for each parameter, except copper from theDORM-2 LCS - tissue sample. Copper level in this sample was low and the result, 245%recovery, appeared to be raised by the level of carryover previously noted. Data was notqualified based on this result. Results for the ERA sediment LCS by the method weresatisfactory. DORM-2 LCS levels of lead and cadmium were too low to be detected by the usedmethods.
Please call Randy Knox at SCAN 360-871-8811 or Jim Ross at SCAN 360-871-8808 to furtherdiscuss this project.
RLK:rlk

Manchester Environmental Laboratory7411 Beach DR E, Port Orchard Washington 98366
CASE NARRATIVE
July 28, 1998
Subject: Lake Whatcom
Samples: 98268030 - 98268036
Case No. 199498
Officer: Dale Davis
By: M. Mandjikov
NWTPH-Dx Analysis of the Lake Whatcom Water Samples
SUMMARY:
Samples 98268030 - 98268036 were analyzed for diesel and extended diesel range hydrocarbons.
Petroleum hydrocarbons eluting in the heavy fuel oil range of the gas chromatogram weredetected in all samples except 98268031. These hydrocarbons were collectively quantitatedagainst a Bunker C standard. The pattern of the unknown appears to be consistent withweathered Bunker C (or Fuel Oil #6). It does not match the patterns or retention times of #2Diesel or motor oil. All results are qualified as estimates, since the unknown appeared to beheavily weathered and the reference Bunker C used for quantitation is not weathered.
I have concerns that this type of contamination was found at so many unrelated -ambientenvironmental sites. It is uncommon to find heavy fuel oil at these types of locations. Motor oilis usually encountered. It is possible that there may have been a contaminant introduced duringthe sampling process or within the sampling equipment. The laboratory blanks and controlsamples show no evidence of this compound present. The compound concentration wasconsistent in sample 98268033 and both of the replicates of this sample used for spiking.
I suggest that a field blank, a transport blank and a duplicate sample be collected during the nextround of sampling at this site to rule out the possibility of field contamination.
All data are usable as reported. For any additional information concerning the TPH analysis -portion of this project please call Myrna Mandjikov 360-871-8814. For sampling informationplease call Pam Covey 360-871-8827.
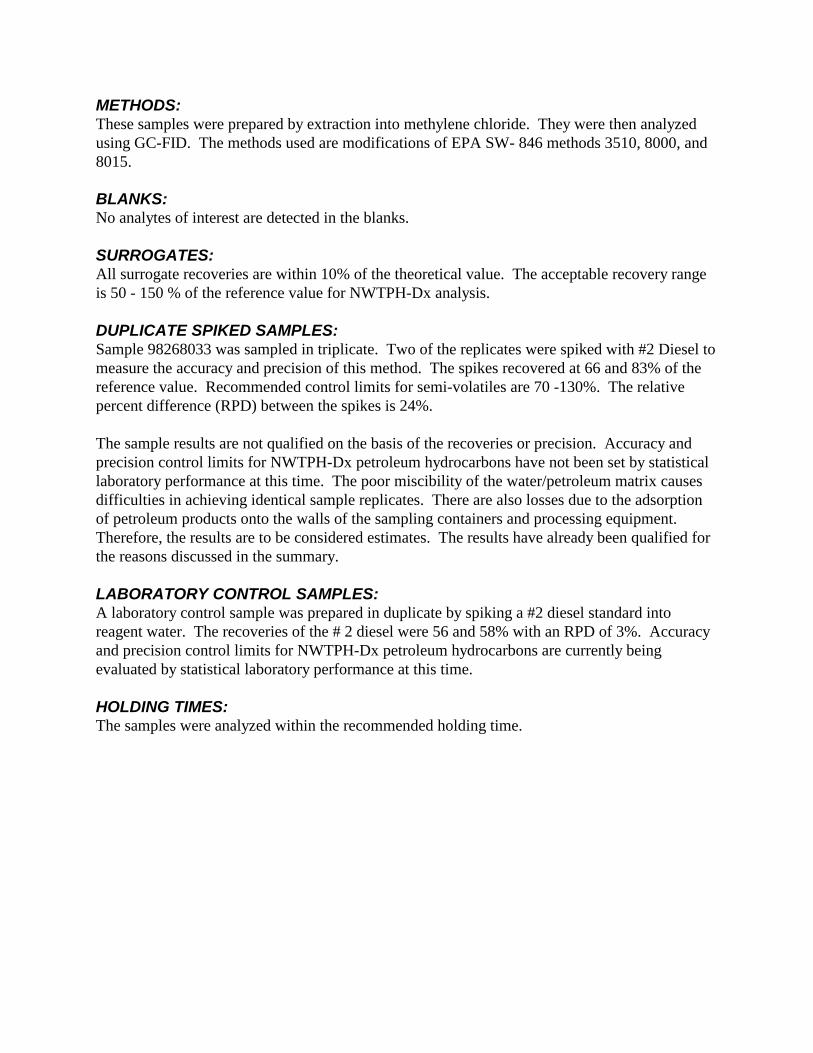
METHODS:These samples were prepared by extraction into methylene chloride. They were then analyzedusing GC-FID. The methods used are modifications of EPA SW- 846 methods 3510, 8000, and8015.
BLANKS:No analytes of interest are detected in the blanks.
SURROGATES:All surrogate recoveries are within 10% of the theoretical value. The acceptable recovery rangeis 50 - 150 % of the reference value for NWTPH-Dx analysis.
DUPLICATE SPIKED SAMPLES:Sample 98268033 was sampled in triplicate. Two of the replicates were spiked with #2 Diesel tomeasure the accuracy and precision of this method. The spikes recovered at 66 and 83% of thereference value. Recommended control limits for semi-volatiles are 70 -130%. The relativepercent difference (RPD) between the spikes is 24%.
The sample results are not qualified on the basis of the recoveries or precision. Accuracy andprecision control limits for NWTPH-Dx petroleum hydrocarbons have not been set by statisticallaboratory performance at this time. The poor miscibility of the water/petroleum matrix causesdifficulties in achieving identical sample replicates. There are also losses due to the adsorptionof petroleum products onto the walls of the sampling containers and processing equipment.Therefore, the results are to be considered estimates. The results have already been qualified forthe reasons discussed in the summary.
LABORATORY CONTROL SAMPLES:A laboratory control sample was prepared in duplicate by spiking a #2 diesel standard intoreagent water. The recoveries of the # 2 diesel were 56 and 58% with an RPD of 3%. Accuracyand precision control limits for NWTPH-Dx petroleum hydrocarbons are currently beingevaluated by statistical laboratory performance at this time.
HOLDING TIMES:The samples were analyzed within the recommended holding time.

DATA QUALIFIERS:
Code Definition
E Reported result is an estimate because it exceeds the calibration.
J The analyte was positively identified. The associated numerical result is anestimate.
N There is evidence the analyte is present in this sample.
NJ There is evidence that the analyte is present. The associated numerical result is anestimate.
NAF Not analyzed for.
REJ The data are unusable for all purposes.
U The analyte was not detected at or above the reported result.
UJ The analyte was not detected at or above the reported estimated result.
Bold Type The analyte was present in the sample. Used as a visual aid to locate detectedcompounds on the report sheet.

Manchester Environmental Laboratory7411 Beach DR E, Port Orchard Washington 98366
CASE NARRATIVE
November 16, 1998
Subject: Lake Whatcom
Samples: 98428080 - 98428088
Case No. 332398
Officer: Dave Serdar
By: M. Mandjikov
NWTPH-Dx Analysis of the Lake Whatcom Water Samples
SUMMARY:Samples 98428080 - 98428088 were analyzed for diesel and diesel range petroleum hydrocarbons.All samples except for 98428080 had evidence of a highly weathered petroleum compound elutingover the heavy fuel oil range. It could be highly weathered Bunker C, #5 or #6 Fuel oil. Thisunknown compound is quantitated against a #5 Fuel Oil standard and reported As “Heavy FuelOil”. Due to the severe weathering these results are reported as estimates, “J”.
All data are usable as reported. For any additional information concerning the TPH analysisportion of this project please call Myrna Mandjikov 360-871-8814. For sampling informationplease call Pam Covey 360-871-8827.
METHODS:The samples were extracted into dichloromethane and analyzed by GC-FID. These methods aremodifications of the EPA SW- 846 methods, 3510, 8000 and 8015.
BLANKS:No analytes of interest were detected in the blanks.
SURROGATES:Each sample (with the exception of 98428080D which was double spiked) was spiked with200ng of pentacosane surrogate compound. All surrogate recoveries are within 20 % of thetheoretical value. Acceptable recoveries for WTPH-Dxanalysis are 50 % - 150 %.

DUPLICATE SAMPLES:Sample 98428080 was prepared in triplicate. Two of the samples were inadvertently spiked withtwo volumes of the surrogate standard instead of being spiked with the #2 diesel matrix spikingsolution. Therefore, spike recovery information is not available. However, one of thesereplicates has been reported as a duplicate. No petroleum hydrocarbon compounds were foundabove the reporting limit in either sample and therefore the relative percent difference (RPD) hasnot been calculated.
HOLDING TIMES:The samples were analyzed within the recommended holding time.
DATA QUALIFIERS:Code Definition
E Reported result is an estimate because it exceeds the calibration
J The analyte was positively identified. The associated numerical result is anestimate.
N There is evidence the analyte is present in this sample.
NJ There is evidence that the analyte is present. The associated numerical result is anestimate.
NAF Not analyzed for.
REJ The data are unusable for all purposes.
U The analyte was not detected at or above the reported result.
UJ The analyte was not detected at or above the reported estimated result.
Bold Type The analyte was present in the sample. Used as a visual aid to locate detectedcompounds on the report sheet.

Manchester Environmental Laboratory7411 Beach DR E, Port Orchard Washington 98366
CASE NARRATIVE
November 17, 1998
Subject: Lake Whatcom, Sediment Samples
Samples: 98428105 - 98428112
Case No. 332398
Officer: Dave Serdar
By: M. Mandjikov
WTPH-Dx Analysis of the Lake Whatcom Sediment Samples
SUMMARY:Samples 98428105 - 98428112 were analyzed for diesel and extended diesel range hydrocarbons.Samples 98428109, 98428111, and 98428112 show evidence of the presence of petroleumhydrocarbons in the lubricating oil range of the chromatogram. These hydrocarbons arequantitated against 30 weight motor oil (Penzoil) standard.
The results of these samples are qualified as estimates, “J”, due to a possible high bias. Thesensitivity of this analysis increased as these samples were analyzed. The recoveries of the motoroil control range from 102% to 121%. Ordinary analysis control samples recoveries areacceptable between 85% to 115%.
All data are usable as reported. For any additional information concerning the TPH analysisportion of this project please call Myrna Mandjikov 360-871-8814. For sampling informationplease call Pam Covey 360-871-8827.
METHODS:These samples were extracted into dichloromethane and analyzed by GC-FID- This method is amodification of EPA SW- 846 methods, 3540, 8000 and 8015.
BLANKS:No analytes of interest were detected in the blanks.
SURROGATES:All surrogate recoveries fall within the acceptable range of 50% - 150%.

DUPLICATE SAMPLE:Sample 98428109 was extracted and analyzed in duplicate. The relative percent difference(RPD) between the duplicates is 7%.
Precision control limits for NWTPH-Dx petroleum hydrocarbons are currently being evaluatedby statistical laboratory performance at this time. In the interim, an RPD of <20% is consideredto be in control.
LABORATORY CONTROL SAMPLES:Laboratory control samples were prepared in duplicate by spiking approximately 20 grams ofclean dry beach sample with 10,000 ug of #2 Diesel. One control was lost during extraction.The recovery of the #2 Diesel spike is within 5% of the theoretical value.
Accuracy control limits for NWTPH-Dx petroleum hydrocarbons are currently being evaluatedby statistical laboratory performance at this time. The accuracy guidelines stated in EPA SW-846 method 8015, for the analysis of semi-volatile organics are 70 - 130%.
HOLDING TIMES:The samples were extracted and analyzed within the recommended holding time.
DATA QUALIFIERS:
Code Definition
E Reported result is an estimate because it exceeds the calibration.
J The analyte was positively identified. The associated numerical result is anestimate.
N There is evidence the analyte is present in this sample.
NJ There is evidence that the analyte is present. The associated numerical result is anestimate.
NAF Not analyzed for.
REJ The data are unusable for all purposes.
U The analyte was not detected at or above the reported result.
UJ The analyte was not detected at or above the reported estimated result.
Bold Type The analyte was present in the sample. Used as a visual aid to locate detectedcompounds on the report sheet.

Manchester Environmental Laboratory7411 Beach DR E, Port Orchard Washington 98366
CASE NARRATIVE
January 29, 1999
Subject: Lake Whatcom
Samples: 99036090 -99036092
Case No. 104999
Officer: Dave Serdar
By: M. Mandjikov
WTPH-Dx Analysis of the sediment samples from Lake Whatcom
SUMMARY:Samples 99036090 - 99036092 were analyzed for diesel and extended diesel range hydrocarbons.There is evidence of extended diesel range hydrocarbon compound present in samples 99036090and 99036092. This compound is quantitated against a 30 weight Penzoil standard and reportedas Lube oil.
All data are usable as reported. For any additional information concerning the TPH analysisportion of this project please call Myrna Mandjikov 360-871-8814. For sampling informationplease call Pam Covey 360-871-8827.
METHODS:These samples were extracted into 1,4 - dichloromethane and analyzed by GC-FID. This methodis a modification of EPA SW- 846 methods, 3540, 8000 and 8015.
BLANKS:No analytes of interest were detected in the blanks.
SURROGATES:All surrogate recoveries fall within the acceptable range of 50% - 150%.
SPIKED SAMPLE:An aliquot of sample 99036091 was spiked with 1 ng of #2 diesel analyzed with the samples.The duplicate was spiked with 1 mg of #2 diesel. The spiked sample recovery of 90 % is withinacceptable limits for this analysis.

LABORATORY CONTROL SAMPLES:A Laboratory control sample was prepared by spiking approximately 20 grams of clean dry beachsample with 1 mg of #2 Diesel. The recovery of the #2 Diesel spike is within 10% of thetheoretical value.
Accuracy control limits for NWTPH-Dx petroleum hydrocarbons are currently being evaluatedby statistical laboratory performance at this time. The accuracy guidelines stated in EPA SW-846 method 8015, for the analysis of semi-volatile organics are 70 - 130%.
HOLDING TIMES:The samples were analyzed within the recommended holding times.
DATA QUALIFIERS:
Code Definition
E Reported result is an estimate because it exceeds the calibration.
J The analyte was positively identified. The associated numerical result is anestimate.
N There is evidence the analyte is present in this sample.
NJ There is evidence that the analyte is present. The associated numerical result is anestimate.
NAF Not analyzed for.
REJ The data are unusable for all purposes.
U The analyte was not detected at or above the reported result.
UJ The analyte was not detected at or above the reported estimated result.
Bold Type The analyte was resent in the sample. Used as a visual aid to locate detectedcompounds on the report sheet.

MANCHESTER ENVIRONMENTAL LABORATORY7411 Beach DR E, Port Orchard Washington 98366
August 5, 1998
Subject: Lake Whatcom
Samples: 98268030 through 98268036
Case No. 1994-98
Officer: Dale Davis
By: Karin Feddersen
SEMIVOLATILE ORGANICS
ANALYTICAL METHODS:The samples were extracted following the EPA CLP and SW 846 8270 procedure. Analysis wasby capillary GC/MS. Routine QA/QC procedures were performed with the analyses.
HOLDING TIMES:The samples were stored at 4 degrees C until extraction. They were extracted and analyzedwithin the recommended holding times.
BLANKS:Low levels of some analytes were detected in the laboratory blanks. An analyte is considerednative to the sample when the on-column concentration is at least five times greater than in theassociated method blanks. A phthalate is considered native to the sample when the concentrationis at least ten times greater than in the associated method blanks.
SURROGATES:The standard Manchester Laboratory surrogates were added to the sample prior to extraction. Allsurrogate recoveries were within acceptable limits with one exception. All surrogates were lowin sample 98268033. Inadequate surrogate recoveries could indicate poor analyte recovery.Thus a potential low bias exists for target analytes in the sample. All results for this sample havebeen qualified.
MATRIX SPIKE AND MATRIX SPIKE DUPLICATE:Sample 98268033 was spiked to evaluate recoveries in these samples. Results for analytes withrecoveries below 50% in one or both spikes have been qualified “J” in the correspondingsamples.
Results for analytes with recoveries below 10% in one or both spikes have been rejected(qualifier “REF”) in the corresponding samples.

ANALYTICAL COMMENTS:The data is acceptable for use as reported.
DATA QUALIFIER CODES:
U – The analyte was not detected at or above the reported value.
J – The analyte was positively identified. The associated numerical value is anestimate.
UJ – The analyte was not detected at or above the reported estimated result.
REJ – The data are unusable for all purposes.
NAF – Not analyzed for.
NC – Not Calculated.
N – There is evidence the analyte is present in this sample.
NJ – There is evidence that the analyte is present. The associated numerical result isan estimate.
E – This qualifier is used when the concentration of the associated value exceeds theknown calibration range.
bold – The analyte was present in the sample. (Visual Aid to locate detectedcompound on report sheet.)
Lake_Whatcom.doc

MANCHESTER ENVIRONMENTAL LABORATORY7411 Beach Drive E, Port Orchard Washington 98366
CASE NARRATIVE
February 25, 1999
Subject: Lake Whatcom
Samples: 98-428080, -428082 to -428084, -428086 to -428088
Case No. 3323-98
Officer: Dave Serdar
By: Dickeiy HuntamerOrganics Analysis Unit
SEMIVOLATILE ORGANICS
ANALYTICAL METHODS:
The semivolatile water samples were extracted with methylene chloride following the Manchestermodification of the EPA SW 846 8270 procedure with capillary GC/MS analysis of the sampleextracts. Normal QA/QC procedures were performed with the analyses.
HOLDING TIMES:
All sample and extraction holding times were within the recommended limits.
BLANKS:
Low levels of some target compounds were detected in the laboratory blanks. The EPA fivetimes rule was applied to all target compounds found in the blank. Compounds that were foundin the sample and in the blank were considered real and not the result of contamination if thelevels in the sample are greater than or equal to five times the amount of compounds in theassociated method blank.
SURROGATES:
The normal surrogate compounds were added to the sample prior to extraction. All surrogatespike recoveries were within acceptable QC limits.
MATRIX SPIKE AND MATRIX SPIKE DUPLICATE:
Matrix spike recoveries were within acceptable limits except for, n nitrosodimethylamine,aniline, phenol benzyl alcohol, 2-methylphenol, benzoic acid, hexachlorocyclopentadiene,3-nitroaniline and 2,4 -dinitrotoluene. Recoveries for these compounds fell below therecommended limits and the data for the matrix source sample, -428080, was “J” qualified forthese compounds. Recoveries for 4-chloroanailine were low and the compound was flagged“REJ”.

ANALYTICAL COMMENTS:
No analytical problems were encountered in the analysis. The data is acceptable for use asqualified.
DATA QUALIFIER CODES:
U – The analyte was not detected at or above the reported value.
– The analyte was positively identified. The associated numerical value isan estimate.
UJ – The analyte was not detected at or above the reported estimated result.
REJ – The data are unusable for all purposes.
EXP – The result is equal to the number before EXP times 10 to the power of thenumber after EXP. As an example 3EXP6 equals 3 X 10⁶.
NAF – Not analyzed for.
N – For organic analytes there is evidence the analyte is present in this sample.
NJ – There is evidence that the analyte is present. The associated numericalresult is an estimate.
E – This qualifier is used when the concentration of the associated valueexceeds the known calibration range.
Bold – The analyte was present in the sample. (Visual Aid to locate detectedcompound on report sheet.)
CN_Lake Whatcom.DOC

MANCHESTER ENVIRONMENTAL LABORATORY7411 Beach Drive E., Port Orchard Washington 98366
March 1, 1999
Subject: Lake Whatcom
Samples: 99036090 092
Project ID: 104999
Project Officer: Dave Serdar
By: Greg Perez
SEMIVOLATILE ORGANICS
ANALYTICAL METHODS:The samples were extracted following the EPA CLP and SW-846 8270 procedure. The extractswere cleaned up with Gel Permeation Chromatography (GPC). Analysis was by capillary gaschromatography with mass spectrometry (GC/MS). Routine QA/QC procedures were performedwith the analyses.
HOLDING TIMES:The samples were stored at 4 degrees C until extraction. They were extracted and analyzedwithin the recommended holding times.
BLANKS:Low levels of some analytes were detected in the laboratory blanks. An analyte is considerednative to the sample when the on-column concentration is at least five times greater than in theassociated method blanks. A phthalate is considered native to the sample when the concentrationis at least ten times greater than in the associated method blanks.
SURROGATES:The standard Manchester Laboratory Base/Neutral/Acid (BNA) surrogates were added to thesample prior to extraction. All surrogate recoveries were within acceptable limits.
MATRIX SPIKE AND MATRIX SPIKE DUPLICATE:Sample 99036091 was spiked to evaluate recoveries from this type of sample. Results foranalytes with recoveries below 50% in one or both spikes have been qualified “J” in thecorresponding samples.
Results for analytes with recoveries below 10% in one or both spikes have been rejected(qualifier “REF”) in the corresponding samples.

COMMENTS:The data is acceptable for use as reported.
DATA QUALIFIER CODES:
U – The analyte was not detected at or above the reported value.
J – The analyte was positively identified. The associated numerical value isan estimate.
UJ – The analyte was not detected at or above the reported estimated result.
REJ – The data are unusable for all purposes.
NAF – Not analyzed for.
N – There is evidence the analyte is present in the sample.
NJ – There is evidence that the analyte is present. The associated numericalresult is an estimate.
E – This qualifier is used when the concentration of the associated valueexceeds the known calibration range. The associated numerical result isan estimate.
bold – The analyte was present in the sample. (Visual Aid to locate detectedcompounds on report sheet.)
.doc

MANCHESTER ENVIRONMENTAL LABORATORY7411 Beach Drive E, Port Orchard Washington 98366
March 4, 1999
Subject: Lake Whatcom
Samples: 98428105 through 98428112
Case No. 3323-98
Officer: Dave Serdar
By: Karin Feddersen
SEMIVOLATILE ORGANICS
ANALYTICAL METHODS:The samples were extracted following the EPA CLP and SW-846 8270 procedure. The extractswere cleaned up with Gel Permeation Chromatography (GPC). Analysis was by capillary gaschromatography with mass spectrometry (GC/MS). Routine QA/QC procedures were performedwith the analyses.
HOLDING TIMES:The samples were stored at 4 degrees C until extraction. They were extracted and analyzedwithin the recommended holding times.
BLANKS:Low levels of some analytes were detected in the laboratory blanks. An analyte is considerednative to the sample when the on-column concentration is at least five times greater than in theassociated method blanks.
SURROGATES:The standard Manchester Laboratory surrogates were added to the sample prior to extraction. Allsurrogate recoveries were within acceptable limits.
MATRIX SPIKE AND MATRIX SPIKE DUPLICATE:Aliquots of sample 98428107 were spiked to evaluate recoveries in these samples. Results foranalytes with recoveries below 50% in one or both spikes have been qualified as estimates in thecorresponding samples; detected results with “J”, non-detects with “UJ”.

Detected results for analytes with recoveries below 10% in one or both spikes have beenqualified “J”, non-detects have been rejected (qualifier “REF”) in the corresponding samples.
COMMENTS:The data is acceptable for use as reported.
DATA QUALIFIER CODES:
U – The analyte was not detected at or above the reported value.
J – The analyte was positively identified. The associated numerical value is anestimate.
UJ – The analyte was not detected at or above the reported estimated result.
REJ – The data are unusable for all purposes.
NAF – Not analyzed for.
N – There is evidence the analyte is present in the sample.
NJ – There is evidence that the analyte is present. The associated numericalresult is an estimate.
E – This qualifier is used when the concentration of the associated value exceedsthe known calibration range. The associated numerical result is an estimate.
Bold – The analyte was present in the sample. (Visual Aid to locate detectedcompounds on report sheet.)
Lake_Whatcom9842.doc

Manchester Environmental Laboratory7411 Beach Dr E, Port Orchard Washington 98366
CASE NARRATIVE
September 3, 1998
Subject: Lake Whatcom Project
Sample(s): 98268030-31, 33, 36
Officer(s): Dale Davis
By: Bob CarrellOrganics Analysis Unit
ACID HERBICIDE ANALYSIS
ANALYTICAL METHOD(S): (Draft EPA Method 8085)
The water samples for acid herbicides were extracted following Manchester Laboratory'sstandard operating procedure for the extraction of herbicides. The herbicide samples werehydrolyzed at pH > 12, extracted with methylene chloride at pH < 2, solvent exchanged andderivatized along with two method blanks. These extracts were analyzed by capillary GasChromatography and Atomic Emission Detection (GC/AED). Confirmation of herbicides isperformed by Gas Chromatography and Ion-Trap mass spectrometry (GC/ITD) or comparisons ofelemental ratios of hetero-atoms to empirical formulas.
The method utilizes compound independent calibration (CIC) for quantitation of detectedcompounds. A calibration validation is performed each time CIC is used for target compounds.This is done by comparison of CIC to a single point calibration (SPC) of the target analyte beingquantitated.
All analytes have a respective practical quantitation limit (PQL) that is higher than thecorresponding method detection limit (MDL). If a target analyte is detected and its identificationis unambiguously confirmed at a concentration below its PQL, the reported concentration isqualified as an estimate, ' J' qualifier.
BLANKS:
No target compounds were detected in the laboratory blanks. Hence, the blanks demonstrate thesystem was free from contamination.
HOLDING TIMES:
All samples were extracted and analyzed within the method holding times.

SURROGATES:
The 2,4,6-tribromophenol surrogate recoveries were acceptable, ranging from 47% to 106%
MATRIX SPIKING:
Matrix spike recoveries were acceptable for all compounds except triclopyr (190% LMX1 and189% LMX2) and 2,4,5-T (189% LMX1 and 202% LMX2) due to positive interferences. Therelative percent difference (RPD) between the spike samples was acceptable for all compounds.
COMMENTS:
The target analyte picloram received the 'UJ' qualifier because we traditionally experience highlyvariable recoveries for this compound.
The data is useable as qualified.
DATA QUALIFIER CODES
U – The analyte was not detected at or above the reported result.
J – The analyte was positively identified. The associated numerical result is anestimate.
UJ – The analyte was not detected at or above the reported estimated result.
REJ – The data are unusable for all purposes.
NAF – Not analyzed for.
N – For organic analytes there is evidence the analyte is present in this sample.
NJ – There is evidence that the analyte is present. The associated numerical resultis an estimate.
NC – Not Calculated
E – This qualifier is used when the concentration of the associated value exceedsthe known calibration range.

Manchester Environmental Laboratory7411 Beach Dr E, Port Orchard Washington 98366
CASE NARRATIVE
December 11, 1998
Subject Lake Whatcom Project
Sample(s): 98428080, 98428082-85
Officer(s): Dave Serdar
By: Bob CarrellOrganics Analysis Unit
ACID HERBICIDE ANALYSIS
ANALYTICAL METHOD(S): (Draft EPA Method 8085)
The water samples for acid herbicides were extracted following Manchester Laboratory'sstandard operating procedure for the extraction of herbicides. The herbicide samples werehydrolyzed at pH > 12, extracted with methylene chloride at pH < 2, solvent exchanged andderivatized along with two method blanks. These extracts were analyzed by capillary GasChromatography and Atomic Emission Detection (GC/AED). Confirmation of herbicides isperformed by Gas Chromatography and Ion-Trap mass spectrometry (GC/ITD) or comparisons ofelemental ratios of hetero-atoms to empirical formulas.
The method utilizes compound independent calibration (CIC) for quantitation of detectedcompounds. A calibration validation is performed each time CIC is used for target compounds.This is done by comparison of CIC to a single point calibration (SPC) of the target analyte beingquantitated.
All analytes have a respective practical quantitation limit (PQL) that is higher than the correspondingmethod detection limit (MDL). If a target analyte is detected and its identification is unambiguouslyconfirmed at a concentration below its PQL, the reported concentration is qualified as an estimate,' J ', qualifier.
BLANKS:
No target compounds were detected in the laboratory blanks, thus demonstrating that the systemwas free from contamination.
HOLDING TIMES:
All samples were extracted and analyzed within the method holding times.

SURROGATES:
The 2,4,6-tribromophenol surrogate recoveries were acceptable, ranging from 68% to 111%.
MATRIX SPIKING:
The matrix spike recoveries were acceptable, ranging from 39% to 142%, except for picloram,(LMX1 23% and LMX2 19%). The calculated relative percent differences (RPD’s) between thetwo matrix spikes for all compounds were acceptable, ranging from 1% to 23%.
COMMENTS:
The target analytes piclorain and dinoseb received the ‘UJ’ qualifier because we traditionallyexperience highly variable recoveries for these compounds.
The data is useable as qualified.
DATA QUALIFIER CODES
U – The analyte was not detected at or above the reported result.
J – The analyte was positively identified. The associated numerical result is anestimate.
UJ – The analyte was not detected at or above the reported estimated result.
REJ – The data are unusable for all purposes.
NAF – Not analyzed for.
N – For organic analytes there is evidence the analyte is present in this sample.
NJ – There is evidence that the analyte is present. The associated numerical result isan estimate.
NC – Not Calculated
E – This qualifier is used when the concentration of the associated value exceeds theknown calibration range.

Manchester Environmental Laboratory7411 Beach Dr E, Port Orchard Washington 98366
CASE NARRATIVE
December 29, 1998
Subject: Lake Whatcom Project
Sample(s): 98428108-09
Officer(s): Dave Serdar
By: Bob CarrellOrganics Analysis Unit
ACID HERBICIDE ANALYSIS
ANALYTICAL METHOD(S): (Draft EPA Method 8085)
The sediment samples for acid herbicides were extracted following Manchester Laboratory'sstandard operating procedure for the extraction of herbicides. The herbicide samples werehydrolyzed at pH > 12, extracted with diethyl ether at pH < 2, solvent exchanged and derivatizedalong with two method blanks. These extracts were analyzed by capillary Gas Chromatographyand Atomic Emission Detection (GC/AED). Confirmation of herbicides is performed by GasChromatography and Ion-Trap mass spectrometry (GC/ITD) or comparisons of elemental ratiosof hetero-atoms to empirical formulas.
The method utilizes compound independent calibration (CIC) for quantitation of detectedcompounds. A calibration validation is performed each time CIC is used for target compounds.This is done by comparison of CIC to a single point calibration (SPC) of the target analyte beingquantitated.
All analytes have a respective practical quantitation limit (PQL) that is higher than thecorresponding method detection limit (MDL). If a target analyte is detected and its identificationis unambiguously confirmed at a concentration below its PQL, the reported concentration isqualified as an estimate, 'J' qualifier.
BLANKS:
No target compounds were detected in the laboratory blanks. Hence, the blanks demonstrate thesystem was free from contamination.
HOLDING TIMES:
All samples were extracted and analyzed within the recommended method holding times.

SURROGATES:
Although low, the 2,4,6-tribromophenol surrogate recoveries were acceptable, ranging from21%to 50%. The 2,4-dichlorophenylacetic acid surrogate recoveries were also acceptable,ranging from 33% to 73%.
MATRIX SPIKING:
Although low, the matrix spike recoveries were acceptable for all compounds, ranging from 24%to 86%, except dinoseb (10% and 12%). As a result of this dinoseb data was received the ‘UJ’qualifier. The relative percent differences (RPD’s) between the two matrix spike recoveries forthe compounds were acceptable.
Bromoxynil and ioxynil have been determined to hydrolyze during the sediment extractionprocess which resulted in extremely poor recoveries of the parent compounds, therefore thesecompounds were rejected and not reported. Similarly, picloram and acifluorfen recoveries wereextremely low and therefore these compounds were not reported either. It should be noted thathad any of these compounds been found to be present in the samples at significant levels, theywould have been reported.
COMMENTS:
The data is useable as qualified.
DATA QUALIFIER CODES
U – The analyte was not detected at or above the reported result.
J – The analyte was positively identified. The associated numerical result is anestimate.
UJ – The analyte was not detected at or above the reported estimated result.
REJ – The data are unusable for all purposes.
NAF – Not analyzed for.
N – For organic analytes there is evidence the analyte is present in this sample.
NJ – There is evidence that the analyte is present. The associated numerical result isan estimate.
NC – Not Calculated
E – This qualifier is used when the concentration of the associated value exceeds theknown calibration range.

Manchester Environmental Laboratory7411 Beach Dr E, Port Orchard Washington 98366
CASE NARRATIVE
September 11, 1998
Subject: Lake Whatcom Project (week 26)
Samples: 98268030, 31, 33 & 36
Officer(s): Dave Serdar
By: Norman OlsonOrganics Analysis Unit
NEUTRAL PESTICIDE ANALYSIS
ANALYTICAL METHODS: (EPA SW846 Method 8085 (proposed status)) The watersamples were analyzed for nitrogen-containing and organophosphorous pesticides. A stir-barextraction with methylene chloride followed by solvent exchange to iso-octane is ManchesterLaboratory's standard operating procedure that was used for the extraction of the pesticides.Extract analyses by capillary Gas Chromatography and Atomic Emission Detection (GC/AED)yielded compound detection and quantitation. Confirmation of detected pesticides wasperformed by Gas Chromatography and Ion-Trap mass spectrometry (GC/ITD) or comparisons ofelemental ratios of heteroatoms to empirical formulas.
Analytes have a respective practical quantitation limit (PQL) that is higher than thecorresponding method detection level (MDL). If a target analyte is detected and confirmed at aconcentration below its PQL, the reported concentration is qualified as an estimate, 'J' qualifier.This procedure also applies to the method blanks.
NITROGEN-CONTAINING PESTICIDE ANALYSIS
BLANKS: No nitrogen-containing target compounds were detected in the laboratory blanks.Hence, the blanks demonstrate the system was free from this type of contamination.
HOLDING TIMES: All samples were extracted within seven days of sampling and analyzedwithin 40 days of extraction.
SURROGATES: All 1,3-Dimethyl-2-nitrobenzene (DMNB) recoveries were acceptableranging from 82% to 110%.

MATRIX SPIKING: Recoveries of spiked target compounds were acceptable ranging from50% to 122%, except for the following four compounds: prometryn (35% & 25%), norflurazon(31% & 32%), trifluralin (189% & 161%) and fluridone (0% ). Both prometryn and norflurazonhave been 'UJ' qualified in all samples and fluridone rejected in sample 98268033 and 'UJ'qualified in the remaining samples on this basis. It should be noted that fluridone consistentlydemonstrates low precision for matrix spike recoveries and is routinely qualified.
COMMENTS: Data is useable as qualified.
ORGANOPHOSPHOROUS PESTICIDE ANALYSIS
BLANKS: No organophosphorous target compounds were detected in the laboratory blanks.Hence, the blanks demonstrate the system was free from this type of contamination.
HOLDING TIMES: All samples were extracted within seven days of sampling and analyzedwithin 40 days of extraction.
SURROGATES: Triphenylphosphate (TPP) recoveries were acceptable ranging from 101 to153%.
MATRIX SPIKING: No spiking was performed
COMMENTS: The data is useable as qualified
DATA QUALIFIER CODES:
U - The analyte was not detected at or above the reported result.
J - The analyte was positively identified. The associated numerical result is anestimate.
UJ - The analyte was not detected at or above the reported estimated result.
REJ - The data are unusable for all purposes.
NAF - Not analyzed for.
N - For organic analytes there is evidence the analyte is present in this sample.
NJ - There is evidence that the analyte is present. The associated numerical resultis an estimate.

Manchester Environmental Laboratory7411 Beach Dr E, Port Orchard Washington 98366
CASE NARRATIVE
December 11, 1998
Subject: Lake Whatcom Project - Water Samples (week 42)
Samples: 98428080, 82-85
Officer(s): Dave Serdar
By: Norman OlsonOrganics Analysis Unit
NEUTRAL PESTICIDE ANALYSIS
ANALYTICAL METHODS: (EPA SW846 Method 8085 (proposed status)) The watersamples were analyzed for nitrogen-containing and organophosphorous pesticides. A stir-barextraction with methylene chloride followed by solvent exchange to iso-octane is ManchesterLaboratory's standard operating procedure that was used for the extraction of the pesticides.Extract analyses by capillary Gas Chromatography and Atomic Emission Detection (GC/AED)yielded compound detection and quantitation. Confirmation of detected pesticides wasperformed by Gas Chromatography and Ion-Trap mass spectrometry (GC/ITD) or comparisons ofelemental ratios of heteroatoms to empirical formulas.
Analytes have a respective practical quantitation limit (PQL) that is higher than the correspondingmethod detection level (MDL). If a target analyte is detected and confirmed at a concentrationbelow its PQL, the reported concentration is qualified as an estimate, 'J' qualifier. This procedurealso applies to the method blanks.
NITROGEN-CONTAINING PESTICIDE ANALYSIS
BLANKS: No nitrogen-containing target compounds were detected in the laboratory blanks.Hence, the blanks demonstrate the system was free from this type of contamination.
HOLDING TIMES: All samples were extracted within seven days of sampling and analyzedwithin 40 days of extraction.

SURROGATES: All 1,3-Dimethyl-2-nitrobenzene (DMNB) recoveries were acceptableranging from 40% to 55%.
MATRIX SPIKING: Recoveries of spiked target compounds were acceptable ranging from43% to 140%, except for the following three compounds: bromacil (14% & 22%), prometryn(15% & 18%) and norflurazon (3% & 3%). Bromacil, prometryn and norflurazon have been 'UJ'qualified in all samples on this basis.
The reason for the low recoveries of these three compounds is the extract clean-up performed. Aflorisil clean-up of the extracts using 100% preserved diethylether as the mobile phase does causelosses of certain nitrogen-containing analytes. The following nitrogen-containing pesticides, inaddition to those discussed above, have traditionally demonstrated a tendency for low recoveriesfrom the florisil column, and therefore these analytes are also J or UJ qualified:
tebuthiuron hexazinone atratonprometon carboxintriallate metalaxyl
Note: the samples and blanks were also analyzed without any cleanup, but utilizing a dilution ofthe extracts.
COMMENTS: Data is useable as qualified.
ORGANOPHOSPHOROUS PESTICIDE ANALYSIS
BLANKS: No organophosphorous target compounds were detected in the laboratory blanks.Hence, the blanks demonstrate the system was free from this type of contamination.
HOLDING TIMES: All samples were extracted within seven days of sampling and analyzedwithin 40 days of extraction.
SURROGATES: Triphenylphosphate (TPP) recoveries were acceptable ranging from 66% to93%.
MATRIX SPIKING: Recoveries of spiked target compounds were acceptable ranging from53% to 101%, except for fenthion which had recoveries of 8% and 7% from LMXl and LMX2,respectively. Fenthion has been 'UJ' qualified in all samples on this basis.
The reason for the low recoveries of fenthion is the extract clean-up performed. A florisil clean-up of the extracts using 100% preserved diethylether as the mobile phase does cause losses ofcertain organophosphorous analytes. The following organophosphorous, pesticides, in additionto fenthion, have traditionally demonstrated a tendency for low recoveries from the florisilcolumn, and therefore these analytes are also J or UJ qualified:

demeton O & S fensulfothiondisulfoton sulprofosfenamiphos mevinphosphorate methyl paroxondimethoate phosphamidan
abate
Note: the samples and blanks were also analyzed without any cleanup, but utilizing a dilution ofthe extracts.
COMMENTS: The data is useable as qualified
DATA QUALIFIER CODES
U – The analyte was not detected at or above the reported result.
J – The analyte was positively identified. The associated numerical result is anestimate.
UJ – The analyte was not detected at or above the reported estimated result.
REJ – The data are unusable for all purposes.
NAF – Not analyzed for.
N – For organic analytes there is evidence the analyte is present in this sample.
NJ – There is evidence that the analyte is present. The associated numerical resultis an estimate.

Manchester Environmental Laboratory7411 Beach Dr E, Port Orchard Washington 98366
CASE NARRATIVE
December 17, 1998
Subject: Lake Whatcom Project - Sediment Samples (week 42)
Samples: 98428108 & 09
Officer(s): Dave Serdar
By: Norman OlsonOrganics Analysis Unit
NEUTRAL PESTICIDE ANALYSIS
ANALYTICAL METHODS: (EPA SW846 Method 8085 (proposed status)) The sedimentsamples were analyzed for nitrogen-containing and organophosphorous pesticides. A soxhletextraction with acetone followed by solvent exchange to iso-octane is Manchester Laboratory'sstandard operating procedure that was used for the extraction of the pesticides. Extract analysesby capillary Gas Chromatography and Atomic Emission Detection (GC/AED) yielded compounddetection and quantitation. Confirmation of detected pesticides was performed by GasChromatography and Ion-Trap mass spectrometry (GC/ITD) or comparisons of elemental ratiosof heteroatoms to empirical formulas.
Analytes have a respective practical quantitation limit (PQL) that is higher than the correspondingmethod detection level (MDL). If a target analyte is detected and confirmed at a concentrationbelow its PQL, the reported concentration is qualified as an estimate,'J' qualifier. This procedurealso applies to the method blanks.
NITROGEN-CONTAINING PESTICIDE ANALYSIS
BLANKS: No nitrogen-containing target compounds were detected in the laboratory blanks.Hence, the blanks demonstrate the system was free from this type of contamination.
HOLDING TIMES: All samples were extracted within seven days of sampling and analyzedwithin 40 days of extraction.

SURROGATES: All 1,3-Dimethyl-2-nitrobenzene (DMNB) recoveries were acceptableranging from 64% to 111%, except in LMX2 which had recoveries at 38%.
MATRIX SPIKING: Recoveries of spiked target compounds were acceptable ranging from40% to 90%, except for bromacil at 36% & 26%, respectively. Bromacil has been 'UJ' qualifiedin all samples on this basis.
COMMENTS: Data is useable as qualified.
ORGANOPHOSPHOROUS PESTICIDE ANALYSIS
BLANKS: No organophosphorous target compounds were detected in the laboratory blanks.Hence, the blanks demonstrate the system was free from this type of contamination.
HOLDING TIMES: All samples were extracted within seven days of sampling and analyzedwithin 40 days of extraction.
SURROGATES: Triphenylphosphate (TPP) recoveries were acceptable ranging from 101% to138%.
MATRIX SPIKING: Recoveries of spiked target compounds were acceptable ranging from72% to 109%, except for carbophenothion which had recoveries of 16% from both LMX1 andLMX2. Carbophenothion has been 'UJ' qualified in all samples on this basis.
COMMENTS: The data is useable as qualified
DATA QUALIFIER CODES:
U – The analyte was not detected at or above the reported result.
J – The analyte was positively identified. The associated numerical result is anestimate.
UJ – The analyte was not detected at or above the reported estimated result.
REJ – The data are unusable for all purposes.
NAF – Not analyzed for.
N – For organic analytes, there is evidence the analyte is present in this sample
NJ – There is evidence that the analyte is present. The associated numerical resultis an estimate.

Manchester Environmental Laboratory7411 Beach Dr E, Port Orchard Washington 98366
CASE NARRATIVE
March 18,1999
Subject: Lake Whatcom Fish Tissue
Samples: 98458130 - 38
Project No: 3719-98
Officer(s): Dave Serdar
By: Norm Olson
Pesticides and PCB Analysis
ANALYTICAL METHODS:EPA SW-846 methods 3540, 8081 and 8082 along with the corresponding ManchesterLaboratory SOPs and method modifications, were used for the extraction and analysis of thetissue samples for pesticides and PCBs, respectively.
The extraction was performed using a Soxhlet apparatus with a 50:50 mixture of methylenechloride and hexane as the extracting solvent. All samples were cycled overnight or at aminimum of 16 hours. The extract was then solvent exchanged to hexane and dried over sodiumsulfate. Extracts were then cleaned-up with by elution through a glass column containing Florisilusing 0%, 6% and 50% ethyl ether (preserved with 2% ethanol)/hexane elution fractions. The0% and 6% fraction extracts were treated with sulfuric acid to remove interferences. Anacetonitrile-hexane partitioning procedure was used to remove interferences in a duplicate 6%fraction extract and the 50% fraction extract. Therefore, four extracts were generated andanalyzed for each tissue sample, two 6% fractions and the 0% and 50% fractions.
Analysis is performed using dual dissimilar capillary column gas chromatography with electroncapture detection (GC/ECD). Capillary columns used are a 30m long x 0.32mm inner diameterDB-5 and DB-608 (or equivalent).

BLANKS:No target compounds were detected in the laboratory blanks. Hence, the blanks demonstrate thesystem was free from contamination.
HOLDING TIMES:All tissue samples were extracted and analyzed within the recommended holding times.
SURROGATE(S):The following three compounds were used as surrogates throughout the project: tetrachloro-m-xylene (TMX), dibutylchlorendate (DBC) and 2,2’,4,4’,5,5’-hexabromobiphenyI (HBB).
The recoveries for the surrogates TMX and HBB were acceptable for all samples and blanks.The recovery for DBC was generally low. The surrogate DBC represents the 50% fractionextract. Therefore, as expected, the target analytes associated with the fraction also showedrelatively low recoveries. See the next section, matrix spiking, for an explanation regarding thelow recoveries.
MATRIX SPIKING:All target pesticides, except toxaphene, were spiked for recovery determination. In addition,Aroclor 1260 was spiked.
Recoveries for spiked compounds were acceptable ranging from 50% to 150%, except for thosecompounds that received the acetonitrile-hexane partitioning cleanup procedure. The followingare those eight target compounds, in addition to the surrogate DBC, with a relatively lowrecovery in at least one of the matrix spike duplicates: endosulfan I, II and sulfate, endrin,dieldrin, methoxychlor, endrin aldehyde and endrin ketone. These compounds are either 'J' or'UJ' qualified in all samples and blanks on this basis. It is apparent that a systematic error in theacetonitrile-hexane partitioning procedure was the cause of these low recoveries.
Note that all of the respective quantitation limits required for these eight compounds, exceptdieldrin, are high relative to those provided from the analysis. Thus if a correction was assumeddue to the recovery, the levels at which the compounds were not detected are still much lowerthan the required reporting levels. In the case of dieldrin, the required reporting level is relativelylow at 0.65 ug/Kg. Moreover, this compound was detected in most of the samples atapproximately this level. Therefore some care should be exercised with the data associated withdieldrin.
The recoveries for Aroclor 1260 were 64% and 65%. Although in the acceptable range andshowing good precision these recoveries are lower than anticipated. It is likely that the nativePCB 1260 in the sample used for spiking is the cause for the slightly lower recoveries. Thecalculation used to subtract the native contributions can lead to reduced accuracy in recoveries.
The precision in the recoveries for the pesticide aldrin were lower than expected. However,because this analyte historically performs acceptably with this method, no qualifiers were added.

COMMENTS:The practical quantitation limit (PQL) reported for the Aroclors in the tissue samples is about2.5 ug/Kg. The method detection limit (MDL), as described in 40 CFR Part 136, Appendix B,for Aroclor 1254 in fish tissue samples (muscle fillet only) has been determined to be 1.2 ug/Kgusing this method in this laboratory. Given the same parameters, the MDLs for the otherAroclors may be assumed to be similar.
The data is useable as qualified.

DATA QUALIFIER CODES:
U – The analyte was not detected at or above the reported value.
J – The analyte was positively identified. The associated numerical value isan estimate.
UJ – The analyte, was not detected at or above the reported estimated result.
REJ – The data are unusable for all purposes.
NAF – Not analyzed for.
N – For organic analytes there is evidence the analyte is present in this sample.
NJ – There is evidence that the analyte is present. The associated numericalresult is an estimate.
E – This qualifier is used when the concentration of the associated valueexceeds the known calibration range.
Bold – The analyte is present in the sample. (Visual aid to locate detectedcompounds on the report sheet
Appendix E
Quality Assurance Data

Table AE-1. Quality Assurance Data for Water.
I. Precision of Laboratory Duplicates - Spring Stormwater
Parameter Sample No. Dup.1 Dup.2 mean RPD
Conventionals (mg/L)TSS 98268034 31 31 31 0%TOC 98268030 8.5 8.6 8.6 1%TP 98268030 0.076 0.086 0.081 12%TPN 98268030 0.591 0.593 0.592 <1%Hardness 98268036 54.8 54.0 54.4 1%
II. Precision of Laboratory Duplicates - Fall Stormwater
Parameter Sample No. Dup.1 Dup.2 mean RPD
Conventionals (mg/L)TSS 98428080 7 6 6 17%TSS 98428082 230 226 228 2%TOC 98428082 22.4 20.0 21.2 11%TP 98428080 0.010 u 0.010 u ndTPN 98428080 1.05 1.05 1.05 0%Hardness 98428084 46.6 46.7 46.7 <1%
Total Petroleum Hydrocarbons (mg/L)TPH-Heavy Fuel Oil 98428080 0.32 u 0.31 u ndTPH-#2 Diesel 98428080 16 u 16 u nd
III. Precision of Field Replicates - Fall Stormwater
Parameter Sample No. Rep.1 Rep.2 mean RPD
Conventionals (mg/L)TSS 98428087/88 145 39 92 115%TOC 98428087/88 8.0 8.8 8.4 10%TP 98428087/88 0.043 0.094 0.069 74%TPN 98428087/88 0.870 0.770 0.820 12%Hardness 98428087/88 29.6 24.9 27.3 17%
Metals (ug/L)Diss. Cd 98428087/88 0.051 0.045 0.0 13%Diss. Cr 98428087/88 0.36 0.39 0.4 8%Diss. Cu 98428087/88 3.24 3.47 3.4 7%Diss. Ni 98428087/88 1.05 1.12 1.1 6%Diss. Pb 98428087/88 0.219 0.244 0.2 11%Diss. Zn 98428087/88 66.2 54.9 60.6 19%Tot. Rec. Hg 98428087/88 0.0053 0.0061 0.0 14%
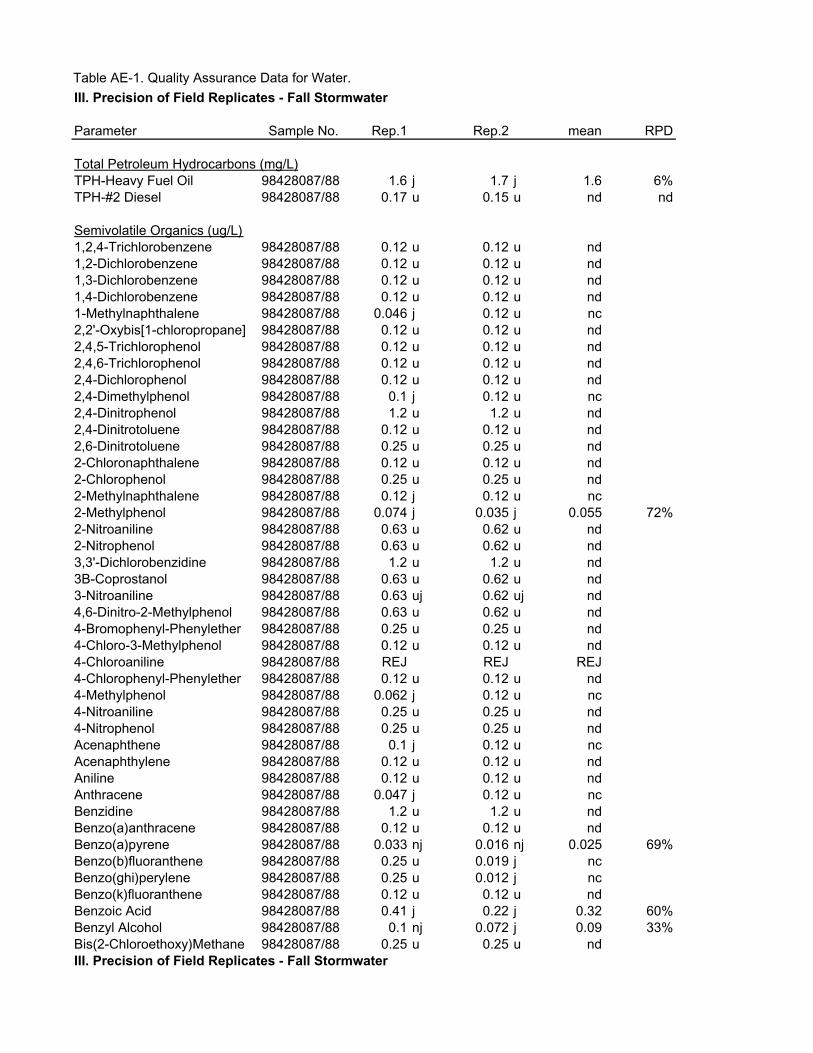
Table AE-1. Quality Assurance Data for Water.III. Precision of Field Replicates - Fall Stormwater
Parameter Sample No. Rep.1 Rep.2 mean RPD
Total Petroleum Hydrocarbons (mg/L)TPH-Heavy Fuel Oil 98428087/88 1.6 j 1.7 j 1.6 6%TPH-#2 Diesel 98428087/88 0.17 u 0.15 u nd nd
Semivolatile Organics (ug/L)1,2,4-Trichlorobenzene 98428087/88 0.12 u 0.12 u nd1,2-Dichlorobenzene 98428087/88 0.12 u 0.12 u nd1,3-Dichlorobenzene 98428087/88 0.12 u 0.12 u nd1,4-Dichlorobenzene 98428087/88 0.12 u 0.12 u nd1-Methylnaphthalene 98428087/88 0.046 j 0.12 u nc2,2'-Oxybis[1-chloropropane] 98428087/88 0.12 u 0.12 u nd2,4,5-Trichlorophenol 98428087/88 0.12 u 0.12 u nd2,4,6-Trichlorophenol 98428087/88 0.12 u 0.12 u nd2,4-Dichlorophenol 98428087/88 0.12 u 0.12 u nd2,4-Dimethylphenol 98428087/88 0.1 j 0.12 u nc2,4-Dinitrophenol 98428087/88 1.2 u 1.2 u nd2,4-Dinitrotoluene 98428087/88 0.12 u 0.12 u nd2,6-Dinitrotoluene 98428087/88 0.25 u 0.25 u nd2-Chloronaphthalene 98428087/88 0.12 u 0.12 u nd2-Chlorophenol 98428087/88 0.25 u 0.25 u nd2-Methylnaphthalene 98428087/88 0.12 j 0.12 u nc2-Methylphenol 98428087/88 0.074 j 0.035 j 0.055 72%2-Nitroaniline 98428087/88 0.63 u 0.62 u nd2-Nitrophenol 98428087/88 0.63 u 0.62 u nd3,3'-Dichlorobenzidine 98428087/88 1.2 u 1.2 u nd3B-Coprostanol 98428087/88 0.63 u 0.62 u nd3-Nitroaniline 98428087/88 0.63 uj 0.62 uj nd4,6-Dinitro-2-Methylphenol 98428087/88 0.63 u 0.62 u nd4-Bromophenyl-Phenylether 98428087/88 0.25 u 0.25 u nd4-Chloro-3-Methylphenol 98428087/88 0.12 u 0.12 u nd4-Chloroaniline 98428087/88 REJ REJ REJ4-Chlorophenyl-Phenylether 98428087/88 0.12 u 0.12 u nd4-Methylphenol 98428087/88 0.062 j 0.12 u nc4-Nitroaniline 98428087/88 0.25 u 0.25 u nd4-Nitrophenol 98428087/88 0.25 u 0.25 u ndAcenaphthene 98428087/88 0.1 j 0.12 u ncAcenaphthylene 98428087/88 0.12 u 0.12 u ndAniline 98428087/88 0.12 u 0.12 u ndAnthracene 98428087/88 0.047 j 0.12 u ncBenzidine 98428087/88 1.2 u 1.2 u ndBenzo(a)anthracene 98428087/88 0.12 u 0.12 u ndBenzo(a)pyrene 98428087/88 0.033 nj 0.016 nj 0.025 69%Benzo(b)fluoranthene 98428087/88 0.25 u 0.019 j ncBenzo(ghi)perylene 98428087/88 0.25 u 0.012 j ncBenzo(k)fluoranthene 98428087/88 0.12 u 0.12 u ndBenzoic Acid 98428087/88 0.41 j 0.22 j 0.32 60%Benzyl Alcohol 98428087/88 0.1 nj 0.072 j 0.09 33%Bis(2-Chloroethoxy)Methane 98428087/88 0.25 u 0.25 u ndIII. Precision of Field Replicates - Fall Stormwater

Table AE-1. Quality Assurance Data for Water.Parameter Sample No. Rep.1 Rep.2 mean RPD
Bis(2-Chloroethyl)Ether 98428087/88 0.25 u 0.25 u ndBis(2-Ethylhexyl) Phthalate 98428087/88 4.4 0.91 2.7 131%Butylbenzylphthalate 98428087/88 0.32 0.19 0.26 51%Caffeine 98428087/88 0.4 0.051 j 0.2 155%Carbazole 98428087/88 0.63 u 0.62 u ndChrysene 98428087/88 0.082 j 0.02 j 0.05 122%Dibenzo(ah)anthracene 98428087/88 0.63 u 0.62 u ndDibenzofuran 98428087/88 0.079 j 0.12 u ncDiethylphthalate 98428087/88 u 0.34 j ncDimethylphthalate 98428087/88 0.12 u 0.12 u ndDi-N-Butylphthalate 98428087/88 0.13 u 0.2 ncDi-N-Octyl Phthalate 98428087/88 0.63 u 0.62 u ndFluoranthene 98428087/88 0.23 0.03 j 0.13 154%Fluorene 98428087/88 0.12 j 0.12 u ncHexachlorobenzene 98428087/88 0.25 u 0.25 u ndHexachlorobutadiene 98428087/88 0.12 u 0.12 u ndHexachlorocyclopentadiene 98428087/88 0.25 uj 0.25 uj ndHexachloroethane 98428087/88 0.12 u 0.12 u ndIndeno(1,2,3-cd)pyrene 98428087/88 0.63 u 0.36 j ncIsophorone 98428087/88 0.069 j 0.25 u ncNaphthalene 98428087/88 0.091 j 0.064 j 0.078 35%Nitrobenzene 98428087/88 0.12 u 0.12 u ndN-Nitrosodimethylamine 98428087/88 0.25 uj 0.25 uj ndN-Nitroso-Di-N-Propylamine 98428087/88 0.63 u 0.62 u ndN-Nitrosodiphenylamine 98428087/88 0.25 u 0.25 u ndPentachlorophenol 98428087/88 2 0.41 j 1.2 132%Phenanthrene 98428087/88 0.24 0.022 j 0.13 166%Phenol 98428087/88 0.065 nj 0.12 uj ncPyrene 98428087/88 0.22 0.044 j 0.13 133%Pyridine 98428087/88 2.5 u 2.5 u ndRetene 98428087/88 0.12 u 0.12 u nd

Table AE-1. Quality Assurance Data for Water.III. Precision of Field Replicates - Fall Stormwater
Parameter Sample No. Rep.1 Rep.2 mean RPD
Chlorophenoxy Herbicides (ug/L)2,3,4,5-Tetrachlorophenol 98428083/85 0.043 u 0.043 u nd2,3,4,6-Tetrachlorophenol 98428083/85 0.043 u 0.043 u nd2,4,5-T 98428083/85 0.063 u 0.062 u nd2,4,5-TB 98428083/85 0.071 u 0.070 u nd2,4,5-TP (Silvex) 98428083/85 0.063 u 0.062 u nd2,4,5-Trichlorophenol 98428083/85 0.047 u 0.047 u nd2,4,6-Trichlorophenol 98428083/85 0.047 u 0.047 u nd2,4-D 98428083/85 0.13 0.10 0.12 25%2,4-DB 98428083/85 0.094 u 0.093 u nd3,5-Dichlorobenzoic acid 98428083/85 0.078 u 0.078 u nd4-Nitrophenol 98428083/85 0.20 nj 0.15 nj 0.18 28%Acifluorfen (Blazer) 98428083/85 0.31 u 0.31 u ndBentazon 98428083/85 0.12 u 0.12 u ndBromoxynil 98428083/85 0.078 u 0.078 u ndDCPA (Dacthal) 98428083/85 0.063 u 0.062 u ndDicamba 98428083/85 0.078 u 0.078 u ndDichlorprop 98428083/85 0.027 nj 0.012 nj 0.20 8%Diclofop-methyl 98428083/85 0.12 u 0.12 u ndDinoseb 98428083/85 0.12 u 0.12 uj ndIoxynil 98428083/85 0.078 u 0.078 u ndMCPA 98428083/85 0.16 u 0.16 u ndMCPP (Mecoprop) 98428083/85 0.092 j 0.082 j 0.087 11%Pentachlorophenol 98428083/85 0.14 0.16 0.15 13%Picloram 98428083/85 0.078 u 0.078 uj ndTriclopyr 98428083/85 0.044 j 0.033 j 0.038 29%
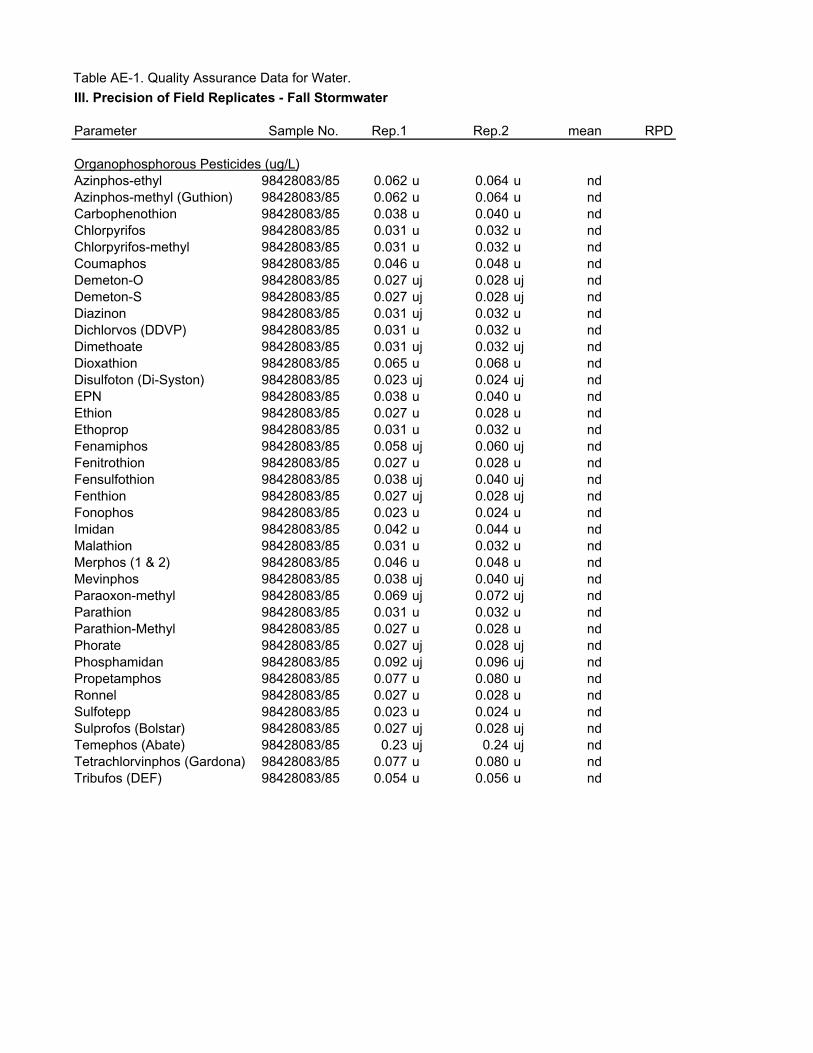
Table AE-1. Quality Assurance Data for Water.III. Precision of Field Replicates - Fall Stormwater
Parameter Sample No. Rep.1 Rep.2 mean RPD
Organophosphorous Pesticides (ug/L)Azinphos-ethyl 98428083/85 0.062 u 0.064 u ndAzinphos-methyl (Guthion) 98428083/85 0.062 u 0.064 u ndCarbophenothion 98428083/85 0.038 u 0.040 u ndChlorpyrifos 98428083/85 0.031 u 0.032 u ndChlorpyrifos-methyl 98428083/85 0.031 u 0.032 u ndCoumaphos 98428083/85 0.046 u 0.048 u ndDemeton-O 98428083/85 0.027 uj 0.028 uj ndDemeton-S 98428083/85 0.027 uj 0.028 uj ndDiazinon 98428083/85 0.031 uj 0.032 u ndDichlorvos (DDVP) 98428083/85 0.031 u 0.032 u ndDimethoate 98428083/85 0.031 uj 0.032 uj ndDioxathion 98428083/85 0.065 u 0.068 u ndDisulfoton (Di-Syston) 98428083/85 0.023 uj 0.024 uj ndEPN 98428083/85 0.038 u 0.040 u ndEthion 98428083/85 0.027 u 0.028 u ndEthoprop 98428083/85 0.031 u 0.032 u ndFenamiphos 98428083/85 0.058 uj 0.060 uj ndFenitrothion 98428083/85 0.027 u 0.028 u ndFensulfothion 98428083/85 0.038 uj 0.040 uj ndFenthion 98428083/85 0.027 uj 0.028 uj ndFonophos 98428083/85 0.023 u 0.024 u ndImidan 98428083/85 0.042 u 0.044 u ndMalathion 98428083/85 0.031 u 0.032 u ndMerphos (1 & 2) 98428083/85 0.046 u 0.048 u ndMevinphos 98428083/85 0.038 uj 0.040 uj ndParaoxon-methyl 98428083/85 0.069 uj 0.072 uj ndParathion 98428083/85 0.031 u 0.032 u ndParathion-Methyl 98428083/85 0.027 u 0.028 u ndPhorate 98428083/85 0.027 uj 0.028 uj ndPhosphamidan 98428083/85 0.092 uj 0.096 uj ndPropetamphos 98428083/85 0.077 u 0.080 u ndRonnel 98428083/85 0.027 u 0.028 u ndSulfotepp 98428083/85 0.023 u 0.024 u ndSulprofos (Bolstar) 98428083/85 0.027 uj 0.028 uj ndTemephos (Abate) 98428083/85 0.23 uj 0.24 uj ndTetrachlorvinphos (Gardona) 98428083/85 0.077 u 0.080 u ndTribufos (DEF) 98428083/85 0.054 u 0.056 u nd

Table AE-1. Quality Assurance Data for Water.III. Precision of Field Replicates - Fall Stormwater
Parameter Sample No. Rep.1 Rep.2 mean RPD
Nitrogen Pesticides (ug/L)Alachlor 98428083/85 0.14 u 0.14 u ndAmetryn 98428083/85 0.038 u 0.040 u ndAtraton 98428083/85 0.058 uj 0.060 uj ndAtrazine 98428083/85 0.038 u 0.040 u ndBenefin 98428083/85 0.058 u 0.060 u ndBromacil 98428083/85 0.15 uj 0.16 uj ndButachlor 98428083/85 0.23 u 0.24 u ndButylate 98428083/85 0.077 u 0.080 u ndCarboxin 98428083/85 0.23 uj 0.24 uj ndChlorothalonil (Daconil) 98428083/85 0.092 u 0.096 u ndChlorpropham 98428083/85 0.15 u 0.16 u ndCyanazine 98428083/85 0.058 u 0.060 u ndCycloate 98428083/85 0.077 u 0.080 u ndDiallate (Avadex) 98428083/85 0.27 u 0.28 u ndDichlobenil 98428083/85 0.077 u 0.029 j ncDiphenamid 98428083/85 0.12 u 0.12 u ndDiuron 98428083/85 0.23 u 0.24 u ndEptam 98428083/85 0.077 u 0.080 u ndEthalfluralin (Sonalan) 98428083/85 0.058 u 0.060 u ndFenarimol 98428083/85 0.12 u 0.12 u ndHexazinone 98428083/85 0.058 uj 0.060 uj ndMetalaxyl 98428083/85 0.23 uj 0.24 uj ndMetolachlor 98428083/85 0.15 u 0.16 u ndMetribuzin 98428083/85 0.038 u 0.040 u ndMGK-264 98428083/85 0.31 u 0.32 u ndMolinate 98428083/85 0.077 u 0.080 u ndNapropamide 98428083/85 0.12 u 0.12 u ndNorflurazon 98428083/85 0.077 uj 0.080 uj ndOxadiazon 98428083/85 0.063 j 0.052 j 0.058 19%Oxyfluorfen 98428083/85 0.15 u 0.16 u ndPebulate 98428083/85 0.077 u 0.080 u ndPendimethalin 98428083/85 0.058 u 0.060 u ndProfluralin 98428083/85 0.092 u 0.096 u ndPrometon (Pramitol 5p) 98428083/85 0.038 uj 0.040 uj ndPrometryn 98428083/85 0.038 uj 0.040 uj ndPronamide (Kerb) 98428083/85 0.15 u 0.16 u ndPropachlor (Ramrod) 98428083/85 0.092 u 0.096 u ndPropazine 98428083/85 0.038 u 0.040 u ndSimazine 98428083/85 0.038 u 0.040 u ndTebuthiuron 98428083/85 0.058 uj 0.060 uj ndTerbacil 98428083/85 0.12 u 0.12 u ndTerbutryn Igran) 98428083/85 0.038 u 0.040 u ndTriadimefon 98428083/85 0.10 u 0.10 u ndTriallate 98428083/85 0.12 uj 0.12 uj ndTrifluralin (Treflan) 98428083/85 0.058 u 0.060 u ndVernolate 98428083/85 0.077 u 0.080 u nd
IV. Matrix Spike Recoveries - Spring Stormwater

Table AE-1. Quality Assurance Data for Water.Parameter Sample No. Spike 1 Spike 2 mean RPD
Conventionals (mg/L)TOC 98268035 96.7%TP 98268035 85.5%TPN 98268035 82.0%
Metals (ug/L)Diss. Cd 98268033 107% 98% 103% 9%Diss. Cr 98268033 95% 87% 91% 9%Diss. Cu 98268033 102% 95% 99% 7%Diss. Ni 98268033 102% 96% 99% 6%Diss. Pb 98268033 103% 96% 100% 7%Diss. Zn 98268033 112% 105% 109% 6%Tot. Rec. Hg 98268033 86% 105% 96% 20%
Total Petroleum Hydrocarbons (mg/L)TPH-#2 Diesel 98268033 83% 66% 75% 23%
Semivolatile Organics (ug/L)1,2,4-Trichlorobenzene 98268033 60% 51% 56% 16%1,2-Dichlorobenzene 98268033 58% 49% 54% 17%1,3-Dichlorobenzene 98268033 57% 48% 53% 17%1,4-Dichlorobenzene 98268033 57% 50% 54% 13%1-Methylnaphthalene 98268033 NAF NAF2,2'-Oxybis[1-chloropropane] 98268033 82% 74% 78% 10%2,4,5-Trichlorophenol 98268033 104% 94% 99% 10%2,4,6-Trichlorophenol 98268033 99% 92% 96% 7%2,4-Dichlorophenol 98268033 86% 86% 86% 0%2,4-Dimethylphenol 98268033 98% 97% 98% 1%2,4-Dinitrophenol 98268033 92% 88% 90% 4%2,4-Dinitrotoluene 98268033 93% 87% 90% 7%2,6-Dinitrotoluene 98268033 100% 92% 96% 8%2-Chloronaphthalene 98268033 67% 58% 63% 14%2-Chlorophenol 98268033 75% 66% 71% 13%2-Methylnaphthalene 98268033 78% 72% 75% 8%2-Methylphenol 98268033 65% 60% 63% 8%2-Nitroaniline 98268033 102% 92% 97% 10%2-Nitrophenol 98268033 104% 98% 101% 6%3,3'-Dichlorobenzidine 98268033 NAF NAF3B-Coprostanol 98268033 NAF NAF3-Nitroaniline 98268033 9% 7% 8% 25%4,6-Dinitro-2-Methylphenol 98268033 91% 85% 88% 7%4-Bromophenyl-Phenylether 98268033 75% 71% 73% 5%4-Chloro-3-Methylphenol 98268033 92% 88% 90% 4%4-Chloroaniline 98268033 0% 0%4-Chlorophenyl-Phenylether 98268033 69% 64% 67% 8%4-Methylphenol 98268033 55% 51% 53% 8%4-Nitroaniline 98268033 47% 32% 40% 38%4-Nitrophenol 98268033 0% 29% 15% 200%IV. Matrix Spike Recoveries - Spring Stormwater
Parameter Sample No. Spike 1 Spike 2 mean RPD

Table AE-1. Quality Assurance Data for Water.Acenaphthene 98268033 69% 63% 66% 9%Acenaphthylene 98268033 73% 67% 70% 9%Aniline 98268033 0% 0% 0%Anthracene 98268033 73% 70% 72% 4%Benzidine 98268033 NAF NAFBenzo(a)anthracene 98268033 64% 73% 69% 13%Benzo(a)pyrene 98268033 69% 81% 75% 16%Benzo(b)fluoranthene 98268033 70% 80% 75% 13%Benzo(ghi)perylene 98268033 61% 72% 67% 17%Benzo(k)fluoranthene 98268033 63% 74% 69% 16%Benzoic Acid 98268033 70% 70% 70% 0%Benzyl Alcohol 98268033 43% 40% 42% 7%Bis(2-Chloroethoxy)Methane 98268033 85% 79% 82% 7%Bis(2-Chloroethyl)Ether 98268033 79% 71% 75% 11%Bis(2-Ethylhexyl) Phthalate 98268033 128% 84% 106% 42%Butylbenzylphthalate 98268033 92% 90% 91% 2%Caffeine 98268033 NAF NAFCarbazole 98268033 NAF NAFChrysene 98268033 61% 69% 65% 12%Dibenzo(ah)anthracene 98268033 63% 75% 69% 17%Dibenzofuran 98268033 83% 75% 79% 10%Diethylphthalate 98268033 97% 90% 94% 7%Dimethylphthalate 98268033 90% 83% 87% 8%Di-N-Butylphthalate 98268033 88% 85% 87% 3%Di-N-Octyl Phthalate 98268033 69% 80% 75% 15%Fluoranthene 98268033 80% 78% 79% 3%Fluorene 98268033 75% 70% 73% 7%Hexachlorobenzene 98268033 67% 69% 68% 3%Hexachlorobutadiene 98268033 59% 50% 55% 17%Hexachlorocyclopentadiene 98268033 54% 41% 48% 27%Hexachloroethane 98268033 58% 48% 53% 19%Indeno(1,2,3-cd)pyrene 98268033 62% 72% 67% 15%Isophorone 98268033 87% 83% 85% 5%Naphthalene 98268033 62% 55% 59% 12%Nitrobenzene 98268033 87% 81% 84% 7%N-Nitrosodimethylamine 98268033 32% 28% 30% 13%N-Nitroso-Di-N-Propylamine 98268033 96% 86% 91% 11%N-Nitrosodiphenylamine 98268033 71% 66% 69% 7%Pentachlorophenol 98268033 98% 93% 96% 5%Phenanthrene 98268033 78% 74% 76% 5%Phenol 98268033 25% 21% 23% 17%Pyrene 98268033 72% 72% 72% 0%Pyridine 98268033 NAF NAFRetene 98268033 NAF NAF

Table AE-1. Quality Assurance Data for Water.IV. Matrix Spike Recoveries - Spring Stormwater
Parameter Sample No. Spike 1 Spike 2 mean RPD
Chlorophenoxy Herbicides (ug/L)2,3,4,5-Tetrachlorophenol 98268033 124% 120% 122% 3%2,3,4,6-Tetrachlorophenol 98268033 100% 98% 99% 2%2,4,5-T 98268033 189% 202% 196% 7%2,4,5-TB 98268033 90% 92% 91% 2%2,4,5-TP (Silvex) 98268033 63% 54% 59% 15%2,4,5-Trichlorophenol 98268033 126% 122% 124% 3%2,4,6-Tribromophenol 98268033 106% 103% 105% 3%2,4,6-Trichlorophenol 98268033 93% 94% 94% 1%2,4-D 98268033 110% 114% 112% 4%2,4-DB 98268033 97% 101% 99% 4%3,5-Dichlorobenzoic Acid 98268033 85% 85% 85% 0%4-Nitrophenol 98268033 41% 27% 34% 41%Acifluorfen (Blazer) 98268033 53% 65% 59% 20%Bentazon 98268033 93% 95% 94% 2%Bromoxynil 98268033 100% 98% 99% 2%Dacthal (DCPA) 98268033 77% 85% 81% 10%Dicamba I 98268033 78% 77% 78% 1%Dichlorprop 98268033 101% 98% 100% 3%Diclofop-Methyl 98268033 87% 92% 90% 6%Dinoseb 98268033 116% 112% 114% 4%Ioxynil 98268033 76% 84% 80% 10%MCPA 98268033 98% 99% 99% 1%MCPP (Mecoprop) 98268033 93% 89% 91% 4%Pentachlorophenol 98268033 105% 97% 101% 8%Picloram 98268033 46% 56% 51% 20%Triclopyr 98268033 190% 189% 190% 1%

Table AE-1. Quality Assurance Data for Water.IV. Matrix Spike Recoveries - Spring Stormwater
Parameter Sample No. Spike 1 Spike 2 mean RPD
Nitrogen Pesticides (ug/L)1,3-Dimethyl-2-nitrobenzene 98268033 98% 91% 95% 7%Alachlor 98268033 122% 98% 110% 22%Atrazine 98268033 74% 65% 70% 13%Bromacil 98268033 83% 78% 81% 6%Dichlobenil 98268033 107% 104% 106% 3%Diphenamid 98268033 88% 83% 86% 6%Ethalfluralin (Sonalan) 98268033 84% 78% 81% 7%Fluridone 98268033 0% 0% 0%Metolachlor 98268033 98% 91% 95% 7%Metribuzin 98268033 72% 62% 67% 15%Napropamide 98268033 85% 77% 81% 10%Norflurazon 98268033 31% 32% 32% 3%Oxyfluorfen 98268033 50% 54% 52% 8%Pendimethalin 98268033 69% 73% 71% 6%Prometryn 98268033 35% 25% 30% 33%Pronamide (Kerb) 98268033 97% 82% 90% 17%Propachlor (Ramrod) 98268033 106% 92% 99% 14%Simazine 98268033 99% 89% 94% 11%Tebuthiuron 98268033 121% 88% 105% 32%Terbacil 98268033 95% 87% 91% 9%Treflan (Trifluralin) 98268033 189% 161% 175% 16%

Table AE-1. Quality Assurance Data for Water.V. Matrix Spike Recoveries - Fall Stormwater
Parameter Sample No. Spike 1 Spike 2 mean RPD
Conventionals (mg/L)TOC 98428087 106%TP 98428086 88%TPN 98428086 78%
Metals (ug/L)Diss. Cd 98428080 104% 105% 105% 1%Diss. Cr 98428080 97% 96% 97% 1%Diss. Cu 98428080 106% 106% 106% 0%Diss. Ni 98428080 103% 104% 104% 1%Diss. Pb 98428080 113% 115% 114% 2%Diss. Zn 98428080 121% 121% 121% 0%Tot. Rec. Hg 98428080 92% 91% 92% 1%
Semivolatile Organics (ug/L)1,2,4-Trichlorobenzene 98428080 65% 63% 64% 3%1,2-Dichlorobenzene 98428080 64% 58% 61% 10%1,3-Dichlorobenzene 98428080 61% 54% 58% 12%1,4-Dichlorobenzene 98428080 62% 55% 59% 12%1-Methylnaphthalene 98428080 NAF NAF2,2'-Oxybis[1-chloropropane] 98428080 80% 72% 76% 11%2,4,5-Trichlorophenol 98428080 100% 89% 95% 12%2,4,6-Trichlorophenol 98428080 98% 86% 92% 13%2,4-Dichlorophenol 98428080 90% 78% 84% 14%2,4-Dimethylphenol 98428080 74% 60% 67% 21%2,4-Dinitrophenol 98428080 82% 72% 77% 13%2,4-Dinitrotoluene 98428080 94% 82% 88% 14%2,6-Dinitrotoluene 98428080 94% 82% 88% 14%2-Chloronaphthalene 98428080 73% 71% 72% 3%2-Chlorophenol 98428080 73% 60% 67% 20%2-Methylnaphthalene 98428080 83% 73% 78% 13%2-Methylphenol 98428080 60% 48% 54% 22%2-Nitroaniline 98428080 103% 87% 95% 17%2-Nitrophenol 98428080 88% 76% 82% 15%3,3'-Dichlorobenzidine 98428080 NAF NAF3B-Coprostanol 98428080 NAF NAF3-Nitroaniline 98428080 42% 32% 37% 27%4,6-Dinitro-2-Methylphenol 98428080 92% 82% 87% 11%4-Bromophenyl-Phenylether 98428080 88% 80% 84% 10%4-Chloro-3-Methylphenol 98428080 82% 70% 76% 16%4-Chloroaniline 98428080 3% 2% 3% 40%4-Chlorophenyl-Phenylether 98428080 87% 80% 84% 8%4-Methylphenol 98428080 52% 40% 46% 26%4-Nitroaniline 98428080 70% 58% 64% 19%4-Nitrophenol 98428080 28% 22% 25% 24%Acenaphthene 98428080 81% 75% 78% 8%Acenaphthylene 98428080 81% 76% 79% 6%Aniline 98428080 57% 50% 54% 13%V. Matrix Spike Recoveries - Fall Stormwater

Table AE-1. Quality Assurance Data for Water.Parameter Sample No. Spike 1 Spike 2 mean RPD
Anthracene 98428080 89% 78% 84% 13%Benzidine 98428080 NAF NAFBenzo(a)anthracene 98428080 91% 80% 86% 13%Benzo(a)pyrene 98428080 92% 77% 85% 18%Benzo(b)fluoranthene 98428080 106% 86% 96% 21%Benzo(ghi)perylene 98428080 84% 79% 82% 6%Benzo(k)fluoranthene 98428080 88% 76% 82% 15%Benzoic Acid 98428080 23% 18% 21% 24%Benzyl Alcohol 98428080 39% 30% 35% 26%Bis(2-Chloroethoxy)Methane 98428080 87% 75% 81% 15%Bis(2-Chloroethyl)Ether 98428080 85% 73% 79% 15%Bis(2-Ethylhexyl) Phthalate 98428080 104% 82% 93% 24%Butylbenzylphthalate 98428080 108% 95% 102% 13%Caffeine 98428080 NAF NAFCarbazole 98428080 NAF NAFChrysene 98428080 94% 80% 87% 16%Dibenzo(a,h)anthracene 98428080 88% 73% 81% 19%Dibenzofuran 98428080 91% 79% 85% 14%Diethylphthalate 98428080 99% 86% 93% 14%Dimethylphthalate 98428080 97% 83% 90% 16%Di-N-Butylphthalate 98428080 101% 89% 95% 13%Di-N-Octyl Phthalate 98428080 92% 75% 84% 20%Fluoranthene 98428080 96% 85% 91% 12%Fluorene 98428080 86% 79% 83% 8%Hexachlorobenzene 98428080 88% 81% 85% 8%Hexachlorobutadiene 98428080 64% 62% 63% 3%Hexachlorocyclopentadiene 98428080 41% 41% 41% 0%Hexachloroethane 98428080 60% 53% 57% 12%Indeno(1,2,3-cd)pyrene 98428080 89% 74% 82% 18%Isophorone 98428080 88% 76% 82% 15%Naphthalene 98428080 70% 69% 70% 1%Nitrobenzene 98428080 87% 77% 82% 12%N-Nitrosodimethylamine 98428080 21% 16% 19% 27%N-Nitroso-Di-N-Propylamine 98428080 90% 76% 83% 17%N-Nitrosodiphenylamine 98428080 116% 103% 110% 12%Pentachlorophenol 98428080 98% 86% 92% 13%Phenanthrene 98428080 92% 82% 87% 11%Phenol 98428080 21% 16% 19% 27%Pyrene 98428080 95% 83% 89% 13%Pyridine 98428080 NAF NAFRetene 98428080 NAF NAF

Table AE-1. Quality Assurance Data for Water.V. Matrix Spike Recoveries - Fall Stormwater
Parameter Sample No. Spike 1 Spike 2 mean RPD
Chlorophenoxy Herbicides (ug/L)2,3,4,5-Tetrachlorophenol 98428080 110% 108% 109% 2%2,3,4,6-Tetrachlorophenol 98428080 107% 111% 109% 4%2,4,5-T 98428080 91% 79% 85% 14%2,4,5-TB 98428080 88% 85% 87% 3%2,4,5-TP (Silvex) 98428080 100% 98% 99% 2%2,4,5-Trichlorophenol 98428080 99% 107% 103% 8%2,4,6-Trichlorophenol 98428080 92% 95% 94% 3%2,4-D 98428080 95% 81% 88% 16%2,4-DB 98428080 102% 99% 101% 3%3,5-Dichlorobenzoic acid 98428080 99% 100% 100% 1%4-Nitrophenol 98428080 41% 39% 40% 5%Acifluorfen (Blazer) 98428080 83% 70% 77% 17%Bentazon 98428080 96% 80% 88% 18%Bromoxynil 98428080 97% 88% 93% 10%DCPA (Dacthal) 98428080 80% 73% 77% 9%Dicamba 98428080 52% 48% 50% 8%Dichlorprop 98428080 104% 100% 102% 4%Diclofop-methyl 98428080 89% 81% 85% 9%Dinoseb 98428080 112% 96% 104% 15%Ioxynil 98428080 91% 72% 82% 23%MCPA 98428080 96% 91% 94% 5%MCPP (Mecoprop) 98428080 111% 116% 114% 4%Pentachlorophenol 98428080 131% 142% 137% 8%Picloram 98428080 23% 19% 21% 19%Triclopyr 98428080 106% 97% 102% 9%
Organophosphorous Pesticides (ug/L)Azinphos-methyl (Guthion) 98428080 53% 53% 53% 0%Coumaphos 98428080 70% 68% 69% 3%Diazinon 98428080 74% 77% 76% 4%Ethoprop 98428080 100% 101% 101% 1%Fenthion 98428080 8% 7% 8% 13%Imidan 98428080 58% 57% 58% 2%Parathion 98428080 66% 70% 68% 6%Parathion-Methyl 98428080 60% 63% 62% 5%Ronnel 98428080 96% 97% 97% 1%

Table AE-1. Quality Assurance Data for Water.V. Matrix Spike Recoveries - Fall Stormwater
Parameter Sample No. Spike 1 Spike 2 mean RPD
Nitrogen Pesticides (ug/L)Alachlor 98428080 120% 140% 130% 15%Atrazine 98428080 104% 93% 99% 11%Bromacil 98428080 14% 22% 18% 44%Dichlobenil 98428080 102% 103% 103% 1%Diphenamid 98428080 62% 64% 63% 3%Ethalfluralin (Sonalan) 98428080 47% 43% 45% 9%Metolachlor 98428080 99% 102% 101% 3%Metribuzin 98428080 90% 87% 89% 3%Napropamide 98428080 93% 92% 93% 1%Norflurazon 98428080 3% 3% 3% 0%Oxyfluorfen 98428080 86% 83% 85% 4%Pendimethalin 98428080 62% 57% 60% 8%Prometryn 98428080 15% 18% 17% 18%Pronamide (Kerb) 98428080 133% 130% 132% 2%Propachlor (Ramrod) 98428080 93% 91% 92% 2%Simazine 98428080 80% 80% 80% 0%Terbacil 98428080 69% 67% 68% 3%Trifluralin (Treflan) 98428080 54% 50% 52% 8%
RPD=Relative Percent Differenceu=not detected at or above reported valuej=estimated value, analyte positively identifieduj=not detected at or above reported estimated valuenj=estimated value, evidence that the analyte is presentREJ=rejected, data are unusable for all purposesnr=not reportednd=not detectednc=not calculatedNAF=not analyzed for

Table AE-2. Quality Assurance Data for Sediments.
I. Precision of Laboratory Duplicates
Parameter Sample No. Dup.1 Dup.2 Rep. 1 mean RPD RSD
ConventionalsPhosphorus (mg/kg, dw)TKN (mg/kg/dw) 98428105 5090 5430 5260 6%TKN (mg/kg/dw) 99036092 1340 1320 1330 2%TOC104 (%) 98428112 1.65 1.75 1.69 3%TOC70 (%) 98428112 1.73 1.87 1.78 4%TOC104 (%) 99036090 7.45 6.89 7.39 7.24 4%TOC70 (%) 99036090 7.33 7.19 7.21 7.24 1%GRAIN SIZE (%)
Gravel (>2,000 um) 98428107 0 0 0 0%Sand (>62.5 um) 98428107 14.2 14.2 14.2 0%
Silt (>4 um) 98428107 61.3 60.5 60.9 1%Clay (<4 um) 98428107 24.5 25.3 24.9 3%
GRAIN SIZE (%)Gravel (>2,000 um) 99036092 12.3 17.6 15.0 35%
Sand (>62.5 um) 99036092 75.1 70.4 72.8 6%Silt (>4 um) 99036092 11.5 11.2 11.4 3%
Clay (<4 um) 99036092 1.1 0.8 1.0 32%
Metals (mg/kg, dw)
Mercury 98428107 0.194 0.204 0.199 5%
Total Petroleum Hydrocarbons (mg/kg, dw)Lube Oil 98428109 2100 j 2000 j 2050 5%#2 Diesel 98428109 370 u 340 u nd

Table AE-2. Quality Assurance Data for Sediments.
II. Precision of Field Replicates
Parameter Sample No. Rep.1 Rep.2 mean RPD
ConventionalsPhosphorus (mg/kg, dw) 98428111/12 418 392 405.0 6%TKN (mg/kg, dw)TOC104 (%) 98428111/12 1.73 1.70 1.7 2%TOC70 (%) 98428111/12 1.64 1.79 1.7 9%GRAIN SIZE (%)
Gravel (>2,000 um) 98428111/12 4.5 3.6 4.1 22%Sand (>62.5 um) 98428111/12 72.7 74.2 73.5 2%
Silt (>4 um) 98428111/12 18.8 18.5 18.7 2%Clay (<4 um) 98428111/12 4.0 3.8 3.9 5%
Metals (mg/kg, dw)Arsenic 98428111/12 2.7 3.34 3.0 21%Mercury 98428111/12 0.069 0.069 0.1 0%Lead 98428111/12 25.3 25 25.2 1%Nickel 98428111/12 31.6 31.8 31.7 1%Silver 98428111/12 0.4 uj 0.4 uj ndAntimony 98428111/12 4 uj 4 uj ndBeryllium 98428111/12 0.33 0.3 0.3 10%Cadmium 98428111/12 0.5 u 0.4 u ndChromium 98428111/12 47 47.9 47.5 2%Copper 98428111/12 27.5 23.2 25.4 17%Zinc 98428111/12 154 146 150 5%Selenium 98428111/12 0.3 u 0.3 u ndThallium 98428111/12 0.3 uj 0.3 uj nd
Total Petroleum Hydrocarbons (mg/kg, dw)Lube Oil 98428111/12 400 j 510 j 455 24%#2 Diesel 98428111/12 74 u 71 u

Table AE-2. Quality Assurance Data for Sediments.
II. Precision of Field Replicates
Parameter Sample No. Rep.1 Rep.2 mean RPD
Semivolatile Organics (ug/kg, dw)N-Nitrosodimethylamine 98428111/12 45 u 45 u ndPyridine 98428111/12 45 u 45 u ndAniline 98428111/12 REJ REJPhenol 98428111/12 22 u 22 u ndBis(2-Chloroethyl)Ether 98428111/12 45 u 45 u nd2-Chlorophenol 98428111/12 45 u 45 u nd1,3-Dichlorobenzene 98428111/12 22 uj 22 uj nd1,4-Dichlorobenzene 98428111/12 22 u 22 u nd1,2-Dichlorobenzene 98428111/12 22 u 22 u ndBenzyl Alcohol 98428111/12 22 u 22 u nd2-Methylphenol 98428111/12 16 j 16 j 16 0%2,2'-Oxybis[1-chloropropan98428111/12 22 u 22 u ndN-Nitroso-Di-N-Propylamin 98428111/12 112 u 112 u nd4-Methylphenol 98428111/12 80 62 71 25%Hexachloroethane 98428111/12 REJ REJNitrobenzene 98428111/12 22 uj 22 uj ndIsophorone 98428111/12 45 u 45 u nd2-Nitrophenol 98428111/12 REJ REJ2,4-Dimethylphenol 98428111/12 22 u 22 u ndBis(2-Chloroethoxy)Methan98428111/12 45 u 45 u ndBenzoic Acid 98428111/12 2740 u 2740 u nd2,4-Dichlorophenol 98428111/12 22 u 22 u nd1,2,4-Trichlorobenzene 98428111/12 22 u 22 u ndNaphthalene 98428111/12 62 49 56 23%4-Chloroaniline 98428111/12 22 u REJ ndHexachlorobutadiene 98428111/12 22 u 22 u nd4-Chloro-3-Methylphenol 98428111/12 22 u 22 u nd2-Methylnaphthalene 98428111/12 58 49 54 17%1-Methylnaphthalene 98428111/12 25 20 j 23 22%Hexachlorocyclopentadiene98428111/12 REJ REJ2,4,6-Trichlorophenol 98428111/12 22 u 22 u nd2,4,5-Trichlorophenol 98428111/12 22 u 22 u nd2-Chloronaphthalene 98428111/12 22 u 22 u nd2-Nitroaniline 98428111/12 112 u 112 u ndDimethylphthalate 98428111/12 22 u 153 nc2,6-Dinitrotoluene 98428111/12 45 uj 45 uj ndAcenaphthylene 98428111/12 17 j 17 j 17 0%3-Nitroaniline 98428111/12 112 uj 112 uj ndAcenaphthene 98428111/12 78 60 69 26%2,4-Dinitrophenol 98428111/12 224 uj 223 uj nd4-Nitrophenol 98428111/12 45 u 45 u ndDibenzofuran 98428111/12 54 44 49 20%2,4-Dinitrotoluene 98428111/12 22 uj 22 uj ndDiethylphthalate 98428111/12 24 u 112 u ndII. Precision of Field Replicates
Parameter Sample No. Rep.1 Rep.2 mean RPD

Table AE-2. Quality Assurance Data for Sediments.
Fluorene 98428111/12 77 63 70 20%4-Chlorophenyl-Phenylethe98428111/12 22 u 22 u nd4-Nitroaniline 98428111/12 45 uj 45 uj nd4,6-Dinitro-2-Methylphenol 98428111/12 REJ REJN-Nitrosodiphenylamine 98428111/12 45 u 45 u nd4-Bromophenyl-Phenylethe98428111/12 45 u 45 u ndHexachlorobenzene 98428111/12 45 u 45 u ndPentachlorophenol 98428111/12 112 u 112 u ndPhenanthrene 98428111/12 1200 1000 1100 18%Anthracene 98428111/12 127 105 116 19%Caffeine 98428111/12 20 j 25 j 23 22%Carbazole 98428111/12 137 101 j 119 30%Di-N-Butylphthalate 98428111/12 378 u 172 u ndFluoranthene 98428111/12 1600 1330 1465 18%Benzidine 98428111/12 224 uj 223 uj ndPyrene 98428111/12 1370 1160 1265 17%Retene 98428111/12 97 454 276 130%Butylbenzylphthalate 98428111/12 55 61 58 10%Benzo(a)anthracene 98428111/12 415 360 388 14%3,3'-Dichlorobenzidine 98428111/12 224 u 223 u ndChrysene 98428111/12 754 644 699 16%Bis(2-Ethylhexyl) Phthalate98428111/12 1250 951 1101 27%Di-N-Octyl Phthalate 98428111/12 112 u 112 u ndBenzo(b)fluoranthene 98428111/12 809 692 751 16%Benzo(k)fluoranthene 98428111/12 317 241 279 27%Benzo(a)pyrene 98428111/12 638 612 625 4%3B-Coprostanol 98428111/12 588 j 223 uj ncIndeno(1,2,3-cd)pyrene 98428111/12 414 396 405 4%Dibenzo(a,h)anthracene 98428111/12 106 j 109 j 108 3%Benzo(ghi)perylene 98428111/12 386 377 382 2%
Octanoic acid (CAS No. 1298428111/12 197 nj nd ndBenaldehyde, 4-hydroxy- ( 98428111/12 439 nj 242 nj 341 58%1-Pentadecanol (CAS No. 98428111/12 183 nj nd ndHeptadecane (CAS No. 62 98428111/12 194 nj 176 nj 185 10%Hexadecanoic acid (CAS N98428111/12 5040 nj 4510 nj 4775 11%Phytol (CAS No. 150867) 98428111/12 730 nj nd ndToluene (CAS No. 108883)98428111/12 nd 243 nj ndBenzofuran, 2,3-dihydro- (C98428111/12 nd 218 nj ndVanillin (CAS No. 121335) 98428111/12 nd 157 nj ndCyclopropane, nonyl- (CAS98428111/12 nd 177 nj ndNaphthalene, 1,6-dimethyl-98428111/12 nd 179 nj ndTetradecanoic acid (CAS N98428111/12 nd 1060 nj nd

Table AE-2. Quality Assurance Data for Sediments.
III. Matrix Spike Recoveries
Parameter Sample No. Spike 1 Spike 2 mean RPD
ConventionalsPhosphorus (mg/kg, dw) 98428107 102 81 92 23%Phosphorus (mg/kg, dw) 99036091 98TKN (mg/kg, dw) 99036092 126
Metals(mg/kg, dw)Arsenic 98428107 103 88 96 16%Mercury 98428107 102 101 102 1%Lead 98428107 101 102 102 1%Nickel 98428107 101 94 98 7%Silver 98428107 87 88 88 1%Antimony 98428107 0 0 0Beryllium 98428107 104 103 104 1%Cadmium 98428107 108 103 106 5%Chromium 98428107 84 75 80 11%Copper 98428107 107 104 106 3%Zinc 98428107 100 97 99 3%Selenium 98428107 78 84 81 7%Thallium 98428107 13 9 11 36%Arsenic 99036091 88Mercury 99036091 98Lead 99036091 145Nickel 99036091 92Silver 99036091 95Antimony 99036091 35Beryllium 99036091 96Cadmium 99036091 90Chromium 99036091 99Copper 99036091 98Zinc 99036091 91Selenium 99036091 101Thallium 99036091 80
Total Petroleum Hydrocarbons (mg/kg, dw)#2 Diesel 98428107 88 97 93 10%#2 Diesel 99036091 90
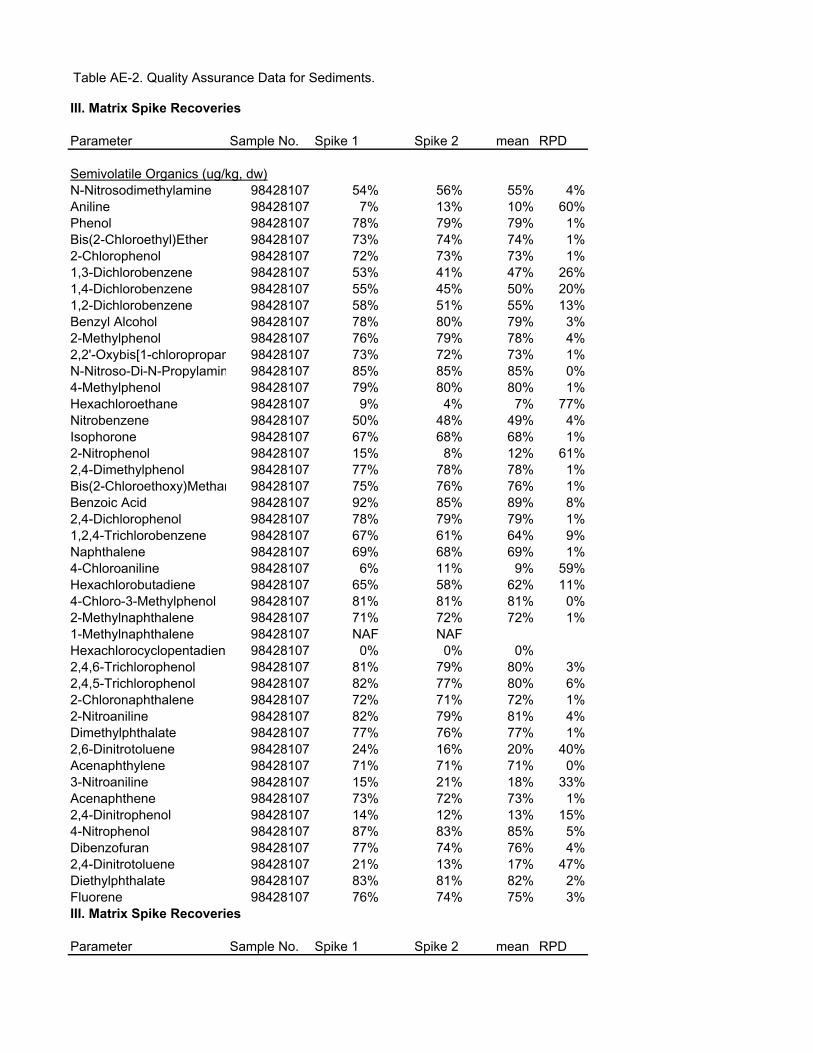
Table AE-2. Quality Assurance Data for Sediments.
III. Matrix Spike Recoveries
Parameter Sample No. Spike 1 Spike 2 mean RPD
Semivolatile Organics (ug/kg, dw)N-Nitrosodimethylamine 98428107 54% 56% 55% 4%Aniline 98428107 7% 13% 10% 60%Phenol 98428107 78% 79% 79% 1%Bis(2-Chloroethyl)Ether 98428107 73% 74% 74% 1%2-Chlorophenol 98428107 72% 73% 73% 1%1,3-Dichlorobenzene 98428107 53% 41% 47% 26%1,4-Dichlorobenzene 98428107 55% 45% 50% 20%1,2-Dichlorobenzene 98428107 58% 51% 55% 13%Benzyl Alcohol 98428107 78% 80% 79% 3%2-Methylphenol 98428107 76% 79% 78% 4%2,2'-Oxybis[1-chloropropan 98428107 73% 72% 73% 1%N-Nitroso-Di-N-Propylamin 98428107 85% 85% 85% 0%4-Methylphenol 98428107 79% 80% 80% 1%Hexachloroethane 98428107 9% 4% 7% 77%Nitrobenzene 98428107 50% 48% 49% 4%Isophorone 98428107 67% 68% 68% 1%2-Nitrophenol 98428107 15% 8% 12% 61%2,4-Dimethylphenol 98428107 77% 78% 78% 1%Bis(2-Chloroethoxy)Methan 98428107 75% 76% 76% 1%Benzoic Acid 98428107 92% 85% 89% 8%2,4-Dichlorophenol 98428107 78% 79% 79% 1%1,2,4-Trichlorobenzene 98428107 67% 61% 64% 9%Naphthalene 98428107 69% 68% 69% 1%4-Chloroaniline 98428107 6% 11% 9% 59%Hexachlorobutadiene 98428107 65% 58% 62% 11%4-Chloro-3-Methylphenol 98428107 81% 81% 81% 0%2-Methylnaphthalene 98428107 71% 72% 72% 1%1-Methylnaphthalene 98428107 NAF NAFHexachlorocyclopentadiene 98428107 0% 0% 0%2,4,6-Trichlorophenol 98428107 81% 79% 80% 3%2,4,5-Trichlorophenol 98428107 82% 77% 80% 6%2-Chloronaphthalene 98428107 72% 71% 72% 1%2-Nitroaniline 98428107 82% 79% 81% 4%Dimethylphthalate 98428107 77% 76% 77% 1%2,6-Dinitrotoluene 98428107 24% 16% 20% 40%Acenaphthylene 98428107 71% 71% 71% 0%3-Nitroaniline 98428107 15% 21% 18% 33%Acenaphthene 98428107 73% 72% 73% 1%2,4-Dinitrophenol 98428107 14% 12% 13% 15%4-Nitrophenol 98428107 87% 83% 85% 5%Dibenzofuran 98428107 77% 74% 76% 4%2,4-Dinitrotoluene 98428107 21% 13% 17% 47%Diethylphthalate 98428107 83% 81% 82% 2%Fluorene 98428107 76% 74% 75% 3%III. Matrix Spike Recoveries
Parameter Sample No. Spike 1 Spike 2 mean RPD

Table AE-2. Quality Assurance Data for Sediments.
4-Chlorophenyl-Phenylethe 98428107 78% 76% 77% 3%4-Nitroaniline 98428107 36% 43% 40% 18%4,6-Dinitro-2-Methylphenol 98428107 13% 7% 10% 60%N-Nitrosodiphenylamine 98428107 98% 97% 98% 1%4-Bromophenyl-Phenylethe 98428107 78% 77% 78% 1%Hexachlorobenzene 98428107 80% 77% 79% 4%Pentachlorophenol 98428107 71% 67% 69% 6%Phenanthrene 98428107 76% 74% 75% 3%Anthracene 98428107 75% 74% 75% 1%Caffeine 98428107 NAF NAFCarbazole 98428107 NAF NAFDi-N-Butylphthalate 98428107 86% 82% 84% 5%Fluoranthene 98428107 76% 76% 76% 0%Benzidine 98428107 NAF NAFPyrene 98428107 65% 64% 65% 2%Retene 98428107 NAF NAFButylbenzylphthalate 98428107 78% 76% 77% 3%Benzo(a)anthracene 98428107 69% 67% 68% 3%3,3'-Dichlorobenzidine 98428107 NAF NAFChrysene 98428107 67% 66% 67% 2%Bis(2-Ethylhexyl) Phthalate 98428107 81% 202% 142% 86%Di-N-Octyl Phthalate 98428107 82% 80% 81% 2%Benzo(b)fluoranthene 98428107 82% 81% 82% 1%Benzo(k)fluoranthene 98428107 75% 74% 75% 1%Benzo(a)pyrene 98428107 77% 75% 76% 3%3B-Coprostanol 98428107 NAF NAFIndeno(1,2,3-cd)pyrene 98428107 70% 70% 70% 0%Dibenzo(a,h)anthracene 98428107 73% 71% 72% 3%Benzo(ghi)perylene 98428107 74% 71% 73% 4%N-Nitrosodimethylamine 9936091 47%Aniline 9936091 3%Phenol 9936091 60%Bis(2-Chloroethyl)Ether 9936091 59%2-Chlorophenol 9936091 65%1,3-Dichlorobenzene 9936091 46%1,4-Dichlorobenzene 9936091 48%1,2-Dichlorobenzene 9936091 52%Benzyl Alcohol 9936091 64%2-Methylphenol 9936091 66%2,2'-Oxybis[1-chloropropan 9936091 59%N-Nitroso-Di-N-Propylamin 9936091 69%4-Methylphenol 9936091 65%Hexachloroethane 9936091 39%Nitrobenzene 9936091 63%Isophorone 9936091 63%III. Matrix Spike Recoveries
Parameter Sample No. Spike 1 Spike 2 mean RPD
2-Nitrophenol 9936091 61%2,4-Dimethylphenol 9936091 64%

Table AE-2. Quality Assurance Data for Sediments.
Bis(2-Chloroethoxy)Methan 9936091 62%Benzoic Acid 9936091 91%2,4-Dichlorophenol 9936091 68%1,2,4-Trichlorobenzene 9936091 56%Naphthalene 9936091 59%4-Chloroaniline 9936091 6%Hexachlorobutadiene 9936091 54%4-Chloro-3-Methylphenol 9936091 72%2-Methylnaphthalene 9936091 63%1-Methylnaphthalene 9936091 NAFHexachlorocyclopentadiene 9936091 0%2,4,6-Trichlorophenol 9936091 70%2,4,5-Trichlorophenol 9936091 73%2-Chloronaphthalene 9936091 64%2-Nitroaniline 9936091 73%Dimethylphthalate 9936091 72%2,6-Dinitrotoluene 9936091 73%Acenaphthylene 9936091 67%3-Nitroaniline 9936091 13%Acenaphthene 9936091 68%2,4-Dinitrophenol 9936091 84%4-Nitrophenol 9936091 75%Dibenzofuran 9936091 68%2,4-Dinitrotoluene 9936091 72%Diethylphthalate 9936091 73%Fluorene 9936091 71%4-Chlorophenyl-Phenylethe 9936091 72%4-Nitroaniline 9936091 24%4,6-Dinitro-2-Methylphenol 9936091 76%N-Nitrosodiphenylamine 9936091 93%4-Bromophenyl-Phenylethe 9936091 74%Hexachlorobenzene 9936091 73%Pentachlorophenol 9936091 60%Phenanthrene 9936091 79%Anthracene 9936091 72%Caffeine 9936091 NAFCarbazole 9936091 NAFDi-N-Butylphthalate 9936091 112%Fluoranthene 9936091 72%Benzidine 9936091 NAFPyrene 9936091 79%Retene 9936091 NAFButylbenzylphthalate 9936091 77%III. Matrix Spike Recoveries
Parameter Sample No. Spike 1 Spike 2 mean RPD
Benzo(a)anthracene 9936091 76%3,3'-Dichlorobenzidine 9936091 NAFChrysene 9936091 65%Bis(2-Ethylhexyl) Phthalate 9936091 75%Di-N-Octyl Phthalate 9936091 88%

Table AE-2. Quality Assurance Data for Sediments.
Benzo(b)fluoranthene 9936091 73%Benzo(k)fluoranthene 9936091 76%Benzo(a)pyrene 9936091 68%3B-Coprostanol 9936091 NAFIndeno(1,2,3-cd)pyrene 9936091 69%Dibenzo(a,h)anthracene 9936091 68%Benzo(ghi)perylene 9936091 66%
Chlorophenoxy Herbicides (ug/kg, dw)2,4,6-Trichlorophenol 98428108 41% 27% 34% 41%3,5-Dichlorobenzoic acid 98428108 62% 44% 53% 34%4-Nitrophenol 98428108 36% 33% 35% 9%2,4,5-Trichlorophenol 98428108 55% 42% 49% 27%Dicamba 98428108 57% 46% 52% 21%2,3,4,6-Tetrachlorophenol 98428108 44% 32% 38% 32%MCPP (Mecoprop) 98428108 67% 51% 59% 27%MCPA 98428108 66% 52% 59% 24%Dichlorprop 98428108 59% 48% 54% 21%2,4-D 98428108 60% 48% 54% 22%2,3,4,5-Tetrachlorophenol 98428108 44% 32% 38% 32%Triclopyr 98428108 64% 51% 58% 23%Pentachlorophenol 98428108 33% 24% 29% 32%2,4,5-TP (Silvex) 98428108 62% 45% 54% 32%2,4,5-T 98428108 58% 45% 52% 25%2,4-DB 98428108 57% 46% 52% 21%Dinoseb 98428108 10% 12% 11% 18%Bentazon 98428108 86% 77% 82% 11%Dacthal (DCPA) 98428108 48% 41% 45% 16%2,4,5-TB 98428108 51% 37% 44% 32%Diclofop-Methyl 98428108 41% 30% 36% 31%

Table AE-2. Quality Assurance Data for Sediments.
III. Matrix Spike Recoveries
Parameter Sample No. Spike 1 Spike 2 mean RPD
Organophosphorous Pesticides (ug/kg, dw)Sulfotepp 98428108 90% 72% 81% 22%Fonophos 98428108 80% 73% 77% 9%Chlorpyrifos-methyl 98428108 90% 83% 87% 8%Fenitrothion 98428108 109% 107% 108% 2%Malathion 98428108 107% 103% 105% 4%Chlorpyrifos 98428108 91% 88% 90% 3%Ethion 98428108 101% 100% 101% 1%Carbophenothion 98428108 16% 16% 16% 0%EPN 98428108 96% 94% 95% 2%Azinphos-ethyl 98428108 101% 95% 98% 6%
Nitrogen PesticidesDichlobenil 98428108 90% 73% 82% 21%Propachlor (Ramrod) 98428108 80% 66% 73% 19%Ethalfluralin (Sonalan) 98428108 84% 66% 75% 24%Trifluralin (Treflan) 98428108 80% 70% 75% 13%Simazine 98428108 80% 72% 76% 11%Atrazine 98428108 77% 72% 75% 7%Pronamide (Kerb) 98428108 80% 79% 80% 1%Terbacil 98428108 90% 86% 88% 5%Metribuzin 98428108 53% 40% 47% 28%Alachlor 98428108 73% 72% 73% 1%Prometryn 98428108 70% 56% 63% 22%Bromacil 98428108 36% 26% 31% 32%Metolachlor 98428108 86% 80% 83% 7%Diphenamid 98428108 62% 60% 61% 3%Pendimethalin 98428108 79% 77% 78% 3%Napropamide 98428108 73% 88% 81% 19%Oxyfluorfen 98428108 84% 77% 81% 9%
RPD=Relative Percent DifferenceRSD=Relative Standard Deviationtentatively identified compounds in italicsu=not detected at or above reported valuej=estimated value, analyte positively identifieduj=not detected at or above reported estimated valuenj=estimated value, evidence that the analyte is presentREJ=rejected, data are unusable for all purposesnr=not reportednd=not detectednc=not calculatedNAF=not analyzed for

Appendix F
Water Sample Results

Table AF-1. Water Sample Results.Location:Date: 6/24/98 10/12/98 6/24/98 10/12/98 6/24/98 10/12/98 6/24/98 10/12/98 6/24/98 10/12/98 6/24/98 10/12/98Sample No: (98-) 268031 428080 268036 428082 268030 428083/85 268033 428084 268035 428086 268034 428087/88
Field DatapH 7.59 7.27 7.45 7.26 7.87 7.43 b 7.74 7.32 7.54 7.27 b 7.59 7.42Temp (C) 13.6 11.8 14.0 13.0 13.9 12.9 13.9 10.5 15.0 nr 10.6 13.1Discharge (L/s) 277 231 2.8 >5.7 3.7 7.9 24 199 11 193 27 336
Conventionals (mg/L)TSS 1 6 a 11 228 a 18 31 6 32 10 33 31 a 92 b
TOC 3.1 8.4 7.2 21.2 a 8.6 a 8.9 9.1 11.1 10.5 7.6 14.6 8.4 b
TP 0.014 0.010 ua 0.065 0.016 0.081 a 0.010 u 0.087 0.018 0.078 0.034 0.165 0.068 b
TPN 0.364 1.05 a 0.646 0.975 0.592 a 0.758 1.00 1.03 0.895 0.801 1.40 0.820 b
Hardness 29.3 40.9 54.4 a 23.4 106 52.2 61.7 46.6 a 65.5 28.3 61.9 27.2 b
Fecal Coliforms (colonies/100 mL)1045 683 5600 3800 472 5537 4200 11000 7727 3200 5800 5200
Metals (ug/L)Diss. Cd 0.02 u 0.02 u 0.02 u 0.026 0.02 u 0.02 u 0.02 u 0.02 u 0.021 0.033 0.11 0.048 b
Diss. Cr 0.48 0.50 1.0 1.2 1.8 0.79 1.1 0.49 1.2 1.06 1.2 0.38 b
Diss. Cu 0.696 1.34 1.84 3.31 3.27 3.89 1.88 1.68 3.53 2.52 9.03 3.36 b
Diss. Ni 0.772 1.07 1.06 1.23 2.09 1.01 1.25 1.02 1.53 0.96 2.20 1.08 b
Diss. Pb 0.027 0.057 0.11 0.328 0.038 0.088 0.066 0.15 0.18 0.257 0.229 0.232 b
Diss. Zn 2.98 4.38 5.1 8.88 3.95 5.43 5.55 2.72 11.8 18.5 99.6 60.6 b
Tot. Rec. Hg 0.0039 0.0096 0.0051 0.0056 0.0097 0.0079 0.0053 0.0088 0.0063 0.0059 0.015 0.0057 b
Total Petroleum Hydrocarbons (mg/L)TPH-Heavy Fuel Oil 0.53 uj 0.32 ua 0.68 j 1.4 j 0.82 j 0.33 j 1.2 j 0.38 j 1.1 j 0.88 j 3.7 j 1.6 jb
TPH-#2 Diesel nr 0.16 ua nr 0.15 u nr 0.15 u nr 0.15 u nr 0.15 u nr 0.15 ub
Lincoln Creek Fever CreekAustin Creek Cable Street Park Place Cemetery Creek

Table AF-1. Water Sample Results.Location:Date: 6/24/98 10/12/98 6/24/98 10/12/98 6/24/98 10/12/98 6/24/98 10/12/98 6/24/98 10/12/98 6/24/98 10/12/98Sample No: (98-) 268031 428080 268036 428082 268030 428083/85 268033 428084 268035 428086 268034 428087/88
Lincoln Creek Fever CreekAustin Creek Cable Street Park Place Cemetery Creek
Semivolatile Organics (ug/L)1,2,4-Trichlorobenzene 0.24 u 0.12 u 0.12 u 0.12 u 0.25 u 0.12 u 0.12 uj 0.12 u 0.12 u 0.13 u 0.12 u 0.12 ub
1,2-Dichlorobenzene 0.24 uj 0.12 u 0.12 uj 0.12 u 0.25 uj 0.12 u 0.12 uj 0.12 u 0.12 uj 0.13 u 0.12 uj 0.12 ub
1,3-Dichlorobenzene 0.24 uj 0.12 u 0.25 uj 0.12 u 0.25 uj 0.12 u 0.25 uj 0.12 u 0.25 uj 0.13 u 0.24 uj 0.12 ub
1,4-Dichlorobenzene 0.24 u 0.12 u 0.12 u 0.12 u 0.25 u 0.12 u 0.12 uj 0.12 u 0.12 u 0.13 u 0.12 u 0.12 ub
1-Methylnaphthalene 0.12 u 0.13 u 0.12 u 0.0097 j 0.12 u 0.037 j 0.03 j 0.12 u 0.12 u 0.0054 nj 0.12 u 0.046 jbc
2,2'-Oxybis[1-chloropropane] 0.24 u 0.12 u 0.12 u 0.12 u 0.25 u 0.12 u 0.12 uj 0.12 u 0.12 u 0.13 u 0.12 u 0.12 ub
2,4,5-Trichlorophenol 0.12 u 0.12 u 0.12 u 0.12 u 0.12 u 0.12 u 0.12 uj 0.12 u 0.12 u 0.13 u 0.12 u 0.12 ub
2,4,6-Trichlorophenol 0.12 u 0.12 u 0.62 u 0.12 u 0.12 u 0.12 u 0.62 uj 0.12 u 0.62 u 0.13 u 0.61 u 0.12 ub
2,4-Dichlorophenol 0.24 u 0.12 u 0.12 u 0.12 u 0.25 u 0.12 u 0.12 uj 0.12 u 0.12 j 0.12 j 0.12 u 0.12 ub
2,4-Dimethylphenol 0.12 u 0.12 u 0.12 u 0.1 j 0.12 u 0.036 j 0.12 uj 0.12 u 0.12 u 0.0084 j 0.12 u 0.1 jbc
2,4-Dinitrophenol 2.4 u 1.2 u 2.5 u 1.2 u 2.5 u 1.2 u 2.5 uj 1.2 u 2.5 u 1.3 u 2.4 u 1.2 ub
2,4-Dinitrotoluene 0.24 u 0.12 uj 0.12 u 0.12 u 0.25 u 0.12 u 0.12 uj 0.12 u 0.12 u 0.13 u 0.12 u 0.12 ub
2,6-Dinitrotoluene 0.61 u 0.24 u 0.25 u 0.25 u 0.62 u 0.25 u 0.25 uj 0.25 u 0.25 u 0.26 u 0.24 u 0.25 ub
2-Chloronaphthalene 0.24 u 0.12 u 0.12 u 0.12 u 0.25 u 0.12 u 0.12 uj 0.12 u 0.12 u 0.13 u 0.12 u 0.12 ub
2-Chlorophenol 0.24 u 0.24 u 0.25 u 0.25 u 0.25 u 0.25 u 0.25 uj 0.25 u 0.25 u 0.26 u 0.24 u 0.25 ub
2-Methylnaphthalene 0.24 u 0.12 u 0.12 u 0.033 j 0.25 u 0.081 j 0.017 j 0.12 u 0.12 u 0.016 j 0.12 u 0.12 jbc
2-Methylphenol 0.24 u 0.12 uj 0.12 u 0.078 j 0.25 u 0.056 j 0.12 uj 0.042 j 0.12 u 0.027 j 0.052 j 0.054 jb
2-Nitroaniline 0.12 u 0.61 u 0.62 u 0.62 u 0.12 u 0.62 u 0.62 uj 0.62 u 0.62 u 0.64 u 0.61 u 0.62 ub
2-Nitrophenol 0.61 u 0.61 u 0.62 u 0.62 u 0.62 u 0.62 u 0.62 uj 0.62 u 0.62 u 0.64 u 0.61 u 0.62 ub
3,3'-Dichlorobenzidine 0.24 u 1.2 u 2.5 u 1.2 u 0.25 u 1.2 u 2.5 uj 1.2 u 2.5 u 1.3 u 2.4 u 1.2 ub
3B-Coprostanol 9.8 u 0.61 u 0.62 u 0.62 u 10 u 0.62 u 0.62 uj 1.6 0.62 u 0.64 u 0.61 u 0.62 ub
3-Nitroaniline REJ 0.61 uj REJ 0.62 uj REJ 0.62 uj REJ 0.62 uj REJ 0.64 uj REJ 0.62 ujb
4,6-Dinitro-2-Methylphenol 2.4 u 0.61 u 1.2 u 0.62 u 2.5 u 0.62 u 1.2 uj 0.62 u 1.2 u 0.64 u 1.2 u 0.62 ub
4-Bromophenyl-Phenylether 0.24 u 0.24 u 0.12 u 0.25 u 0.25 u 0.25 u 0.12 uj 0.25 u 0.12 u 0.26 u 0.12 u 0.25 ub
4-Chloro-3-Methylphenol 0.12 u 0.12 u 0.12 u 0.12 u 0.12 u 0.12 u 0.12 uj 0.12 u 0.12 u 0.13 u 0.12 u 0.12 ub
4-Chloroaniline REJ REJ REJ REJ REJ REJ REJ REJ REJ REJ REJ REJ4-Chlorophenyl-Phenylether 0.24 u 0.12 u 0.12 u 0.12 u 0.25 u 0.12 u 0.12 uj 0.12 u 0.12 u 0.13 u 0.12 u 0.12 ub
4-Methylphenol 0.24 u 0.011 nj 0.12 u 0.11 nj 0.25 u 0.12 u 0.12 uj 0.024 j 0.069 j 0.028 j 0.15 0.062 jbc
4-Nitroaniline 0.24 uj 0.24 u 0.12 uj 0.25 u 0.25 uj 0.25 u 0.12 uj 0.25 u 0.12 uj 0.26 u 0.12 uj 0.25 ub
4-Nitrophenol 0.61 uj 0.24 u 0.62 uj 0.25 u 0.62 uj 0.25 u 0.62 uj 0.25 u 0.62 uj 0.26 u 0.61 uj 0.25 ub
Acenaphthene 0.24 u 0.12 u 0.12 u 0.12 u 0.25 u 0.082 j 0.12 uj 0.022 j 0.12 u 0.13 u 0.12 u 0.1 jbc
Acenaphthylene 0.12 u 0.12 u 0.12 u 0.12 u 0.12 u 0.12 u 0.12 uj 0.014 j 0.12 u 0.015 j 0.12 u 0.12 ub
Aniline REJ 0.12 uj REJ 0.12 u REJ 0.12 u REJ 0.12 u REJ 0.13 u REJ 0.12 ub
Anthracene 0.24 u 0.12 u 0.12 u 0.12 u 0.25 u 0.04 j 0.12 uj 0.12 u 0.12 u 0.13 u 0.12 u 0.047 jbc
Benzidine 0.12 u 1.2 u 4.9 u 1.2 u 0.12 u 1.2 u 4.9 uj 1.2 u 5 u 1.3 u 4.9 u 1.2 ub
Benzo(a)anthracene 0.24 u 0.12 u 0.12 u 0.12 u 0.25 u 0.12 u 0.12 uj 0.12 u 0.12 u 0.12 u 0.12 u 0.12 ub
Benzo(a)pyrene 0.24 u 0.12 u 0.12 u 0.026 nj 0.25 u 0.024 nj 0.12 uj 0.12 u 0.023 j 0.04 nj 0.12 u 0.024 njb
Benzo(b)fluoranthene 0.61 u 0.12 u 0.12 u 0.25 u 0.62 u 0.042 j 0.12 uj 0.25 u 0.12 u 0.07 j 0.12 u 0.019 jbc
Benzo(ghi)perylene 0.24 u 0.24 u 0.12 u 0.038 j 0.25 u 0.03 j 0.12 uj 0.25 u 0.12 u 0.037 j 0.12 u 0.012 jbc
Benzo(k)fluoranthene 0.24 u 0.12 u 0.12 u 0.12 u 0.25 u 0.015 nj 0.12 uj 0.12 u 0.12 u 0.13 u 0.12 u 0.12 ub
Benzoic Acid 2.4 u 0.18 nj 2.5 u 0.52 j 0.36 j 0.37 j 2.5 uj 0.26 j 2.5 u 0.3 j 2.4 u 0.32 jb
Benzyl Alcohol 0.12 uj 0.12 uj 0.12 uj 0.12 uj 0.12 uj 0.082 j 0.12 uj 0.22 j 0.12 uj 0.14 j 0.12 uj 0.09 jb
Bis(2-Chloroethoxy)Methane 0.12 u 0.24 u 0.12 u 0.25 u 0.12 u 0.25 u 0.12 uj 0.25 u 0.12 u 0.26 u 0.12 u 0.25 ub
Bis(2-Chloroethyl)Ether 0.24 u 0.24 u 0.25 u 0.25 u 0.25 u 0.25 u 0.25 uj 0.25 u 0.25 u 0.26 u 0.24 u 0.25 ub
Bis(2-Ethylhexyl) Phthalate 0.045 j u 0.42 j 2.1 0.085 j 3.6 0.062 j 0.4 0.52 j 1.5 1.5 2.7 jb
Butylbenzylphthalate 0.12 u 0.12 u 0.62 u 0.12 u 0.036 j 0.48 0.62 uj 0.5 0.62 u 0.49 0.2 j 0.26 jb
Caffeine 0.011 j 0.05 j 0.13 0.25 u 0.085 j 0.25 u 0.063 j 0.052 j 0.69 0.21 j 1.4 0.2 jb
Carbazole 0.24 u 0.61 u 0.12 u 0.62 u 0.25 u 0.62 u 0.12 uj 0.62 u 0.12 u 0.64 u 0.12 u 0.62 ub
Chrysene 0.24 u 0.12 u 0.12 u 0.12 u 0.25 u 0.05 j 0.12 uj 0.12 u 0.12 u 0.063 j 0.12 u 0.05 jb
Dibenzo(ah)anthracene 0.12 u 0.61 u 0.25 u 0.62 u 0.12 u 0.62 u 0.25 uj 0.62 u 0.25 u 0.64 u 0.24 u 0.62 ub
Dibenzofuran 0.12 u 0.12 u 0.12 u 0.12 u 0.12 u 0.065 j 0.12 uj 0.12 u 0.12 u 0.13 u 0.12 u 0.079 jbc
Diethylphthalate 0.33 0.61 u 0.62 u 0.62 u 0.12 u 0.62 u 0.62 uj 0.62 u 0.015 j 0.13 u 0.18 j 0.34 jbc
Dimethylphthalate 0.24 u 0.12 u 0.12 u 0.12 u 0.25 u 0.12 u 0.12 uj 0.12 u 0.12 u 0.13 u 0.12 u 0.12 ub
Di-N-Butylphthalate 0.12 u 0.12 u 0.12 u 0.12 u 0.12 u 0.13 u 0.12 uj 0.12 u 0.17 u 0.14 u 0.16 0.2 jbc

Table AF-1. Water Sample Results.Location:Date: 6/24/98 10/12/98 6/24/98 10/12/98 6/24/98 10/12/98 6/24/98 10/12/98 6/24/98 10/12/98 6/24/98 10/12/98Sample No: (98-) 268031 428080 268036 428082 268030 428083/85 268033 428084 268035 428086 268034 428087/88
Lincoln Creek Fever CreekAustin Creek Cable Street Park Place Cemetery Creek
Di-N-Octyl Phthalate 0.61 u 0.61 u 0.25 u 0.62 u 0.62 u 0.58 j 0.25 uj 0.62 u 0.25 u 0.64 u 0.24 u 0.62 ub
Fluoranthene 0.12 u 0.12 u 0.12 u 0.045 j 0.12 u 0.18 0.12 uj 0.12 u 0.07 j 0.1 j 0.12 u 0.13 jb
Fluorene 0.24 u 0.12 u 0.12 u 0.12 u 0.25 u 0.096 j 0.12 uj 0.12 u 0.12 u 0.13 u 0.12 u 0.12 jbc
Hexachlorobenzene 0.24 u 0.24 u 0.12 u 0.25 u 0.25 u 0.25 u 0.12 uj 0.25 u 0.12 u 0.26 u 0.12 u 0.25 ub
Hexachlorobutadiene 0.24 u 0.12 u 0.12 u 0.12 u 0.25 u 0.12 u 0.12 uj 0.12 u 0.12 u 0.13 u 0.12 u 0.12 ub
Hexachlorocyclopentadiene 0.61 uj 0.24 uj 0.12 uj 0.25 uj 0.62 uj 0.25 uj 0.12 uj 0.25 uj 0.12 uj 0.26 uj 0.12 uj 0.25 ujb
Hexachloroethane 0.24 uj 0.12 u 0.12 uj 0.12 u 0.25 uj 0.12 u 0.12 uj 0.12 u 0.12 uj 0.13 u 0.12 uj 0.12 ub
Indeno(1,2,3-cd)pyrene 0.12 u 0.61 u 0.62 u 0.62 u 0.12 u 0.62 u 0.62 uj 0.35 u 0.62 u 0.39 j 0.61 u 0.36 jbc
Isophorone 0.24 u 0.24 u 0.12 u 0.25 u 0.25 u 0.25 u 0.12 uj 0.25 u 0.12 u 0.26 u 0.13 0.069 jbc
Naphthalene 0.12 u 0.12 u 0.12 u 0.045 j 0.083 j 0.063 j 0.016 j 0.024 j 0.12 u 0.025 j 0.12 u 0.078 jb
Nitrobenzene 0.24 u 0.12 u 0.12 u 0.12 u 0.25 u 0.12 u 0.12 uj 0.12 u 0.12 u 0.13 u 0.12 u 0.12 ub
N-Nitrosodimethylamine 0.12 uj 0.24 uj 0.62 uj 0.25 uj 0.12 u 0.25 uj 0.62 uj 0.25 uj 0.62 uj 0.26 uj 0.61 uj 0.25 ujb
N-Nitroso-Di-N-Propylamine 0.24 u 0.61 u 0.12 u 0.62 u 0.25 u 0.62 u 0.12 uj 0.62 u 0.12 u 0.64 u 0.12 u 0.62 ub
N-Nitrosodiphenylamine 0.12 uj 0.24 u 0.12 u 0.0067 nj 0.25 u 0.042 j 0.12 uj 0.25 u 0.12 u 0.26 u 0.12 u 0.25 ub
Pentachlorophenol 0.61 u 0.3 j 0.61 j 0.57 j 0.86 1.9 0.62 uj 0.42 j 0.44 j 0.5 j 1.5 1.2 jb
Phenanthrene 0.24 u 0.12 u 0.12 u 0.038 j 0.25 u 0.18 0.12 uj 0.12 u 0.026 j 0.065 j 0.033 j 0.13 jb
Phenol 0.12 u 0.12 uj 0.039 j 0.058 nj 0.12 uj 0.065 j 0.12 uj 0.12 u 0.15 0.067 j 0.12 u 0.065 njbc
Pyrene 0.24 u 0.12 u 0.12 u 0.096 j 0.25 u 0.18 0.12 uj 0.12 u 0.068 j 0.12 j 0.092 j 0.13 jb
Pyridine 0.12 u 2.4 u 0.62 uj 2.5 u 0.12 u 2.5 u 0.62 uj 2.5 u 0.62 uj 2.6 u 0.61 uj 2.5 ub
Retene 0.24 u 0.12 u 0.12 u 0.12 u 0.25 u 0.12 u 0.12 uj 0.013 j 0.12 u 0.13 u 0.12 u 0.12 ub

Table AF-1. Water Sample Results.Location:Date: 6/24/98 10/12/98 6/24/98 10/12/98 6/24/98 10/12/98 6/24/98 10/12/98 6/24/98 10/12/98 6/24/98 10/12/98Sample No: (98-) 268031 428080 268036 428082 268030 428083/85 268033 428084 268035 428086 268034 428087/88
Lincoln Creek Fever CreekAustin Creek Cable Street Park Place Cemetery Creek
1-Heptacosanol (CAS No. 2004399) 2.3 nj1,3,5-Cycloheptatriene (CAS No. 544252) 0.3 nj2,6,10-Dodecatrien-1-ol, 3,7,11 1.8 nj1,2-Benzenedicarboxaidehyde (CAS No. 643789) 0.16 nj1,2-Benzenedicarboxylic acid, 4-methyl- (CAS No. 4316238) 0.16 nj1,2-Benzisothiazol-3(2H)-one (CAS No. 2634335) 0.1 nj1(3H)-Isobenzofuranone, 5-methyl- (CAS No. 54120648) 0.29 nj 0.11 nj2(3H)-Benzothiazolone (CAS No. 934349) 0.19 nj 0.46 nj 0.23 nj 0.9 nj2,6,6-Trimethyl-2-cyclohexene-1,4-dione (CAS 0.07 nj2H-1-Benzopyran-2-one (CAS No. 91645) 0.25 njbc
3,5-Dichlorobenzonitrile (CAS No. 6575004) 0.35 nj3,6,9,12,15-Pentaoxanonadecan-1-ol (CAS No. 1786943) 2.1 nj 0.5 nj 2.9 njbc
3,7-Dimethyl-1,6-octadien-3-yl propanoate (CAS No. 144398) 0.25 njbc
3-Cyclohexen-1-ol, 4-methyl-1-(1-methyle (CAS No. 20126765) 1.2 nj4-Methylthiazole (CAS No. 693958) 0.38 njbc
7-Acetyl-2-hydroxy-2-methyl-5-isopropylbicyclo[4.3 (CAS No. 96093811) 6.1 nj 0.39 nj(1S,2S,3R,5S)-(+)-Pinanediol (CAS No. 18680278) 0.33 nj 0.7 njb
Acetophenone (CAS No. 98862) 0.43 nj 0.59 njBenzamide, 2,6-dichloro- (CAS NO. 2008584) 0.32 njBenzene, (1-methylbutyl)- (CAS No. 2719520) 0.68 njbc
Benzofuran (CAS No. 271896) 0.14 nj 0.35 nj 0.11 njBenzoic acid, 4-(1-methylethy)- (CAS No. 536663) 0.99 njBenzothiazole (CAS No. 95169) 0.22 nj 0.69 nj 0.46 nj 0.45 nj 1.2 nj 0.55 njb
.beta.-Sitosterol (CAS No. 83465) 4.2 njBicyclo[3.1.1]heptan-2-one, 6,6-dimethyl (CAS 0.18 nj 0.41 njCholest-5-en-3-ol (3.beta.)-, propanoate (CAS N 0.23 njCholestane, 4,5-epoxy-, (4.alph 0.36 njCholesterol (CAS No. 57885) 0.98 nj 1.3 nj 2.2 njbc
Chondrillasterol (CAS No. 481174) 1 njDiazinon (CAS No. 333415) 0.49 njDichlobenil (CAS No. 1194656) 0.28 nj 0.61 njDocosane (CAS No. 629970) 0.18 njEthanol, 2-[2-(2-butoxyethoxy)ethoxy]- (CAS No. 143226) 2.7 njFucosterol (CAS No. 17605673) 2.2 nj.gamma.-Sitosterol (CAS No. 83476) 0.53 nj 2.6 nj 1.2 njHeptadecane (CAS No. 629787) 2.1 njHeptadecane, 9-hexyl- (CAS No. 55124793) 1.4 njHexadecane, 2,6,10,14-tetramethyl- (CAS No. 638368) 6.3 njbc
Hexane, 3,3,4,4-tetramethyl- (CAS No. 5171846) 0.28 njHexanoic acid, 2-propenyl ester (CAS No. 123682) 0.43 njIsopropylbenzene (Cumene) (CAS No. 98828)Longifolenaldehyde (CAS No. 19890847) 0.28 njNonadecane (CAS No. 629925) 0.87 njOctadecane (CAS No. 593453) 3 nj 3.1 njOctadecanoic acid, 2-methylpropyl ester (CAS 0.12 njPentadecane, 2,6,10,14-tetramethyl- (CAS No. 1921706) 0.81 nj 1.1 njbc
Pentanoic acid, 2-methyl-, anhydride (CAS No. 63169619) 0.37 njPhenol, 2,4-bis(1,1-dimethylethyl)- (CAS No. 96 0.14 nj 0.2 nj 0.75 njPhenol, 4-(1-methylethyl)- (CAS No. 99898) 0.25 njbc
Phthalic anhydride (CAS No. 85449) 0.36 nj 0.39 nj 0.42 nj 1.8 nj 0.53 nj 2.7 nj 0.5 njb
Propanoic acid 2-(4-chloro-2-methylphenoxy)-, (.+/ (CAS No. 7085190) 0.41 nj 0.31 njb
Stigmasterol (CAS No. 83487) 0.24 nj 6.2 nj 1.5 njThiazole, 5-methyl- (CAS No. 3581893) 0.12 njThujone (CAS No. 546805) 0.44 njTritetracontane (CAS No. 7098217) 2 nj

Table AF-1. Water Sample Results.Location:Date: 6/24/98 10/12/98 6/24/98 10/12/98 6/24/98 10/12/98 6/24/98 10/12/98 6/24/98 10/12/98 6/24/98 10/12/98Sample No: (98-) 268031 428080 268036 428082 268030 428083/85 268033 428084 268035 428086 268034 428087/88
Lincoln Creek Fever CreekAustin Creek Cable Street Park Place Cemetery Creek
Chlorophenoxy Herbicides (ug/L)2,3,4,5-Tetrachlorophenol 0.022 u 0.043 u 0.022 u 0.043 u 0.022 u 0.043 ub 0.022 u 0.045 u2,3,4,6-Tetrachlorophenol 0.022 u 0.043 u 0.022 u 0.043 u 0.022 u 0.043 ub 0.022 u 0.045 u2,4,5-T 0.032 u 0.062 u 0.033 u 0.062 u 0.032 u 0.062 ub 0.033 u 0.065 u2,4,5-TB 0.036 u 0.070 u 0.037 u 0.070 u 0.036 u 0.070 ub 0.037 u 0.073 u2,4,5-TP (Silvex) 0.032 u 0.062 u 0.033 u 0.062 u 0.032 u 0.062 ub 0.033 u 0.065 u2,4,5-Trichlorophenol 0.024 u 0.047 u 0.024 u 0.047 u 0.024 u 0.047 ub 0.024 u 0.049 u2,4,6-Trichlorophenol 0.024 u 0.047 u 0.024 u 0.047 u 0.024 u 0.047 ub 0.024 u 0.049 u2,4-D 0.040 u 0.029 nj 0.016 nj 0.078 u 0.060 0.12 b 0.13 0.112,4-DB 0.048 u 0.093 u 0.049 u 0.093 u 0.048 u 0.093 ub 0.049 u 0.098 u3,5-Dichlorobenzoic acid 0.040 u 0.078 u 0.041 u 0.078 u 0.040 u 0.078 ub 0.041 u 0.081 u4-Nitrophenol 0.021 j 0.096 nj 0.044 nj 0.14 u 0.067 j 0.18 njb 0.11 0.14 uAcifluorfen (Blazer) 0.16 u 0.31 u 0.16 u 0.31 u 0.16 u 0.31 ub 0.16 u 0.33 uBentazon 0.060 u 0.12 u 0.061 u 0.12 u 0.060 u 0.12 ub 0.061 u 0.12 uBromoxynil 0.040 u 0.078 u 0.041 u 0.078 u 0.040 u 0.078 ub 0.041 u 0.081 uDCPA (Dacthal) 0.032 u 0.062 u 0.033 u 0.062 u 0.032 u 0.062 ub 0.033 u 0.065 uDicamba 0.040 u 0.037 nj 0.041 u 0.078 u 0.040 u 0.078 ub 0.041 u 0.081 uDichlorprop 0.044 u 0.085 u 0.045 u 0.085 u 0.044 u 0.020 njb 0.045 u 0.089 uDiclofop-methyl 0.060 u 0.12 u 0.061 u 0.12 u 0.060 u 0.12 ub 0.061 u 0.12 uDinoseb 0.060 u 0.12 u 0.061 u 0.12 u 0.060 u 0.12 uj 0.061 u 0.12 uIoxynil 0.040 u 0.078 u 0.041 u 0.078 u 0.040 u 0.078 ub 0.041 u 0.081 uMCPA 0.081 u 0.16 u 0.081 u 0.16 u 0.079 u 0.16 ub 0.081 u 0.16 uMCPP (Mecoprop) 0.0065 j 0.056 nj 0.015 nj 0.047 nj 0.11 0.087 jb 0.10 0.19Pentachlorophenol 0.0081 j 0.028 j 0.42 0.33 0.020 u 0.15 b 0.042 nj 0.22Picloram 0.040 uj 0.078 u 0.041 uj 0.078 u 0.040 uj 0.078 ub 0.041 uj 0.081 uTriclopyr 0.034 u 0.065 u 0.034 u 0.065 u 0.033 u 0.038 jb 0.093 j 0.10

Table AF-1. Water Sample Results.Location:Date: 6/24/98 10/12/98 6/24/98 10/12/98 6/24/98 10/12/98 6/24/98 10/12/98 6/24/98 10/12/98 6/24/98 10/12/98Sample No: (98-) 268031 428080 268036 428082 268030 428083/85 268033 428084 268035 428086 268034 428087/88
Lincoln Creek Fever CreekAustin Creek Cable Street Park Place Cemetery Creek
Organophosphorous Pesticides (ug/L)Azinphos-ethyl 0.032 u 0.062 u 0.032 u 0.063 u 0.032 u 0.027 ujb 0.033 u 0.066 uAzinphos-methyl (Guthion) 0.032 u 0.062 u 0.032 u 0.063 u 0.032 u 0.023 ub 0.033 u 0.066 uCarbophenothion 0.020 u 0.039 u 0.020 u 0.039 u 0.020 u 0.027 ujb 0.020 u 0.041 uChlorpyrifos 0.016 u 0.031 u 0.016 u 0.003 nj 0.016 u 0.023 ub 0.016 u 0.033 uChlorpyrifos-methyl 0.016 u 0.031 u 0.016 u 0.031 u 0.016 u 0.023 ujb 0.016 u 0.033 uCoumaphos 0.024 u 0.047 u 0.024 u 0.047 u 0.025 u 0.031 ub 0.025 u 0.049 uDemeton-O 0.014 u 0.027 uj 0.014 u 0.028 uj 0.014 u 0.027 ub 0.014 u 0.029 ujDemeton-S 0.014 uj 0.027 uj 0.014 uj 0.028 uj 0.014 uj 0.031 ub 0.014 uj 0.029 ujDiazinon 0.016 u 0.031 u 0.049 j 0.031 j 0.023 0.031 ub 0.082 0.42Dichlorvos (DDVP) 0.016 u 0.031 u 0.016 u 0.031 u 0.016 u 0.046 ub 0.016 u 0.033 uDimethoate 0.016 u 0.031 uj 0.016 u 0.031 uj 0.016 u 0.027 ub 0.016 u 0.033 ujDioxathion 0.034 u 0.066 u 0.034 u 0.067 u 0.034 u 0.038 ub 0.035 u 0.070 uDisulfoton (Di-Syston) 0.012 u 0.023 uj 0.012 u 0.024 uj 0.012 u 0.038 ub 0.012 u 0.025 ujEPN 0.020 u 0.039 u 0.020 u 0.039 u 0.020 u 0.062 ub 0.020 u 0.041 uEthion 0.014 u 0.027 u 0.014 u 0.028 u 0.014 u 0.031 ub 0.014 u 0.029 uEthoprop 0.016 u 0.031 u 0.016 uj 0.031 u 0.016 uj 0.027 ujb 0.016 uj 0.033 uFenamiphos 0.030 uj 0.058 uj 0.030 uj 0.059 uj 0.030 uj 0.031 ujb 0.031 uj 0.061 ujFenitrothion 0.014 u 0.027 u 0.014 u 0.028 u 0.014 u 0.031 ujb 0.014 u 0.029 uFensulfothion 0.020 u 0.039 uj 0.020 u 0.039 uj 0.020 u 0.027 ub 0.020 u 0.041 ujFenthion 0.014 u 0.027 uj 0.014 u 0.028 uj 0.014 u 0.027 ub 0.014 u 0.029 ujFonophos 0.012 u 0.023 u 0.012 u 0.024 u 0.012 u 0.027 ujb 0.012 u 0.025 uImidan 0.022 u 0.043 u 0.022 u 0.043 u 0.022 u 0.031 ub 0.023 u 0.045 uMalathion 0.016 u 0.031 u 0.016 u 0.038 0.016 u 0.038 ujb 0.016 u 0.033 uMerphos (1 & 2) 0.024 u 0.047 u 0.024 u 0.047 u 0.024 u 0.027 ujb 0.025 u 0.049 uMevinphos 0.020 u 0.039 uj 0.020 u 0.039 uj 0.020 u 0.042 ub 0.020 u 0.041 ujParaoxon-methyl 0.036 u 0.070 uj 0.036 u 0.071 uj 0.036 u 0.062 ub 0.037 u 0.074 ujParathion 0.016 u 0.031 u 0.016 u 0.031 u 0.016 u 0.046 ub 0.016 u 0.033 uParathion-Methyl 0.014 u 0.027 u 0.014 u 0.028 u 0.014 u 0.031 ub 0.014 u 0.029 uPhorate 0.014 u 0.027 uj 0.014 u 0.028 uj 0.014 u 0.038 ujb 0.014 u 0.029 ujPhosphamidan 0.048 uj 0.093 uj 0.048 uj 0.094 uj 0.048 uj 0.065 ub 0.049 uj 0.098 ujPropetamphos 0.040 uj 0.078 u 0.040 uj 0.079 u 0.040 uj 0.077 ub 0.041 uj 0.082 uRonnel 0.014 u 0.027 u 0.014 u 0.028 u 0.014 u 0.069 ujb 0.014 u 0.029 uSulfotepp 0.012 u 0.023 u 0.012 u 0.024 u 0.012 u 0.092 ujb 0.012 u 0.025 uSulprofos (Bolstar) 0.014 u 0.027 uj 0.014 u 0.028 uj 0.014 u 0.077 ub 0.014 u 0.029 ujTemephos (Abate) 0.012 u 0.23 uj 0.012 u 0.24 uj 0.012 u 0.058 ujb 0.012 u 0.25 ujTetrachlorvinphos (Gardona) 0.040 u 0.078 u 0.040 u 0.079 u 0.040 u 0.054 ub 0.041 u 0.082 uTribufos (DEF) 0.028 u 0.054 u 0.028 u 0.055 u 0.029 u 0.23 ujb 0.029 u 0.057 u

Table AF-1. Water Sample Results.Location:Date: 6/24/98 10/12/98 6/24/98 10/12/98 6/24/98 10/12/98 6/24/98 10/12/98 6/24/98 10/12/98 6/24/98 10/12/98Sample No: (98-) 268031 428080 268036 428082 268030 428083/85 268033 428084 268035 428086 268034 428087/88
Lincoln Creek Fever CreekAustin Creek Cable Street Park Place Cemetery Creek
Nitrogen Pesticides (ug/L)2,6-Dichlorobenzamide 0.081 u NAF 0.013 j NAF 0.002 j NAF 0.023 j NAFAlachlor 0.073 u 0.14 u 0.071 u 0.14 u 0.072 u 0.14 ub 0.074 u 0.15 uAmetryn 0.020 u 0.039 u 0.020 u 0.039 u 0.020 u 0.038 ub 0.020 u 0.041 uAtraton 0.030 u 0.058 uj 0.030 u 0.059 uj 0.030 u 0.058 ujb 0.031 u 0.061 ujAtrazine 0.020 u 0.039 u 0.027 j 0.039 u 0.007 j 0.038 ub 0.019 j 0.041 uBenefin 0.030 u 0.058 u 0.030 u 0.059 u 0.030 u 0.058 ub 0.031 uj 0.061 uBromacil 0.081 u 0.16 uj 0.079 u 0.16 uj 0.080 u 0.15 ujb 0.082 u 0.16 ujButachlor 0.12 u 0.23 u 0.12 u 0.24 u 0.12 u 0.23 ub 0.12 u 0.25 uButylate 0.040 u 0.078 u 0.040 u 0.079 u 0.040 u 0.077 ub 0.041 u 0.082 uCarboxin 0.12 u 0.23 uj 0.12 u 0.24 uj 0.12 u 0.23 ujb 0.12 uj 0.25 ujChlorothalonil (Daconil) 0.048 u 0.093 u 0.048 u 0.094 u 0.048 u 0.092 ub 0.049 u 0.098 uChlorpropham 0.081 u 0.16 u 0.079 u 0.16 u 0.08 u 0.15 ub 0.082 u 0.16 uCyanazine 0.030 u 0.058 u 0.030 u 0.059 u 0.030 u 0.058 ub 0.031 u 0.061 uCycloate 0.040 u 0.078 u 0.040 u 0.079 u 0.040 u 0.077 ub 0.041 u 0.082 uDiallate (Avadex) 0.14 u 0.27 u 0.14 u 0.28 u 0.14 u 0.27 ub 0.14 u 0.29 uDichlobenil 0.040 u 0.078 u 0.063 j 0.079 u 0.029 j 0.029 jb 0.041 u 0.082 uDiphenamid 0.060 u 0.12 u 0.060 u 0.12 u 0.060 u 0.12 ub 0.061 u 0.12 uDiuron 0.12 u 0.23 u 0.12 u 0.24 u 0.12 u 0.23 ub 0.12 u 0.25 uEptam 0.040 u 0.078 u 0.040 u 0.079 u 0.040 u 0.077 ub 0.041 u 0.082 uEthalfluralin (Sonalan) 0.030 u 0.058 u 0.030 u 0.059 u 0.030 u 0.058 ub 0.031 u 0.061 uFenarimol 0.060 u 0.12 u 0.060 u 0.12 u 0.060 u 0.12 ub 0.061 u 0.12 uFluridone 0.12 uj NAF 0.12 uj NAF 0.12 uj NAF REJ NAFHexazinone 0.030 uj 0.058 uj 0.030 uj 0.059 uj 0.030 uj 0.058 ujb 0.031 uj 0.061 ujMetalaxyl 0.12 u 0.23 uj 0.12 u 0.24 uj 0.12 u 0.23 ujb 0.12 u 0.25 ujMetolachlor 0.081 u 0.16 u 0.079 u 0.16 u 0.080 u 0.15 ub 0.082 u 0.16 uMetribuzin 0.020 u 0.039 u 0.020 u 0.039 u 0.020 u 0.038 ub 0.020 u 0.041 uMGK-264 0.16 u 0.31 u 0.16 u 0.31 u 0.16 u 0.31 ub 0.16 u 0.33 uMolinate 0.040 u 0.078 u 0.040 u 0.079 u 0.040 u 0.077 ub 0.041 u 0.082 uNapropamide 0.060 u 0.12 u 0.060 u 0.12 u 0.060 u 0.12 ub 0.061 u 0.12 uNorflurazon 0.040 uj 0.078 uj 0.040 uj 0.079 uj 0.040 uj 0.077 ujb 0.041 uj 0.082 ujOxadiazon 0.081 u NAF 0.079 u NAF 0.016 j 0.058 jb 0.082 u NAFOxyfluorfen 0.081 u 0.16 u 0.079 u 0.16 u 0.080 u 0.15 ub 0.082 u 0.16 uPebulate 0.040 u 0.078 u 0.040 u 0.079 u 0.040 u 0.077 ub 0.041 u 0.082 uPendimethalin 0.030 u 0.058 u 0.030 u 0.059 u 0.030 u 0.058 ub 0.031 u 0.061 uProfluralin 0.048 u 0.093 u 0.048 u 0.094 u 0.048 u 0.092 ub 0.049 u 0.098 uPrometon (Pramitol 5p) 0.020 u 0.039 uj 0.020 u 0.039 uj 0.020 u 0.038 ujb 0.020 u 0.041 ujPrometryn 0.020 uj 0.039 uj 0.020 uj 0.039 uj 0.020 uj 0.038 ujb 0.020 uj 0.041 ujPronamide (Kerb) 0.081 u 0.16 u 0.079 u 0.16 u 0.080 u 0.15 ub 0.082 u 0.16 uPropachlor (Ramrod) 0.048 u 0.093 u 0.048 u 0.094 u 0.048 u 0.092 ub 0.049 u 0.098 uPropazine 0.020 u 0.039 u 0.020 u 0.039 u 0.020 u 0.038 ub 0.020 u 0.041 uSimazine 0.020 u 0.039 u 0.020 u 0.039 u 0.020 u 0.038 ub 0.020 u 0.033 njTebuthiuron 0.030 uj 0.058 uj 0.030 uj 0.059 uj 0.030 uj 0.058 ub 0.031 uj 0.061 ujTerbacil 0.060 u 0.12 u 0.060 u 0.12 u 0.060 u 0.12 ub 0.061 u 0.12 uTerbutryn Igran) 0.020 u 0.039 u 0.020 u 0.039 u 0.020 u 0.038 ub 0.020 u 0.041 uTriadimefon 0.052 u 0.10 u 0.052 u 0.10 u 0.052 u 0.10 ub 0.053 u 0.11 uTriallate 0.060 u 0.12 uj 0.060 u 0.12 uj 0.060 u 0.12 ujb 0.061 u 0.12 ujTrifluralin (Treflan) 0.030 u 0.058 u 0.030 u 0.059 u 0.030 u 0.058 ub 0.031 uj 0.061 uVernolate 0.040 u 0.078 u 0.040 u 0.079 u 0.040 u 0.077 ub 0.041 u 0.082 u

Table AF-1. Water Sample Results.Location:Date: 6/24/98 10/12/98 6/24/98 10/12/98 6/24/98 10/12/98 6/24/98 10/12/98 6/24/98 10/12/98 6/24/98 10/12/98Sample No: (98-) 268031 428080 268036 428082 268030 428083/85 268033 428084 268035 428086 268034 428087/88
Lincoln Creek Fever CreekAustin Creek Cable Street Park Place Cemetery Creek
detected values in boldtentatively identified compounds in italicsa=mean of laboratory duplicatesb=mean of field replicatesc=detected value in one replicate onlyu=not detected at or above reported valuej=estimated value, analyte positively identifieduj=not detected at or above reported estimated valuenj=estimated value, evidence that the analyte is presentREJ=rejected, data are unusable for all purposesnr=not reportedNAF=Not Analyzed For

Appendix G
Sediment Sample Results

Table AG-1. Sediment Sample Results.Location: Austin Cr. LW#3 Cable St. DW Intake Park Place LW#1 Cemetery Cr. Lincoln Cr. Fever Cr.Date: 9/30/98 9/30/98 11/30/98 9/30/98 9/29/98 9/30/98 11/30/98 9/29/98 1/11/99Sample No: (98-) 428108 428107 (99-)036092 428106 428109 428105 (99-)036091 428111/12 (99-)036090
ConventionalsPhosphorus (mg/kg, dw) 314 940 524 778 1930 856 301 405 b 1150Total Kjeldahl Nitrogen (mg/kg, dw) 1510 1730 1330 a 2820 6150 5260 a NAF NAF NAFTOC104 (%) 1.84 2.53 3.50 3.88 7.22 10.6 0.95 3.8 a,b 7.24 a
TOC70 (%) 2.69 2.57 3.54 3.82 8.59 10.6 0.94 4.2 a,b 7.24 a
GRAIN SIZE (%)Gravel (>2,000 um) 0.6 0 a 15.0 a 0 0 0.3 0.1 4.1 b 3.3
Sand (>62.5 um) 80.6 14.2 a 72.8 a 47.3 40.2 25.2 86.3 73.5 b 26.7Silt (>4 um) 18.2 60.9 a 11.4 a 46.1 51.7 50.7 10.9 18.7 b 55.1
Clay (<4 um) 0.6 24.9 a 1.0 a 6.6 8.1 23.7 2.7 3.9 b 14.9
Metals (mg/kg,dw)Arsenic 2.7 15.1 4.03 6.14 1.8 9.89 4.39 3.0 b 6.25Mercury 0.036 0.199 a 0.062 0.189 0.251 0.458 0.043 0.1 b 0.209Lead 3 u 3 u 33.7 j 51.8 32.2 77.7 6.31 j 25.2 b 90.3 jNickel 32.3 79.7 44.1 56.6 113 65 19.0 31.7 b 38.6Silver 0.4 uj 0.4 uj 0.3 u 1.3 j 0.4 uj 0.4 uj 0.3 u 0.4 ujb 0.61Antimony 4 uj 4 uj 3.7 j 4 uj 4 uj 4 uj 3.0 j 4.0 ujb 3 ujBeryllium 0.35 0.91 0.20 0.56 0.68 0.61 0.24 0.3 b 0.41Cadmium 0.5 u 0.5 u 0.4 u 0.5 uj 1.1 0.73 0.4 u 0.5 ub 1.7Chromium 33.6 77.5 80.7 55.5 95.7 64.8 30.3 47.5 b 52.1Copper 12 45 31.6 36.4 96 53.8 10.8 25.4 b 72.1Zinc 53 97.5 117 126 530 145 44.5 150 b 599Selenium 0.3 u 0.3 u 0.3 u 0.57 0.38 1 0.3 u 0.3 ub 0.46Thallium 0.3 uj 0.3 j 0.5 u 0.3 uj 0.3 uj 0.3 uj 0.5 u 0.3 ujb 0.5 u
Total Petroleum Hydrocarbons (mg/kg,dw)Lube Oil 210 u 480 u 1100 290 u 2050 ja 380 u 330 u 455 jb 3700#2 Diesel 110 u 240 u 210 u 150 u 340 ua 190 u 170 u 71 u 300 u

Table AG-1. Sediment Sample Results.Location: Austin Cr. LW#3 Cable St. DW Intake Park Place LW#1 Cemetery Cr. Lincoln Cr. Fever Cr.Date: 9/30/98 9/30/98 11/30/98 9/30/98 9/29/98 9/30/98 11/30/98 9/29/98 1/11/99Sample No: (98-) 428108 428107 (99-)036092 428106 428109 428105 (99-)036091 428111/12 (99-)036090
Semivolatile Organics (ug/kg, dw)1,2,4-Trichlorobenzene 25 u 37 u 126 u 47 u 268 u 284 u 19 u 22 ub 174 u1,2-Dichlorobenzene 25 u 37 u 126 u 47 u 268 u 284 u 19 u 22 ub 174 u1,3-Dichlorobenzene 25 uj 37 uj 126 u 47 uj 268 uj 284 uj 19 u 22 ujb 174 u1,4-Dichlorobenzene 25 u 37 u 126 u 47 u 268 u 284 u 19 u 22 ub 174 u1-Methylnaphthalene 3.7 j 5.8 j 126 u 8.2 j 8.1 j 69 j 0.88 j 23 jb 22 j2,2'-Oxybis[1-chloropropane] 25 u 37 u 126 u 47 u 268 u 284 u 19 u 22 ub 174 u2,4,5-Trichlorophenol 25 u 37 u 126 u 47 u 268 u 284 u 19 u 22 ub 174 u2,4,6-Trichlorophenol 25 u 37 u 126 u 47 u 268 u 284 u 19 u 22 ub 174 u2,4-Dichlorophenol 25 u 37 u 126 u 47 u 268 u 284 u 19 u 22 ub 174 u2,4-Dimethylphenol 25 u 37 u 126 u 47 u 268 u 284 u 19 u 22 ub 174 u2,4-Dinitrophenol 245 uj 373 uj 2520 u 472 uj 2680 u 2840 uj 375 u 223 ujb 3490 u2,4-Dinitrotoluene 25 uj 37 u 126 u 47 uj 268 uj 284 uj 19 u 22 ujb 174 u2,6-Dinitrotoluene 49 uj 75 uj 126 u 94 uj 536 uj 568 uj 19 u 45 ujb 174 u2-Chloronaphthalene 25 u 37 u 126 u 47 u 268 u 284 u 19 u 22 ub 174 u2-Chlorophenol 49 u 75 u 126 u 94 u 536 u 568 u 19 u 45 ub 174 u2-Methylnaphthalene 5.8 j 16 j 50 j 28 j 48 j 214 j 2.9 j 54 b 106 j2-Methylphenol 25 u 37 u 126 u 47 u 27 j 284 u 19 u 16 jb 174 u2-Nitroaniline 122 u 186 u 126 u 236 u 1340 u 1420 u 19 uj 112 ub 174 u2-Nitrophenol REJ REJ 126 u REJ REJ REJ 19 u REJ 174 u3,3'-Dichlorobenzidine 245 u 373 u 252 u 472 u 2680 u 2840 u 38 u 224 ub 349 u3B-Coprostanol 245 uj 867 uj 252 u 472 uj 20500 4220 uj 135 uj 588 jbc 349 u3-Nitroaniline 122 uj 186 uj 126 u 236 uj 1340 uj 1420 uj 19 uj 112 ujb 174 u4,6-Dinitro-2-Methylphenol REJ REJ 1260 u REJ REJ REJ 188 u REJ 1740 u4-Bromophenyl-Phenylether 49 u 75 u 126 u 94 u 536 u 568 u 19 u 45 ub 174 u4-Chloro-3-Methylphenol 25 u 37 u 126 u 47 u 268 u 284 u 19 u 22 ub 174 u4-Chloroaniline REJ REJ 126 u REJ 82 j REJ 19 uj 22 u 174 u4-Chlorophenyl-Phenylether 25 u 37 u 126 u 47 u 268 u 284 u 19 u 22 ub 174 u4-Methylphenol 45 23 j 1230 14 j 106 j 737 264 71 b 24504-Nitroaniline 49 uj 75 uj 126 u 94 uj 536 uj 568 uj 19 uj 45 ujb 174 u4-Nitrophenol 49 u 75 u 126 u 94 u 536 u 568 u 19 u 45 ub 174 uAcenaphthene 25 u 37 u 126 u 47 u 268 u 154 j 19 u 69 b 32 jAcenaphthylene 25 u 2.9 j 126 u 21 j 11 j 1020 19 u 17 jb 24 jAniline REJ REJ 126 u REJ REJ REJ 19 uj REJ 174 uAnthracene 25 u 37 u 126 u 23 j 39 j 248 j 19 u 116 b 81 jBenzidine 245 uj 373 uj 252 u 472 uj 2680 uj 2840 uj 38 u 223 ujb 349 uBenzo(a)anthracene 25 u 37 u 126 u 57 194 j 204 j 19 u 388 b 294Benzo(a)pyrene 14 nj 11 nj 103 j 63 333 257 j 19 u 625 b 428Benzo(b)fluoranthene 49 u 35 j 126 u 199 537 448 j 18 j 751 b 639Benzo(ghi)perylene 49 u 29 j 126 u 149 331 j 410 j 10 j 382 b 436Benzo(k)fluoranthene 25 u 9.2 nj 126 u 48 152 j 103 j 19 u 279 b 214Benzoic Acid 2990 uj 4480 uj 3090 j 5780 uj 32700 uj 34800 uj 567 j 2740 ub 2330 uj

Table AG-1. Sediment Sample Results.Location: Austin Cr. LW#3 Cable St. DW Intake Park Place LW#1 Cemetery Cr. Lincoln Cr. Fever Cr.Date: 9/30/98 9/30/98 11/30/98 9/30/98 9/29/98 9/30/98 11/30/98 9/29/98 1/11/99Sample No: (98-) 428108 428107 (99-)036092 428106 428109 428105 (99-)036091 428111/12 (99-)036090Benzyl Alcohol 25 u 37 u 68 j 47 u 123 j 284 u 34 22 ub 331Bis(2-Chloroethoxy)Methane 49 u 75 u 126 u 94 u 536 u 568 u 19 u 45 ub 174 uBis(2-Chloroethyl)Ether 49 u 75 u 126 u 94 u 536 u 568 u 19 u 45 ub 174 uBis(2-Ethylhexyl) Phthalate 62 u 99 u 2160 202 13000 568 u 69 1101 b 8060Butylbenzylphthalate 25 u 37 u 126 u 47 u 188 j 284 u 19 u 58 b 451Caffeine 49 u 75 u 126 u 94 u 536 u 568 u 19 u 23 jb 174 uCarbazole 122 u 186 u 126 u 236 u 1340 u 1420 u 8.2 j 119 jb 40 jChrysene 25 u 25 j 165 144 452 329 6.4 j 699 b 560Dibenzo(a,h)anthracene 122 u 186 u 126 u 236 u 553 j 1420 u 19 u 108 jb 409Dibenzofuran 25 u 37 u 126 u 69 268 u 339 2.8 j 49 b 42 jDiethylphthalate 25 u 186 u 52 j 83 u 268 u 1420 u 30 24 ub 174 uDimethylphthalate 25 u 37 u 126 u 47 u 268 u 284 u 19 u 153 bc 174 uDi-N-Butylphthalate 25 u 244 403 12800 e 286 u 1820 408 172 ub 298Di-N-Octyl Phthalate 122 u 186 u 126 u 236 u 1340 u 1420 u 19 u 112 ub 588Fluoranthene 4.2 j 26 112 j 400 608 1840 14 j 1465 b 775Fluorene 25 u 4.9 j 126 u 13 j 38 j 205 j 19 u 70 b 44 jHexachlorobenzene 49 u 75 u 126 u 94 u 536 u 568 u 19 u 45 ub 174 uHexachlorobutadiene 25 u 37 u 126 u 47 u 268 u 284 u 19 u 22 ub 174 uHexachlorocyclopentadiene REJ REJ 126 u REJ REJ REJ REJ REJ 174 uHexachloroethane REJ REJ 126 u REJ REJ REJ 19 uj REJ 174 ujIndeno(1,2,3-cd)pyrene 96 nj 118 j 126 u 232 j 1340 u 1000 j 19 u 405 b 644Isophorone 49 u 358 126 u 94 u 536 u 568 u 19 u 45 ub 174 uNaphthalene 5 j 15 j 37 j 275 53 j 4330 19 u 56 b 128 jNitrobenzene 25 uj 37 uj 126 u 47 uj 268 uj 284 uj 19 u 22 ujb 174 uN-Nitrosodimethylamine 49 u 75 u 252 u 94 u 536 u 568 u 38 u 45 ub 349 uN-Nitroso-Di-N-Propylamine 122 u 186 u 126 u 236 u 1340 u 1420 u 19 u 112 ub 174 uN-Nitrosodiphenylamine 49 u 75 u 126 u 94 u 536 u 568 u 19 u 45 ub 174 uPentachlorophenol 122 u 186 u 1380 236 u 1340 u 1420 u 86 uj 112 ub 1590Phenanthrene 25 u 24 j 120 j 332 266 j 1930 11 j 1100 b 446Phenol 25 u 37 u 1190 47 u 268 u 284 u 52 j 22 ub 249 ujPyrene 4.7 nj 22 j 148 265 534 2100 15 j 1265 b 973Pyridine 49 u 75 u REJ 94 u 536 u 568 u REJ 45 ub REJRetene 80 160 126 u 137 138 j 1600 14 j 276 b 105 j

Table AG-1. Sediment Sample Results.Location: Austin Cr. LW#3 Cable St. DW Intake Park Place LW#1 Cemetery Cr. Lincoln Cr. Fever Cr.Date: 9/30/98 9/30/98 11/30/98 9/30/98 9/29/98 9/30/98 11/30/98 9/29/98 1/11/99Sample No: (98-) 428108 428107 (99-)036092 428106 428109 428105 (99-)036091 428111/12 (99-)036090
(Z)14-Tricosenyl formate (CAS No. 77899106) 547 nj 3230 nj.gamma.-Sitosterol (CAS No. 83476) 1650 nj 17100 nj 892 nj 7610 nj11-Hexadecenoic acid, methyl ester (CAS No. 55000425) 1680 nj16-Octadecenal (CAS No. 56554871) 961 nj 7550 nj17-Octadecenal (CAS No. 56554860) 191 nj 454 nj1-Docosanol, acetate (CAS No. 822264) 5880 nj1-Docosene (CAS No. 1599673) 6280 nj1-Heneicosyl formate (CAS No. 77899037) 548 nj1-Nonadecene (CAS No. 18435455) 1670 nj1-Pentadecanol (CAS No. 629765) 183 njc
1-Tetradecanol (CAS No. 112721) 1590 nj2-Headecene, 3,7,11,15-tetramethyl-, [R-[R@,R@-(E) (CAS No. 14237731) 1780 nj2-Pentanone, 4-hydroxy-4-methyl (CAS No. 123422) 87900 nj2-Phenanthrenol, 4b,5,6,7,8,8a,9,10-octahydro-4b,8, (CAS No. 511159) 4960 nj3-Eicosyne (CAS No. 61886666) 4950 nj3-Penten-2-one, (E)- (CAS No. 3102338) 646 nj3-Penten-2-one, 4-methyl- (CAS No. 141797) 1500 nj9-Hexadecenoic acid (CAS No. 2091294) 9540 njAnthracene, 1,4-dimethoxy- (CAS No. 13076294) 4900 njBenaldehyde, 4-hydroxy- (CAS No. 123080) 341 njBenzaldehyde, 2,4-dihydroxy-6-methyl (CAS No. 487694) 2280 njBenzeneacetic acid (CAS No. 103822) 533 nj 1210 njBenzofuran, 2,3-dihydro- (CAS No. 496162) 2790 nj 5080 nj 218 njc
Benzoic acid, 2,4-dihydroxy-3,6-dimethyl-, methyl e (CAS No. 4707475)Bicyclo[3.1.0]hexan-3-one, 4-methyl-1-(1-methylethyl)- (CAS No. 471158) 1700 njCholestanol (CAS No. 80977) 1060 njCholesterol (CAS No. 57885) 1750 njCyclohexadecane (CAS No. 295658) 277 njCyclohexanol, 2-methyl-5-(1-methylethyl)-, (1.alpha (CAS No. 1126405) 1220 njCyclopentadecanone, 2-hydroxy- (CAS No. 4727188) 16100 njCyclopropane, (R,R)-1-((Z)-hex-1'-enyl)-2-ethenyl (CAS No. 77210403) 333 njCyclopropane, nonyl- (CAS No. 74663857) 177 njc
Cyclotetracosane (CAS No. 297030) 852 njDocosane (CAS No. 629970) 3280 njDocosanoic acid (CAS No. 112856) 224 nj 322 nj 195 nj 1740 njDodecanoic acid (CAS No. 143077) 1310 njErgost-5-en-3-ol, (3.beta.)- (CAS No. 4 297 njHeneicosane (CAS No. 629947) 617 njHeptadecane (CAS No. 629787) 1860 nj 185 njHexadecanal (CAS No. 629801) 4710 njHexadecanoic acid (CAS No. 57103) 4490 nj 4780 njHexadecanoic acid, methyl ester (CAS 1290 nj

Table AG-1. Sediment Sample Results.Location: Austin Cr. LW#3 Cable St. DW Intake Park Place LW#1 Cemetery Cr. Lincoln Cr. Fever Cr.Date: 9/30/98 9/30/98 11/30/98 9/30/98 9/29/98 9/30/98 11/30/98 9/29/98 1/11/99Sample No: (98-) 428108 428107 (99-)036092 428106 428109 428105 (99-)036091 428111/12 (99-)036090Isophytol (CAS no. 505328) 279 njNaphthalene, 1,6-dimethyl-4-(1-methylethyl)- (CAS No. 483783) 179 njc
Octadecanoic acid (CAS No. 57114) 2540 nj 1110 njOctanoic acid (CAS No. 124072) 197 njc
Oleic acid (CAS No. 112801) 218 njPentadecanoic acid (CAS No. 1002842 1310 njPhenol, 4-(3-hydroxy-1-propenyl)-2-methoxy- (CAS No. 458355 1730 njPhytol (CAS No. 150867) 3240 nj 1550 nj 8310 nj 5350 nj 7380 nj 8060 nj 730 njc 2650 njp-Isopropyltoluene (CAS No. 99876) 2290 njTetracosane (CAS No. 646311) 11000 njTetradecanoic acid (CAS No. 544638) 2820 nj 881 nj 1180 nj 3490 nj 1730 nj 1060 njc
Tetradecanoic acid, 12-methyl-, (S)- (C 1270 nj 5250 nj 2140 njThujone (CAS No. 546805) 19600 nj 2930 njToluene (CAS No. 108883) 243 njc
Tridecane (CAS No. 629505) 3250 njVanillin (CAS No. 121335) 157 njc

Table AG-1. Sediment Sample Results.Location: Austin Cr. LW#3 Cable St. DW Intake Park Place LW#1 Cemetery Cr. Lincoln Cr. Fever Cr.Date: 9/30/98 9/30/98 11/30/98 9/30/98 9/29/98 9/30/98 11/30/98 9/29/98 1/11/99Sample No: (98-) 428108 428107 (99-)036092 428106 428109 428105 (99-)036091 428111/12 (99-)036090
Chlorophenoxy Herbicides (ug/kg, dw)2,3,4,5-Tetrachlorophenol 26 u NAF NAF NAF 55 u NAF NAF NAF NAF2,3,4,6-Tetrachlorophenol 26 u NAF NAF NAF 55 u NAF NAF NAF NAF2,4,5-T 38 u NAF NAF NAF 79 u NAF NAF NAF NAF2,4,5-TB 43 u NAF NAF NAF 90 u NAF NAF NAF NAF2,4,5-TP (Silvex) 38 u NAF NAF NAF 79 u NAF NAF NAF NAF2,4,5-Trichlorophenol 29 u NAF NAF NAF 60 u NAF NAF NAF NAF2,4,6-Trichlorophenol 29 u NAF NAF NAF 60 u NAF NAF NAF NAF2,4-D 47 u NAF NAF NAF 99 u NAF NAF NAF NAF2,4-DB 57 u NAF NAF NAF 120 u NAF NAF NAF NAF3,5-Dichlorobenzoic Acid 47 u NAF NAF NAF 99 u NAF NAF NAF NAF4-Nitrophenol 83 u NAF NAF NAF 170 u NAF NAF NAF NAFBentazon 71 u NAF NAF NAF 150 u NAF NAF NAF NAFDacthal (DCPA) 38 u NAF NAF NAF 79 u NAF NAF NAF NAFDicamba I 47 u NAF NAF NAF 99 u NAF NAF NAF NAFDichlorprop 52 u NAF NAF NAF 110 u NAF NAF NAF NAFDiclofop-Methyl 71 u NAF NAF NAF 150 u NAF NAF NAF NAFDinoseb 71 uj NAF NAF NAF 150 uj NAF NAF NAF NAFMCPA 95 u NAF NAF NAF 200 u NAF NAF NAF NAFMCPP (Mecoprop) 95 u NAF NAF NAF 200 u NAF NAF NAF NAFPentachlorophenol 24 u NAF NAF NAF 50 u NAF NAF NAF NAFTriclopyr 40 u NAF NAF NAF 84 u NAF NAF NAF NAF

Table AG-1. Sediment Sample Results.Location: Austin Cr. LW#3 Cable St. DW Intake Park Place LW#1 Cemetery Cr. Lincoln Cr. Fever Cr.Date: 9/30/98 9/30/98 11/30/98 9/30/98 9/29/98 9/30/98 11/30/98 9/29/98 1/11/99Sample No: (98-) 428108 428107 (99-)036092 428106 428109 428105 (99-)036091 428111/12 (99-)036090
Organophosphorous Pesticides (ug/kg, dw)Azinphos-ethyl 180 u NAF NAF NAF 390 u NAF NAF NAF NAFAzinphos-methyl (Guthion) 180 u NAF NAF NAF 390 u NAF NAF NAF NAFCarbophenothion 110 uj NAF NAF NAF 250 uj NAF NAF NAF NAFChlorpyrifos 88 u NAF NAF NAF 200 u NAF NAF NAF NAFChlorpyrifos-methyl 88 u NAF NAF NAF 200 u NAF NAF NAF NAFCoumaphos 130 u NAF NAF NAF 290 u NAF NAF NAF NAFDiazinon 88 u NAF NAF NAF 200 u NAF NAF NAF NAFDichlorvos (DDVP) 88 u NAF NAF NAF 200 u NAF NAF NAF NAFDioxathion 190 u NAF NAF NAF 420 u NAF NAF NAF NAFEPN 110 u NAF NAF NAF 250 u NAF NAF NAF NAFEthion 77 u NAF NAF NAF 170 u NAF NAF NAF NAFEthoprop 88 u NAF NAF NAF 200 u NAF NAF NAF NAFFenitrothion 77 u NAF NAF NAF 170 u NAF NAF NAF NAFFonophos 66 u NAF NAF NAF 150 u NAF NAF NAF NAFImidan 120 u NAF NAF NAF 270 u NAF NAF NAF NAFMalathion 88 u NAF NAF NAF 200 u NAF NAF NAF NAFMerphos (1 & 2) 130 u NAF NAF NAF 290 u NAF NAF NAF NAFParathion 88 u NAF NAF NAF 200 u NAF NAF NAF NAFParathion-Methyl 77 u NAF NAF NAF 170 u NAF NAF NAF NAFPropetamphos 220 u NAF NAF NAF 490 u NAF NAF NAF NAFRonnel 77 u NAF NAF NAF 170 u NAF NAF NAF NAFSulfotepp 66 u NAF NAF NAF 150 u NAF NAF NAF NAFTetrachlorvinphos (Gardona) 220 u NAF NAF NAF 490 u NAF NAF NAF NAFTribufos (DEF) 150 u NAF NAF NAF 340 u NAF NAF NAF NAF

Table AG-1. Sediment Sample Results.Location: Austin Cr. LW#3 Cable St. DW Intake Park Place LW#1 Cemetery Cr. Lincoln Cr. Fever Cr.Date: 9/30/98 9/30/98 11/30/98 9/30/98 9/29/98 9/30/98 11/30/98 9/29/98 1/11/99Sample No: (98-) 428108 428107 (99-)036092 428106 428109 428105 (99-)036091 428111/12 (99-)036090
Nitrogen Pesticides (ug/kg, dw)Dichlobenil 220 u NAF NAF NAF 490 u NAF NAF NAF NAFPropachlor (Ramrod) 270 u NAF NAF NAF 590 u NAF NAF NAF NAFEthalfluralin (Sonalan) 170 u NAF NAF NAF 370 u NAF NAF NAF NAFTrifluralin (Treflan) 170 u NAF NAF NAF 370 u NAF NAF NAF NAFSimazine 110 u NAF NAF NAF 250 u NAF NAF NAF NAFAtrazine 110 u NAF NAF NAF 250 u NAF NAF NAF NAFPronamide (Kerb) 440 u NAF NAF NAF 980 u NAF NAF NAF NAFTerbacil 330 u NAF NAF NAF 740 u NAF NAF NAF NAFMetribuzin 110 u NAF NAF NAF 250 u NAF NAF NAF NAFAlachlor 400 u NAF NAF NAF 880 u NAF NAF NAF NAFPrometryn 110 uj NAF NAF NAF 250 uj NAF NAF NAF NAFBromacil 440 uj NAF NAF NAF 980 uj NAF NAF NAF NAFMetolachlor 440 u NAF NAF NAF 980 u NAF NAF NAF NAFDiphenamid 330 u NAF NAF NAF 740 u NAF NAF NAF NAFPendimethalin 170 u NAF NAF NAF 370 u NAF NAF NAF NAFNapropamide 330 u NAF NAF NAF 740 u NAF NAF NAF NAFOxyfluorfen 440 u NAF NAF NAF 980 u NAF NAF NAF NAFEptam 220 u NAF NAF NAF 490 u NAF NAF NAF NAFButylate 220 u NAF NAF NAF 490 u NAF NAF NAF NAFVernolate 220 u NAF NAF NAF 490 u NAF NAF NAF NAFCycloate 220 u NAF NAF NAF 490 u NAF NAF NAF NAFBenefin 170 u NAF NAF NAF 370 u NAF NAF NAF NAFPropazine 110 u NAF NAF NAF 250 u NAF NAF NAF NAFAmetryn 110 u NAF NAF NAF 250 u NAF NAF NAF NAFTerbutryn (Igran) 110 u NAF NAF NAF 250 u NAF NAF NAF NAFPebulate 220 u NAF NAF NAF 490 u NAF NAF NAF NAFMolinate 220 u NAF NAF NAF 490 u NAF NAF NAF NAFChlorpropham 440 u NAF NAF NAF 980 u NAF NAF NAF NAFTriadimefon 290 u NAF NAF NAF 640 u NAF NAF NAF NAFMGK-264 880 u NAF NAF NAF 2000 u NAF NAF NAF NAFButachlor 660 u NAF NAF NAF 1500 u NAF NAF NAF NAFFenarimol 330 u NAF NAF NAF 740 u NAF NAF NAF NAFDiuron 660 u NAF NAF NAF 1500 u NAF NAF NAF NAFDiallate (Avadex) 770 u NAF NAF NAF 1700 u NAF NAF NAF NAFProfluralin 270 u NAF NAF NAF 590 u NAF NAF NAF NAFCyanazine 170 u NAF NAF NAF 370 u NAF NAF NAF NAF

Table AG-1. Sediment Sample Results.Location: Austin Cr. LW#3 Cable St. DW Intake Park Place LW#1 Cemetery Cr. Lincoln Cr. Fever Cr.Date: 9/30/98 9/30/98 11/30/98 9/30/98 9/29/98 9/30/98 11/30/98 9/29/98 1/11/99Sample No: (98-) 428108 428107 (99-)036092 428106 428109 428105 (99-)036091 428111/12 (99-)036090
detected values in boldtentatively identified compounds in italicsa=mean of laboratory duplicatesb=mean of field replicatesu=not detected at or above reported valuej=estimated value, analyte positively identifieduj=not detected at or above reported estimated valuenj=estimated value, evidence that the analyte is presente=exceeds calibration range, value is an estimateREJ=rejected, data are unusable for all purposesNAF=not analyzed for

Appendix H
Fish Tissue Sample Results

Table AH-1. Fish Tissue Sample Results.Species: Kokanee (fem.) Kokanee (male) Kokanee Smallmouth bass Smallmouth bass Longnose sucker Sculpin CrayfishTissue Type: fillet fillet liver fillet fillet whole body whole body tail muscleLocation: Lk. Whatcom Lk. Whatcom Lk. Whatcom Lk. Whatcom Lk. Whatcom Lk. Whatcom Whatcom Cr. Whatcom Cr.Sample No: (98-) 458130 458131 458131 458133 458134 458135/38 458136 458137
Biological Data (mean +/- SD)Total length (mm) 235 +/- 9 228 +/- 17 233 +/- 14 246 +/- 32 393 +/- 6 228 +/- 37 122+/- 13 nrWeight (g) 125 +/- 16 110 +/- 22 117 +/- 20 233 +/- 93 925 +/- 120 154 +/- 11 29 +/- 9 27 +/- 15Lipid content 4.7% 4.0% 7.1% 1.1% 1.8% 4.9% b 5.5% <0.1%
Metals (mg/kg,ww)Cadmium 1 u 1 u 1 u 1 u 1 u 1 uab 1 u 1 uChromium 1 u 1 u 1 u 1 u 1 u 1 uab 4.9 1 uCopper 3.6 3.3 68.2 3 u 3 u 3 uab 3 u 19Lead 6 u 6 u 6 u 6 u 6 u 6 uab 6 u 6 uNickel 3 u 3 u 3 u 3 u 3 u 3 uab 3 u 3 uZinc 15.5 15.8 55.7 8.9 11.5 18.2 ab 19.4 21.5Mercury 0.121 a 0.0987 0.129 0.145 0.504 0.0656 b 0.376 0.15
Chlorinated Pesticides/PCBs (ug/kg, ww)Alpha-BHC 0.32 j 0.31 0.34 0.25 u 0.23 u 0.24 jb 0.19 j 0.25 uBeta-BHC 0.25 u 0.24 u 0.24 u 0.25 u 0.23 u 0.24 ub 0.24 u 0.25 uGamma-BHC (Lindane) 0.12 nj 0.15 j 0.17 j 0.25 u 0.23 u 0.12 jb 0.11 j 0.25 uDelta-BHC 0.25 u 0.24 u 0.24 u 0.25 u 0.23 u 0.24 ub 0.24 u 0.25 uHeptachlor 0.25 u 0.24 u 0.24 u 0.25 u 0.23 u 0.24 ub 0.24 u 0.25 uAldrin 0.25 u 0.24 u 0.24 u 0.25 u 0.23 u 0.24 ub 0.24 u 0.25 uHeptachlor Epoxide 0.25 u 0.24 u 0.24 u 0.25 u 0.23 u 0.24 ub 0.24 u 0.25 uEndosulfan I 0.50 uj 0.48 uj 0.49 uj 0.50 uj 0.46 uj 0.48 ujb 0.49 uj 0.49 uj4,4'-DDE 3.9 2.5 2.6 1.3 3.0 3.8 b 4.9 0.25 uDieldrin 0.95 j 0.33 nj 0.58 nj 0.50 uj 0.23 nj 0.30 njb 0.74 j 0.49 ujEndrin 0.50 uj 0.48 uj 0.49 uj 0.50 uj 0.46 uj 0.48 ujb 0.49 uj 0.49 ujEndosulfan II 0.50 uj 0.48 uj 0.49 uj 0.50 uj 0.46 uj 0.48 ujb 0.49 uj 0.49 uj4,4'-DDD 1.4 0.85 1.3 0.17 j 0.32 j 1.0 b 1.8 0.25 uEndrin Aldehyde 0.50 uj 0.48 uj 0.49 uj 0.50 uj 0.46 uj 0.48 ujb 0.49 uj 0.49 uj4,4'-DDT 0.70 nj 0.90 0.24 nj 0.25 u 0.40 j 0.24 ub 1.9 0.25 uEndosulfan Sulfate 0.50 uj 0.96 uj 0.49 uj 0.50 uj 0.46 uj 0.48 ujb 0.49 uj 0.49 ujEndrin Ketone 0.50 uj 0.48 uj 0.49 uj 0.50 uj 0.46 uj 0.48 ujb 0.49 uj 0.49 ujMethoxychlor 0.50 uj 0.48 uj 0.49 uj 0.50 uj 0.46 uj 0.48 ujb 0.49 uj 0.49 ujToxaphene 15 u 14 u 15 u 15 u 14 u 14 ub 15 u 15 u

Table AH-1. Fish Tissue Sample Results.Species: Kokanee (fem.) Kokanee (male) Kokanee Smallmouth bass Smallmouth bass Longnose sucker Sculpin CrayfishTissue Type: fillet fillet liver fillet fillet whole body whole body tail muscleLocation: Lk. Whatcom Lk. Whatcom Lk. Whatcom Lk. Whatcom Lk. Whatcom Lk. Whatcom Whatcom Cr. Whatcom Cr.Sample No: (98-) 458130 458131 458131 458133 458134 458135/38 458136 458137PCB-1016 2.5 u 2.4 u 2.4 u 2.5 u 2.3 u 2.4 ub 2.4 u 2.5 uPCB-1221 2.5 u 2.4 u 2.4 u 2.5 u 2.3 u 2.4 ub 2.4 u 2.5 uPCB-1232 2.5 u 2.4 u 2.4 u 2.5 u 2.3 u 2.4 ub 2.4 u 2.5 uPCB-1242 2.5 u 2.4 u 2.4 u 2.5 u 2.3 u 2.4 ub 2.4 u 2.5 uPCB-1248 2.5 u 2.4 u 2.4 u 2.5 u 2.3 u 2.4 ub 2.4 u 2.5 uPCB-1254 6.7 5.0 5.1 1.6 j 3.8 j 4.4 b 28 2.5 uPCB-1260 2.8 2.6 2.3 j 1.8 j 5.2 5.1 b 7.7 2.5 uHexachlorobenzene 1.6 j 1.2 j 1.5 j 0.66 j 0.86 j 1.3 jb 2.0 j 0.25 ujCis-Chlordane 1.2 0.86 1.0 0.27 0.63 0.74 b 4.1 0.25 uTrans-Chlordane 0.62 0.47 0.57 0.13 j 0.32 0.35 b 2.4 0.25 uCis-Nonachlor 1.2 0.89 0.84 0.53 1.9 0.98 b 2.3 0.25 uTrans-Nonachlor 2.4 1.5 1.4 1.0 3.6 1.3 b 5.2 0.25 uOxychlordane 0.40 0.31 j 0.35 0.33 j 0.69 0.61 b 0.98 0.25 u
detected values in bolda=mean of laboratory duplicatesb=mean of field replicatesu=not detected at or above reported valuej=estimated value, analyte positively identifieduj=not detected at or above reported estimated valuenj=estimated value, evidence that the analyte is presentnr=not reported

Appendix I
Pesticides Found in Bellingham Stores

Table AI-1. Pesticides Found in Bellingham Stores During Shelf Survey,December 1997.
Name Active Ingredient % Carrier
HerbicidesRound-up Glyphosate, N(phosphonomethyl)
glycineConcentrateSuper concentrate
1.5
1841
Prometon (Fred Meyer) 2,4bis(isopropylamino)6-methoxytriazine
1.5 Petroleum distillates
Noxall (Lilly Miller) Sodium metaborate tetrahydrate,Sodium chlorate
6830
Monoborchlorate (Simplot) Sodium metaborate tetrahydrate,Sodium chlorateBoron trioxide
68302.0
Lawn Weed Killer (Fred Meyer),Preen ‘n Green (Ortho)
Dimethylamine salts of; 2-(2methyl-chlorphenoxy)propionicacid,2,4dichlorophenoxyacetic acid,Dicamba
3.66
7.590.8
Lawn Weed Killer (HyYield) Dimethylamine salts of;2-(2methylchlorphenoxy)propionicacid,2,4dichlorophenoxyacetic acid,2(2-4dichlorophenoxy)propionicacid
2.27
2.28
2.27Finale Brush Killer (AgroEvo) Glufosinate-ammonium 5.78Crossbow (DowElanca) 2-4 Chlorphenoxyacetic acid
butoxy estherTriclpyr
34.4
16.5
Petroleum distillates
Grass B Gone (Ortho) Fluazofop-p-butyl: butyl-phenoxypropionate
0.48
Over the Top (Fertilome) Fluazifop-p-butyl butyl propanoate 1.7Preen & Green (Greenview) Trifluralin (a,a,a,-trifluro2,2dinitro-
N_propyl-p-toluidine)0.74
Preen (Greenview), Treflan(American)
same as Preen & Green 1.47
Green Sweep Weed ‘n Feed Dichlorophenoxy acetic acidDichlorophenoxy propionic acidMethylchlorphenoxy propionicacid
2.292.262.30
Casoron Granules (Lilly Miller,Ortho)
Dichlorobenil:2,6dichlorobenzonitrile
2.0
Moss Kill (Lilly Miller) Zinc 6.2Moss Killer (GroEnergy) Zinc
Copper20.262.35

NAME ACTIVE INGREDIENT % CARRIER
Pesticides/FungicidesUltra-fine Pesticide Oil (SunSpray)
Parrafinnic oil 98.8
Spray Oil (Lilly Miller) Petroleum OilPolysol (Lilly Miller) Calcium polysulfide
Daconil (Ortho) Chlorothalonil(tetrachloroisothalonitrile)
26.9
Microcop (Lilly Miller) Copper sulfateDursban (Lilly Miller) Chlorpyrifos 0.5Dursban (Fred Meyer) Chlorpyrifos 6.7Dursban (HiYield) Chlorpyrifos 3.39Kill-a-bug (Fertilome) Chlorpyrifos 12.0 Petroleum distillatesTermite & Soil (HiYield) Chlorpyrifos XyleneOrtho-Klor (Ortho) Chlorpyrifos 12.6 PAH solventHome Insect Killer (Fred Meyer) Chlorpyrifos 0.2Ant Killer Granules (FredMeyer)
Chlorpyrifos 0.5
Diazinon Granules (Ortho) DiazinonDiazinon (Fred Meyer) Diazinon 25Diazinon (HiYield) Diazinon 47.5Triple Action (Fertilome) Diazinon
Chlorothalonil4.26.0
Malathion (Fred Meyer) Malathion 50Malathion (HyYield) Malathion 55 Aromatic derivatives
Funginex (Ortho) Triforine 6.5Isotox (Ortho) Acephate
PhenoxypropyldistannoxaneAcetylphosphoramidethioate
Orthene (Ortho) Acephate 9.4Spray Aid (Lilly Miller) Cottonseed oil
Alkylphenoxy polyethoxy ethanolSystemic Rose Care (FredMeyer)
Disulfoton:Diethylphosphodithiolate
1.0
Di-Sytom (HiYield) Disulfoton 2.0Garden & Pest Dust (HiYield) Carbaryl 5.0
Dexol Predator (Ant killer dust) Bendiocarb carbamate 1.0Cygon 2-E (HiYield) Dimethoate 23.4Home Defense (Ortho) Diazinon
Pyrethrins0.50.05
Ant Stop (Ortho) TetramethrinSumithrin
Petroleum distillate
Deadline, Slug &Snails Metaldehyde 4.0Corry’s Slug ‘n Snail Death Metaldehyde 2.0Repel, Dog &Cat Repellant d-Limonene
Dihydro-5-pentyl-2(3H)-furanoneDihydro-5-heptyl-2(3H)-furanone
4.0150.0240.04
* Source: Hirsch Consulting Services, 1997, unpublished.


