117
L AKE W ORTH W ATERSHED G REENPRINT J ANUARY 2015

LAKE WORTH WATERSHED
GREENPRINT JANUARY 2015


TABLE OF CONTENTS Executive Summary ..................................................................................................................................... 3
Introduction: The Lake Worth Greenprint ................................................................................................ 5 Study Area: Lake Worth Watershed........................................................................................................ 6 Planning Context ...................................................................................................................................... 9 Current Conditions ................................................................................................................................. 10
Project Overview and Objectives .............................................................................................................. 16 The primary objectives for this Greenprint ........................................................................................... 16 Project Benefits and Economic Impacts ............................................................................................... 16
Greenprinting Methodology ..................................................................................................................... 21 Community Engagement and Goal Setting ........................................................................................... 21 Priority Land Analysis ............................................................................................................................. 22 Strategic Implementation and Action Plan Ideas ................................................................................. 23 Fiscal Impact and Conservation Finance Studies ................................................................................. 23
Greenprint Mapping .................................................................................................................................. 24 Water Quality ......................................................................................................................................... 24 Stewardship Opportunities ................................................................................................................... 26 Recreation .............................................................................................................................................. 28
Implementation and Action Planning Ideas ............................................................................................ 32 Conservation Financing ............................................................................................................................ 37 Conclusion .................................................................................................................................................. 39 Appendix A: Use of the L-THIA Model ..................................................................................................... 40 Appendix B: Economic Impact Report ..................................................................................................... 43 Appendix C: Telephone Poll Results ........................................................................................................ 49 Appendix D: Stakeholders and Committees ........................................................................................... 52 Appendix E: Lake Worth Greenprint Models’ Criteria and Weighting .................................................. 57 Appendix F: Action Ideas Matrix .............................................................................................................. 67 Appendix G: Conservation Finance Resource Options Report ...............................................................81
List of Maps Map 1. Lake Worth Watershed Study Area............................................................................................... 7 Map 2. Priority Water Quality Zones....................................................................................................... 25 Map 3. Stewardship Opportunities for Development............................................................................ 26 Map 4. Stewardship Opportunities for Agricultural Lands.................................................................... 27 Map 5. Lands that Provide Recreational Access to Lake Worth............................................................ 29 Map 6. Lands that Provide Connectivity to Lake Worth......................................................................... 31

LAKE WORTH GREENPRINT REPORT Page 3 of 116
EXECUTIVE SUMMARY The Lake Worth region has a dynamic history and due to its wealth of natural beauty and resources, has long been an attractive place for people to live, work, and play. With its “old west” frontier roots,1 the region currently has a combination of fast growing urban centers, agriculture and cattle lands, diverse and pioneering industry, and scenic natural areas.2,3 Located within Tarrant and Parker counties, the 60,211-acre study area for this Greenprint includes land that channels water into Lake Worth, a major drinking water supply for residents of the City of Fort Worth and other communities. Located approximately ten miles northwest of downtown Fort Worth, the Lake Worth Watershed is directly in the path of development spreading outward from the central city. With a population projected to keep growing, it is essential that the community provide public recreational resources, protect water quality, and provide infrastructure and a range of land uses and development to accommodate future growth. With careful planning, strategically located parks, trails, and open space can provide buffers to protect water quality while also providing recreational bicycle and pedestrian linkages between destinations and amenities to residents. With the intent to protect water quality by reducing pollutant loads from the contributing area while enhancing recreational opportunities in the Lake Worth Watershed, the North Central Texas Council of Governments (NCTCOG) and The Trust for Public Land partnered to work with the City of Fort Worth and a local citizen advisory committee (The Lake Worth Regional Coordination Committee, the LWRCC) to develop this Greenprint. The overall goal of this Greenprint was to create a plan that identifies the lands that are most important for protecting and enhancing Lake Worth’s water quality, as well as other related community driven open space goals. Through community engagement and state-of-the-art computer modeling, community priorities and preferences are blended with science and research to identify these lands and to inform action plan strategies that enable successful implementation. Through interviews, polling, and stakeholder committee engagement, two primary priority topics for the plan emerged:
1. Water Quality Protection 2. Recreation Enhancement
In addition to extensive stakeholder involvement, The Trust for Public Land’s Geographic Information Systems (GIS) modeling experts formed a local technical team that oversaw the computer mapping. The Greenprint mapping results illustrated that there was some overlap between the water quality and recreation-related priorities as some undeveloped lands could serve the dual purpose of providing natural stormwater filtration (to benefit drinking water supply quality and overall water quality of the lake) while also being safe, rewarding places for recreation. In addition, stream corridors stood out as critical features. Given this, The Trust for Public Land staff estimated the reduction in water quality degradation that would be realized from protecting the
1 Tarrant County, “History,” About Tarrant County (accessed August 2014, http://www.tarrantcounty.com/egov/cwp/view.asp?a=703&q=425064). 2 Tarrant County, “Welcome to Tarrant County” (accessed August 2014, http://www.tarrantcounty.com/egov/site/default.asp). 3 Texas State Historical Association, “Parker County” (accessed August 2014, https://www.tshaonline.org/handbook/online/articles/hcp03).

LAKE WORTH GREENPRINT REPORT Page 4 of 116
High Priority lands identified, particularly the lands bordering creeks and the lake itself, also known as riparian corridors. Additionally, the LWRCC developed a set of action plan ideas for local government and private actors who could influence land use decisions in the watershed. For example, for areas identified as High Priority through this Greenprint, LWRCC recommended next steps to help with augmenting private landowner stewardship best practices as well as next steps to keep some of those High Priority riparian areas undeveloped. For this component of the Greenprint, the LWRCC stakeholder group developed a list of action plan ideas, divided among the following eight topic areas:
Raise Funds to Support Action Plan Steps Start a Voluntary Open Space Preservation Program
Gather More Information to Understand and Address Water Quality Problems Develop or Enhance Local Government Programs/Activities
Promote Education and Publicity Create Landowner Incentives
Undertake Additional Planning and Evaluation Regulate for Improved Water Quality Outcomes
Several of these topic areas include ideas for specifically realizing the water and recreation goals. These ideas are then allocated to three priority categories, as illustrated in the graphic below.
This Greenprint will be valuable to the extent that the most appropriate action plan ideas are implemented, and to the extent to which implementers use the Greenprint maps to guide their work. Adopting this Greenprint does not bind a local government to implement any of the action plan ideas.
LAKE WORTH GREENPRINT REPORT Page 5 of 116
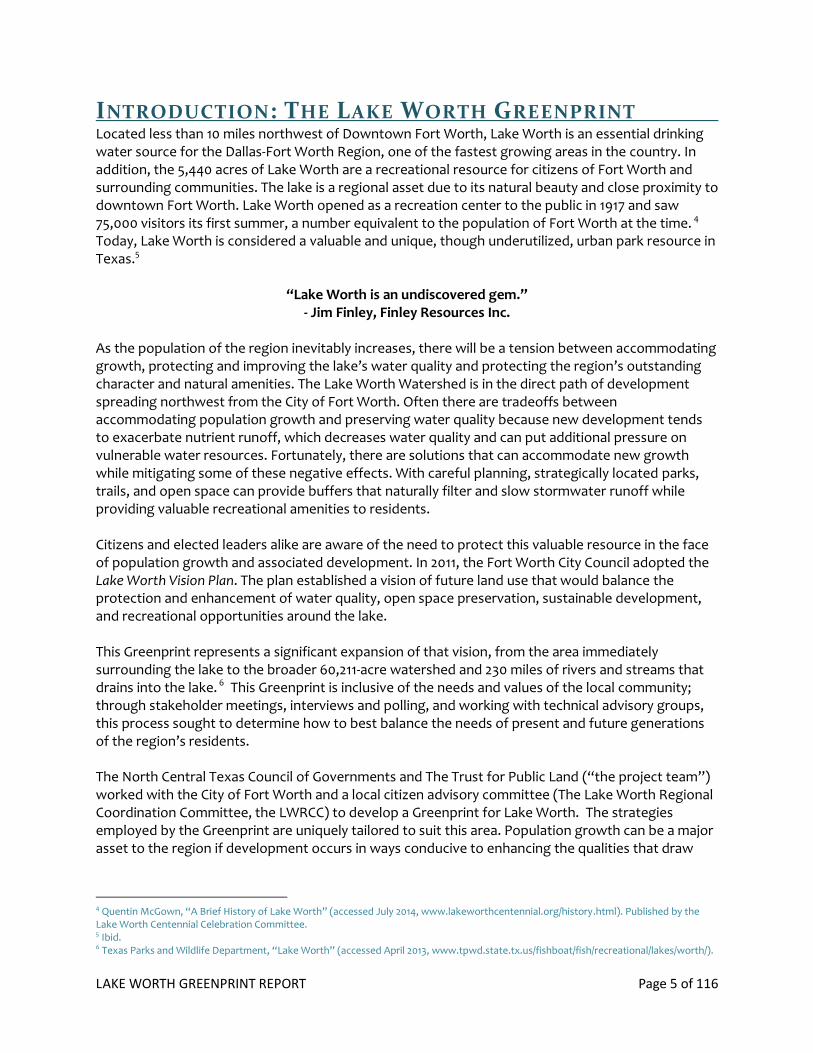
INTRODUCTION: THE LAKE WORTH GREENPRINT Located less than 10 miles northwest of Downtown Fort Worth, Lake Worth is an essential drinking water source for the Dallas-Fort Worth Region, one of the fastest growing areas in the country. In addition, the 5,440 acres of Lake Worth are a recreational resource for citizens of Fort Worth and surrounding communities. The lake is a regional asset due to its natural beauty and close proximity to downtown Fort Worth. Lake Worth opened as a recreation center to the public in 1917 and saw 75,000 visitors its first summer, a number equivalent to the population of Fort Worth at the time. 4 Today, Lake Worth is considered a valuable and unique, though underutilized, urban park resource in Texas.5
“Lake Worth is an undiscovered gem.” - Jim Finley, Finley Resources Inc.
As the population of the region inevitably increases, there will be a tension between accommodating growth, protecting and improving the lake’s water quality and protecting the region’s outstanding character and natural amenities. The Lake Worth Watershed is in the direct path of development spreading northwest from the City of Fort Worth. Often there are tradeoffs between accommodating population growth and preserving water quality because new development tends to exacerbate nutrient runoff, which decreases water quality and can put additional pressure on vulnerable water resources. Fortunately, there are solutions that can accommodate new growth while mitigating some of these negative effects. With careful planning, strategically located parks, trails, and open space can provide buffers that naturally filter and slow stormwater runoff while providing valuable recreational amenities to residents. Citizens and elected leaders alike are aware of the need to protect this valuable resource in the face of population growth and associated development. In 2011, the Fort Worth City Council adopted the Lake Worth Vision Plan. The plan established a vision of future land use that would balance the protection and enhancement of water quality, open space preservation, sustainable development, and recreational opportunities around the lake. This Greenprint represents a significant expansion of that vision, from the area immediately surrounding the lake to the broader 60,211-acre watershed and 230 miles of rivers and streams that drains into the lake. 6 This Greenprint is inclusive of the needs and values of the local community; through stakeholder meetings, interviews and polling, and working with technical advisory groups, this process sought to determine how to best balance the needs of present and future generations of the region’s residents. The North Central Texas Council of Governments and The Trust for Public Land (“the project team”) worked with the City of Fort Worth and a local citizen advisory committee (The Lake Worth Regional Coordination Committee, the LWRCC) to develop a Greenprint for Lake Worth. The strategies employed by the Greenprint are uniquely tailored to suit this area. Population growth can be a major asset to the region if development occurs in ways conducive to enhancing the qualities that draw
4 Quentin McGown, “A Brief History of Lake Worth” (accessed July 2014, www.lakeworthcentennial.org/history.html). Published by the Lake Worth Centennial Celebration Committee. 5 Ibid. 6 Texas Parks and Wildlife Department, “Lake Worth” (accessed April 2013, www.tpwd.state.tx.us/fishboat/fish/recreational/lakes/worth/).

LAKE WORTH GREENPRINT REPORT Page 6 of 116
people in the first place. Population growth is coming. This Greenprint is one tool that can be used to ensure that development enhances the quality of life for current and future residents alike.
STUDY AREA: LAKE WORTH WATERSHED The lake itself is located within the city limits of Fort Worth in Tarrant County, and was the largest lake in Texas when it was built in 1914.7 The lake is 5,427.2 acres8 and has a capacity of approximately 37,000 acre-feet;9 approximately 1,320,960 acres of surrounding land drain into the lake.10,11
Lake Worth is located on the West Fork of the Trinity River just south of Eagle Mountain Lake, a 9,200 acre reservoir also created on the West Fork of the Trinity River in 1932.12, 13 Eagle Mountain Lake is the primary water supply to Lake Worth, making it a significant influence on the water quality of Lake Worth. In addition, there are approximately 230 miles of streams and rivers within the Lake Worth Watershed, and three major tributaries flow directly into Lake Worth: Live Oak Creek, Silver Creek, and West Fork Trinity River. Overall, the Lake Worth Watershed is comprised of four sub-watersheds that represent about 55,040 acres of land that drain directly into the lake (Headwaters Silver Creek, Silver Creek-Lake Worth, Live Oak Creek-Lake Worth, and West Fork Trinity River – Lake Worth). The study area for this Greenprint covers a total of 60,211 acres. (Note: the study area did not include upstream drainage area for the West Fork of the Trinity River, which provides water to Lake Worth via Eagle Mountain Lake.) As illustrated in Figure 1, the watershed study area is bisected by the boundary between Parker County (to the west) and Tarrant County (to the east). The three municipalities falling within the watershed boundary are Fort Worth, Lakeside, and Lake Worth, in addition to unincorporated areas of Tarrant and Parker County. A significant amount of the unincorporated land falls within Fort Worth’s Extra Territorial Jurisdiction (ETJ). The ETJ is an area currently beyond municipal boundaries, although the city maintains some limited control, and this is land that the city is allowed to annex under Texas law.14 For the City of Fort Worth, its ETJ extends five miles beyond its city limits.
7 City of Fort Worth Water Department, Drinking Water Quality Report: Year 2013 Data (accessed July 2014, http://fortworthtexas.gov/uploadedFiles/Water/Drinking_Water/Water_Quality/WQR-English-2013Data.pdf). 8 City of Fort Worth, “Lake Worth” (accessed July 2014, http://fortworthtexas.gov/water/info/default.aspx?id=4616). 9 Water Data for Texas, “Texas Reservoirs” (accessed July 2014, http://www.waterdatafortexas.org/reservoirs/statewide). 10 Texas Commission on Environmental Quality, “Lake Worth: A TMDL Project for PCBs in Fish Tissue” (accessed July 2014, www.tceq.texas.gov/waterquality/tmdl/63-lakeworthpcbs.html). 11 Texas State Historical Association, “Fort Worth” (accessed July 2014, http://www.tshaonline.org/handbook/online/articles/rol87). 12 Seth D. Breeding, "Eagle Mountain Reservoir," Handbook of Texas Online (accessed April 05, 2013, www.tshaonline.org/handbook/online/articles/roe03). Published by the Texas State Historical Association. 13 Texas Water Development Board, “Eagle Mountain Dam and Lake (Trinity River Basin)” (accessed April 2, 2013, www.twdb.state.tx.us/surfacewater/rivers/reservoirs/eagle_mountain/index.asp). 14 Stephan L Sheets, 2009, “Land Use Regulations Outside the City… in the ETJ and Beyond.” Presentation at The University of Texas
School of Law 2009 Land Use Conference.

LAKE WORTH GREENPRINT REPORT Page 7 of 116
Map 1. Lake Worth Watershed Study Area

LAKE WORTH GREENPRINT REPORT Page 8 of 116
Table 1. Acreage of the study area that falls within each municipality in the Greenprint study area.
Municipality/ Jurisdiction
Fort Worth
Lake Worth
Lakeside White
Settlement Azle
Sansom Park
Unincorporated
Parker County
Tarrant County
Acreage 15,601 1,463 979 723 66 20 26,046 15,313
Percent of total study area
25.9% 2.4% 1.6% 1.2% 0.1% 0.03% 43.3% 25.4%
Understanding the land uses within the watershed informs what stewardship opportunities to pursue, which can help prevent polluted runoff from entering the lake. As water from storms or urban runoff travels over land and into Lake Worth, the water dissolves both naturally occurring materials and also gathers additional pollutants, animal waste, and byproducts from human activity.15 As 25 percent of the land in the Lake Worth watershed is developed, water runs off more readily than it would on undeveloped areas or those with higher percentages of impervious surfaces. A large percentage of ranch land, which exists within the watershed, also means that animal waste could be carried into the water source. The table below details the land uses within the study area. Table 2. Land uses within the Greenprint study area.
Land Uses^ Developed* Ranch Land
Farm-land
Timber-land
Water Bodies
Flood Control
Parks and Recreation
Acreage 15,057 17,189 161 1,761 3,922 13 4,392
Percent of total study land area
25.0% 28.5% 0.3% 2.9% 6.5% 0.02% 7.3%
^The total of these specific land uses is 70.52% of the watershed study area. The remaining 29.48% is comprised of land uses including vacant land and institutional uses. *Developed includes land uses such as residential, commercial, industrial, mixed use, parking and roadways. The largest portion of this is single family residential land use.
15 City of Fort Worth Water Department, Drinking Water Quality Report: Year 2013 Data (accessed July 2014, http://fortworthtexas.gov/uploadedFiles/Water/Drinking_Water/Water_Quality/WQR-English-2013Data.pdf).

LAKE WORTH GREENPRINT REPORT Page 9 of 116
PLANNING CONTEXT This Greenprint has been informed considerably by principles inherent to and explicit in three planning documents produced for the region since 2007: the Lake Worth Capital Improvement Implementation Plan (2007), the Lake Worth Vision Plan (2011), and the City of Fort Worth Comprehensive Plan (2014).
Lake Worth Capital Improvement Implementation Plan (CIIP), 200716 The capital improvement plan was created by the Fort Worth Water Department for the revitalization of Lake Worth. Funding for the plan comes from revenues generated by gas leases involving city owned properties under and around Lake Worth. It was developed with public involvement including three public hearings and four steering committee meetings. The plan includes dredging, watershed management, drainage improvements, water and sewer improvements, recreational facilities, stump and navigation obstacle removal, and access control to vacant land.
Lake Worth Vision Plan, 201117 The Lake Worth Vision Plan describes the most appropriate future land use, development patterns and forms, recreational use, and facilities on and around Lake Worth. It was adopted by the Fort Worth City Council in May, 2011. The study area of the vision plan overlaps with that of the current Lake Worth Greenprint’s study area of the Lake Worth Watershed, but is significantly smaller and limited to the area more immediately surrounding the lake. The plan is based on four principles developed through stakeholder workshops: (1) Protect and enhance Lake Worth’s water quality, natural beauty, and recreational character; (2) Develop Model Sustainable Communities in the Lake Worth area that create desirable places to live and work; (3) Create Lake Worth Regional Park, a linear park that encompasses the lake with a recreation focus; (4) Connect communities, resources, and amenities with parkways, greenways, and trails.
City of Fort Worth Comprehensive Plan, 201418 The city’s Comprehensive Plan is its guiding document for future land use, housing, parks, services, economic development, education, historic preservation, and other city-wide concerns. With regards to parks and recreation, the Comprehensive Plan incorporates several plans relevant to Lake Worth. It references the Trinity River Vision as an officially adopted plan of City Council. It references the Lake Worth Vision Plan. The Comprehensive Plan also includes the Nature Center and Refuge Master Plan. According to the Comprehensive Plan, the city as a whole is not currently meeting its level of service standard for parkland of 21.25 acres per 1,000 residents. However, the area surrounding Lake Worth is currently well served by existing parks.
16 Fort Worth Water Department, 2007, Lake Worth Capital Improvements Implementation Plan, (http://nwtcc.org/sg_userfiles/Lake_Worth_Dredging.pdf). 17 City of Fort Worth, 2011, Lake Worth Vision Plan (available http://fortworthtexas.gov/planninganddevelopment/misc.aspx?id=70200). 18 City of Fort Worth, 2014, City of Fort Worth Comprehensive Plan (available http://fortworthtexas.gov/comprehensiveplan/current/).

LAKE WORTH GREENPRINT REPORT Page 10 of 116
CURRENT CONDITIONS The City of Fort Worth was established along the scenic Trinity River in 1849 and served as the western edge of the Texas frontier.19 The Lake Worth watershed has long been an attractive place to live due to the region’s wealth of natural beauty. The region currently has a combination of fast growing urban centers, agriculture and cattle lands, diverse and pioneering industry, and scenic natural areas.20,21 Fort Worth’s projected population increases in the coming decades will require new homes, commercial development, roads, and infrastructure. This type of development can bring economic benefits to a region, but increased runoff caused by a reduction in permeable surfaces and natural infiltration can also contribute to deteriorated water quality at the lake. The municipalities and unincorporated areas of Tarrant and Parker County that make up the watershed all have a vested interest in the future of the watershed. As the population of the region increases, there will need to be a balance between accommodating growth, maintaining the lake’s water quality and protecting the region’s outstanding character and natural amenities. This will be essential to preserving and enhancing the high quality of life for the residents of the region.
Lake History Following a major fire that destroyed a large neighborhood on the south side of downtown, city leaders determined that a water supply reservoir was needed. To respond to this disaster and to meet the needs of a growing population, Lake Worth was created in 1914 through the construction of a dam on the West Fork of the Trinity River. It was the second municipal water supply built in the state.22 Immediately after its construction, it became a popular recreation destination for swimming and fishing, and for its first 30 years it was the “centerpiece” of the Fort Worth park system.23 In the years following the construction of the lake, public entities, rather than private interests, had the greatest influence on its surrounding land use. The City of Fort Worth owned the entire lakefront and a substantial amount of land around the lake, though both public and private development has taken place on this land. During the 1930’s Depression Era, the Civilian Conservation Corps (CCC) was involved in several projects around the lake, including the construction of the original perimeter access roadway (Meandering Road, which still exists under several names today).24 Further development occurred in the early 1940s, with the construction of an Air Force bomber factory directly south of Lake Worth. The Tarrant Army Air Field, adjacent to this new factory, became a bomber aircraft base in 1946,25 and the military still operates the Naval Air Station (NAS) Fort Worth Joint Reserve Base on the lake to this day. Private development of land surrounding the lake began in the early 1920’s, with the building of small fishing cottages on land leased from the City of Fort Worth. This grew quickly to include a number of camps and small resorts. In 1926, a 2,000-acre lease was granted to construct Casino Beach Park, a major amusement park featuring a roller coaster, hotels, and casinos.26 The park was enormously
19 City of Fort Worth, “Fort Worth History” (http://fortworthtexas.gov/government/info/default.aspx?id=3252). 20 Tarrant County, “Welcome to Tarrant County” (accessed August 2014, http://www.tarrantcounty.com/egov/site/default.asp). 21 Texas State Historical Association, “Parker County” (accessed August 2014, https://www.tshaonline.org/handbook/online/articles/hcp03). 22 City of Fort Worth, “Lake Worth” (accessed July 2014, http://fortworthtexas.gov/water/info/default.aspx?id=4616). 23 City of Fort Worth, 2011, Lake Worth Vision Plan. 24 Ibid. 25 City of Fort Worth, 2011, Lake Worth Vision Plan. 26 Chris Van Horne, “Lake Worth to Get Underwater Face-Lift,” NBCDFW, 10 Jan. 2012 (http://www.nbcdfw.com/news/local/Lake-Worth-to-Get-Underwater-Face-Lift-137058123.html).

LAKE WORTH GREENPRINT REPORT Page 11 of 116
popular, reaching its peak in the 1930s. Over time it drew fewer and fewer visitors until it closed in the 1950s and was demolished during the early 1970s. The recreational appeal of the lake decreased with the closure of the park, the siltation of the lake bottom, and the subsequent shallowing of the lake. 27
The Lake Worth area was also infamous for its dodgy establishments and varied cast of characters during the 1930s, 40s, and 50s. In 1935 Tarrant County banned the sale of whiskey as prohibition arrived in Fort Worth. Jacksboro Highway quickly became the home to bootlegger clubs complete with backroom gambling and brothels. It earned the nickname “Thunder Road.” Along with these establishments came gangsters, gamblers, corruption, and murder. During the 1960s, the character of the area began to change as a generation of gangsters and club owners died out (naturally and unnaturally) and a new six-lane parkway was constructed.28
Today many vestiges of the lake’s history remain. Original fishing camps still stand along with several historic buildings. Picnic sites, trails, and pavilions built by the CCC have also stood the test of time as a reminder of the great recreational potential of Lake Worth.29
Population Growth The Dallas-Fort Worth region is one of the fastest growing areas in the US. In the decade between 2000 and 2010, the City of Fort Worth was the fastest growing large city in the nation, and the city’s current population of 792,727 is expected to reach 1.2 million by 2040.30, 31, 32 Furthermore, according to the North Central Texas Council of Government’s 2040 Demographic Forecast report, the Lake Worth region is poised to see a significant portion of the growth over the next thirty years.33 One of the primary reasons for the growing population is migration to the city because of its strong local economy, led by the energy and high technology sectors.34 The Lake Worth Watershed is directly in the path of development spreading from the City of Fort Worth towards the north and west. The area experienced a population growth rate of 41.4 percent, between 2000 and 2010, and has a current (2010) population of 38,087. This area is expected to continue to be one of the fastest growing regions of Fort Worth.35
Lake Worth Water Quality As one of six drinking water sources for the City of Fort Worth and neighboring communities, Lake Worth’s water quality is of paramount importance. It is the only lake water supply source owned by the City of Fort Worth, though the Tarrant Regional Water District (TRWD), one of the largest water suppliers in the state,36 owns the water rights to the lake’s water.37 The Fort Worth Water
27 City of Fort Worth, 2011, Lake Worth Vision Plan. 28 Ann Arnold, Gamblers & Gangsters: Fort Worth’s Jacksboro Highway in the 1940s & 1950s, (Fort Worth: Eakin Press, 1998). 29 City of Fort Worth, 2011, Lake Worth Vision Plan. 30 NCTCOG 2040 Demographic Forecast (accessed August 2014, http://dfwinfo.com/ris/demographics/forecast/City2040.pdf). 31 City of Fort Worth, “Population” (accessed August 2014, http://fortworthtexas.gov/about/population/). 32 City of Fort Worth, 2011, “Part one: Context,” in Lake Worth Vision Plan. (accessed August 2014 http://fortworthtexas.gov/uploadedFiles/Planning_and_Development/Miscellaneous_(template)/01%20Part%20One%20The%20Context.pdf) 33 North Central Texas Council of Governments, NCTCOG Demographic Forecast Overview (accessed August 2014, www.nctcog.org/ris/demographics/forecast/Overview.pdf). 34 City of Fort Worth, 2013, City of Fort Worth Comprehensive Plan (available at http://fortworthtexas.gov/uploadedFiles/Planning_and_Development/Planning_and_Design/2012CompPlan/01PopulationTrends_2012%20Draft.pdf). 35 North Central Texas Council of Governments 2040 Demographic Forecast. 36 Tarrant Regional Water District, “Overview,” (accessed April 1, 2013, http://www.trwd.com/AboutUs).

LAKE WORTH GREENPRINT REPORT Page 12 of 116
Department buys raw water from TRWD, which it then treats and distributes to provide drinking water to 930,000 customers within the city limits and an additional 305,000 people in surrounding areas outside of the city (through 30 wholesale customers).38 Water Quality Trends and Pollutants According to the City of Fort Worth’s most recent analysis, various contaminants have been found in its drinking water supplies (such as Lake Worth). These contaminants include coliforms (including fecal coliform & Escherichia coli), arsenic, and nitrate and nitrite. The most common sources of these pollutants are runoff from fertilizer use; leaching from septic tanks; erosion of natural deposits; and livestock and pet waste.39 High levels of eutrophication can also result, which promotes a proliferation of plant life, especially algae, which reduces the dissolved oxygen content. High levels of suspended solids and turbidity have also been observed in the lake.40 In addition, The Texas Commission on Environmental Quality’s Draft 2012 Texas Water Quality Inventory contains the results from water tests for the following uses: aquatic life, recreation, general, fish consumption, and public water supply. In terms of pollutants that could impact use of the lake generally, only Chlorophyll-a levels exceed the acceptable limits (in 17 out of 56 samples), leading to a “screening level concern” designation. In addition, although some contaminants were deposited a long time ago, several fish consumption warnings were recently issued after insecticides dieldrin and aldrin were found in fish tissue, along with PCBs (this also occurred in samples taken upstream). Fish consumption warnings date back to 2000, when water quality testing found that fish in Lake Worth were contaminated with PCBs, resulting in a public advisory to limit consumption of fish caught in the lake. The Texas Commission on Environmental Quality adopted a Total Maximum Daily Load Program (TMDL) for PCBs in 2005 to “restore the full use” of the water body. A study of the contamination pointed to the Air Force Plant No. 4 (AFP4) located adjacent to the south side of the lake as the probable source. The TMDL plan relies heavily on the cleanup efforts of the AFP4 facility, classified as a Resource Conservation and Recovery Act (RCRA) cleanup site. It should be noted that loading of PCBs to Lake Worth has declined exponentially since its peak in the mid-1960s, and no significant additional loading of PCBs is anticipated. All other categories of pollutants were reported as full support or no concern.41 Sediment and Dredging In addition, since its construction, the lake has experienced high sediment loads, causing it to become increasingly shallow.42 Early on, flood waters that entered the lake were “heavily charged with silt and of a chocolate or yellowish-brown color.”43 Shallow depths decrease the amount of
37 City of Fort Worth Water Department, “Lake Worth,” (accessed April 1, 2013, http://fortworthtexas.gov/water/info/default.aspx?id=4616). 38 City of Fort Worth Water Department, “Fort Worth Water Department History” (accessed April 1, 2013, http://fortworthtexas.gov/water/info/default.aspx?id=4608&ekmensel=c1a27b5b_208_0_4608_1). 39 City of Fort Worth Water Department, Drinking Water Quality Report: Year 2013 Data (accessed July 2014, http://fortworthtexas.gov/uploadedFiles/Water/Drinking_Water/Water_Quality/WQR-English-2013Data.pdf). 40 J.P. Grover, University of Texas at Arlington. 2011, Water Quality Trend Analysis 1989-2009 Final Report. Tarrant Regional Water District, (accessed www.trwd.com/docs/waterquality/combined_exec_and_tech_reports.pdf). 41 Texas Commission on Environmental Quality. Draft 2012 Texas Water Quality Integrated Report. (http://www.tceq.texas.gov/assets/public/waterquality/swqm/assess/12twqi/2012_basin8.pdf). 42 City of Fort Worth Water Department. “Lake Worth Dredging Project.” http://fortworthtexas.gov/water/info/default.aspx?id=45158 (last accessed 4-1-2013). 43 Eakin, H.M. and C.B. Brown, 1939. Silting of Reservoirs. Technical Bulletin 524, U.S. Department of Agriculture.

LAKE WORTH GREENPRINT REPORT Page 13 of 116
water held in the lake and have caused problems for boaters on the lake. In 2007 a dredging plan was adopted as part of the 2007 Lake Worth Capital Improvements Implementation Plan.44 In 2012, the City of Fort Worth began dredging Lake Worth to deepen certain sections of the lake. In the first phase, 2.2 million cubic yards of sediment was removed at a cost of $15.3 million, which was paid using gas well revenues.45 Dredging is one component of the capital improvement plan for Lake Worth.46 Other projects include boat ramps, nature trails and park improvements, Love Circle/Casino Beach Improvements, and other road and infrastructure investments. The dredging component is designed to go hand in hand with watershed management projects to reduce sediment and contaminant loads into the lake.47 Possible Contaminant Sources Interviews with local residents, officials, and stakeholders revealed a number of other potential contaminant sources. While many households around the lake have been converted to sewer systems, a number still remain on septic systems, which could potentially be leaching into the lake. The City of Lakeside, for example, only has 82 homes on a sewer system while over 1,000 are still on septic systems. The watershed also has a sizeable population of feral hogs that may be contaminating the tributaries flowing into the lake. Livestock including hobby horse farms and ranches are also present in the watershed and run-off from these activities may be affecting the water quality of Lake Worth. There are also a number of industrial sites and activities that could be potential sources of contaminated stormwater runoff. Stormwater from the Joint Reserve Base enters Lake Worth, some if it without prior treatment. There are also landfills in the watershed including Mill Creek Landfill and HJG Landfill, as well as mining activities upstream from the lake. Other industrial activities include extensive oil and gas activities, especially hydrofracking for natural gas. However, further investigation is needed to determine the extent to which, if any, these sources are impacting the water quality of Lake Worth and/or its tributaries.
http://books.google.com/books?id=EdI3AAAAMAAJ&pg=PA16&lpg=PA16&dq=lake+worth+watershed+texas&source=bl&ots=VBAqnxImR4&sig=6_ziKpSH9ePWEe8QiW-NTBD665g&hl=en&sa=X&ei=Ml5tUZayOs-UigKhsYCYCA&ved=0CEIQ6AEwBDgK#v=onepage&q=lake%20worth%20watershed%20texas&f=false 44 Van Horne, Chris. “Lake Worth to Get Underwater Face-Lift.” NBCDFW 10 Jan. 2012. http://www.nbcdfw.com/news/local/Lake-Worth-to-Get-Underwater-Face-Lift-137058123.html 45 Thomas, Joel. “Lake Worth Dredging Starts.” CBSDFW 26 Sep. 2012. http://dfw.cbslocal.com/2012/09/26/lake-worth-dredging-starts/; cost figure updated by Water Department 10 Nov 2014. 46 City of Fort Worth Water Department. “Lake Worth Dredging Project.” http://fortworthtexas.gov/water/info/default.aspx?id=45158 (last accessed 4-1-2013). 47 Fort Worth Water Department, 2007. Fort Worth Capital Improvements Implementation Plan. http://fortworthtexas.gov/uploadedFiles/Water/Drinking_Water/Water_Quality/Lake%20Worth%20Presentation%204.pdf.

LAKE WORTH GREENPRINT REPORT Page 14 of 116
Recreational Opportunities around Lake Worth Lake Worth is a popular place for swimming, water skiing, wake boarding, boating, and other personal watercraft activities. The City of Fort Worth operates two public boat ramps for permitted boats only.48 Boating activities on Lake Worth have been part of its use since the 1920’s, when the Fort Worth Power Boat Club was founded.49 While fishing is also a popular activity, it has been somewhat limited due to the presence of Polychlorinated biphenyls (PCBs), aldrin, and dieldrin, which have been found in fish tissue. People are advised not to consume blue catfish, channel catfish, or smallmouth buffalo caught in the lake.50 However, as a result of light fishing pressure, the fishing is generally regarded as being good to excellent for several other species, such as white crappie, largemouth bass, and common carp, and freshwater drum.51 There are 18 City of Fort Worth public parks surrounding Lake Worth that encompass 913 acres (excluding the Fort Worth Nature Center and Refuge, discussed below).52 Several of these parks offer boat ramp access and most feature picnic areas, playgrounds, and other park amenities. Many, including Casino Beach Park, provide places to swim in Lake Worth. The 3,600-acre Fort Worth Nature Center and Refuge (FWNCR)53 is located between Lake Worth and Eagle Mountain Lake. The FWNCR features over 20 miles of hiking trails, an interpretive center, and a variety of prime wildlife habitats including Trinity River bottomland, Cross Timbers oak savannah, and prairie grassland. This park is run by the City of Fort Worth Parks and Community Services Department (PACS) and is a designated National Natural Landmark by the National Park Service.54 It is open to the public for an admission fee (currently $5 for adults, $3 for seniors, and $2 for children). A PACS project is underway to construct a trail around most of the perimeter of Lake Worth. The first phase of the project kicked-off in early 2013 and will create 11.5 miles of trail. Streams and Valleys, a Fort Worth based not-for-profit organization, is currently working on connecting the Trinity River Trail to the Lake Worth Trail. Distribution of Parks Relative to Location of Residents According to The Trust for Public Land’s 2014 City Park Facts report, there are currently 15.0 acres of parkland per 1,000 residents across the entire City of Fort Worth.55 Fort Worth ranks 17 out of the 31 largest U.S. cities in its category (“Low Density Cities”). Its parkland per person is below the mid-point for Low Density Cities (18.5, respectively). However, the city is well-served according to its own standards. The City of Fort Worth’s 2015 Park, Recreation and Open Space Master Plan adopted by The Fort Worth City Council on January 27, 2015
48 http://cdferguson.hubpages.com/hub/Lake-Worth-Texas-Lake 49 http://www.lakeworthcentennial.org/history.html 50 Texas Parks and Wildlife Department. Lake Worth. http://www.tpwd.state.tx.us/fishboat/fish/recreational/lakes/worth/ (last accessed 4-1-2013). 51 DSHS Issues Fish Advisory for Lake Worth, Texas Department of State Health Services. Last updated December 27, 2013. https://www.dshs.state.tx.us/news/releases/20101115.shtm. 52 City of Fort Worth, 2011, Lake Worth Vision Plan. 53 Texas Parks and Wildlife. “Lake Worth Loop.” http://www.tpwd.state.tx.us/huntwild/wildlife/wildlife-trails/pineywoods/west/lake-worth-loop (last accessed 4-1-2013). 54 Fort Worth Nature Center and Refuge. http://www.fwnaturecenter.org/ (last accessed 4-1-2013). 55 The Trust for Public Land. 2014 City Park Facts. https://www.tpl.org/sites/default/files/files_upload/2014_CityParkFacts.pdf. For this analysis, parkland includes city, county, metro, state, and federal acres within the city limits.

LAKE WORTH GREENPRINT REPORT Page 15 of 116
(Resolution No. 4399-01-2015) defined park classifications are as follows: Neighborhood Base Parks (urban, pocket, neighborhood), Community Based Parks (Community, Metropolitan) and Special Use and Nature Based Parks (Special Use, Greenbelts, Conservancy). The parkland service level goals for Neighborhood Based Parks is 2.5-4.25 Acres/1,000 persons and for Community Based Parks is 3.75-6.25 Acres/1,000 persons. Based upon the projected 2015 population of 852,486 the Neighborhood Base Park level of service is at 5.9 acres/1,000 and the Community Based Parks level of service is at 7.8 acres/1,000. According to Parks and Community Services Department, the Special Use and Nature Based Parks are not applicable per acre/person calculation; however there is a total of 5,293.16 acres of Special Use and Nature Based Park with the city limits. Representatives from the Fort Worth Parks and Community Services Department indicate that they strive to serve all portions of the city equitably and, therefore – when considering land acquisition opportunities – they are currently focusing on the areas of the city that are underserved. The Trust for Public Land’s ParkScore® helps the City of Fort Worth determine which neighborhoods are currently underserved.56 The Lake Worth Watershed area is well served by parks relative to many other parts of the city, with no portion of the watershed being classified as having a very high need for parkland. Note that ParkScore® measures – among other things – whether there are parks located within ½ mile of all residents, and does not calculate service area adequacy by park typology. Additionally, this measure of park value does not take into account the quality of existing parks or programming. According to ParkScore®, the City of Fort Worth ranks low in terms of parkland as a percentage of city area compared to other large American cities. For example, in Fort Worth, parkland is 5.5 percent of the city’s area, while in Dallas parkland is 10.8 percent of the city’s area.57 For this analysis, parkland includes city, county, metro, state, and federal acres within the city limits.
56 See http://parkscore.tpl.org/ for more information. 57 See parkscore.org for more information. Figures included in this report are from 2014 ParkScore results.

LAKE WORTH GREENPRINT REPORT Page 16 of 116
PROJECT OVERVIEW AND OBJECTIVES Inspired by a recommendation from the Lake Worth Vision Plan (2011), the primary aim of this project was to analyze which lands in the watershed most influence the lake’s water quality to help guide decision-making around land management and land ownership. Primary objectives were drafted in initial scoping discussions with NCTCOG and the City of Fort Worth, and reviewed with the LWRCC.
THE PRIMARY OBJECTIVES FOR THIS GREENPRINT ARE:
Develop a long-term vision for a Lake Worth open space network, and involve stakeholders in the decision-making process.
Build upon plans already complete or underway, e.g. trail alignment study for Lake Worth, Lake Worth Vision Plan, and the Lake Worth Capital Improvement Implementation Plan.
Identify lands most important for lake water quality, as well as other related community-driven open space/conservation goals.
Help the city and stakeholders evaluate the relative importance of undeveloped land in the watershed.
Evaluate tools that can be used to protect Lake Worth’s water quality.
Provide education about voluntary conservation easements (CEs) and their tax advantages to potential partners to make CE opportunities more widely understood and employed, where appropriate.
PROJECT BENEFITS AND ECONOMIC IMPACTS Healthy lakes, streams, and open spaces are more than just places to fish, swim, and enjoy the outdoors; they are essential to maintaining high quality sources for our drinking water and the character of the region that attracted people in the first place. Study after study has shown that parks have a positive impact on nearby residential property values. All things being equal, most people are willing to pay more for a home with access to parks, open space reserves, walking trails, and cycling paths. Through this lens, the lake's health is understood to be an essential element of our own health and the economic vitality of the region.
Water Quality and the Value of Undeveloped Land and Riparian Corridor Protection Open space buffers around Lake Worth, a primary drinking water source for the Cities of Fort Worth and Lake Worth, could reduce treatment costs associated with declining water quality. In natural ecosystems, rain water falls to the ground or runs off land surfaces to receiving water bodies. The

LAKE WORTH GREENPRINT REPORT Page 17 of 116
process of entering the ground and infiltrating through soil into ground water aquifers helps filter out some pathogens and contaminants. The infiltration process is disrupted when pervious surfaces are replaced by impervious surfaces. Homes, roads, and businesses contribute to impervious surfaces and often lead to increased levels of non-point source pollution. As development leads to decreased groundwater infiltration and exacerbates runoff, vegetated buffers slow and filter nutrient runoff as well as hold soil in place and prevent erosion. In particular, the future change in land use along riparian corridors will impact Lake Worth water quality. This section examines the impact of riparian corridor protection on future pollutant loading. The North Central Texas Council of Government’s (NCTCOG) Integrated Stormwater Management (iSWM) technical manual notes that a reduction in pollutant loading can occur when a stream buffer effectively treats stormwater runoff.58 Effective treatment constitutes treating runoff through overland flow in a naturally vegetated or forested buffer. High Priority Water Quality Zones identified by this Lake Worth Greenprint (shown on page 26 in the Greenprint Mapping section of this report) were used to establish priority zones for riparian corridor protection. Purdue University’s Long Term Hydrologic Impact Analysis (L-THIA) model was used for this analysis.59 L-THIA is a simplified hydrologic assessment model for estimating broad-based runoff and pollutant load impacts of alternative land use configuration scenarios. For a detailed description of the methodology and assumptions used for this application of the L-THIA model, see Appendix A. L-THIA results provide insight into the relative hydrologic impacts of different land use scenarios. The Trust for Public Land’s GIS team worked closely with the Fort Worth Planning and Development and Water Departments to develop reasonable assumptions to model two future land use scenarios: 1) land use at full build-out; and 2) land use at full build-out with the implementation of riparian corridor protection within the Lake Worth Greenprint - High Priority Water Quality Zones. These two future land use scenarios are compared to baseline conditions (i.e., hydrologic conditions as they exist today within the Extraterritorial Jurisdiction or ETJ boundaries) to measure the potential changes in water quality. This study focused on the proportional results of the build out scenarios. That is, it considered the percent increase in pollutant loads from baseline to each of the two build-out scenarios. Exhibit 1 (on the top of the next page) shows that future water pollutant loading will increase with build-out regardless of riparian corridor protection; however, the relative amount of future water pollutant loading will be higher without riparian corridor protection. The comparison of pollutant loading with and without protection does not include any other scenario changes, such as changes that result from the vision or sustainable community plans or alternative development patterns.
58 iSWM Technical Manual. 2010. Water Quality: 1.0 Water Quality Protection Volume and Peak Flow. 2.0 Construction of SWP3 Guidelines and Form. 59 Harbor, J., Grove, M., Bhaduri, B. and Minner, M. 1998, "Long-Term Hydrologic Impact Assessment (L-THIA) GIS." Public Works, 129, p. 52-54.

LAKE WORTH GREENPRINT REPORT Page 18 of 116
Exhibit 1. Comparative Results of Pollutant Loading With and Without Protection
Enhanced Property Value Analysis Real estate value is a common measure of the economic impact of open space. Numerous studies demonstrate that proximity to open space is strongly correlated with higher property values.60 Providing unique recreational amenities around Lake Worth – such as a network of riparian corridor trails connected to a lakeshore trail – could enhance property values and development opportunities while simultaneously increasing recreational opportunities and healthy transportation choices for local residents. This was the case in Dallas’ Uptown neighborhoods along the Katy Trail, where the trail is seen as one of the most important local amenities, and monthly rents have increased to more than double the average monthly rent in Dallas-Fort Worth.61 In San Antonio a study of 10,000 home sales showed that trails, greenbelts, and greenways are associated with a roughly 2, 4, and 5 percent price premiums, respectively.62 Texas A&M professor John Crompton has conducted extensive research on the marketing and financing of parks since the 1970’s. A well-known and frequently cited study of his, “The Impact of Parks on Property Values,” suggests a 20 percent increase in property values on homes abutting
60 Lindsey, G., Man, G., Payton, S., & Dickson, K. (2004). Property values, recreation values, and urban greenways. Journal of Park and Recreation Administration, 22(3), 69–90. 61 The New York Times. Accessed on June 19, 2014 from http://www.nytimes.com/2014/05/14/realestate/commercial/a-trail-helps-open-up-a-dallas-neighborhood.html?_r=0 62 Asabere, Paul K., and Forrest E. Huffman. "The relative impacts of trails and greenbelts on home price." The Journal of Real Estate Finance and Economics38.4 (2009): 408-419.

LAKE WORTH GREENPRINT REPORT Page 19 of 116
parks is a reasonable estimate.63 A more recent report also estimates that there is a 5 percent premium for homes within 600 feet (approximately three blocks) of a park or greenway in Texas.64 In the City of Fort Worth, homes that were located within 500 feet of parks had a total market value of $5.20 billion in 2012, and homes in the Lake Worth Greenprint Study Area that were located within 500 feet of parks had a total market value of $139 million. Given this, it is estimated that an increase of $260 million in residential property value existed in 2012 because of proximity to parks in the City of Fort Worth, with $6.95 million of that increase in the Lake Worth Greenprint Study Area. The Trust for Public Land also conducted a study in the Fort Worth region to estimate the extent of enhanced property value and increased tax revenues generated by parks. The total value captured in additional property tax revenue derived from parks is $5.82 million each year in the City of Fort Worth, and $144,000 in the Lake Worth Greenprint Study Area. Strategically acquiring land for open space reserves, walking trails, and cycling paths in areas that are poised to experience population growth helps ensure that these important amenities exist in sufficient quantities for future residents. Designating riparian corridor parkland can maximize public and private investment returns from increased value and associated property tax revenue for decades to come.
Recreational Use Analysis Providing unique recreational amenities in the Lake Worth watershed also has direct recreational use value. The Trust for Public Land used an established Direct Use Calculator used by the U.S. Army Corps of Engineers (see note below table) to determine this value for Fort Worth, Lake Worth, and Lakeside. As detailed in the table below, the total direct use value of parks and public open spaces is $16.1 million (for 2013). Table 3. The annual economic value of direct use of City of Fort Worth parks and public open spaces, by residents of the Cities of Fort Worth, Lake Worth, and Lakeside
Facility/Activity Person-Visits Average Value
per Visit Value
General park uses (e.g., playgrounds, trails, walking, picnicking, biking, etc.)
6,000,000 $2.48 $14,900,000
Special uses (e.g., fishing, visiting Nature Center, etc.)
230,000 $5.22 $1,200,000
Total 6,230,000 $2.58 $16,100,000 These values were determined based on the number of visits to City of Fort Worth parks and public open space facilities through a professionally conducted telephone survey of 598 residents of Fort Worth, Lake Worth, and Lakeside. The research used a model to quantify the benefits received by direct users based on the “Unit Day Value” method as documented in the Water Resources Council (WRC) Recreation Valuation Procedures written by the U.S. Army Corps of Engineers.
63 Crompton, John L. "The impact of parks on property values: A review of the empirical evidence." Journal of Leisure Research 33.1 (2001): 1-31. 64 John Crompton, "Estimates of the Economic Benefits Accruing From an Expansion of Houston's Bayou Greenway Network" (Journal of Park and Recreation Administration 30, no. 4, 2012, pp. 83-93).

LAKE WORTH GREENPRINT REPORT Page 20 of 116
San Antonio’s River Walk, Austin’s Shoal Creek Trail, and Dallas’ Katy Trail are each examples of successful urban trails that catalyze economic development in surrounding areas. San Antonio’s River Walk is the second most popular tourist attraction for the city’s 26 million annual visitors, trailing behind only The Alamo.65 Tourism is not currently a significant source of revenue for the Lake Worth region; however, with long-term planning and well-designed amenities, it could become a larger source of revenue in the future.
Health of Area Residents Analysis In Texas, 31 percent of adults are obese and over 65 percent are overweight. Lack of exercise is shown to contribute to obesity and its many negative health effects, and for this reason experts call for a more active lifestyle.66 In addition, several studies have documented the large economic burden related to physical inactivity. One report released in August 2009 by the U.S. Centers for Disease Control and Prevention (CDC) estimates that obesity cost the U.S. economy $147 billion in 2008 alone. One study of health impacts in the region indicates that approximately 40,500 adult residents in Fort Worth, Lake Worth, and Lakeside could improve their health by using City of Fort Worth parks and public open spaces. In 2013, the combined health savings from park and public open space use for the adult residents of Fort Worth, Lake Worth, and Lakeside was $13.9 million. The full report detailing additional economic benefits can be found in Appendix B.
65 Paseo del Rio Association. Accessed on June 19, 2014 from http://www.thesanantonioriverwalk.com/ 66 Harnik, Peter, and Ben JH Welle. Measuring the economic value of a city park system. Trust for Public Land, 2009.

LAKE WORTH GREENPRINT REPORT Page 21 of 116
GREENPRINTING METHODOLOGY Greenprinting is The Trust for Public Land’s premier conservation planning service, and a Greenprint is a strategic plan for meeting open space, conservation, and water quality goals. The Greenprinting process utilizes stakeholder involvement and state-of-the-art Geographic Information Systems (GIS) modeling to help communities identify conservation priorities. The lands identified, if conserved, would protect local resources, such as water, maintain and expand opportunities for recreation, preserve local character and culture, and enhance quality of life. With the goal of identifying lands in the watershed that most directly help to protect and enhance the lake’s water quality, while maximizing recreational opportunities, The Trust for Public Land conducted extensive community engagement and also engaged with numerous experts. In addition to community polling and 42 targeted interviews, the Lake Worth Regional Coordination Committee (LWRCC) was engaged to provide input and to ensure that the Greenprint accurately determined priority lands, as well as to help develop implementation ideas. Through interviews, public polling, and the LWRCC, local stakeholders shared their priorities for conservation and use of open space. Based upon these priorities and criteria, The Trust for Public Land’s Geographic Information Systems (GIS) experts created models and analyzed which lands are most important for meeting the project objectives. The overall Greenprinting process and the groups involved with these tasks for the Lake Worth Watershed are described below.
COMMUNITY ENGAGEMENT AND GOAL SETTING In addition to creating a strategic plan and related maps that identify the lands that most help to protect and enhance Lake Worth’s water quality, the project partners also set out to incorporate other popular community open space/conservation goals. To determine what these goals are, as well as their relative importance to the local community, the project team conducted public polling and interviews, and engaged a representative stakeholder group.
Public Polling A public opinion poll was conducted early in the process that asked residents of the study area about their attitudes and viewpoints on issues related to growth planning, disaster recovery and preparedness, land and water protection, and related community objectives. Residents in the study area – which includes Fort Worth as well as portions of Parker County and the towns of Lakeside and Lake Worth – were reached by telephone. The statistically significant citizen perspective survey served to illuminate residents’ preferences on topics such as: current recreational activities and resident participation rates in those activities, perceived security and availability of drinking water, degree of significance assigned by residents to land use and environmental issues, and residents’ willingness to pay for new conservation lands. This poll revealed that 98 percent of residents care a great deal about drinking water quality and most (78 percent) are also interested in enhancing recreational opportunities. Complete telephone poll findings can be found in Appendix C.
Interviews In order to further identify conservation objectives, previous accomplishments, key players, and risks, The Trust for Public Land conducted 42 one-on-one interviews (via telephone or in person). These interviewees provided advice and candid feedback about how to steer this project given

LAKE WORTH GREENPRINT REPORT Page 22 of 116
current activities in the watershed as well as a variety of political constraints and opportunities. A list of those interviewed can be found in Appendix D. The topics covered in these interviews included:
Identifying conservation priorities;
Providing context about the watershed (background as well as current activities and challenges);
Identifying potential water pollutant sources;
Identifying other resources to map and mapping advice; and
Brainstorming possible implementation strategies (many focused on stewardship) and potential recommendations/action planning ideas;
Ideas about potential implementation partners.
Stakeholder Group: The Lake Worth Regional Coordination Committee, the LWRCC The Trust for Public Land worked with the project partners to engage the LWRCC as the coordination committee for the project. Although significantly weighted to existing lakeshore residents and property owners, this committee represented a broad range of open space, land use, and economic development interests across the watershed. LWRCC is an advisory body; this group reviewed the results of the public engagement and public opinion research and provided feedback on draft maps that reflects those interests. The LWRCC also developed and refined action plan ideas. The individual members of this group are listed in Appendix D.
PRIORITY LAND ANALYSIS The Trust for Public Land’s Geographic Information Systems (GIS) modeling experts led this portion of the process. This component of the project involved using the priorities confirmed through the engagement process to choose appropriate mapping criteria, assign weighting to these criteria, and map these using GIS models. The Trust for Public Land’s GIS modeling experts also formed a local Technical Advisory Team that oversaw the computer mapping and gave input on criteria and weighting.
Technical Advisory Team (TAT) This group comprised of local, state, and federal scientific and technical experts aided in the gathering and interpretation of relevant data. Two sub-groups were formed to address the two primary goals: (1) Drinking water quality, and (2) Recreation and trail connectivity. The individual members of these groups are listed in Appendix D.
Mapping Process After forming the TAT, the first step in this process was to identify criteria that characterize water quality protection priorities or enhance recreational opportunities. Next, data relating to these criteria were compiled, and assigned relative weightings that reflect Lake Worth watershed priorities. The technical team and the LWRCC also identified those lands and related action steps that present the best recreational opportunities in the study area. A GIS model was developed, and the data was incorporated into the models to create composite priority maps.

LAKE WORTH GREENPRINT REPORT Page 23 of 116
Once these draft maps were developed, the LWRCC was convened to review the priorities and criteria in draft map form, and stakeholders further refined and improved the data table and maps. The maps are presented in the next section “Greenprint Mapping.” Further detail about the models, including detailed information about the criteria and data sources, can be found in Appendix E.
STRATEGIC IMPLEMENTATION AND ACTION PLAN IDEAS Through facilitated discussions, the LWRCC worked to determine the implementation strategies that are most likely to succeed and the steps needed to arrive at success. As an outcome of this work, the LWRCC developed a set of recommendations for local government and private actors who may influence land-use decisions in the watershed. The action plan ideas for implementation are intended to inform next steps, and these are presented in the report section “Implementation and Action Planning Ideas.”
FISCAL IMPACT AND CONSERVATION FINANCE STUDIES This project also included primary research investigating the economic benefits that Fort Worth and other communities in the watershed receive from their parks and open space system, such as benefits to the local government of increased property tax revenue and health benefits to residents. Experts also investigated ways that funds could be raised or generated to pursue some of the recommendations of the Lake Worth Watershed Greenprint. Two reports were completed (one Economic Impacts Report and one Conservation Finance Resource Options Report). Overviews of these are in this report (sections “Project Benefits and Economic Impacts” beginning on page 17 and “Conservation Finance Resource Options” on page 38, respectively). The full documents are in Appendices D and E.

LAKE WORTH GREENPRINT REPORT Page 24 of 116
GREENPRINT MAPPING The subsections here describe the maps created in the Greenprint. For each of the two main goals, the criteria and weighting are presented, and the amount of land in the study area that is prioritized for protection is detailed. There are also two additional maps that address opportunities for stewardship. Overall, there was some overlap between the water quality and recreation-related priorities as some undeveloped lands could serve the dual purpose of providing natural stormwater filtration (to benefit drinking water supply quality) while also being safe, rewarding places for recreation.
WATER QUALITY Map 2 depicts Priority Water Quality Zones for the Lake Worth Watershed as determined via the Lake Worth Greenprint process. The model for identifying these Priority Water Quality Zones included features that help protect water sources and help reduce pollution in stormwater runoff. The following criteria were identified by the Greenprint Technical Advisory Team for creating the Priority Water Quality Zones map, with relative importance as shown below:
Riparian Vegetation 20% Canopy Cover 15% Floodplains and Buffers 15% Wetlands 13% Steep Slopes 11% Steep Stream Banks 11% Erodible Soils 11% Native Vegetation 4% Soils with Slow Infiltration 3%
Priority lands were identified as having the greatest potential for water quality protection. Overall, 2,514 acres of land (4.18 percent of the total study area acreage) are considered high priority for maintaining and protecting water quality in the Lake Worth watershed. An additional 5.65 percent (3,399 acres) of land within in the study area is considered moderate-high priority, and 5.74 percent (3,455 acres) of land within in the study area is considered moderate priority. In the Greenprint mapping results, stream corridors stood out as critical features. Given this, The Trust for Public Land staff also estimated the reduction in water quality degradation that would be realized from protecting the riparian corridors identified as high priority. More information can be found in the “Project Benefits and Economic Impacts” section (specifically on page 17), but it was determined that approximately 10 to 20 percent of pollutant loads (total suspended solids, phosphorous, nitrogen, lead, copper, zinc, and E-Coli) could be reduced through riparian land protection.

LAKE WORTH GREENPRINT REPORT Page 25 of 116
Map 2. Priority Water Quality Zones

LAKE WORTH GREENPRINT REPORT Page 26 of 116
STEWARDSHIP OPPORTUNITIES In addition to identifying the land that would have the greatest negative impact if developed, areas where stewardship activities could potentially be implemented with significant impact were identified. These are areas where the land use activities have a direct influence on water quality, and where implementing certain Best Management Practices (BMPs) could most protect water quality.
Stewardship Opportunities for Existing and Future Development With 25.0 percent of the study land area already developed, and with a growing population that will require additional housing, commercial development, and infrastructure, analysis was conducted to highlight stewardship opportunities for developed areas (both existing and planned) that have direct influence on water quality, due to close proximity within landscape drainage patterns. Drainage catchments shown in purple on the map below drain directly to High Priority Water Quality Zones, and these areas have a high percentage of existing or anticipated impervious cover within the catchment. Purple areas on the map are particularly important locations for carefully managing stormwater runoff, especially in developing areas where stormwater management practices such as Low Impact Development (LID) designs could be helpful for improving water quality in Lake Worth. Map 3. Stewardship Opportunities for Development

LAKE WORTH GREENPRINT REPORT Page 27 of 116
Stewardship Opportunities for Agricultural Land Uses Covering approximately 29 percent of the study area and due to close proximity within landscape drainage patterns, agricultural lands (farm and ranch lands) have direct influence on water quality. Analysis was conducted to identify areas where there could be stewardship opportunities for agricultural land within the Lake Worth watershed catchment area. The map below identifies significant opportunities for implementing water quality Best Management Practices on agricultural lands. Drainage catchments shown in purple drain directly to High Priority Water Quality Zones and have a high percentage of agricultural activity within the catchment. The lands identified are places where there could be impactful stewardship opportunities for landowners. These stewardship efforts could include a range of Best Management Practices (BMPs) that protect water quality, such as grassy swales and off-stream livestock watering. Map 4. Stewardship Opportunities for Agricultural Lands

LAKE WORTH GREENPRINT REPORT Page 28 of 116
RECREATION Maps 5 and 6 display the results for the recreation-related analysis, and a total of 6,625 acres of land in the study area are considered priority for maintaining or protecting recreational opportunities. The maps below explore two recreation-related goals: access and connectivity. Map 5 displays lands that provide recreation access to Lake Worth. The following criteria were identified by the Greenprint Technical Advisory Team for creating a map that depicts lands that provide recreation access to Lake Worth. Criteria were assigned relative importance based on responses regarding outdoor recreation preferences in a June 2013 public opinion survey conducted by Public Opinion Strategies:
Gaps in Pedestrian-Accessible Lakeshore 14% Fitness Zone Priority Neighborhoods 14% Wildlife Viewing 12% Shoreline Fishing 12% Scenic Views from Lake Worth Parks 12% Suitable Locations for Camping 9% Recreation Opportunities Close to Lake Worth 8% Opportunities for Lakeshore Non-Motorized Boat Access 7% Gaps in Lakeshore Motorized Boat Access 7% Planned Parking Improvements 2% Planned Playground Improvements 2%
Overall, 0.06 percent (35 acres) of land within in the study area is considered high priority for protection with the goal of providing recreation access to Lake Worth. An additional 2.07 percent (1, 245 acres) of land within in the study area is considered moderate-high priority, and 8.88 percent (5,345 acres) of land within in the study area is considered moderate priority.

LAKE WORTH GREENPRINT REPORT Page 29 of 116
Map 5. Lands that Provide Recreational Access to Lake Worth

LAKE WORTH GREENPRINT REPORT Page 30 of 116
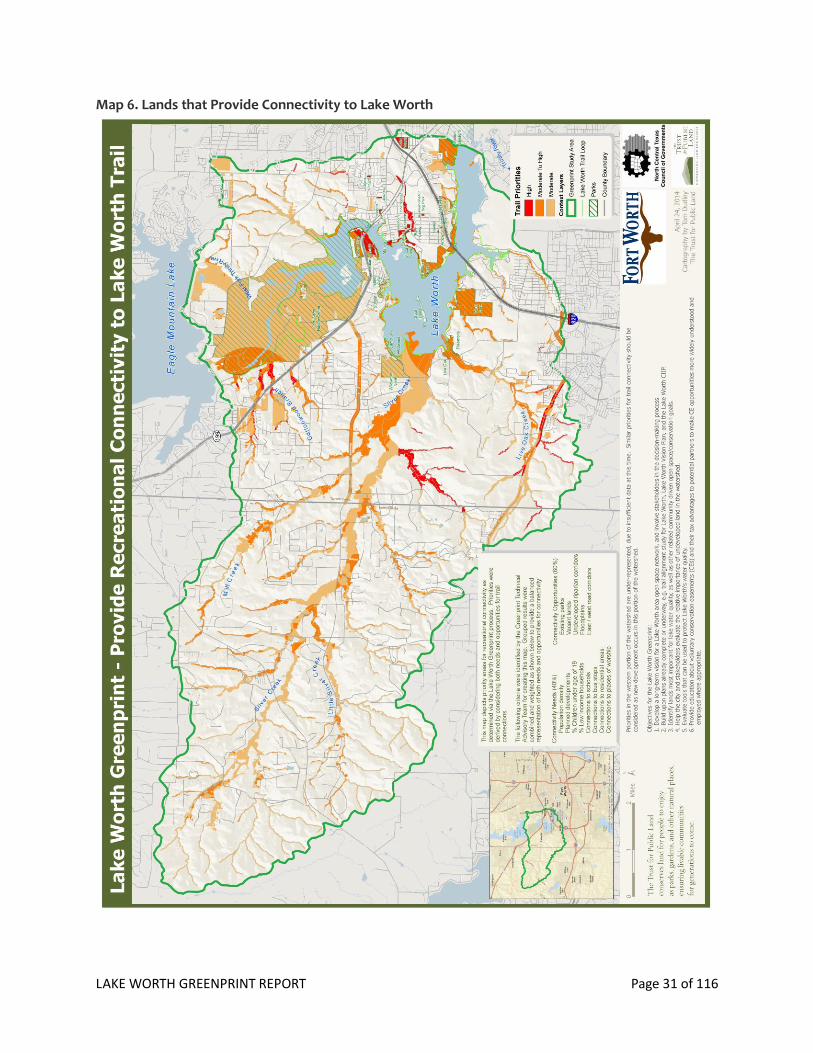
Map 6 displays lands that provide recreational connectivity. Priorities were derived by considering both needs and opportunities for trail connections. The following criteria were identified by the Greenprint Technical Advisory Team for creating a map that identifies high priority lands for connectivity with the Lake Worth Trail. Grouped results were combined and weighted as shown below to provide a balanced representation of both needs and opportunities for connectivity:
Connectivity Needs (40%) Connectivity Opportunities (60%) Population density Existing parks Planned developments Vacant lands % Children under age of 19 Undeveloped riparian corridors % Low income households Floodplains Connections to schools East / west road corridors Connections to bus stops Connections to residential areas Connections to places of worship
The map shows the overlap of these needs and opportunities, and the difference in weighting these places more emphasis on opportunities. Overall, 0.91 percent (547 acres) of land in the study area is considered high priority for providing recreation access to Lake Worth. An additional 5.3 percent (3,192 acres) of land in the study area is considered moderate-high priority, and 10.86 percent (6,540 acres) of land in the study area is considered moderate priority.
LAKE WORTH GREENPRINT REPORT Page 31 of 116
Map 6. Lands that Provide Connectivity to Lake Worth

LAKE WORTH GREENPRINT REPORT Page 32 of 116
IMPLEMENTATION AND ACTION PLANNING IDEAS The Lake Worth Regional Coordination Committee (LWRCC) developed action plan ideas for implementing the Greenprint. These action plan ideas were initially generated by the Lake Worth Regional Coordination Committee (LWRCC) in February 2014 in response to these questions:
1) What concrete actions can be taken by the municipalities, counties, and other local or regional organizations to advance the goals of the Greenprint: protect water quality and quantity, provide recreational access, and provide recreational connectivity to the Lake Worth Trail?
2) How can we accomplish these goals? At the LWRCC meeting in April 2014, stakeholders began to narrow the draft list of ideas to the most actionable items that will advance the Greenprint goals. Then City of Fort Worth legal staff and other City staff reviewed the document, as requested by members of the LWRCC. An online survey was conducted in June 2014 that was used to further refine the ideas and to begin to sort them into categories (described below). A subcommittee of volunteers from the LWRCC also suggested language refinements and prioritization. In June and August of 2014 the LWRCC deliberated and voted on the action plan items. These are the committee's recommendations to the local governments in the watershed. Note: Adopting this Greenprint does not bind a local government to implement any or all of these action plan ideas. There are a total of forty-two action plan ideas; these are divided into the eight topic areas listed below. Action Plan Idea Topic Areas:
1) Raise Funds to Support Action Plan Steps 2) Start a Voluntary Open Space Preservation Program 3) Gather More Information to Understand and Address Water Quality Problems 4) Develop or Enhance Local Government Program/Activities 5) Promote Education and Publicity 6) Create Landowner Incentives 7) Undertake Additional Planning and Evaluation 8) Regulate for Improved Water Quality Outcomes
Within each topic area, these action plan ideas are further divided into three categories:
1) High Priority, and implementation desired in the near future (within 3 years); 2) High Priority, but can be implemented in longer-term (more than 3 years); and 3) Not High Priority, but desirable (implementation as opportunities arise and funding becomes
available).

LAKE WORTH GREENPRINT REPORT Page 33 of 116
These ideas are presented next. It is anticipated that a variety of actions – on the part of individuals, organizations, and agencies – will be required to fully implement this Greenprint. Please see Appendix F for more details regarding potential implementation of these action plan ideas. Note: the following acronyms are used in this section:
NCTCOG = North Central Texas Council of Governments
PACS = City of Fort Worth Parks and Community Services Department
TRWD = Tarrant Regional Water District
NRCS = Natural Resources Conservation Service
BMPs = Best Management Practices
1. RAISE FUNDS TO SUPPORT ACTION PLAN STEPS
High Priority, and implementation desired in the near future Coordinate with federal agencies to seek grant funding. Fort Worth City Council to use a portion of the oil and gas lease revenue to fund actions related
to the Lake Worth Greenprint. Leverage funds from existing groups that have been known to raise money for related work
(examples: NCTCOG, TRWD, and Streams and Valleys).
2. START A VOLUNTARY OPEN SPACE PRESERVATION PROGRAM
High Priority, and implementation desired in the near future Start a voluntary open space program focused on preserving riparian corridors, creating
easements for new trails, restoring native vegetation, or protecting open space generally that is high priority according to the Greenprint. This could be done by establishing a nonprofit that can raise donations and leverage private dollars with government grants.
3. GATHER MORE INFORMATION TO UNDERSTAND AND ADDRESS
WATER QUALITY PROBLEMS
High Priority, and implementation desired in the near future City of Fort Worth Water Department to identify research/monitoring needs related to Lake
Worth and commence that monitoring. Monitor septic system discharge into the lake by evaluating the septic systems in the watershed
and reviewing waste treatment improvement opportunities.

LAKE WORTH GREENPRINT REPORT Page 34 of 116
4. DEVELOP OR ENHANCE LOCAL GOVERNMENT PROGRAMS OR
ACTIVITIES
High Priority, and implementation desired in the near future Preserve existing City-owned Priority Water Quality Zones with a High, Moderate-High, or
Moderate ranking on the Water Quality Zones Greenprint map. Investigate ways to reduce runoff in the watershed on public lands, including parkland (e.g.
could use undeveloped savannah grassland for open space range management). Consider future recreational use for the city-owned land with a High ranking on the Recreational
Connectivity and Recreation Access Greenprint maps. Improve the parking and clean the beaches at City-owned parks around Lake Worth. This
includes City of Fort Worth checking that the estimated costs associated with improving the parking in their parks around Lake Worth are on unfunded capital needs list so that when funding becomes available, those items can be considered.
Expand the “Adopt-A-Park” program. Volunteers can help with litter pick-up, mowing and plantings in parks. Encourage formation of private “Friends of” groups similar to the Friends of the Fort Worth Nature Center & Refuge or Friends of Tandy Hills Natural Area.
High Priority, but can be implemented in longer-term Promote Low Impact Development (LID) for stormwater management. For example, have a LID
design competition for City-owned land that is within High Priority Water Quality Zones. Do more regional stormwater detention.
Improve existing parks around the lake by providing facilities for more diverse recreation (e.g. lawn bowling, remote controlled airplane fields, disc golf, etc.). Note that the Naval Air Station Joint Reserve Base would need to be consulted about the location of any proposed remote controlled airplane fields.
Not High Priority, but desirable Support the existing voluntary backyard wildlife habitat programs that work with interested
landowners. As part of its planning, PACS to consider potential location(s) for providing camping
opportunities for children and young adults.

LAKE WORTH GREENPRINT REPORT Page 35 of 116
5. PROMOTE EDUCATION AND PUBLICITY High Priority, and implementation desired in the near future Establish a communications strategy to promote the resources, to describe what we have here
and what is evolving. Work with a public relations organization or ad agency. Could be public education campaign like the 1980s Chesapeake Bay “We all Live Downstream” Campaign.
Have signage about good stewardship practices at places that people will go to already, like boat ramps and trailheads.
Approach Texas Parks and Wildlife Magazine about doing an article. Work with landowners to equip them to voluntarily enhance practices that maintain or improve
the water quality. Expand existing program: City of Fort Worth provides stormwater credits to Fort Worth
Independent School District – they do 1 hour of stormwater education per year and they get a 10 percent rebate on their utility fees. Over 130 schools are potential users of this program, and this year about 30 participated.
Create development review tool for city and county offices to assist in educating developers –reference Greenprint maps as part of entitlement process and ensure proposed development is consistent with priority areas for water quality protection.
Educate the public about application/use of fertilizers and detergents to reduce negative water quality impacts.
Better promote the Nature Center. It showcases scenic, historic and heritage of the area.
With respect to PACS’ future trail work: give timely updates on progress regarding the Lake Worth Trail, coordinate with Streams and Valleys (and Tarrant Regional Water District) about proposed new trails, and create trails that will serve a diversity of non-motorized uses and that follow sustainable design practices.
High Priority, but can be implemented in longer-term PACS is encouraged to expand innovative features as well as to message more broadly about
water quality demonstration project(s) already on site at the Fort Worth Nature Center.
Not High Priority, but desirable Traveling road show to visit local schools in the watershed to educate on water quality best
practices. Have special events highlighting the importance of water quality, e.g. promote at a paddle race
or fishing contest. Coordinate with the State of Texas’ existing program to promote agricultural heritage. This
program already provides education and may be able to incorporate best practices recommended from the Greenprint.
Have signs at the parks and Casino Beach that educate the public around history, the military, and water quality.
Work with White Settlement, Lake Worth, Azle, Eagle Mountain-Saginaw, Castleberry, and Fort Worth Independent School Districts to develop a competitive juniors (high school) rowing program housed at Casino Beach or another shoreline park.

LAKE WORTH GREENPRINT REPORT Page 36 of 116
6. CREATE LANDOWNER INCENTIVES
High Priority, and implementation desired in the near future Develop tax incentives to keep critical land in suitable low-impact uses.
7. UNDERTAKE ADDITIONAL PLANNING AND EVALUATION
High Priority, and implementation desired in the near future After major public expenditures around Lake Worth, City of Fort Worth to measure changes in
community perception and usage concerning the lake and its amenities at least once every two years.
As part of the annual update process, the City of Fort Worth Planning and Development Department should revise the City of Fort Worth’s Comprehensive Plan with Greenprint findings, such as where the water protection areas are located. First step will be to seek adoption by City Plan Commission and City Council in the fall of 2014.
Encourage development of an EPA-acceptable Watershed Protection Plan (WPP). Form a committee to create a plan to improve utilization of existing parkland on Lake Worth.
8. REGULATE FOR IMPROVED WATER QUALITY OUTCOMES
High Priority, and implementation desired in the near future Fort Worth Nature Center and City of Fort Worth to develop regulations to limit motorized
watercraft uses around the Fort Worth Nature Center. Jurisdictions in the watershed that don’t already have a parkland dedication ordinance (e.g.
Lakeside, Lake Worth, Parker County, and Tarrant County), are encouraged to consider creating a parkland dedication ordinance.
High Priority, but can be implemented in longer-term All jurisdictions that have municipal separate storm sewer systems, development permitting, or
development approval authority should develop a water protection overlay that triggers certain requirements for development within that overlay zone.
Preserve sensitive riparian corridors throughout the cities with an overlay zone. Develop a zoning overlay indicating the conceptual location for new trails (locations determined
by the Greenprint maps) and then work with developers to determine exact location of those trails through the development process.

LAKE WORTH GREENPRINT REPORT Page 37 of 116
CONSERVATION FINANCING Many opportunities exist to protect the Lake Worth watershed and to provide recreation amenities for residents and visitors. Jurisdictions within the watershed, including the cities of Fort Worth and Lake Worth and the Town of Lakeside, all have a potential role to play, as do Tarrant and Parker counties and state and federal conservation agencies. At the heart of the most successful conservation funding programs is a substantial, long-term, dedicated source of local revenue. With a reliable source of funds, local governments can establish meaningful conservation priorities that protect the most valuable resources and meet important goals and values. Local governments with significant funds are much better positioned to secure and leverage funding from federal governments and attract other local and state government or private philanthropic partners. Communities in Texas have traditionally been able to rely on a mix of funding due to the availability of state funding through the state recreation grants funded by the sporting goods tax allocation and local conservation funding measures. Because of the need to leverage funds, this report describes specific local funding opportunities, state funding sources, and federal programs that may be available for land acquisition, parks, and trails in the Lake Worth watershed. The full Conservation Finance Resource Options Report can be found in Appendix G. This report begins with a summary of two examples of jurisdictions using land acquisition for watershed protection followed by a history of local land conservation funding in Texas. Next, it analyzes local public funding tools available to the municipalities within the Lake Worth watershed including revenue generating capacity and estimated costs to taxpayers where relevant. Finally, the report provides a brief summary of numerous state and federal conservation programs that could potentially be leveraged to support projects within the Lake Worth watershed. These tools are summarized below.
Bonds. Bonds are far and away the most utilized tool for parks and conservation purposes by local governments in Texas, accounting for 90 of 99 measures on the ballot since 1996. The City of Fort Worth has ample debt capacity to issue general obligation bonds and levy property taxes to pay the debt service on the bonds. The city has a regular bond cycle and nine bond elections have been held since 1978. The citizens of Fort Worth voted to approve a $292 million bond program in May 2014. The City of Fort Worth could issue a general obligation bond outside of this regular process for pressing needs. A $70 million bond, for example, would cost the average household about $13 each year. Voter approval is required. Lake Worth and Lakeside also have capacity to issue bonds for parks and watershed protection purposes. A $1 million bond in Lake Worth would cost the average household about $13 each year. In Lakeside, a $100,000 bond would cost the average household about $12 each year. Bonds provide several advantages over pay-as-you-go funding, including the opportunity to make significant land acquisitions in the near term, before the price of land increases.

LAKE WORTH GREENPRINT REPORT Page 38 of 116
However, this mechanism is not always appropriate or feasible (e.g. typically bond proceeds may not be used for stewardship purposes).
Property tax. The property tax is the single largest revenue source for many local jurisdictions and the proceeds may be expended for parks and open space. However there is no authority by which a portion of the tax may be dedicated for this purpose, so expenditures are subject to the annual appropriations process. Elected officials in each of the three jurisdictions could impose a levy for parks and conservation purposes. For example, the City of Fort Worth could impose a tax of $0.021 per $100 and collect roughly $8.7 million at a cost of $20 a year to the average homeowner in the city. At the same price point, Lake Worth and Lakeside could generate roughly $125,000 and $13,000, respectively.
Sales and use tax. The Texas state sales and use tax rate is 6.25 percent, and local taxing jurisdictions (cities, counties, special purpose districts, and transit authorities) may impose sales and use tax up to 2 percent for a total maximum combined rate of 8.25 percent. Each of the municipalities in the study area is currently at the maximum allowable sales tax levy. As such, these jurisdictions may not impose an additional sales tax for parks and conservation, but they may allocate revenues and issue revenue bonds for such purposes. In Lakeside, the newly created Economic Development Corporation sales tax, approved by voters on May 13, 2013, may represent an opportunity to secure funding for parks projects in the near-term.
Impact fees. Pursuant to the Texas Code, impact fees for capital improvements must relate only to water, wastewater, flood control and roadways. As such, additional impact fee revenues may be accessed only for park acquisitions that are part of a project serving one of the aforementioned purposes, such as a project in partnership with the Fort Worth Water Department or Tarrant Regional Water District.
Special districts. Special districts are units of local government that provide specific services within a defined area, and are useful for addressing cross-jurisdictional issues. Special districts may be created to address a wide range of issues, including the development of parks, recreational facilities and landscaping; the conservation and preservation of land; and the protection of water and prevention of pollution. Many districts generate funds through taxation, bonds, special assessments, or user fees. Texas currently has 2,600 special districts, including the Tarrant Regional Water District.
Tax increment financing. A tax increment financing (TIF) district is a special purpose district designed to reinvest added tax revenue from new development back into the area where it originated. A TIF program is used to finance new public improvements in designated areas. The goal is to stimulate new private investment and thereby increase real estate values. Any increase in tax revenues (caused by new development and higher property values) is paid into a special TIF fund to finance improvements. Potential improvements include park and pedestrian malls, wider sidewalks, utilities, public landscaping, lighting, environmental remediation, demolition, historic façades, etc.
Oil and gas lease revenue. The City of Fort Worth and the Tarrant Regional Water District have a relatively unique revenue source in the form of oil and gas leases. A portion of these

LAKE WORTH GREENPRINT REPORT Page 39 of 116
revenues have been expended on capital improvement projects to protect and improve Lake Worth. There may be opportunities to propose additional projects in the watershed to be supported by this funding source.
CONCLUSION Lake Worth, created as a drinking water supply reservoir for the rapidly growing City of Fort Worth, is also highly appreciated for its scenic beauty and recreational activities. The Lake Worth watershed has long been an attractive place for people to live due to the region's wealth of natural beauty. The region currently has a combination of fast growing urban centers, agriculture and cattle lands, diverse and pioneering industry, and scenic natural areas. Today, approximately 100 years after its establishment, Fort Worth is one of the fastest growing metropolitan areas in the country, and the scenic qualities that have defined the region and provided a natural filtration system for the lake are at risk from impending development. With the primary goals of protecting water quality and enhancing recreational opportunities, the North Central Texas Council of Governments (NCTCOG) and The Trust for Public Land worked to develop this Greenprint. Along with a local citizen advisory committee (The Lake Worth Regional Coordination Committee) and technical experts, interviews and public poll informed common, local values around these two goals. Based upon the importance of watershed protection and recreation, this Greenprint sought to identify lands and areas of opportunity, but also presents action plan ideas for implementation. Citizens and elected officials alike understand the water quality risks and economic benefits development can bring. These can be balanced through a coordinated effort and diverse set of strategies, as outlined in the Greenprint. In addition to the protection and wise use of High Priority Water Quality Zones, identified as lands having the greatest potential for water quality protection, stewardship and other action plan ideas can be implemented to help maximize the protection and enhancement of water quality. Action plan ideas include the following topic areas:
1) Raise Funds to Support Action Plan Steps 2) Start a Voluntary Open Space Preservation Program 3) Gather More Information to Understand and Address Water Quality Problems 4) Develop or Enhance Local Government Program/Activities 5) Promote Education and Publicity 6) Create Landowner Incentives 7) Undertake Additional Planning and Evaluation 8) Regulate for Improved Water Quality Outcomes
The action plan ideas presented in this report were generated through an extensive participatory process. The Lake Worth Regional Coordination Committee, which developed this list, provided a wide range of near-term and longer-term ideas intended to help protect and improve water quality in Lake Worth.

LAKE WORTH GREENPRINT REPORT Page 40 of 116
In addition, this Greenprint also identified lands that help enhance opportunities for recreation. The benefits of open space, parks, and trails accrue to not only residents in the Lake Worth Watershed, who benefit from cleaner water, increased health benefits due to recreation access, and improved property values, but parks and trails can be an economic development tool that enhance quality of life for residents, provide cost savings to local governments, and revenues to local businesses. With a population projected to keep growing, development that reflects the goals and findings of this Greenprint can help to ensure a balance between accommodating growth, maintaining the lake’s water quality, and protecting the region’s outstanding character and natural amenities – for today’s residents and future generations.

LAKE WORTH GREENPRINT REPORT Page 41 of 116
APPENDIX A: USE OF THE L-THIA MODEL METHODOLOGY, ASSUMPTIONS, AND VALIDATION FOR USING THE
L-THIA MODEL TO ASSESS RELATIVE RUNOFF AND POLLUTANT
LOADING IN THE LAKE WORTH WATERSHED The Trust for Public Land considered various publicly available models that have been designed to measure the impacts of land use change on water quality. We determined that Purdue University’s Long Term Hydrologic Impact Analysis (L-THIA) model best fit the needs of this analysis.67 L-THIA is a simplified hydrologic assessment model for estimating broad-based runoff and pollutant load impacts of alternative land use configuration scenarios. The L-THIA model uses the USDA Natural Resource Conservation Service Curve Number (NRCS CN) methodology to approximate runoff and pollutant loading. The NRCS CN methodology is a common empirical approach used in hydrology for predicting direct runoff or infiltration from rainfall excess. Key inputs to the model are:
land use designations
hydrologic soil groupings event mean concentration estimates, and
reference storm event. Land use designations for Lake Worth Watershed analysis were based on 2010 land use dataset from North Central Texas Council of Governments (NCTCOG). Spatially distributed hydrologic soil groupings used for this analysis were provided by the NRCS Soil Survey Geographic Database (SSURGO) database. Event mean concentrations (EMC) values for this study were selected to be consistent with NCTCOG recommended EMCs for wet weather conditions (September – October) for north central Texas as determined by the NCTCOG regional stormwater monitoring program.68 The EMC’s were further refined to reflect specific impervious cover estimates for land use types exhibited in the Lake Worth watershed, as provided by the City of Fort Worth Planning and Development Department. The selection of an appropriate storm event to estimate water quality protection is based on recommendations from the NCTCOG Integrated Stormwater Management (iSWM) technical manual.69 The manual states “Hydrologic studies show smaller, frequently occurring storms account for the majority of rainfall events. Consequently, the runoff from the many smaller storms also accounts for a major portion of the annual pollutant loadings.” Therefore, the 85th percentile storm event (i.e., the storm event that is greater than 85 percent of the storms that occur) was used for
67 Harbor, J., Grove, M., Bhaduri, B. and Minner, M. 1998, "Long-Term Hydrologic Impact Assessment (L-THIA) GIS." Public Works, 129, p. 52-54. 68 Addendum to the Annual Regional Storm Water Monitoring Report, Estimates of Event Mean Concentrations and Seasonal Pollutant Loadings for North Central Texas, Monitoring Years 1 – 4 September 1997 – August 2000. Prepared by the North Central Texas Council of Governments, February 2001. 69 iSWM Technical Manual. 2010. Water Quality: 1.0 Water Quality Protection Volume and Peak Flow. 2.0 Construction of SWP3 Guidelines and Form.

LAKE WORTH GREENPRINT REPORT Page 42 of 116
this analysis. Based on the rainfall analysis, 1.5 inches of rainfall has been identified as the average depth corresponding to the 85th percentile storm for the NCTCOGs region. To test the validity of the L-THIA model results, the resulting relationship between change in percent impervious cover and percent change in runoff volume for a 1.5 inch stormwater event as produced by L-THIA for this analysis was then compared to a number of independent watershed studies within the City of Fort Worth. The comparison data was compiled by City of Fort Worth Stormwater Management. Figure 1 shows the results of this validation step. Note that the charted L-THIA values reflect the entire ETJ region of the Lake Worth Watershed. Figure 1. Relationship between change in percent impervious cover and percent change in runoff volume for a 1.5 inch stormwater event as produced by the L-THIA analysis (yellow circles), compared to independent watershed studies within the City of Fort Worth for a similar 1.5 inch events (blue diamonds).

LAKE WORTH GREENPRINT REPORT Page 43 of 116
APPENDIX B: ECONOMIC IMPACT REPORT70
ENHANCED PROPERTY VALUE AND INCREASED TAX REVENUES Study after study has shown that parks have a positive impact on nearby residential property values. All things being equal, most people are willing to pay more for a home close to a nice park. The property value added by park areas is separate from the direct recreational use value gained; property value goes up even if the resident never visits the park. Property value is affected primarily by two factors: the distance from, and the quality of, the park. While proximate value (“nearby-ness”) can be measured up to 2,000 feet from a park, most of the value – whether such spaces are large or small – is within the first 500 feet. Therefore, this analysis of enhanced property value has been limited to 500 feet. Moreover, people’s desire to live near a park also depends on the quality of the park. Beautiful natural resource areas with public access, scenic vistas, and bodies of water are markedly valuable. Those with excellent recreational facilities are also desirable, although sometimes the greatest property values are realized a block or two away if there are issues of noise, lights, or parking. Less attractive or poorly maintained parks may provide only marginal value to surrounding property values, and in some cases, these areas may actually reduce nearby property values. Determining an accurate view of every property next to every park is technically possible but prohibitively time-consuming and costly. Therefore, an extrapolative methodology was formulated to arrive at a reasonable estimate. This study includes a property value analysis for the Lake Worth Greenprint Study Area as well as the entire City of Fort Worth to give a complete picture of the enhanced property value and increased tax revenues generated by parks in the region. The results cannot be summed because the Lake Worth Greenprint Study Area contains portions of the City of Fort Worth. All homes within 500 feet of Fort Worth parks and public open spaces were identified. A home consists of a residential structure that is owned and taxed; thus, this analysis includes multi-family dwellings and single-family homes.71 In 2012, homes in the City of Fort Worth that were located within 500 feet of parks had a total market value of $5.20 billion. Homes in the Lake Worth Greenprint Study Area that were located within 500 feet of parks had a total market value of $139 million (Table 1). Typically, the amount that parks add to the value of a property is determined based on the quality of the park. That is, high quality parks add significant value, average quality parks add slight value, and low quality parks reduce value to surrounding residences. Data are not available to assess the quality of individual parks. Based on published literature results, the conservative value of 5 percent has been assigned as the amount that these parks add to the market value of all dwellings within 500 feet of parks.72 A 2009 report from the National Association of REALTORS® found the premium for homes near parks can extend three blocks and start at 20 percent for those homes directly adjacent (declining with distance from the park).73 A recent report in Houston, Texas estimated a 5 percent
70 The economic analyses performed for this report are based on existing data only. Report authors did not estimate economic value based on projected data or future land-use scenarios. 71 Other property types were not considered in this analysis because sufficient data are not available to quantify the benefit. Non-residential property types are rarely studied in the literature as they are much more difficult to statistically analyze because there are more variables that influence value and fewer real estate transactions to compare. 72 John L Crompton, The Proximate Principle: The Impact of Parks, Open Space and Water Features on Residential Property Values and the Property Tax Base (Second Edition, Ashburn, Virginia: National Recreation and Park Association, 2004). 73 National Association of REALTORS©, On Common Ground (Winter 2009).

LAKE WORTH GREENPRINT REPORT Page 44 of 116
premium for homes within 600 feet (approximately three blocks) of a park or greenway.74 This analysis estimates that an increase of $260 million in residential property value existed in 2012 because of proximity to parks in the City of Fort Worth, and $6.95 million in the Lake Worth Greenprint Study Area (Table 1). The residential property tax rates for each parcel were used to determine how much additional tax revenue was raised by local units of government. Property tax rates differ by parcel depending on the city, town, or district in which they are located. The total value captured in additional property tax revenue derived from parks is $5.82 million each year in the City of Fort Worth, and $144,000 in the Lake Worth Greenprint Study Area (Table 1). These estimates are conservative for the following reasons. First, the estimates leave out all the value of dwellings located beyond 500 feet from a park even though evidence exists for marginal property value beyond such distances. Second, as mentioned, they only measure a 5 percent marginal value for parks though studies have shown up to a 20 percent premium and marginal values up to distances of 2,000 feet.75 Therefore, these estimates provide a lower bound estimate of the “true” impact of parks on property values.
Table 1. Enhanced residential property value due to proximity to parks
Total market
value within 500 feet of parks
Market value premium
Additional market value due
to parks
Additional annual property tax
revenue due to parks
City of Fort Worth
$5,200,000,000 5% $260,000,000 $5,820,000
Lake Worth Greenprint Study Area
$139,000,000 5% $6,950,000 $144,000
Please note: these figures cannot be summed as they partially overlap geographically.
Based on published literature results, the conservative value of 5 percent has been assigned as the amount that these parks add to the market value of all dwellings within 500 feet of parks. Source: John L Crompton, The Proximate Principle: The Impact of Parks, Open Space and Water Features on Residential Property Values and the Property Tax Base (Second Edition, Ashburn, Virginia: National Recreation and Park Association, 2004).
DIRECT RECREATIONAL USE VALUE The City of Fort Worth’s parks and public open spaces provide direct recreational value by offering residents access to spaces where they can enjoy nature or observe wildlife, walk on trails, use playgrounds, picnic or sit on benches, or bike, among others activities. The City of Fort Worth owns
74 John Crompton, "Estimates of the Economic Benefits Accruing From an Expansion of Houston's Bayou Greenway Network" (Journal of Park and Recreation Administration 30, no. 4, 2012, pp. 83-93). 75 National Association of REALTORS©, On Common Ground (Winter 2009); John L Crompton, The Proximate Principle: The Impact of Parks, Open Space and Water Features on Residential Property Values and the Property Tax Base (Second Edition, Ashburn, Virginia: National Recreation and Park Association, 2004). John Crompton, "Estimates of the Economic Benefits Accruing From an Expansion of Houston's Bayou Greenway Network" (Journal of Park and Recreation Administration 30, no. 4, 2012, pp. 83-93).

LAKE WORTH GREENPRINT REPORT Page 45 of 116
and operates parks and public open spaces in or near Fort Worth, Lake Worth, and Lakeside. This study analyzes the direct recreational use value to residents of these communities. Most direct recreational uses in parks and public open spaces, such as those in the City of Fort Worth, are free of charge, but economists can still calculate value by determining the consumer’s “willingness-to-pay” for the recreation experience in the private marketplace. In other words, if parks and public open spaces were not available in the City of Fort Worth, how much would the resident (or “consumer”) pay for similar experiences in commercial facilities or venues? Rather than income, the direct use value represents the amount of money residents save by not having to pay market rates to indulge in the park activities they enjoy. Any user fees that are paid for a recreational experience within the City of Fort Worth’s parks and public open spaces are subtracted from the willingness-to-pay value. The model for quantifying the benefits received by direct users is based on the “Unit Day Value” method as documented in the Water Resources Council (WRC) Recreation Valuation Procedures written by the U.S. Army Corps of Engineers. The Unit Day Value model counts park visits by specific activity, assigning each activity a dollar value. Based on the WRC day use values, a range of $2 to $9 per visit is used for general park or public open space use (e.g., playing in a playground, hiking, biking) and $10-$40 for specialized activities (e.g., golf).76 In quantifying these benefits, The Trust for Public Land also recognized that not every visit within a given period of time has the same value to the visitor. In fact, additional uses of a park or public open space will be less valuable than the first use. For example, the value of walking on trails diminishes from $2.00 for the first time to $1.50 for the tenth time in a month. For activities for which a fee is charged, like golfing at a City of Fort Worth golf course, the per-person fee is subtracted from the total value and only the “extra value” is assigned (e.g., if playing golf costs an average of $19 at a City of Fort Worth public golf course and an average of $54 at golf courses operated by other entities,77 the direct use value would be $35). The Trust for Public Land then determined the number of visits to City of Fort Worth parks and public open space facilities through a professionally conducted telephone survey of 598 residents of Fort Worth, Lake Worth, and Lakeside.78 This random-digit-dialed survey had an accuracy level of plus or minus 4 percent. Residents were asked to answer for themselves; adults with children under the age of 18 were also asked to respond for one of their children. The result of the Direct Use Calculator for Fort Worth, Lake Worth, and Lakeside is $16.1 million for 2013 (Table 2). The survey also indicated that the most popular activities for children were visiting a playground and riding bicycles, followed by enjoying nature, exploring, or viewing wildlife. For adults, walking or hiking was followed by enjoying nature, and picnicking or sitting. The top three activities for adults and children together are shown in Table 3. These results are generally consistent with previous
76 The published ranges for FY 2012 are $3.72 to $11.17 for general recreation and $15.13 to $44.21 for specialized recreation. The minimum value for city park uses is $2 to accommodate lower values associated with some high frequency, short duration activities, such as daily walks in the park. General recreation refers to activities that are attractive to a majority of users. Specialized recreation refers to activities which involves a high degree of skill, knowledge, and appreciation of the activity. 77 Fort Worth, “Welcome to Fort Worth Golf” (accessed November 27, 2013, http://www.fortworthgolf.org/sites/courses/custom.asp?id=413&page=11535); Timberview Golf Club, “Location / Rates” (accessed November 27, 2013, http://www.timberviewgolf.com/?page_id=30); The Golf Club at Champions Circle, “Champions Circle Golf Rates” (accessed November 27, 2013, http://www.championscirclegolf.com/golf-rates.html); Personal communication with Jason Heitschmidt, Waterchase Golf Club, November 27, 2013; Personal communication with Kevin Moltenbrey, Golf Club Fossil Creek, November 27, 2013. 78 Barry Zeplowitz and Associates (November 2013).
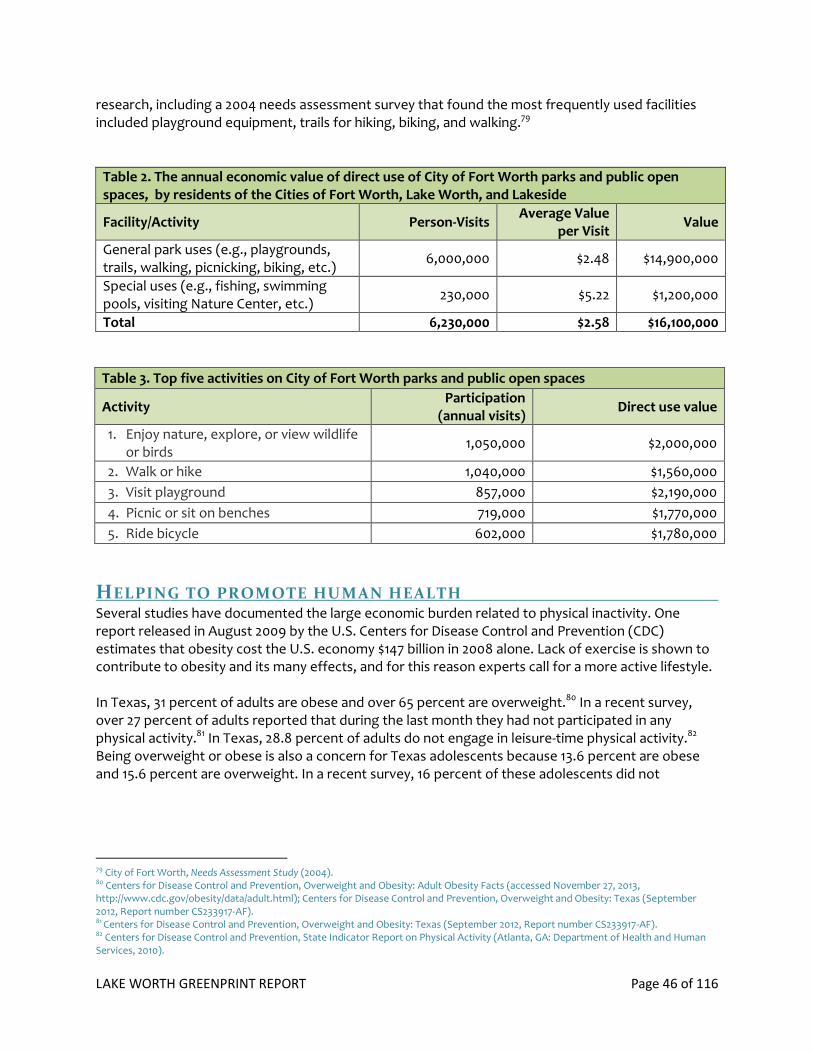
LAKE WORTH GREENPRINT REPORT Page 46 of 116
research, including a 2004 needs assessment survey that found the most frequently used facilities included playground equipment, trails for hiking, biking, and walking.79
Table 2. The annual economic value of direct use of City of Fort Worth parks and public open spaces, by residents of the Cities of Fort Worth, Lake Worth, and Lakeside
Facility/Activity Person-Visits Average Value
per Visit Value
General park uses (e.g., playgrounds, trails, walking, picnicking, biking, etc.)
6,000,000 $2.48 $14,900,000
Special uses (e.g., fishing, swimming pools, visiting Nature Center, etc.)
230,000 $5.22 $1,200,000
Total 6,230,000 $2.58 $16,100,000
Table 3. Top five activities on City of Fort Worth parks and public open spaces
Activity Participation
(annual visits) Direct use value
1. Enjoy nature, explore, or view wildlife or birds
1,050,000 $2,000,000
2. Walk or hike 1,040,000 $1,560,000
3. Visit playground 857,000 $2,190,000
4. Picnic or sit on benches 719,000 $1,770,000
5. Ride bicycle 602,000 $1,780,000
HELPING TO PROMOTE HUMAN HEALTH Several studies have documented the large economic burden related to physical inactivity. One report released in August 2009 by the U.S. Centers for Disease Control and Prevention (CDC) estimates that obesity cost the U.S. economy $147 billion in 2008 alone. Lack of exercise is shown to contribute to obesity and its many effects, and for this reason experts call for a more active lifestyle. In Texas, 31 percent of adults are obese and over 65 percent are overweight.80 In a recent survey, over 27 percent of adults reported that during the last month they had not participated in any physical activity.81 In Texas, 28.8 percent of adults do not engage in leisure-time physical activity.82 Being overweight or obese is also a concern for Texas adolescents because 13.6 percent are obese and 15.6 percent are overweight. In a recent survey, 16 percent of these adolescents did not
79 City of Fort Worth, Needs Assessment Study (2004). 80 Centers for Disease Control and Prevention, Overweight and Obesity: Adult Obesity Facts (accessed November 27, 2013, http://www.cdc.gov/obesity/data/adult.html); Centers for Disease Control and Prevention, Overweight and Obesity: Texas (September 2012, Report number CS233917-AF). 81 Centers for Disease Control and Prevention, Overweight and Obesity: Texas (September 2012, Report number CS233917-AF). 82 Centers for Disease Control and Prevention, State Indicator Report on Physical Activity (Atlanta, GA: Department of Health and Human Services, 2010).

LAKE WORTH GREENPRINT REPORT Page 47 of 116
participate in at least 60 minutes of physical activity on any day during the week prior to the survey.83 According to the CDC, only 25.7 percent of students in high school are physically active.84 For over a decade, research has suggested that access to parks can help people increase their level of physical activity.85 The Trust for Public Land’s Health Benefits Calculator measures the collective economic savings realized by adult residents of Fort Worth, Lake Worth, and Lakeside who use the City of Fort Worth’s parks and public open spaces to exercise regularly. The Trust for Public Land created the calculator by identifying the common types of medical problems that are inversely related to physical activity, such as heart disease and diabetes. Based on previous work in health care economics, The Trust for Public Land assigned a value of $329 as the annual medical cost difference between those who exercise regularly and those who do not.86 Health care costs are often much higher for older adults. For example, while the elderly made up around 13 percent of the U.S. population in 2002, they accounted for 36 percent of total U.S. personal health care expenses.87 In one study of health spending trends, average health care expenses were $3,350 for working-age people, but $11,100 for adults over 65 years old.88 For persons over the age of 65, the annual medical cost difference between those who exercise regularly and those who do not has been doubled from $329 to $658 because adults over 65 years old typically incur two or more times the medial care costs of younger adults.89 The key data input for determining medical cost savings is the number of park and public space users who engage in a sufficient amount of physical activity. The CDC defines this as at least 150 minutes of moderate activity per week or at least 75 minutes of vigorous activity per week. The same telephone survey that was used in the direct recreational use valuation also determined residents’ activities and
83 Centers for Disease Control and Prevention, Overweight and Obesity: Texas (September 2012, Report number CS233917-AF). 84 Centers for Disease Control and Prevention, State Indicator Report on Physical Activity (Atlanta, GA: Department of Health and Human Services, 2010). 85 K.E. Powell, L.M. Martin, and P.P. Chowdhury, “Places to Walk: Convenience and Regular Physical Activity” (American Journal of Public Health 93, no. 9, 2003, pp. 1519-1521); B. Giles-Corti and R.J. Donovan, “The Relative Influence of Individual, Social, and Physical Environment Determinants of Physical Activity” (Social Science and Medicine 54, 2002, pp. 1793-1812). 86 M. Pratt, C.A. Macera, and G. Wang, “Higher Medical Costs Associated with Physical Inactivity” (Physician and Sportsmedicine 28, 2000, pp. 63-70); D.W. Edington, and L. Yen, “Is It Possible to Simultaneously Reduce Risk Factors and Excess Health Care Costs?” (American Journal of Health Promotion 6, 1992, pp. 403-409); F. Wang, T.L. McDonald, L. Champagne, and D. Edington, “Relationship of Body Mass Index and Physical Activity to Health Care Costs among Employees” (Journal of Occupational and Environmental Medicine 46, no. 5, 2004, pp. 428-436); Milliman & Robertson, Chrysler Corporation, and the International Union of Auto Workers, Health Risks and Their Impact on Medical Costs (1995); N.P. Pronk, M.J. Goodman, P.J. O’Connor, and B.C. Martinson, “Relationship between Modifiable Health Risks and Short-Term Health Care Charges” (Journal of the American Medical Association 282, 1999, pp. 22235-2239); Chenoweth & Associates, Inc. [Health Management Associates], The Economic Costs of Physical Inactivity, Obesity, and Overweight in California Adults: 2000 (prepared for the California Department of Health Services, 2000); Chenoweth & Associates, Inc. [Health Management Associates], The Financial Cost of Various Risk Factors among Massachusetts Adults: 2003 (prepared for the Massachusetts Department of Public Health); Chenoweth & Associates, Inc. [Health Management Associates], The Financial Cost of Physical Inactivity Among Michigan Adults: 2003 (prepared for the Michigan Fitness Foundation, Lansing, MI); D.H. Chenoweth, “The Economic Cost of Physical Inactivity in New York State” (American Medical Athletic Association Quarterly 14, no 2, 2000, pp. 5-8); Chenoweth & Associates, Inc. [Health Management Associates], The Economic Cost of Physical Inactivity, Obesity, Type II Diabetes, and Low Fruit/Vegetable Intake Among North Carolina Adults (prepared for Be Active North Carolina, Inc., 2004); D.H. Chenoweth, “The Medical Cost of High Serum Cholesterol in Harris County, Texas” (The Journal of Texas Medicine 100, no. 5, 2004, pp. 49-53); Chenoweth & Associates, Inc. [Health Management Associates], The Economic Cost of Physical Inactivity Among Washington State Adults (prepared for The Washington State Department of Health and The Washington Coalition to Promote Physical Activity, 2004). 87 Agency for Healthcare Research and Quality, U.S. Department of Health and Human Services, “The High Concentration of U.S. Health Care Expenditures” (accessed September 18, 2013, http://www.ahrq.gov/research/findings/factsheets/costs/expriach/index.html#HowAre). 88 Sean P. Keehan, Helen C. Lazenby, Mark A. Zezza, Aaron C Catlin, “Age Estimates in the National Health Accounts” (Health Care Financing Review, Vol. 1, Number 1, Web Exclusive, December 2, 2004). 89 Ronald McDevitt and Sylvester Schieber, From Baby Boom to Elder Boom: Providing Health Care for an Aging Population (Washington, D.C.: Watson Wyatt Worldwide, 1996).

LAKE WORTH GREENPRINT REPORT Page 48 of 116
their frequency, grouped by age. In accordance with CDC guidelines, The Trust for Public Land eliminated low heart-rate activities (e.g., picnicking, sitting, and wildlife watching) as well as respondents who engaged in strenuous activities fewer than three times per week on average because they were not being active enough to gain a health benefit. Likewise, The Trust for Public Land removed respondents who engaged in less strenuous but still healthful activities (e.g., walking or hiking) fewer than four times per week on average. The remaining users engaged in enough physical activity to warrant health care cost savings. The results of this survey indicate that approximately 40,500 adult residents of Fort Worth, Lake Worth, and Lakeside improve their health using City of Fort Worth parks and public open spaces. In 2013, the combined health savings from park and public open space use for the adult residents of Fort Worth, Lake Worth, and Lakeside was $13.9 million (Table 4).90
Table 4. Estimated annual health benefits of physical activity by residents of the Cities of Fort Worth, Lake Worth, and Lakeside in City of Fort Worth parks and public open spaces
Adults 18- 64 Years of Age
Average annual medical care cost difference between active and inactive persons between 18 and 64 years old
$329
Number of adults (18-64) physically active in parks* 38,700
Subtotal of health care benefits $12,700,000
Adults 65 Years of Age and Older
Average annual medical care cost difference between active and inactive persons over 65 years old
$658
Number of adults (65+) physically active in parks* 1,850
Subtotal of health care benefits $1,220,000
Total annual value of health benefits from parks $13,900,000
Total adults active in parks 40,500
*Calculations are based on persons engaging in moderate or vigorous activity as defined by the CDC.
90 Only residents of Cuyahoga County were surveyed. Therefore, the results cannot be extrapolated to Hinckley Township; however, the use of Cleveland Metroparks trails and parks by Hinckley residents would increase the annual value of health benefits.

LAKE WORTH GREENPRINT REPORT Page 49 of 116
APPENDIX C: TELEPHONE POLL RESULTS
METHODOLOGY These findings are drawn from a survey of a random sample of 300 registered voters in Fort Worth, as well as an additional 35 interviews in the Lake Worth study area. The survey was conducted by Public Opinion Strategies. Interviews were collected June 11‐13, 2013. The survey has an overall margin of error of + 5.35 percent in 95 out of 100 cases. A Note on the Sample: Interviews were conducted so that the sample matched the registered voting population by voting precinct, age, gender, and ethnicity.
KEY FINDINGS
1) Residents are very positive about the direction of the Fort Worth area. Fully 74 percent of residents say things in the Fort Worth area are headed in the right direction, while just 16 percent say they are off on the wrong track. Men, younger voters, and Democrats are most optimistic about the way things are going.
2) Maintaining and protecting the quality of the area’s drinking water is the top priority for area residents. We tested a number of different features that are incorporated into the Lake Worth vision plan and other community plans. Residents were then asked how important each of these features was to them personally. Maintaining the quality of drinking water and protecting drinking water sources topped the list. Other priorities such as maintaining roads and protecting property values also tested well, but did not match the intensity of the priorities focused on water quality.
Top Priorities Ranked by % Extremely Important
Priority % Extremely Important
% Very Important
% Total Important
Maintaining quality of drinking water 65% 33% 98%
Protecting drinking water sources and water quality 61% 37% 98%
Maintaining roads 40% 51% 91%
Protecting property values 36% 47% 83%
Protecting wetlands and areas that act as natural filters for water run‐off
35% 47% 82%
Ensuring there are plenty of natural areas where children can play
35% 43% 78%
Attracting and retaining quality employers to the country
34% 47% 81%

LAKE WORTH GREENPRINT REPORT Page 50 of 116
3) A significant majority of voters would support funding to acquire lands to protect drinking water sources and water quality. Respondents in the City of Fort Worth were asked if they would support a general obligation fund, where the funds raised would be devoted to acquiring lands to protect drinking water sources and water quality. Fully 82 percent of voters said they would favor this type of bond, compared to only 14 percent who said they would oppose. Intensity is especially strong, as 49 percent said they would strongly favor this type of measure.
4) When asked to give the overall health of the water in Lake Worth, voters give the Lake underwhelming marks. 35 percent of voters gave the overall health of the water in Lake Worth a grade of A or B, while 41 percent gave the Lake a grade of C, D, or F. The remaining 24 percent of voters said they did not know or were unsure about what grade to give the health of the water in Lake Worth.
5) A small number of residents are regular visitors to Lake Worth. Just 9 percent of residents say they visit Lake Worth at least once a month, compared to 20 percent who go a few times a year, 23 percent who say they go once every few years, and a close to half (47 percent) who say they have never visited Lake Worth.
6) Despite just a small percentage of the population regularly visiting the Lake, Residents still see Lake Worth as important to the community and as a great place for recreation and relaxation. While just 9 percent of residents say they visit Lake Worth at least once a month, residents still have very positive perceptions of Lake Worth and its role in the community. More than two‐thirds (69 percent) of residents say that Lake Worth is very important to people in the community, and 68 percent say that the Lake is a great place for recreation and relaxation.
7) Residents would like to see protected natural areas, trails, and public parks around Lake Worth. Respondents were read descriptions of several types of development and different features that could be in the area around Lake Worth, and then asked if they would support or oppose that particular feature being included in the plans for Lake Worth. Topping the list with significant majorities of residents strongly supporting their inclusion were protecting natural areas with some public access (61 percent strongly support) and incorporating trails and public parks, similar to White Rock Lake in Dallas (58 percent strongly support).
Developments/Features Ranked by % Strongly Support
Development/Feature % Strongly Support % Total Support
Protected natural areas 61% 92%
Trails and public parks 58% 88%

LAKE WORTH GREENPRINT REPORT Page 51 of 116
Table continued on next page...
Development/Feature (Continued) % Strongly Support
(Continued) % Total Support
(Continued)
Single family neighborhoods 44% 80%
Small town squares 41% 79%
More walkable, compact districts 38% 73%
Restaurants on the lakeshore 35% 75%
Town centers 30% 66%
Mixed use neighborhoods 29% 68%
Hotels, lodges, resorts, and retreats 25% 62%
8) There is a strong conservation ethic among voters.
Respondents were asked a series of general values statements that pertain to some of the elements which could be included in the Lake Worth and other community plans, and then asked if they agreed or disagreed with that statement. The top four messages all contained some type of conservation element.
Top Priorities Ranked by % Extremely Important
Value Statement % Strongly
Agree
% Somewhat
Agree
% Total Agree
By protecting natural areas, we help protect our rivers, streams, and the sources of drinking water.
65% 33% 98%
We owe it to our children and grandchildren to continue the legacy of protecting our natural areas, water, and wildlife so that future generations can enjoy them the same way we do.
61% 37% 98%
Having neighborhood parks, clean water, and a strong quality of life helps ensure we keep up property values.
40% 51% 91%
Protecting land around rivers, lakes, and streams helps to preserve water quality, protects lake, river, and stream banks from erosion, and provides food and habitat for fish and wildlife.
36% 47% 83%
THE BOTTOM LINE Residents are optimistic about the way things are going in the Fort Worth area and have a generally positive view of Lake Worth and its importance to the community. Residents believe that any additional development in the Lake Worth area must first ensure that the quality of the drinking water is protected. Once continued clean water is assured, residents would like the focus of additional development to be on protected natural areas with some public access, public trails, and public parks.

LAKE WORTH GREENPRINT REPORT Page 52 of 116
APPENDIX D: STAKEHOLDERS AND COMMITTEES A special thanks to all committee members, technical advisors, and interviewees who took the time to participate.
LAKE WORTH REGIONAL COORDINATION COMMITTEE (LWRCC)
LWRCC Chairman:
Dennis Shingleton District 7 Councilmember
Local Government Representatives:
J.D. Johnson Commissioner, Tarrant County
Designated county representative
Brett McGuire City Manager, City of Lake Worth
Mark Riley Parker County Judge
Jim Wietholter District 7 City Plan Commissioner, City of Fort Worth
Randy Whiteman Town Administrator, Town of Lakeside
Watershed Neighborhood Leaders:
Gale Cupp President, Neighborhood Association on South Lake Worth
Michael Barnard President, North Lake Worth Neighborhood Association
*Michael Dallas President, Scenic Shores Neighborhood Association
* Patricia Hyer President, East Lake Worth Neighborhood Association
Diane Smith City of Lake Worth resident
Jim Smith City of Lake Worth resident
* Joe Waller President, Lake Worth Alliance
Major Property Owners:
*Kenneth Davis, P.E. Cassco Land Co., Inc. representative
Vice President, Pape-Dawson Engineers, Inc.
Robert (Bob) Manthei Regulatory Affairs Coordinator, XTO Energy Inc.
Natural gas industry representative
Paxton Motheral Vice President, Cassco Land Co., Inc.
Crawford Edwards representative
Doug Woodson Hickman Investment, Ltd.

LAKE WORTH GREENPRINT REPORT Page 53 of 116
Nonprofit and Other Stakeholders:
Darrell Andrews Environmental Director, Tarrant Regional Water District (TRWD)
Mark Ernst Water Quality Manager, Tarrant Regional Water District
Tom Huffhines Dunaway Associates
*Lee Nicol Partner, Harris Nicol & Welborn Development Partners LLC.
Developer representative
Stacey Pierce Streams and Valleys, Inc.
Rick Shepherd President, Friends of the Fort Worth Nature Center and Refuge, Inc.
Ex Officio Members:
Captain Robert Bennett Commanding Officer, NAS Fort Worth, Joint Reserve Base
Tamara Cook Manager of Environment and Development, North Central Texas
Council of Governments (NCTCOG)
*Rachel Wiggins Community Plans and Liaison Officer, NAS Fort Worth, Joint Reserve
Base
* Lake Worth Watershed Action Plan Ideas Subcommittee Members

LAKE WORTH GREENPRINT REPORT Page 54 of 116
TECHNICAL ADVISORY TEAMS Water Quality
Paul Bounds Fort Worth Water Department
George Conley Parker County
Clair Davis Fort Worth, Transportation and Public Works [Flood Plains]
Mark Ernst Tarrant Regional Water District
Eric Fladager Comprehensive Planning Manager, City of Fort Worth
Bill Fox Texas AgriLife
Becca Grassl-Petersen Tarrant Public Health
Tina Hendon Tarrant Regional Water District
Ken Klaveness Trinity Waters
Brett McGuire City of Lake Worth
Tracy Michel NCTCOG
Alice Moore Tarrant County
Ranjan Muttiah Fort Worth, Stormwater
Rachel Wiggins NAS Fort Worth, Joint Reserve Base
Kyle Wright NRCS
Recreation and Trail Connectivity
Sam Adamie Tarrant County Public Health
Paul Bounds Fort Worth Water Department
Lou Brewer Tarrant County Public Health
Clair Davis Fort Worth, Flood Plains
Brett McGuire City of Lake Worth
Tracy Michel NCTCOG
Alice Moore Tarrant County
Eric Seebock Fort Worth, Parks & Community Services
Nikki Sopchak Fort Worth, Parks & Community Services
Suzanne Tuttle Fort Worth Nature Center
Randy Whiteman City of Lakeside
Rachel Wiggins NAS Fort Worth, Joint Reserve Base
Kyle Wright NRCS

LAKE WORTH GREENPRINT REPORT Page 55 of 116
INTERVIEWEES In April and May 2013, approximately 42 people were interviewed; those interviewed represented a broad range of stakeholder interests in the Lake Worth watershed area. These interviewees offered advice and feedback about current activities in the watershed, provided information about a variety of political constraints and opportunities, and informed preliminary recommendations for stakeholder review and refinement. Darrell Andrews Tarrant Regional Water District
Michael Barnard North Lake Worth Neighborhood Association
Paul Bounds Fort Worth Water Department
Tom Burrell Our Lands and Water Foundation
Larry Colvin Fort Worth Mountain Bikers Association
George Conley Parker County Commissioner
Fernando Costa Fort Worth Assistant City Manager
David Creek Fort Worth Parks & Community Services
Gale Cupp Neighborhood Association on South Lake Worth
Michael Dallas Scenic Shores Neighborhood Association
Clair Davis Fort Worth Flood Plain Administrator
Kenneth Davis Cassco Land Co.
Mark Dawson Sasaki Associates
Mark Ernst Tarrant Regional Water District
Jim Finley Finley Resources
Rodney Franklin Texas Parks and Wildlife
James Frisinger US Army Corps of Engineers
Tom Huffhines Greater Fort Worth Real Estate Council
Patricia Hyer East Lake Worth Neighborhood Association
Ken Johnson Tarrant County Extension
Ken Klaveness Trinity Waters
Robert Manthei XTO Energy Inc.
Brett McGuire Lake Worth City Manager
Laura Miller Tarrant County Extension
Lee Nicol Harris Nicol & Welborn Development Partners
Mike Petter Texas Agricultural Land Trust
Jason Pierce Upper Trinity Conservation Trust
Eric Seebock Fort Worth Parks & Community Services
Rick Shepherd Friends of Fort Worth Nature Center & Refuge
Dennis Shingleton Fort Worth Council member
Nikki Sopchack Fort Worth Parks & Community Services
Mark Steinbach Texas Land Conservancy
Dana Tarter Tarrant County Extension
LAKE WORTH GREENPRINT REPORT Page 56 of 116
RJ Taylor Connemara Conservancy
Steve Townsend Tarrant County
Suzanne Tuttle Fort Worth Nature Center
Joe Waller Lake Worth Alliance
Randy Whiteman Lakeside Town Administrator
Rachel Wiggins NAS Fort Worth, Joint Reserve Base
Doug Woodson Hickman Investments
Valerie Yoakam Jay Streams and Valleys
Richard Zavala Fort Worth Parks & Community Services

LAKE WORTH GREENPRINT REPORT Page 57 of 116
APPENDIX E: LAKE WORTH GREENPRINT MODELS’
CRITERIA AND WEIGHTING HIGH PRIORITY WATER QUALITY ZONES GREENPRINT MODEL
Goal 1 of 3: High Priority Water Quality Zones
Weighting Rationale: mapping criteria were weighted based on a functionally balanced approach derived by the Technical Advisory Team, with the following functional groupings:
Nutrient Uptake - Riparian Vegetation, Wetlands (total = 33%)
Erosion Prevention - Steep Stream banks, Erodible Soils, Steep slopes (total = 33%)
Multiple Benefits - Canopy Cover, Native Vegetation, Floodplains and Buffers (total = 34%)
Priority areas within 1000 feet of Lake Worth were given extra weight to reflect sediment delivery to the reservoir based on distance to the waterbody
Criteria Criteria Weight
Methodology Data
(Description, Date)
Data Source
Riparian Vegetation
20% High priority (5) is assigned to all categories of Riparian and Floodplain forest, shrubland, and vegetation except for floodplain herbaceous vegetation. Medium priority (3) assigned to Floodplain Herbaceous Vegetation -- Floodplains of the region that lack a significant overstory or shrub canopy, but retain cover in the herbaceous layer. Non-native grass species such as Bermuda grass and Johnson grass may frequently dominate this vegetation type, and scattered shrubs such as mesquite and juniper are common. Eastern gamagrass or switchgrass may dominate some lowland sites.
2006 10-meter ecological systems land cover
Texas Parks & Wildlife Department (TPWD)
Steep Slopes
11% Prioritize steep slopes using digital elevation models (DEMs). A natural breaks reclassification is applied to the slope map to derive the breaks shown below. High priority (5) = > 28% slope Medium to High priority (4) = 16 - 28% slope Medium priority (3) = 9 - 16% slope Medium to low priority (2) = 4 - 9% slope Low priority (1) = < 4% slope
30-meter Digital Elevation Model (DEM) 2009 Contours 2009 High resolution DEM
US Geological Service (USGS) Texas Natural Resource
Steep Stream and Lake Banks
11% A contour line density analysis within a 100 foot stream and lake buffer is used to locate steep stream and lake banks. A natural breaks classification is used to prioritize the banks. The steeper the stream or lake bank the higher the protection priority. High resolution contour lines were used for Tarrant County, but were not available for Parker County. As a surrogate lower resolution contour lines were used for Parker County.
High-resolution Contours for Tarrant County
2009 Contours
2009 High res. DEM
City of Ft. Worth US Geological Service (USGS)

LAKE WORTH GREENPRINT REPORT Page 58 of 116
Criteria Criteria Weight
Methodology Data
(Description, Date)
Data Source
Floodplains and Buffers
15% Riparian water quality protection buffers were delineated using methodology adapted from City of Austin's water quality protection zones. Riparian buffers coincide with the boundaries of the 100 year flood plain, except: (a) for a minor waterway, the buffer is located not less than 50 feet and not more than 100 feet from the centerline of the waterway; (b) for an intermediate waterway, the buffer is located not less than 100 feet and not more than 200 feet from the centerline of the waterway; (c) for a major waterway, the buffer is located not less than 200 feet and not more than 400 feet from the centerline of the waterway. Lake Worth water quality protection buffers were delineated using methodology adapted from the article "Crafting a Lake Protection Ordinance" by Karen Cappiella and Tom Schueler, which includes (a) A Shoreline Protection Buffer which extends 300 ft. from the lake high water mark (HWM). This buffer was assigned highest protection priority (5). (b) A Shoreland Protection Area which extends 300 to 1000 feet from the lake HWM. This buffer was assigned medium-high priority (4).
100-year floodplain High-resolution National Hydrography Dataset (NHD)
Federal Emergency Management Agency (FEMA) US Geological Service (USGS)
Wetlands 13% High priority (5) is given to wetlands buffered by 100 feet.
Wetlands 2006 10-meter ecological systems land cover Landuse (parcel-based)
National Wetland Inventory (NWI)
Soils with Slow Infiltration
3% Soils with slow infiltration rates and shallower areas are more susceptible to runoff and therefore have a higher need for protection. Soil characteristics were examined within applicable buffers from waterways and water bodies (1000 feet for Lake Worth, 400 feet for major waterways, 200 feet for intermediate waterways, and 100 feet for minor waterways) High priority (5) = hydro groups D (Slow or very slow infiltration rates. Soils with layers impeding downward movement of water, or soils that have moderately fine or fine textures. Soils are clayey, have a high water table, or are shallow to an impervious layer.) Medium to High priority (4) = hydro group C (Moderate infiltration rates. Deep and moderately
Soils survey hydro groups High-resolution National Hydrography Dataset (NHD)
Natural Resources Conservation Service's Soil Survey Geographic Database (SSURGO) US Geological Service (USGS)

LAKE WORTH GREENPRINT REPORT Page 59 of 116
deep, moderately well and well drained soils that have moderately coarse textures.) Medium priority (3) = hydro group B (High infiltration rates. Soils are deep, well drained to excessively drained sands and gravels.)
Criteria Criteria Weight
Methodology Data
(Description, Date)
Data Source
Erodible Soils
11% Prioritize* erodible soils using the SSURGO "K-factor", which is an estimated value of soil erosion. Soil characteristics were examined within applicable buffers from waterways and water bodies (1000 feet for Lake Worth, 400 feet for major waterways, 200 feet for intermediate waterways, and 100 feet for minor waterways). High priority (5) = 0.37, 0.43, 0.49 (K-factor) Medium to High priority (4) = 0.28, 0.32 Medium priority (3) = 0.17, 0.24 *Thresholds adopted from the Lake Arlington & Lake Lewisville Greenprint Water Quality Analysis.
Soils survey High-resolution National Hydrography Dataset (NHD)
Natural Resources Conservation Service's Soil Survey Geographic Database (SSURGO) US Geological Service (USGS)
Canopy Cover
15% Prioritize areas with canopy cover including developed (urban) areas. High priority (5) = Tree cover 60% to100%, Developed- upland deciduous forest, Developed-upland evergreen forest, Developed-upland mixed forest Medium to High priority (4) = Tree cover 30% to 60% Medium priority (3) = Tree cover 10% to 30%
2010 Landfire US Forest Service & Department of the Interior
Native Vegetation
4% Prioritize* native vegetation. The more native the vegetative cover (e.g. forested riparian zones), the greater the value for water quality protection. High Priority (5) = forests, forested riparian and wetlands Medium to High priority (4) = grasslands Medium to High priority (3) = shrub, brush *Thresholds adopted from the Lake Arlington & Lake Lewisville Greenprint Water Quality Analysis.
2010 Landfire US Forest Service & Department of the Interior
Goal 2 of 3: Stewardship Opportunities for Agricultural Land Uses
Methodology Data (Description, Date)
Data Source
Identify stewardship opportunities for agricultural land uses that have direct influence on water quality, due to close proximity within landscape drainage patterns. Catchment areas that drain directly to High Priority Water Quality
30-meter Digital Elevation Model (DEM) 2014 High Priority Water Quality Zones
US Geological Service (USGS) Lake Worth Greenprint

LAKE WORTH GREENPRINT REPORT Page 60 of 116
Zones and have a high percentage of agricultural activity within the catchment were prioritized using the following methodology: 1. Delineate watershed into unique catchment areas. 2. Characterize each catchment with its mean priority for water quality protection based on High Priority Water Quality Zones analysis above. 3. Characterize each catchment as to the extent of agricultural land uses (% agricultural) 4. Rank catchments by combining 2 and 3 above (indicating highest proximal threat to priority water quality protection zones).
2014 Drainage Catchments 2010 Landuse Ft. Worth Zoning 2010 Ft. Worth Future Landuse Preliminary Subdivisions Development Concept Plans 2006 Impervious Landcover Parcels with 2010 Landuse and Impervious Factor Streets
NCTCOG City of Ft. Worth National Land Cover Database 2006 Percent Developed Imperviousness Tarrant County Parker County NCTCOG City of Ft. Worth
Goal 3 of 3: Stewardship Opportunities for Existing and Future Development
Methodology Data (Description, Date)
Data Source
Identify stewardship opportunities for developed areas (both existing and planned) that have direct influence on water quality, due to close proximity within landscape drainage patterns. Catchment areas that drain directly to High Priority Water Quality Zones and have a high percentage of impervious cover within the catchment were prioritized using the following methodology: 1. Delineate watershed into unique catchment areas. 2. Characterize each catchment with its mean priority for water quality protection based on High Priority Water Quality Zones analysis above. 3. Characterize each catchment as to the extent of current and planned development (% impervious area). Consider existing landuse, future landuse, zoning, and planned developments. 4. Rank catchments by combining 2 and 3 above (indicating highest proximal threat to priority water quality protection zones).
30-meter Digital Elevation Model (DEM) 2014 High Priority Water Quality Zones 2014 Drainage Catchments 2010 Landuse Ft. Worth Zoning 2010 Ft. Worth Future Landuse Preliminary Subdivisions Development Concept Plans 2006 Impervious Landcover Parcels with 2010 Landuse and Impervious Factor Streets
US Geological Service (USGS) Lake Worth Greenprint NCTCOG City of Ft. Worth National Land Cover Database 2006 Percent Developed Imperviousness Tarrant County Parker County NCTCOG City of Ft. Worth

LAKE WORTH GREENPRINT REPORT Page 61 of 116
RECREATION ACCESS AND CONNECTIVITY GREENPRINT MODEL
Goal 1 of 2: Provide Recreation Access to Lake Worth
Weighting Rationale: Recreation Access mapping criteria were weighted based on responses regarding outdoor recreation preferences in the June 2013 Public Opinion Survey conducted by the Trust for Public Land. Lower emphasis was assigned to planned park improvement criteria, since these improvements are already planned as part of the Fort Worth Park, Recreation, and Open Space Master Plan. Areas zoned for industrial development were removed from the final weighted result.
Criteria Criteria Weight
Methodology Data
(Description, Date)
Data Source
Gaps in Pedestrian- Accessible Lakeshore
14% Identify gaps in pedestrian access to the Lake Worth shoreline. “Gaps” are identified as locations along the lake with no current parks or open space access to the shoreline. The longer the access gap, the higher the access priority. Constraints applied for NAS JRB Compatible Use Zones: - No pedestrian access is allowed within Military Reservation Boundaries (NAS JRB and Lockheed properties). - There were no derived priorities within the Clear Zone. - No constraints were applied in APZ 1 and APZ 2. - Derived priorities (on a scale of 0-5) were reduced by 1 to indicate reduced suitability in Noise Zones with DNL greater than 80.
Parks and Open Space Lake Worth
City of Ft. Worth USGS National Hydrologic Dataset (NHD)
Planned Parking Improvements
2% Reflect and prioritize parking improvements already identified by Fort Worth Park, Recreation, and Open Space Master Plan. Parks with anticipated parking improvements include Marion Sansom, Arrow-S, Wildwood, and The Nature Center. No constraints were applied for NAS JRB Compatible Use Zones. All planned improvements are within existing parks.
Parks and Open Space
City of Ft. Worth
Planned Playground Improvements
2% Reflect and prioritize playground improvements already identified by Fort Worth Park, Recreation, and Open Space Master Plan. Parks include Arrow S and Camp Joy Park. No constraints were applied for NAS JRB Compatible Use Zones. All planned improvements are within existing parks.
Parks and Open Space
City of Ft. Worth

LAKE WORTH GREENPRINT REPORT Page 62 of 116
Criteria Criteria Weight
Methodology Data
(Description, Date)
Data Source
Opportunities for Lakeshore Non- Motorized Boat Access
7% Prioritize shoreline that is suitable for non-motorized boat access. Priority areas include shoreline recognized by the City of Ft. Worth as boat put-in locations, and city-owned properties with lake shoreline that has a slope of 10% or less. Constraints applied for NAS JRB Compatible Use Zones: - No lakeshore access is allowed within Military Reservation Boundaries. - Derived priorities (on a scale of 0-5) were reduced by 2 to indicate reduced suitability within the Clear Zone. - No constraints were applied in APZ 1 and APZ 2. - No constraints were applied for noise zones.
Boat Access Ft. Worth City Owned Properties Lake Worth 30-meter Digital Elevation Model (DEM)
City of Ft. Worth USGS National Hydrologic Dataset (NHD) USGS
Wildlife Viewing
12% Large contiguous natural areas are prioritized for wildlife viewing. Natural areas are defined as vegetated riparian areas and other areas with the natural landcover types found in the Nature Center extrapolated to the entire study area. All anthropogenic landuse types were removed. Areas with natural landcover are prioritized by size. Vegetated riparian areas are considered high priority for wildlife viewing regardless of size. Constraints applied for NAS JRB Compatible Use Zones: - No wildlife viewing is allowed within Military Reservation Boundaries. - There were no derived priorities within the Clear Zone. - No constraints were applied in APZ 1 and APZ 2. - Derived priorities (on a scale of 0-5) were reduced by 1 to indicate reduced suitability in Noise Zones with DNL greater than 75 but less than 80, and reduced by 2 for DNL greater than 80.
2010 Landuse 2006 10-meter ecological systems land cover Riparian Vegetation
NCTCOG Texas Parks & Wildlife Department (TPWD)
Shoreline Fishing
12% Lake Worth shoreline in lakeshore parks and other Lake Worth locations recommended by a local fishing guide are considered high priority for shoreline fishing. Constraints applied for NAS JRB Compatible Use Zones: - No shoreline fishing is allowed within Military Reservation Boundaries. - There were no derived priorities within the Clear Zone. - No constraints were applied in APZ 1 and APZ 2. - Derived priorities (on a scale of 0-5) were reduced by 1 to indicate reduced suitability in Noise Zones with DNL greater than 75 but less than 80, and reduced by 2 for DNL greater than 80.
Non-Public Fishing Access Parks and Open Space
The Trust for Public Land City of Ft. Worth

LAKE WORTH GREENPRINT REPORT Page 63 of 116
Criteria Criteria Weight
Methodology Data
(Description, Date)
Data Source
Suitable Locations for Camping
9% Contiguous flat, natural areas, within 1000 feet of an existing road or planned trail, larger than one acre were identified. Flat areas those with slopes less than or equal to 10%. Flatter slopes are given higher priority. Natural areas are parks, vacant lands over 5 acres, flood control lands, ranch lands, farm lands, or timber lands that have tree cover, shrub cover, or herb cover. High priority (5) = natural areas with 0 - 4% slope Medium/High priority (4) = natural areas with 4 - 8% slope Medium priority (3) = natural areas with 8 - 10% slope Constraints applied for NAS JRB Compatible Use Zones: - No camping is allowed within Military Reservation Boundaries. - There were no derived priorities within the Clear Zone - Derived priorities (on a scale of 0-5) were reduced by 2 to indicate reduced suitability in Noise Zones with DNL greater than 75 but less than 80, and reduced by 4 for DNL greater than 80. - Derived priorities (on a scale of 0-5) were reduced by 2 to indicate reduced suitability in APZ Zone 1, and reduced by 4 in APZ Zone 2.
30-meter Digital Elevation Model (DEM) 2010 Landfire Vegetation 2010 Landuse Planned Trails Streets
US Geological Service (USGS) US Forest Service & Department of the Interior (DOI) NCTCOG City of Ft. Worth
Gaps in Lakeshore Motorized Boat Access
7% Identify gaps in motorized boating access along Lake Worth. “Gaps” are identified as locations along the lake with no current motorized boating access within 1 mile. Within these gaps, the model prioritizes longer gaps along the lakeshore AND that have near-by road access. Constraints applied for NAS JRB Compatible Use Zones: - No motorized boating is allowed within Military Reservation Boundaries. - There were no derived priorities within the Clear Zone or within the designated buoy line - Derived priorities (on a scale of 0-5) were reduced by 1 to indicate reduced suitability in Noise Zones with DNL greater than 75 but less than 80, and reduced by 2 for DNL greater than 80.
Lake Worth Access Points Streets Lake Worth
City of Ft. Worth USGS National Hydrologic Dataset (NHD)
Scenic Views from Lake Worth Parks
12% High priority is given to natural areas that are within 1 mile viewshed from existing parks. Natural areas are parks, vacant lands over 5 acres, flood control lands, ranch lands, farm lands, or timber lands that have tree cover, shrub cover, or herb cover. Constraints applied for NAS JRB Compatible Use Zones: - No constraints were applied for Scenic Landscapes.
30-meter DEM 2010 Landfire Vegetation 2010 Landuse
US Geological Service (USGS) US Forest Service & DOI NCTCOG

LAKE WORTH GREENPRINT REPORT Page 64 of 116
Criteria Criteria Weight
Methodology Data
(Description, Date)
Data Source
Recreation Opportunities Close to Lake Worth
8% Recreation opportunities close to Lake Worth are prioritized. High priority (5) = 0 - 1 miles from Lake Worth Medium to High priority (4) = 1 - 2 miles from Lake Worth Medium priority (3) = 2 - 4 miles from Lake Worth Medium to low priority (2) = 4 - 6 miles from Lake Worth Low priority (1) = 6 - 12 miles from Lake Worth Constraints applied for NAS JRB Compatible Use Zones: - No access is allowed within Military Reservation Boundaries. - No other constraints were applied to this generic criterion.
Lake Worth City of Ft. Worth
Fitness Zone Priority Neighborhoods
14% Neighborhoods are prioritized where they intersect with the Fitness Zone Need priority results. Neighborhoods are comprised of single family, multi family, and mobile home landuses; and include planned developments. Constraints applied for NAS JRB Compatible Use Zones: - No outdoor fitness zone sites are allowed within Military Reservation Boundaries. - There were no derived priorities within the Clear Zone. - Derived priorities (on a scale of 0-5) were reduced by 1 to indicate reduced suitability in Noise Zones with DNL greater than 75 but less than 80, and reduced by 2 for DNL greater than 80.
2010 Landuse Fitness Zone Need
NCTCOG The Trust for Public Land
Fitness Zone Need
NA Demographic profiles are based on ESRI 2010 block group forecasts to determine fitness zone need for percentage of population under the age of 19, population density (people per acre), low income households (below $35,000), percentage of seniors (65 and older), and percentage of obese teens*. The combined level of fitness zone need results takes the five demographic profile results and assigns the following weights: 20% = percentage of population under the age of 19 20% = population density 20% = low income households 20% = percentage of seniors 20% = percentage of obese teens* *Estimate of the % of children ages 10-17 in each blockgroup that are in the 95th percentile for BMI-for-age index (classified as "obese" in the 2007 National Survey of Children’s Health)
2010 ESRI US Census Blockgroups 2010 Childhood Obesity Rates
ESRI Center for Disease Control

LAKE WORTH GREENPRINT REPORT Page 65 of 116
Goal 2 of 2: Provide Recreation Access to Lake Worth
Weighting Rationale: Recreational Connectivity mapping criteria were weighted as shown below to provide a balanced representation of both needs and opportunities for connectivity.
Criteria Criteria Weight
Methodology Data
(Description, Date)
Data Source
Create Connections to Surrounding Communities and Neighborhoods
A connectivity needs and opportunities analysis is employed to identify potential future connections to the Lake Worth trail system “backbone” or “core spine”. Consider this spine to be the planned route around the lake and the Trinity Trail System Connector currently under design. Identify priority areas for connections to this spine via a 2-step approach: 1) identify needs for connections based on demographic profiles, proximity to schools, parks, places of worship, and transit stations, and proximity to existing/new neighborhoods and 2) incorporate opportunities for connectivity based on land use and cover characteristics such as riparian areas, floodplains, and vacant lands. Constraints applied for NAS JRB Compatible Use Zones: - No pedestrian access is allowed within Military Reservation Boundaries - Derived priorities (on a scale of 0-5) were reduced by 2 to indicate reduced suitability in the Clear Zone. - Derived priorities (on a scale of 0-5) were reduced by 1 to indicate reduced suitability in Noise Zones with DNL greater than 80.
Trail Needs 40% This model gives priority to areas with the most need for trails. Trail need is a weighted combination of census block demographic profiles; schools, bus stops*, and places of worship buffered by 1 mile; and residential areas. The combined level of trail need results takes the three demographic profiles and three buffered priority destinations and assigns the following weights: 21% = population density 14% = percentage of population under the age of 19 14% = low income households 7% = schools buffered by 1 mile 7% = places of worship buffered by 1 mile 7% = bus stops buffered by 1 mile* 7% = residential Areas 21% = development concepts and planned subdivisions *This methodology is based on a concept from the "First and Last Mile" trails analysis. The concept is to provide bike access within a mile for residence-to-transit commute (1st mile) and within a mile of transit-to-work commute (last mile). RTD bus stops, light rail stations, and park-n-rides are buffered by one mile.
2010 ESRI US Census Blockgroups Residential Areas Bus Stops Schools Places of Worship Development Concepts Planned Subdivisions
ESRI NCTCOG City of Ft. Worth

LAKE WORTH GREENPRINT REPORT Page 66 of 116
Criteria Criteria Weight
Methodology Data
(Description, Date)
Data Source
Trail Opportunities
60% High priority is given to existing parks and open space, riparian vegetation, vacant lands over 5 acres, and floodplains.
Vacant Lands Floodplains Riparian Areas (2006 10-meter ecological systems land cover) Parks and Open Space Confederate Park Road and White Settlement (east-west rural roads)
NCTCOG FEMA Texas Parks & Wildlife Department (TPWD) City of Ft. Worth

LAKE WORTH GREENPRINT REPORT Page 67 of 116
APPENDIX F: ACTION IDEAS MATRIX 1. RAI SE FUND S TO SUPP ORT AC TIO N PL AN STEP S H IGH PR IO RIT Y , AN D IMP LEMENT ATI ON D ES IRE D IN THE NE AR FUT URE
Action Plan Idea
Likely Implementing Entities
Likely Fiscal Impact to Public Agencies
Potential Funding Sources
Coordinate with federal agencies to seek grant funding.
City of Fort Worth; NCTCOG
Low (grant writing) to High (provision of local grant match).
No local grant match funding currently identified. Local match funding potential sources include cities, counties TRWD, Streams and Valleys, other non-profits, and private partners.
Fort Worth City Council to use a portion of the oil and gas lease revenue to fund actions related to the Lake Worth Greenprint.
City of Fort Worth
Funds from Lake Worth gas lease revenues already support the Lake Worth Capital Improvements Implementation Plan projects ($26.5 million spent or encumbered to date on Lake Worth projects). Additional fiscal impacts may be Low to High depending on the cost of Greenprint implementation ideas that may be selected for funding.
City of Fort Worth oil and gas lease revenues.
Leverage funds from existing groups that have been known to raise money for related work (examples: NCTCOG, TRWD, and Streams and Valleys).
NCTCOG, TRWD, major employers, Chambers of Commerce, Streams and Valleys, other non-profits.
Low (coordination) to High (provision of local grant match).
No funding currently identified. Reallocation of funds from implementing entities; Federal and State grants; corporate contributions; private donations.

LAKE WORTH GREENPRINT REPORT Page 68 of 116
2. ST AR T A VOLU NT ARY OPEN SP ACE PRE SER V AT I ON PROG RAM H IGH PR IO RIT Y , AN D IMP LEMENT ATI ON D ES IRE D IN THE NE AR FUT URE
Action Plan Idea
Likely Implementing Entities
Likely Fiscal Impact to Public Agencies
Potential Funding Sources
Start a voluntary open space program focused on preserving riparian corridors, creating easements for new trails, restoring native vegetation, or protecting open space generally that is high priority according to the Greenprint. This could be done by establishing a nonprofit that can raise donations and leverage private dollars with government grants.
TRWD, Land Trusts; Texas A&M AgriLife; private partners; major employers; Chambers of Commerce.
Low No funding currently identified. Private donations and sponsorships; corporate contributions; Federal and State grants; bond packages; City and County contributions. See also Appendix G: Conservation Finance Resource Options Report.
3. GAT HER MORE INFO R MATI ON TO UNDER STAND AND AD DRE SS WATER QUALI TY PRO BLEMS H IGH PR IO RIT Y , AN D IMP LEMENT ATI ON D ES IRE D IN THE NE AR F UT URE
Action Plan Idea
Likely Implementing Entities
Likely Fiscal Impact to Public Agencies
Potential Funding Sources
City of Fort Worth Water Department to identify research/monitoring needs related to Lake Worth and commence that monitoring.
City of Fort Worth Water Department; TRWD; universities; Texas Water Quality Institute (Texas Agri-Life).
Low Lake Worth gas revenues.
Monitor septic system discharge into the lake by evaluating the septic systems in the watershed and reviewing waste treatment improvement opportunities.
City of Fort Worth Water Department; City of Lakeside; Tarrant County Public Health; universities; Texas Water Quality Institute (Texas Agri-Life).
Low Lake Worth gas revenues.

LAKE WORTH GREENPRINT REPORT Page 69 of 116
4. DEVELOP O R ENHANCE LOCAL GOVE RNME NT PR OGR AMS OR AC TI VI TIE S H IGH PR IO RIT Y , AN D IMP LEMENT ATI ON D ES IRE D IN THE NE AR F UT URE
Action Plan Idea
Likely Implementing Entities
Likely Fiscal Impact to Public Agencies
Potential Funding Sources
Preserve existing City-owned Priority Water Quality Zones with a High, Moderate-High, or Moderate ranking on the Water Quality Zones Greenprint map.
City of Fort Worth (Water Department lands).
Low (already owned, maintenance only). Potential opportunity cost of holding Moderate-ranked land if additional High-ranked land could be acquired for conservation instead.
See Conservation Finance Section of Greenprint Report.
Investigate ways to reduce runoff in the watershed on public lands, including parkland (e.g. could use undeveloped savannah grassland for open space range management).
City of Fort Worth Water Department; City of Fort Worth PACS; City of Fort Worth Stormwater Management Division; City of Lake Worth; City of Lakeside; Tarrant County; Texas A&M AgriLife Extension Service; other universities and non-profits.
Low to Medium (already owned, maintenance and runoff reduction projects).
No funding currently identified. City of Fort Worth; City of Lake Worth; City of Lakeside; Tarrant County; TRWD; federal and state grants; private donations; corporate contributions; university research grants. See also Appendix G: Conservation Finance Resource Options Report.
Consider future recreational use for the city-owned land with a High ranking on the Recreational Connectivity and Recreation Access Greenprint maps.
City of Fort Worth PACS; TRWD.
Low to High, depending on recreation projects, programs, and facilities that result.
No funding currently identified. City of Fort Worth; City of Lakeside; City of Lake Worth; TRWD; Federal and State Grants and Technical Assistance programs; Private donations; corporate contributions. See also Appendix G: Conservation Finance Resource Options Report.
Improve the parking and clean the beaches at City-owned parks around Lake Worth. This includes City of Fort Worth checking that the estimated
City of Fort Worth PACS; major employers; Chambers of Commerce; volunteer organizations; youth groups; independent
Medium to High (Design, construction, maintenance of improvements).
No funding currently identified. Local government, possibly leverage AmeriCorps or volunteers; youth groups; major employers; Chambers of Commerce;

LAKE WORTH GREENPRINT REPORT Page 70 of 116
costs associated with improving the parking in their parks around Lake Worth are on unfunded capital needs list so that when funding becomes available, those items can be considered.
school districts. independent school districts; professional/industry associations. See also Appendix G: Conservation Finance Resource Options Report.
Expand the “Adopt-A-Park” program. Volunteers can help with litter pick-up, mowing and plantings in parks. Encourage formation of private “Friends of” groups similar to the Friends of the Fort Worth Nature Center & Refuge or Friends of Tandy Hills Natural Area.
City of Fort Worth PACS, City of Lakeside; City of Lake Worth; TRWD; volunteer organizations; major employers; chambers of commerce; independent school districts.
Low No funding currently identified. Local agencies and volunteers, AmeriCorps or local businesses to “Adopt-A-Park”; major employers; independent school districts; chambers of commerce.
H IGH PR IO RIT Y , B UT CAN BE IMPLEMEN TE D I N LO N GER -TE RM
Action Plan Idea
Likely Implementing Entities
Likely Fiscal Impact to Public Agencies
Potential Funding Sources
Promote Low Impact Development (LID) for stormwater management. For example, have a LID design competition for City-owned land that is within High Priority Water Quality Zones.
City of Fort Worth Stormwater Management Division; City of Fort Worth Water Department; City of Fort Worth PACS; City of Lakeside; City of Lake Worth; NCTCOG; TRWD; universities; community colleges; independent school districts; development community.
Low (promotion only) to Medium (depending on LID design competition prizes).
No funding currently identified. City of Fort Worth Stormwater Management Division, Water Department, and PACS; Lake Worth gas lease revenues; TRWD; Streams and Valleys; other non-profit and private partners. See also Appendix G: Conservation Finance Resource Options Report.

LAKE WORTH GREENPRINT REPORT Page 71 of 116
Do more regional stormwater detention.
City of Fort Worth Stormwater Management Division with Water Department, and PACS; other cities and counties in the watershed, TRWD, NCTCOG.
Medium to High depending on financial participation of partners (design, construction, maintenance). No City of Fort Worth funding currently available for stormwater detention in the watershed.
No funding currently identified. Bond programs, grants, public-private partnerships. See also Appendix G: Conservation Finance Resource Options Report.
Improve existing parks around the lake by providing facilities for more diverse recreation (e.g. lawn bowling, remote controlled airplane fields, disc golf, etc.). Note that the Naval Air Station Joint Reserve Base would need to be consulted about the location of any proposed remote controlled airplane fields.
City of Fort Worth PACS; Naval Air Station Joint Reserve Base; volunteer/hobby organizations; youth organizations; major employers.
Medium to High (design, construction, operations, programming, maintenance).
No funding currently identified. Bond programs; other city revenue; local nonprofits to fundraise for these efforts; major employers; chambers of commerce; hobby organizations. See also Appendix G: Conservation Finance Resource Options Report.
NOT H IG H PRI OR ITY , BU T DESI R ABLE
Action Plan Idea
Likely Implementing Entities
Likely Fiscal Impact to Public Agencies
Potential Funding Sources
Support the existing voluntary backyard wildlife habitat programs that work with interested landowners.
Texas A&M AgriLife; Texas Parks and Wildlife; hobby enthusiast organizations; volunteer organizations; non-profits; conservation organizations; youth organizations; neighborhood associations; Friends of the Fort Worth Nature Center & Refuge; BRIT; gardening clubs.
Low No funding currently identified. Federal and State grants.
As part of its planning, PACS to consider
City of Fort Worth PACS; Boy and Girl Scouts and
Low to High depending on facilities
No funding currently identified. Bond

LAKE WORTH GREENPRINT REPORT Page 72 of 116
potential location(s) for providing camping opportunities for children and young adults.
other youth organizations.
and programs that result.
programs; other city revenue; local nonprofits to fundraise for these efforts; major employers; chambers of commerce; hobby organizations. See also Appendix G: Conservation Finance Resource Options Report.
5. PROMOTE EDUC ATIO N AND PUBL IC IT Y H IGH PR IO RIT Y , AN D IMP LEMENT ATI ON D ES IRE D IN THE NE AR F UT URE
Action Plan Idea
Likely Implementing Entities
Likely Fiscal Impact to Public Agencies
Potential Funding Sources
Establish a communications strategy to promote the resources, to describe what we have here and what is evolving. Work with a public relations organization or ad agency. Could be public education campaign like the 1980s Chesapeake Bay “We all Live Downstream” Campaign.
Texas tourism department, City of Fort Worth PACS; City of Fort Worth Water Department; City of Fort Worth Community Engagement Team; City of Lake Worth; City of Lakeside; TRWD; school districts; chambers of commerce; universities, neighborhood associations.
Low to Medium depending on cost of media and creative services.
No funding currently identified. Texas tourism department, federal and state government grants; corporate donations; foundation grants; professional/industry associations; private donations/sponsorships.
Have signage about good stewardship practices at places that people will go to already, like boat ramps and trailheads.
City of Fort Worth PACS; City of Fort Worth Water Department; TRWD; sporting/hobby organizations.
Low (design, production, installation).
No funding currently identified. City of Fort Worth; federal and state grants; corporate donations; foundation grants; private sponsorships/donations; associations and other professional organizations

LAKE WORTH GREENPRINT REPORT Page 73 of 116
Approach Texas Parks and Wildlife Magazine about doing an article.
City of Fort Worth Communications Office, City of Fort Worth PACS, local journalist, Texas Parks and Wildlife Magazine.
None N/A
Work with landowners to equip them to voluntarily enhance practices that maintain or improve the water quality
City of Fort Worth, TRWD, Texas AgriLife, Trinity Waters; National Resource Conservation Service; Texas Farm Bureau; USDA; Texas Department of Agriculture; neighborhood associations.
Low No funding currently identified. Federal and state grants; associations; non-profits; corporate donations; foundation grants; private donations
Expand existing program: City of Fort Worth provides stormwater credits to Fort Worth Independent School District – they do 1 hour of stormwater education per year and they get a 10 percent rebate on their utility fees. Over 130 schools are potential users of this program, and this year about 30 participated.
City of Fort Worth Stormwater Management Division, Independent School Districts within the City of Fort Worth and the Lake Worth watershed, potentially commercial businesses within the City of Fort Worth and the Lake Worth watershed.
Low – Existing stormwater fee credit program reduces revenue to stormwater utility but has little additional cost.
Voluntary stormwater fee credit program for implementing best management practices, such as stormwater education, adopt-a-creek trash clean-up efforts. No additional funding sources needed.
Create development review tool for city and county offices to assist in educating developers –reference Greenprint maps as part of entitlement process and ensure proposed development is consistent with priority areas for water quality protection.
City of Fort Worth Planning and Development Department; Texas A&M AgriLife; other local government agencies.
Low to Medium depending on the extent of software development and training required.
No funding currently identified. City and county government operating funds.
Educate the public about
Communications teams from local governments;
Low to Medium depending on cost
No funding currently identified. Federal and

LAKE WORTH GREENPRINT REPORT Page 74 of 116
application/use of fertilizers and detergents to reduce negative water quality impacts.
school districts; nonprofits; NCTCOG; Texas A&M AgriLife; TRWD; Tarrant County; neighborhood associations
of media and creative services.
State grants; corporate donations; foundation grants; professional and industry associations.
Better promote the Nature Center. It showcases scenic, historic and heritage of the area.
City of Fort Worth PACS (FWNC); other non-profits; youth organizations; charitable organizations; chambers of commerce; major employers; recreation and sporting organizations/associations; neighborhood associations
Low to Medium depending on cost of media and creative services.
No funding currently identified. FWNC; Friends of FWNC.
With respect to PACS’ future trail work: give timely updates on progress regarding the Lake Worth Trail, coordinate with Streams and Valleys (and Tarrant Regional Water District) about proposed new trails, and create trails that will serve a diversity of non-motorized uses and that follow sustainable design practices.
City of Fort Worth PACS; City of Fort Worth Water Department; TRWD; Streams and Valleys.
High (design, construction, maintenance of trails).
No funding currently identified beyond current Phase 1 Lake Worth Trail project. City of Fort Worth gas lease revenues; city and county bond programs; Tarrant Regional Water District; landowners and developers; AmeriCorps. See also Appendix G: Conservation Finance Resource Options Report.

LAKE WORTH GREENPRINT REPORT Page 75 of 116
H IGH PR IO RIT Y , B UT CAN BE IMPLEMEN T ED I N LO N GER -TE RM
Action Plan Idea
Likely Implementing Entities
Likely Fiscal Impact to Public Agencies
Potential Funding Sources
PACS is encouraged to expand innovative features as well as to message more broadly about water quality demonstration project(s) already on site at the Fort Worth Nature Center.
City of Fort Worth PACS (FWNC); BRIT; Texas A&M AgriLife.
Low (messaging) to Medium (expand water quality demonstration projects at FWNC).
No funding currently identified. City of Fort Worth PACS; Friends of FWNC.
NOT H IG H PRI OR ITY , BU T DESI R ABLE
Action Plan Idea
Likely Implementing Entities
Likely Fiscal Impact to Public Agencies
Potential Funding Sources
Traveling road show to visit local schools in the watershed to educate on water quality best practices.
Local school districts, local governments; youth organizations; school environmental clubs; non-profits; Texas A&M AgriLife; TRWD; science educators networks; national watershed and water issues educational programs; professional associations.
Low. City of Fort Worth Stormwater Management Division already works with schools on stormwater management education projects. City of Fort Worth Community Engagement Team may be able to assist with distribution of materials.
No funding currently identified. Federal and State grants; corporate donations; foundation grants; professional/industry associations.
Have special events highlighting the importance of water quality, e.g. promote at a paddle race or fishing contest.
FWNC, nonprofits; independent school districts; youth organizations; chambers of commerce; major employers; recreation and sporting organizations/associations; neighborhood associations.
Low/Medium No funding currently identified. City of Fort Worth PACS; City of Fort Worth Water Department; TRWD; Streams and Valleys.

LAKE WORTH GREENPRINT REPORT Page 76 of 116
Coordinate with the State of Texas’ existing program to promote agricultural heritage. This program already provides education and may be able to incorporate best practices recommended from the Greenprint.
Texas Farm Bureau; Texas Department of Agriculture; NRCS; USDA.
Low
Have signs at the parks and Casino Beach that educate the public around history, the military, and water quality.
City of Fort Worth PACS and Water Departments; City of Lakeside; City of Lake Worth; NAS Fort Worth, JRB; TRWD; Tarrant County Historical Commission; librarians.
Low No funding currently identified. Boat use tax or annual fees; donation box; fundraisers or events; TRWD; local governments; federal and state grants; foundation grants; corporate donations/ sponsorships; professional/industry sponsorships; chambers of commerce.
Work with White Settlement, Lake Worth, Azle, Eagle Mountain-Saginaw, Castleberry, and Fort Worth Independent School Districts to develop a competitive juniors (high school) rowing program housed at Casino Beach or another shoreline park.
White Settlement, Lake Worth, Azle, Eagle Mountain-Saginaw, Castleberry, and Fort Worth Independent School Districts; Fort Worth Rowing Club.
Medium/High (design, construction, operations, maintenance of boat house and equipment).
No funding currently identified. Corporate sponsors/donations; chambers of commerce; recreation and sporting organizations/associations and businesses; fundraisers; PTSA. Oklahoma City Boathouse District Rowing Center also has a corporate rowing program.

LAKE WORTH GREENPRINT REPORT Page 77 of 116
6. CREATE LANDOW NE R I NCENTI VE S H IGH PR IO RIT Y , AN D IMP LEMENT ATI ON D ES IRE D IN THE NE AR FUT UR E
Action Plan Idea
Likely Implementing Entities
Likely Fiscal Impact to Public Agencies
Potential Funding Sources
Develop tax incentives to keep critical land in suitable low-impact uses.
City governments. Although not tailored for water quality purposes, existing agricultural exemptions and city agricultural zoning provide some positive effect.
Medium to High depending on extent of eligibility/use and amount of tax incentives. May require changes to state law to implement.
N/A
7. UNDE RT AKE AD DI TIO NAL PL ANNI NG AND EV ALU AT ION H IGH PR IO RIT Y , AN D IMP LEMENT ATI ON D ES IRE D IN THE NE AR F UT URE
Action Plan Idea
Likely Implementing Entities
Likely Fiscal Impact to Public Agencies
Potential Funding Sources
After major public expenditures around Lake Worth, City of Fort Worth to measure changes in community perception and usage concerning the lake and its amenities at least once every two years.
City of Fort Worth; City of Lake Worth.
Low (add question to existing Community Survey) to Medium (survey development and implementation services).
No funding currently identified. City operating budgets.
As part of the annual update process, the City of Fort Worth Planning and Development Department should revise the City of Fort Worth’s Comprehensive Plan with Greenprint findings, such as where the water protection areas are located. First step will be to seek adoption by City Plan Commission and City Council in fall of 2015.
City of Fort Worth Planning and Development Department, City Plan Commission, City Council. Other jurisdictions may choose to incorporate Greenprint components into their plans and/or ordinances.
Low N/A

LAKE WORTH GREENPRINT REPORT Page 78 of 116
Encourage development of an EPA-acceptable Watershed Protection Plan (WPP).
City of Fort Worth Water Department, City of Fort Worth Planning and Development Department; City of Fort Worth Stormwater Management Division; other jurisdictions in the watershed.
Medium No funding currently identified. Federal and state grants; Local jurisdictions and non-profits, as appropriate. See also Appendix G: Conservation Finance Resource Options Report.
Form a committee to create a plan to improve utilization of existing parkland on Lake Worth.
City of Fort Worth PACS.
Low. May be best accomplished as a subcommittee of the Fort Worth Parks Board with stakeholder input.
No funding currently identified. City operating budgets.
8. REGULATE FOR IMP RO VED WATE R QU AL ITY OU TCO MES H IGH PR IO RIT Y , AN D IMP LEMENT ATI ON D ES IRE D IN THE NE AR F UT URE
Action Plan Idea
Likely Implementing Entities
Likely Fiscal Impact to Public Agencies
Potential Funding Sources
Fort Worth Nature Center and City of Fort Worth to develop regulations to limit motorized watercraft uses around the Fort Worth Nature Center.
FWNC; City of Fort Worth PACS, Planning and Development, and Law Departments.
Low FWNC, “Friends of” groups, boating tax, recreation fees.
Jurisdictions in the watershed that don’t already have a parkland dedication ordinance (e.g. Lakeside, Lake Worth), are encouraged to consider creating a parkland dedication ordinance.
City of Lakeside, City of Lake Worth.
Low City of Lakeside, City of Lake Worth.

LAKE WORTH GREENPRINT REPORT Page 79 of 116
H IGH PR IO RIT Y , B UT CAN BE IMPLEMEN T ED I N LO N GER -TE RM
Action Plan Idea
Likely Implementing Entities
Likely Fiscal Impact to Public Agencies Potential Funding Sources
All jurisdictions that have municipal separate storm sewer systems, development permitting, or development approval authority should develop a water protection overlay that triggers certain requirements (i.e. water quality iSWM features) for development within that overlay zone.
City governments within the Lake Worth watershed.
Low for development of such an overlay. Fiscal impacts otherwise would depend upon the requirements or actions triggered by the overlay, which could range from low to medium depending on direct costs imposed by the implemented requirements.
No funding currently identified. Local jurisdiction operating budgets.
Preserve sensitive riparian corridors throughout the cities with an overlay zone.
City governments.
Low for development of such an overlay. Fiscal impacts otherwise would depend upon how the riparian corridors were preserved (i.e. fee simple acquisition, conservation and pedestrian access easements, regulatory standards, etc.) which could range from low to medium or high depending on costs of stream corridor protection.
No funding currently identified. See also Appendix G: Conservation Finance Resource Options Report for list of potential federal, state, and local government funding sources. Private foundations, land owner

LAKE WORTH GREENPRINT REPORT Page 80 of 116
donation or dedication, etc.
Develop a zoning overlay indicating the conceptual location for new trails (locations determined by the Greenprint maps) and then work with developers to determine exact location of those trails through the development process.
City planning, parks, and/or transportation departments within the Lake Worth watershed.
Low for development of such an overlay. Fiscal impacts otherwise would depend upon how the trails were implemented (i.e. fee simple acquisition, pedestrian access easements, public and/or private developer design/construction/maintenance, etc.) which could range from medium to high depending on costs of trail alignment acquisition/design/construction/maintenance. Could be combined with riparian corridor protection. May be best accomplished by first developing and adopting a Bicycle and Pedestrian Trails Plan that focuses on recreational trail connectivity and other off-street trails.
No funding currently identified. See also Appendix G: Conservation Finance Resource Options Report for list of potential federal, state, and local government funding sources. Private foundations, land owner donation or dedication, etc.

LAKE WORTH GREENPRINT REPORT Page 81 of 116
APPENDIX G: CONSERVATION FINANCE RESOURCE
OPTIONS REPORT INTRODUCTION The Trust for Public Land (TPL) is a national nonprofit land conservation organization working to protect land for human enjoyment and well-being. TPL helps conserve land for parks, greenways, recreation areas, watersheds and wilderness. To help public agencies or land trusts acquire land, TPL’s Conservation Finance program assists communities in identifying and securing public financing. TPL offers technical assistance to elected officials, public agencies and community groups to design, pass and implement public funding measures that reflect popular priorities. Helping communities to secure dedicated conservation funding is often the tipping point that can lead to deeper ecological responsibility, including more prudent land use, better managed growth, and the increased protection of natural landscapes. To stimulate engagement across jurisdictions and constituencies, TPL has historically found effective partnerships among a broad spectrum of players from the environmental left to the fiscally conservative right and recognizes that it is important to consistently explore new tools, such as economic benefits research, that can encourage and strengthen the willpower of the voters to seek dedicated conservation funds. This focused, up-front investment pays dividends over the long-term in voter-supported funding that is dedicated to conservation. Since 1996, TPL has been involved in more than 400 successful ballot measures and twenty successful legislative campaigns that have created more than $33 billion in new funding for land conservation. Voters have approved 82 percent of the ballot measures that have been supported by TPL. In Texas, TPL has supported 22 local conservation finance ballot measures. All but one of these passed, generating over $780 million dollars for parks and land conservation purposes. TPL most recently helped the City of Austin pass a $30 million general obligation bond for open space, watershed protection, and wildlife habitat in November 2012. The measure was approved with 56 percent support. At the same election TPL assisted Harris County with the passage of a $166 million park bond which garnered 68 percent support. The Trust for Public Land has undertaken a study of potential public funding options to support the strategic planning process undertaken by the City of Fort Worth, the North Central Texas Council of Governments, and the Lake Worth Regional Coordination Committee to protect the Lake Worth watershed. This research provides a stand-alone, fact-based reference document that can be used to evaluate a range of available financing mechanisms from an objective vantage point.

LAKE WORTH GREENPRINT REPORT Page 82 of 116
Conservation Finance Resource Options Report Contents: Land Acquisition as Water Protection
Choosing a Local Funding Strategy
Local Conservation Financing Options o Bond Issuances o Property Taxes o Sales Tax o Dedication of Parkland and In-Lieu Fees o Impact Fees o Tax Increment Financing
Additional Local Funding Sources
State Conservation Funding Programs o State Wildlife Grants & Horned Lizard License Plate Grants o Texas Historical Commission: Certified Local Government Grants o Texas Parks & Wildlife Department: Recreation Grants Program
Federal Funding Opportunities
LAND ACQUISITION AS WATER PROTECTION Rapid population growth and associated development often lead to nonpoint source pollution and degradation of water sources. As the City of Fort Worth is dependent on surface water sources for its drinking water supply, local actions to acquire and conserve land to protect water quality can be an important and cost-effective means of protecting human health and natural resources. Local actions might include using public funding to purchase and/or remediate critical watershed lands, land use regulation, and improved land management and development practices by private landowners. For example, two significant efforts to protect local drinking water supplies were undertaken by the cities of Austin and San Antonio, and are described below. City of Austin, Texas The City of Austin relies on the Edwards Aquifer for much of its drinking water. Due to the type of porous land that overlays the aquifer, the runoff and pollution generated by development, and the fragmented regulatory control of the watershed’s lands, the aquifer is at high risk of becoming contaminated.91,92 In order to protect the aquifer, thereby maintaining the quality and safety of the water supply, the city purchased a large swath of land in the watershed in 1998. A $65 million bond measure, approved by voters in 1998 provided the funds to purchase and manage the watershed.93 Since then voters have passed several additional bond packages with funds for watershed protection, including a $30 million measure in 2012. Additional funding provided from other sources can be used for maintenance, monitoring, education and planning.94 The city subsequently created the Water Quality Protection Land (WQPL) program, which serves to acquire land and engage landowners. Through the WQPL program, the City of Austin’s Wildland Conservation Division (located within in the Austin Water Utility) currently manages more than 26,000 acres or almost 22 percent of the Barton Springs segment of the Edwards Aquifer Recharge
91 Austin Water Utility. Water Quality Protection Land. The City of Austin, Texas. 92 Karvonen, A. 2011. Politics of Urban Runoff: Nature, Technology, and the Sustainable City. Massachusetts Institute of Technology. P 60-62. 93 Envision Central Texas. Strategy: Natural Resource Preservation - Land Preservation. Techniques For Mitigating Urban Sprawl. 94 Ibid.

LAKE WORTH GREENPRINT REPORT Page 83 of 116
Zone. 95,96 In addition, The WQPL program received the 2011 Groundwater Stewardship Water Quality Protection award from the Barton Springs/Edwards Aquifer Conservation District.97 WQPL acquires land through partnerships with other local governments, conservation organizations, state agencies and federal conservation programs. Since this land is owned by the utility (versus by the parks department), there is no dedicated funding for ensuring or maintaining public access. Some areas, however, have been made available to the public for recreation through grant funding and private resources. For example, 384 acres of the Dahlstrom Ranch easement, known as Howe Pasture, are accessible to the public for recreation and public education in part due to a Recreational Trails Fund grant awarded from the Texas Parks and Wildlife Department (TPWD). City of San Antonio, Texas Currently, the Edwards Aquifer is designated a sole source water supply98 for Central Texas, serving about 2 million people.99 By 2030, almost 33 percent of San Antonio’s drinking water supply will be sourced from the aquifer.100 Since nonpoint source pollution from new development and urban and agricultural runoff101 threatens water quality, protecting sensitive lands that filter runoff before it impacts the source can be one of the most effective ways to protect water quality. In order to accomplish this, the San Antonio Water System (SAWS) launched a program in 1997 to acquire sensitive lands, based upon their geologic characteristics and the presence of a stream or river on site.102 This program is funded by a one-eighth cent sales tax passed by voters in 2000 to collect $45 million to protect land associated with the Edwards Aquifer and along sensitive creeks in the city.103 Versions of this proposition were passed again in 2005 to dedicate $90 million to aquifer protection and in 2010 to raise an additional $90 million.104 To date, $135 million had been spent to acquire land or easements.105 The City of San Antonio also partnered with several organizations, including The Trust for Public Land, to implement these propositions,106 and landowners in the area have been cooperating with the city to sell the development rights on some of their property. 107 Mostly through these conservation easements, over 110,000 acres, or almost 15 percent of the aquifer’s recharge zone have been protected.108,109,110
95 National League of Cities: Sustainable Cities Institute. 2014. Austin, Texas. 96 Barton Springs/Edwards Aquifer Conservation District. Groundwater Stewardship Awards. 97 Ibid. 98 US EPA. Sole Source Aquifers. 99 Green Spaces Alliance of South Texas. Aquifer Protection Program. 100 San Antonio Water System. 2014. Diverse Water Sources for a Thriving Community. New Water Sources. 101 US EPA Office of Water. 2010. San Antonio Protects Edwards Aquifer. Texas: San Antonio. 102 Ibid. 103 Office of Eastpoint & Real Estate. (2013). About the Edwards Aquifer. City of San Antonio. 104 Ibid. 105 Sanders Romero, F. City of San Antonio Edwards Aquifer Protection Program. [Powerpoint Presentation]. City of San Antonio Conservation Advisory Board. 106 Green Spaces Alliance of South Texas. Aquifer Protection Program. 107 McDonald, C. 2012. Saving water, preserving land. MySanAntonio. 108 Ibid. 109 Sanders Romero, F. City of San Antonio Edwards Aquifer Protection Program. [Powerpoint Presetnation]. City of San Antonio Conservation Advisory Board. 110 McDonald, C. 2012. Saving water, preserving land. MySanAntonio.

LAKE WORTH GREENPRINT REPORT Page 84 of 116
CHOOSING A LOCAL FUNDING STRATEGY At the heart of successful conservation funding programs is a substantial, long-term, dedicated source of local revenue. With a reliable source of funds, local governments can establish meaningful conservation priorities that protect the most valuable resources and meet important goals. Local governments with significant funds are much better positioned to secure and leverage funding from federal governments and attract other local and state government or private philanthropic partners. Generally, there are three broad-based types of revenue sources available to local governments to pay for parks and land conservation: discretionary annual spending (i.e. budget appropriation), creation of dedicated funding streams such as voter-approved special taxes, and the issuance of bonds. The financing options utilized by a community will depend on a variety of factors such as taxing capacity, budgetary resources, voter preferences, and political will. While most local governments can create funding for park and recreation through their budgetary process, this either happens infrequently or does not yield adequate funding. In TPL’s experience, local governments that create funding via the budget process provide substantially less funding than those that create funding through ballot measures. As elected officials go through the process of making critical budgetary decisions, funding for land conservation lags behind other public purposes and well behind what voters would support. It is often quite difficult to raise taxes without an indisputable public mandate for the intended purpose. The power of conservation finance ballot measures is they provide a tangible means to implement a local government’s vision. With their own funding, local governments are better positioned to secure scarce funding from state or federal governments or private philanthropic partners. Having a predictable funding source empowers the city, county, or special district to establish long-term conservation priorities that protect the most valuable resources, are geographically distributed, and otherwise meet important community goals and values. Nationwide, a range of public financing options has been utilized by local jurisdictions to fund parks and open space, including general obligation bonds, the local sales tax, and the property tax. Less frequently used mechanisms have included real estate transfer taxes, impact fees, and income taxes. The ability of local governments and special districts to establish dedicated funding sources depends upon state enabling authority. Conservation finance ballot measures are not right for every local government or they might not be the best approach at the moment. Budget appropriations and other revenue mechanisms that can be used by the local government, such as developer incentives, may serve as short-term funding options while parks and conservation proponents develop a strategy and cultivate support for longer-term financing options. Local governments in Texas have played a leading role in advancing parks, recreation, and land conservation in the state, through the passage of local ballot measures. The property tax is the single largest revenue source for many local jurisdictions and the proceeds may be expended for parks and open space. However there is no authority by which a portion of the tax may be dedicated for this purpose, so expenditures are subject to the annual appropriations process. The only means by which counties and municipalities may generate significant dedicated funds for land conservation is by increasing the sales tax or by issuing general obligation bonds. Increased levy of the sales tax and

LAKE WORTH GREENPRINT REPORT Page 85 of 116
issuance of general obligation bonds may be authorized only after approval by a majority of the voters. Bonds also require approval by the public finance division of the Attorney General’s office.111 Since 1996, voters across Texas have voiced their strong support for parks and land conservation by approving more than $2 billion for these purposes through increased levy of the sales tax and local bond referenda. The rate of approval for local ballot measures voted upon in Texas is an astounding 89 percent (89 out of 99 measures approved), compared to the nation-wide approval rate of 75 percent. See the next page for a list of Texas measures and location map.
Bonds provide several advantages over pay-as-you-go funding, including the opportunity to make significant land acquisitions in the near term, presumably before development pressure causes the price of land to increase. However, this mechanism is not always appropriate or feasible (e.g. typically bond proceeds may not be used for stewardship purposes). Local governments could benefit from having the option to utilize other dedicated revenue streams, such as a dedicated property tax.
111 Government Code § 1201.065.
U.S. Conservation Finance Ballot Measures by Finance Mechanism (1996-2013)
Finance Mechanism
Number of
Measures Pass % Pass
Total Funds
Approved
Conservation Funds
Approved
Bond 1049 849 81% $53,338,519,388 $25,725,043,351
Property tax 1029 734 71% $10,630,987,929 $8,089,516,273
Sales tax 204 149 73% $59,850,819,482 $17,641,303,320
Other 105 73 70% $10,569,848,249 $7,936,416,889
Income tax 81 57 70% $442,459,012 $371,559,012
Real estate trans. tax 50 39 78% $1,219,532,514 $1,213,881,046
Total 2518 1901 75%
Finance Mechanism
Number of
Measures Pass % Pass
Total Funds
Approved
Conservation Funds
Approved
Bond 90 82 91% $2,640,728,084 $978,719,457
Sales tax 9 7 78% $415,907,860 $338,750,000
Total 99 89
Source: The Trust for Public Land, LandVote database.
Texas Conservation Finance Ballot Measures (1996-2013)

LAKE WORTH GREENPRINT REPORT Page 86 of 116
Texas Local Measure History and Locations

LAKE WORTH GREENPRINT REPORT Page 87 of 116
LOCAL CONSERVATION FINANCING OPTIONS This section of the report presents a range of voter-approved funding mechanisms for local support of park acquisition in the cities of Fort Worth and Lake Worth, and the Town of Lakeside. Specifically, the following pages provide information related to the use of general obligation bonds, property taxes, sales taxes, and special purpose districts for park and open space acquisition.
Bond Issuances To raise funds for capital improvements such as land acquisition, cities and counties in Texas may issue bonds. There are two types of bonds: general obligation bonds, which are secured by the full faith and credit of the local property taxing authority, and revenue bonds that are paid by project-generated revenue or a dedicated revenue stream such as a particular tax or fee. The governing body of any municipality, county or flood control district may issue bonds to acquire lands for park or historic purposes.112 General obligation bonds that are to be paid from property taxes require voter approval at an election.113 Generally, bond proceeds are limited to capital projects and may not be used for operations and maintenance purposes.114,115
City of Fort Worth General Obligation Bonds116 The city strives to maintain its long-term debt at less than five percent of the taxable assessed valuation. Staying at or below this benchmark ensures that the city’s debt remains manageable. During the past five years, the city has maintained a debt to assessed value ratio below 2.0 percent. Long-term debt per capita measures the debt burden on citizens. Outstanding long-term debt per capita is approximately $900. It is projected to increase somewhat over the next several years due to the infrastructure needs of the city associated with growth. The city maintains an aggressive repayment schedule with over 60 percent of its general obligation debt repaid within 10 years. The city’s existing debt portfolio for General Obligation Bonds is rated as Aa1 from Moody’s Investor Services and AA+ from Fitch. Nine bond elections have been held by the City of Fort Worth since 1978. In 2004, voters approved the sale of $273.5 million in general obligation bonds for 6 propositions for capital improvements throughout the city to include streets, parks, a library, fire stations, and technology improvements. In 2006, $153.6 million in Certificates of Obligation were authorized by Council for the 2007 Critical Capital Needs Program, and the debt was sold over a 6 year period to meet critical capital needs through 2014. All debt for these programs is projected to be sold by 2015. Voters also approved another bond sale in May 2008 for a single proposition for streets and related improvements, authorizing the city to sell an additional $150 million in general obligation bonds for needed street improvements. The 2004 and 2008 bond programs set aside 2 percent of the total for public art funding to support the incorporation of art components in selected projects.
112 Texas Constitution, Article XVI, §59(c-1); Local Gov’t Code § 331.004(a) and (c). 113 Gov’t Code § 1251.001. 114 Federal government rules governing the issuance of tax-exempt bonds limit the use of proceeds to capital purposes such that only a small fraction of bond funds may be used for maintenance or operations of facilities. State and local laws may further limit the use of bond proceeds. 115 Article XI, Section 5, of the Texas Constitution is applicable to the City, and limits its maximum ad valorem tax rate to $2.50 per $100 taxable assessed valuation for all City purposes. Administratively, the Attorney General of the State of Texas will permit allocation of $1.50 of the $2.50
maximum tax rate for all general obligation debt service, as calculated at the time of issuance. *Article 835p of the State of Texas Civil Statutes limits cities with a population of six hundred thousand or more according to the last federal census to incur a total bonded indebtedness by the issuance of tax-supported bonds in an amount not exceeding ten (10%) percent of the total assessed valuation of property shown by the last assessment roll of the city. 116 http://fortworthtexas.gov/uploadedFiles/Planning_and_Development/Planning_and_Design/Comprehensive_Plan/03FinancialTrends.pdf

LAKE WORTH GREENPRINT REPORT Page 88 of 116
The citizens of Fort Worth will vote on a $292 million bond program in May 2014. If approved, the 2014 Bond Program will fund $219.7 million in transportation projects, $31.4 million in parks projects and $40.7 million in other capital projects. The city has structured its regular bond program in a way that takes into account current financial conditions, trends and forecasts and that is intended to allow the debt to be issued without requiring a tax rate increase. The process of developing each bond program is described below. City staff evaluated potential capital improvement project needs over the next five (5) years, using technical assessments of infrastructure condition and need, public input received through individual departments and master planning efforts, and citizen and Council member input. At the same time, available funding was calculated. Staff took the preliminary project list developed through the above efforts to the public for further input and revision. Over the course of four (4) months, staff received significant input from citizens, as well as follow up feedback from Council members based upon their own discussions with residents. The result of that feedback was a refined final proposed project list.117 The City of Fort Worth could issue a general obligation bond outside of this regular process for pressing needs. The chart below demonstrates what various bond amounts for Fort Worth for parks and open space acquisition would cost the average household. For example, a $70 million bond would cost the average household about $13 each year. Voter approval is required.
TPL’s bond cost calculations provide an estimate of debt service, tax increase, and cost to the average homeowner in the community of potential bond issuances for land conservation. Assumptions include the following: the entire debt amount is issued in the first year and payments are equal until maturity; 20-year maturity; and 5 percent interest rate. Property tax estimates assume that the county would raise property taxes to pay the debt service on bonds, however other revenue streams may be used. The cost per household represents the average annual impact of increased property taxes levied to pay the debt service. The estimates do not take into account growth in the tax base due to new construction and annexation over the life of the bonds. The jurisdiction’s officials, financial advisors, bond counsel and underwriters would establish the actual terms.
City of Lake Worth General Obligation Bonds Long-term debt of the City of Lake Worth consists of certificates of obligation, general obligation bonds, utility system revenue bonds, and long-term capital leases. At the end of the fiscal year 2013, the city had total debt outstanding of $19,823,286. Of this amount, $13,975,000 represents certificates of obligation secured by property tax collections; $3,690,800 represents general
117 http://fortworthtexas.gov/uploadedFiles/Budget_and_Management_Services/2014_Bonds/2014_FAQ.pdf
Assumes a 20-year bond issue at 5.0% Interest Rate
2014 Net Taxable Value= $41,442,385,142
Annual Cost/ Ave./
Bond Issue Debt Svce Household*
30,000,000 $2,407,278 0.006 $6
50,000,000 $4,012,129 0.010 $9
70,000,000 $5,616,981 0.014 $13
100,000,000 $8,024,259 0.019 $19
150,000,000 $12,036,388 0.029 $28
Fort Worth Bond Financing Costs
Tax Increase
**Based on average taxable value of single-family residence of $95,559.

LAKE WORTH GREENPRINT REPORT Page 89 of 116
obligation bonds secured by property tax obligations. The city’s total debt decreased by $1.2 million during the current fiscal year.118 State statutes limit the total property tax rate to $2.50 per $100 assessed valuation. The city’s charter further limits the rate to $1.90 per $100. The city’s total property tax rate for 2012-2013 was $0.4744 per $100 assessed valuation, of which $0.1414 was for maintenance and operations and $0.332 was for debt service. The City of Lake Worth could issue a general obligation bond for parks and land conservation. The chart to the right demonstrates what various bond amounts in Lake Worth would cost the average household. A $1 million bond, for example, would cost the average household about $13 each year. Voter approval is required.
Town of Lakeside General Obligation Bonds The Town operates under the general laws of the State of Texas as authorized by Article XI, Section 4 of the Texas Constitution, which limits the maximum tax rate to $1.50 per $100 assessed valuation for all town purposes. Administratively, the Attorney General of the State of Texas will permit allocation of $1.00 of the $1.50 maximum tax rate for all general obligation debt. The current town tax rate is $0.3793. The Town of Lakeside could issue a general obligation bond for parks and open space acquisition needs. The relatively small tax base in Lakeside limits the amount of debt that could be issued as a reasonable per household cost. The chart to the right demonstrates what various bond amounts in Lakeside would cost the average household. For example, a $100,000 bond would cost the average household about $12 each year.
Property Taxes In Texas, property taxes are levied by local governments, schools, and special districts. There is no state property tax. Any taxing unit, including a city, county, school district or special district, has the option of offering a separate exemption of up to 20 percent of the property’s appraised value, but not less than $5,000. The City of Fort Worth provides an exemption not exceeding 20 percent of the market value of the residence. In addition, the appraised value of residential property is capped at a maximum increase of ten percent each year.
118 http://lakeworthtx.org/export/sites/default/pdfs/Financepdfs/Annual-Audit-2012-2013.pdf
Assumes a 20-year bond issue at 5.0% Interest Rate
2014 Net Taxable Value= $348,043,641
Annual Cost/ Ave./
Bond Issue Debt Svce Household*
1,000,000 $80,243 0.023 $13
2,000,000 $160,485 0.046 $26
3,000,000 $240,728 0.069 $39
5,000,000 $401,213 0.115 $66
7,000,000 $561,698 0.161 $92
Lake Worth Bond Financing Costs
Tax Increase
**Based on average taxable value of single-family residence of $57,054.
Assumes a 20-year bond issue at 5.0% Interest Rate
2014 Net Taxable Value= $100,200,066
Annual Cost/ Ave./
Bond Issue Debt Svce Household*
100,000 $8,024 0.008 $12
200,000 $16,049 0.016 $25
300,000 $24,073 0.024 $37
500,000 $40,121 0.040 $62
1,000,000 $80,243 0.080 $124
Lakeside Bond Financing Costs
Tax Increase
**Based on average taxable value of single-family residence of $154,832.

LAKE WORTH GREENPRINT REPORT Page 90 of 116
Counties, cities and towns in Texas are constitutionally permitted to levy a property tax up to $0.80 per $100 of taxable valuation for general fund, permanent improvement fund, road and bridge fund, and jury fund purposes.119 The total amount of property taxes imposed in any year may not exceed the amount imposed in the preceding year unless the governing body gives notice of its intent to increase taxes and holds a public hearing.120 The table to the right shows the current tax rate subject to the $0.80 limit in each of the municipalities within the watershed, the remaining tax capacity under this limit, as well as the maximum tax that could be levied at a cost to the average homeowner of $20 annually. For example, at the $20 a year price point the City of Fort Worth could impose a tax of $0.021 per $100 and collect roughly $8.7 million. Unlike a debt service levy which becomes a binding obligation on current and subsequent commissioners’ courts, the general, or M&O, levy is the result of the budgeting process whereby annual requirements are reviewed by the members of the city council and must be voted on each year. The city tax rate in Fort Worth has remained unchanged over the past five years. The tax rate in Lakeside also has been unchanged over the past several years. In Lake Worth, the city council raised the property tax levy for the fiscal year 2014 by roughly 3 percent.
Sales Tax The Texas state sales and use tax rate is 6.25 percent,121 but local taxing jurisdictions (cities, counties, special purpose districts, and transit authorities) may also impose sales and use tax up to 2 percent for a total maximum combined rate of 8.25 percent. Each of the municipalities in the study area is currently at the maximum allowable sales tax levy.
City of Fort Worth Sales Tax The City of Fort Worth levies a one percent sales tax which goes to the general fund. Another levy of one-half of one percent is allocated to the Metropolitan Transit Authority (METRO), and a third levy of one-half cent supports the Crime Control and Prevention District (CCPD). Local residents voted to establish the Fort Worth CCPD in 1995, supported by a half-cent sales tax. The district was renewed by voters in 2000, 2005 and 2009, each for a five-year period. On May 10, 2014 Fort Worth residents will again cast ballots on the renewal of the Crime Control and Prevention District. The city does not currently have capacity to levy a sales tax for park and open space purposes.
City of Lake Worth Sales Tax The City of Lake Worth levies a one percent general city sales tax. A levy of one-quarter of one percent is allocated to the street maintenance and another levy of one-quarter cent supports the
119 Id. at §9. 120 Id. at §21. 121 Texas Tax Code, §151.051.
Current Remaining
Jurisdiction M&O Rate Capacity Tax Rate Revenue
Fort Worth 0.6759 0.1241 0.021 $8,702,901
Lake Worth 0.14804 0.65196 0.036 $125,296
Lakeside 0.37926 0.42074 0.013 $13,026
Property Tax Capacity
Maximum @ $20/Avg Home

LAKE WORTH GREENPRINT REPORT Page 91 of 116
Crime Control and Prevention District (CCPD). The city also collects a one-half cent levy for the Economic Development Corporation (EDC). The city created the Economic Development Corporation to support projects and improvements that promote economic development within the city. The EDC sales tax generates roughly $1.7 million in annual revenue. Special parks projects in the Park Improvement Fund, and funded by the EDC, have increased from $275,000 in FY2013 to $290,000 in FY2014. Of the $290,000, $200,000 is designated for Lake Worth Park with the remaining $90,000 for other parks. In addition to that amount, EDC is providing $40,000 in funding for parks projects in city parks.
Town of Lakeside Sales Tax On May 13, 2013, the voters of Lakeside approved the imposition of an additional sales and use tax of one-half of one percent for economic development. This sales tax is collected solely for the benefit of the Lakeside Economic Development Corporation (EDC), and may be pledged to secure payment of sales tax revenue bonds issued by the EDC. At the same election the voters of Lakeside approved the imposition of an additional sales and use tax of one-quarter of one percent for property tax reduction. In addition to traditional economic development projects the Lakeside ECD (Type B) can fund projects such as parks, museums, sports facilities and affordable housing. Tax revenue also may be expended on the development of water supply facilities or water conservation programs. Eligible expenditures include: acquisition of land; machinery and equipment; construction costs; planning and professional services related to the project; financial transactions and reserve funds; and administrative, operations, and other necessary expenditures. EDC boards pursuing projects are required to obtain city council approval of the project. There is also a requirement for additional public notice or a public hearing on individual projects undertaken. An economic development corporation may undertake projects outside of the city limits with permission of the governing body that has jurisdiction over the property. If the project is located completely within the jurisdiction of another municipality, the corporation would need approval of the city council for that municipality. The new EDC tax, which will generate roughly $28,000 annually, could represent a funding opportunity for parks and watershed protection for the Town of Lakeside.122
Dedication of Parkland and In-Lieu Fees Parkland dedication ordinances usually require new residential (and sometimes new commercial) developments to dedicate an amount of land to the city to be used for a public recreation area or park. Some cities allow developers to choose to pay a fee or construct their own recreational facilities. Among different cities, the exaction amounts and allowed uses vary. These requirements are often based on the number of new residents, the number of units, or the square footage of the development. The averages nationwide are around 4.3 acres, or $523,000, per 1,000 new residents (though these should not necessarily be used as standards since they vary widely).123 The activities that these funds can be spent on also vary, and can include land acquisition and development, and in
122 Based on 2013 collections of approximately $83,000, for 1.5 percent sales tax. Source: https://mycpa.cpa.state.tx.us/allocation/AllocDetailResults.jsp 123 Center for City Park Excellence. Who’s Going to Pay for This Park? The Trust for Public Land.

LAKE WORTH GREENPRINT REPORT Page 92 of 116
some cases even administration and maintenance. Some also regulate the area in which the funds can be spent, and these help to establish a reasonable connection between the exaction and the developers impact, they can sometimes limit the actual amount of land acquisition achieved.124 Over 45 cities in Texas have parkland dedication ordinances, though only a small number of these have parkland development fees.125 The City of Fort Worth has a Neighborhood and Community Park Dedication Policy, which has existed since 1977 and was last updated in 2009.126 This ordinance sets provisions for how much parkland should be dedicated per new resident, and also includes mandatory dedications (2.5 acres per 1,000 new residents expected due to a development) and fees ($30,000 per new neighborhood park acre to be created by the city). In one area of the city, the Central City Parks Planning District (PPD), a separate fee has been implemented that requires a $500 per unit exaction that can be used for a variety of activities other than land acquisition or development.127 As of 2010, this ordinance has provided 176 acres of land and $5.9 million in funding for parks.128 While Lake Worth and Lakeside do not currently have parkland dedication policies, many other cities in Texas have a variety of Parkland Dedication Ordinances and Fee programs. For instance, the City of College Station has a Parkland Dedication Ordinance (last updated in 2012) as part of its Unified Development Ordinance. This ordinance currently requires a land dedication in the amount of 1 acre per 117 dwelling units for neighborhood parks or 1 acre per 128 dwelling units for community parks. The ordinance also establishes fee in lieu of land dedications and park development fees. For neighborhood parks, the total fees are $636 per dwelling unit (this amount is a decrease from the pre-2012 ordinance), and for community parks, the total fees are $625 per single family dwelling unit and $1,000 per multi-family dwelling unit.129,130 In addition, in 1984, Turtle Rock Corporation brought a case against the City of College Station131 in order to challenge the constitutionality of their parkland dedication ordinance. The Texas Supreme Court upheld the City of College Station's park land dedication ordinance and established constitutionality of these types of exactions in Texas.132 One issue was that the ordinance did not require dedication of land in an amount that would cause complete loss of value of the land to the developer, and another issue was ensuring there was a reasonable connection between the exaction and the anticipated increase in need.133 The City of Austin addresses these issues clearly in their Parkland Dedication Ordinance, established in 1985 and updated in 2007.134 This ordinance has a standardized calculation for land dedication requirements (5 acres per 1,000 new residents) and fees in lieu ($650 per dwelling unit).135 In addition, in order to establish the reasonable connection between the development’s impact and the spending of fees, Austin has park systems plans that divide the city into different districts in which the fees must be spent. As reported by The Trust for Public Land’s Center for City Park Excellence,
124 Ibid. 125 Crompton, JL. 2010. An Analysis of Parkland Dedication Ordinances in Texas. Journal of Park and Recreation Administration. 28(1): 70-102. 126 City of Fort Worth. 2009. Neighborhood and Community Park Dedication Policy. 127 Ibid. 128 Crompton, JL. 2010. An Analysis of Parkland Dedication Ordinances in Texas. Journal of Park and Recreation Administration. 28(1): 70-102. 129 City of College Station. 2012. Parkland Dedication Ordinance Amendment. 130 City of College Station. 2012. Parkland Dedication and Development Fees. [Powerpoint]. 131 Evans-Cowley JS. Impact Fees and Exactions. 132 Supreme Court of Texas. 1984. City of College Station v. Turtle Rock Corporation. No. C-2918. 680 S.W.2d 802 (Tex.,1984). 133 Ibid. 134 City of Austin. Parkland Dedication. 135 Ibid.

LAKE WORTH GREENPRINT REPORT Page 93 of 116
Austin has provided for at least 867 acres of parkland through its ordinance, which was about 77 percent of its parkland acquisition goals (the closest to achieving their goal out of all the cities included in this specific report).136 Numerous other cities and counties are beginning to explore and recommend dedications or in lieu fees as well. In lieu fees for parks have also been a recommended idea for park growth and expansion in Saginaw, in Tarrant County, Texas, as noted in their Parks, Recreation, and Open Space Vision 2025.137 In addition, the City of Rowlett, which overlaps Dallas and Rockwall Counties, currently has a parkland dedication ordinance but in their 2011 updated Comprehensive Plan also recommended creating impact fees for certain neighborhoods to fund acquisition of open space, improvements to pathways and maintenance of public areas.
Impact Fees Impact fees, or monetary exactions other than a tax or special assessment, may be imposed by political subdivisions in connection with the approval of a development project to defray all or part of the cost of public facilities related to the development project. However, the Texas Local Government Code specifically excludes the dedication of land for public parks and payments in lieu of dedication of park land from the definition of impact fees.138 Instead, local governments, special districts and conservation and reclamation districts are statutorily authorized to impose impact fees for capital improvements related to water, wastewater, flood control and roadways. As such, additional impact fee revenues may be accessed only for park acquisitions that are part of a project serving one of the aforementioned purposes, such as a project in partnership with the Fort Worth Water Department or the Tarrant Regional Water District. Impact fees can also be levied in conjunction with non-profits.
Special Districts Special districts are units of local government that provide specific services within a defined area, and are particularly useful for addressing cross-jurisdictional issues. These districts typically serve a portion of a county, and revenue is generated only from the areas within which the improvement or service will be offered.139 Among the 49 states that currently have them, there are over 770 special districts per state on average (range is from 17 to 3,227; median is 547).140 In 2002, Texas had 2,245 special district governments and as of 2012, has 2,600.141,142 Special districts in Texas are authorized under Article 3, Section 52 and Article 16, Section 59 of the State Constitution. This first statute allows for the creation of special districts in general, but limits their indebtedness up to “one-fourth of the assessed property valuation.”143 The second statue establishes Conservation Districts, which do not have limits on debt or taxation. In general, special districts are created by either an act of the Texas Legislature or by a local city or county ordinance.
136 Center for City Park Excellence. Who’s Going to Pay for This Park? The Trust for Public Land. 137 Saginaw. 2013. Saginaw Parks, Recreation, and Open Space Vision 2025. 138 Texas Local Govt. Code §395.001(4)(A). 139 U.S. Department of Commerce. (2013). Individual State Descriptions: 2012. 2012 Census of Governments. U.S. CENSUS BUREAU. 140 Calculated using data from: Individual State Descriptions: 2012. 141 U.S. Department of Commerce. (2002). Government Organization. 2002 Census of Governments. Government Organization, (1):1. 142 Note: This increase in government units has led to some tension within certain counties, and in 2011 there was discussion about establishing a moratorium on special districts. See: www.dallasnews.com/incoming/20101228-coleman-scrutinizes-special-districts.ece. 143 Smith D. (2010). Special Tax Districts. Handbook of Texas Online. Texas State Historical Association.
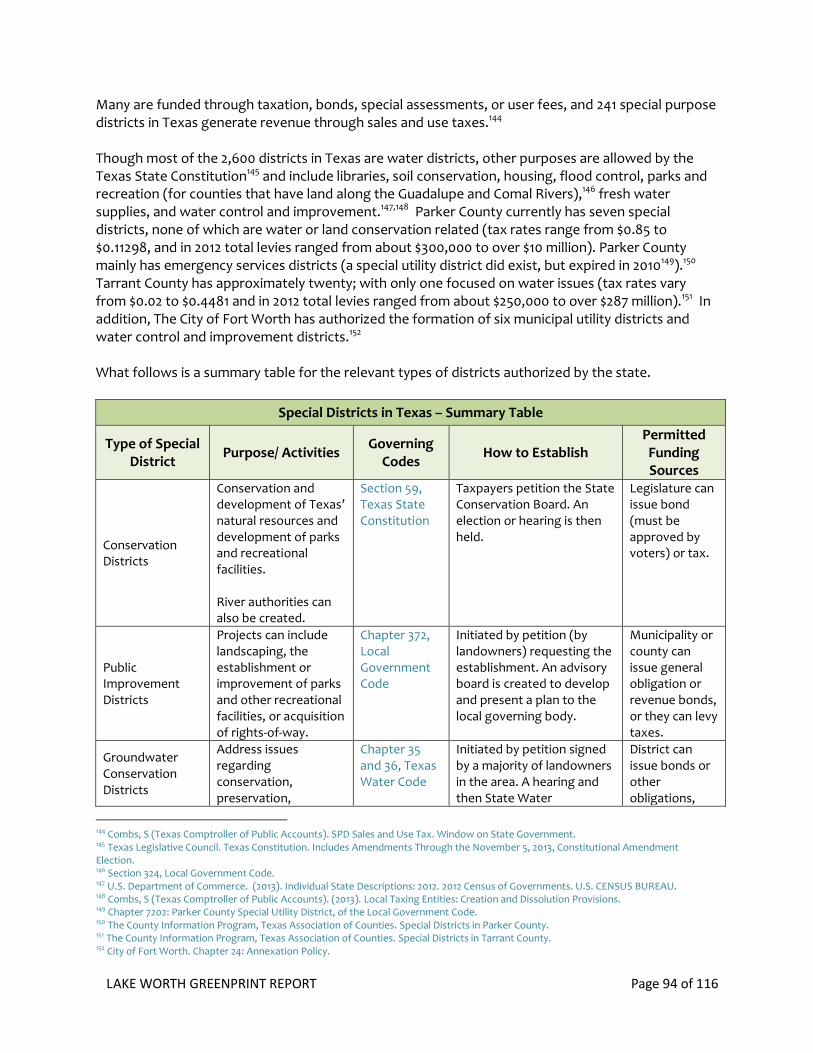
LAKE WORTH GREENPRINT REPORT Page 94 of 116
Many are funded through taxation, bonds, special assessments, or user fees, and 241 special purpose districts in Texas generate revenue through sales and use taxes.144 Though most of the 2,600 districts in Texas are water districts, other purposes are allowed by the Texas State Constitution145 and include libraries, soil conservation, housing, flood control, parks and recreation (for counties that have land along the Guadalupe and Comal Rivers),146 fresh water supplies, and water control and improvement.147,148 Parker County currently has seven special districts, none of which are water or land conservation related (tax rates range from $0.85 to $0.11298, and in 2012 total levies ranged from about $300,000 to over $10 million). Parker County mainly has emergency services districts (a special utility district did exist, but expired in 2010149).150 Tarrant County has approximately twenty; with only one focused on water issues (tax rates vary from $0.02 to $0.4481 and in 2012 total levies ranged from about $250,000 to over $287 million).151 In addition, The City of Fort Worth has authorized the formation of six municipal utility districts and water control and improvement districts.152 What follows is a summary table for the relevant types of districts authorized by the state.
Special Districts in Texas – Summary Table
Type of Special District
Purpose/ Activities Governing
Codes How to Establish
Permitted Funding Sources
Conservation Districts
Conservation and development of Texas’ natural resources and development of parks and recreational facilities. River authorities can also be created.
Section 59, Texas State Constitution
Taxpayers petition the State Conservation Board. An election or hearing is then held.
Legislature can issue bond (must be approved by voters) or tax.
Public Improvement Districts
Projects can include landscaping, the establishment or improvement of parks and other recreational facilities, or acquisition of rights-of-way.
Chapter 372, Local Government Code
Initiated by petition (by landowners) requesting the establishment. An advisory board is created to develop and present a plan to the local governing body.
Municipality or county can issue general obligation or revenue bonds, or they can levy taxes.
Groundwater Conservation Districts
Address issues regarding conservation, preservation,
Chapter 35 and 36, Texas Water Code
Initiated by petition signed by a majority of landowners in the area. A hearing and then State Water
District can issue bonds or other obligations,
144 Combs, S (Texas Comptroller of Public Accounts). SPD Sales and Use Tax. Window on State Government. 145 Texas Legislative Council. Texas Constitution. Includes Amendments Through the November 5, 2013, Constitutional Amendment Election. 146 Section 324, Local Government Code. 147 U.S. Department of Commerce. (2013). Individual State Descriptions: 2012. 2012 Census of Governments. U.S. CENSUS BUREAU. 148 Combs, S (Texas Comptroller of Public Accounts). (2013). Local Taxing Entities: Creation and Dissolution Provisions. 149 Chapter 7202: Parker County Special Utility District, of the Local Government Code. 150 The County Information Program, Texas Association of Counties. Special Districts in Parker County. 151 The County Information Program, Texas Association of Counties. Special Districts in Tarrant County. 152 City of Fort Worth. Chapter 24: Annexation Policy.

LAKE WORTH GREENPRINT REPORT Page 95 of 116
protection, recharging, and prevention of pollution. Watershed authorities can be created under these provisions (but by special legislative acts).
Development Board approval are needed. (Note: the law authorizing underground water conservation districts has been repealed; but they can still be created by special legislative acts).
and levy taxes to pay for bond.
Water Control and Improvement Districts
Activities can include flood control, irrigation, drainage, reclamation, preservation of water resources, and development of forests. Preservation districts can also be created.
Chapter 51, Texas Water Code
Initiated by petition signed by a majority of landowners in the area. Then the commissioner of the county or the Texas Commission on Environmental Quality needs to approve.
District can issue bonds or other obligations, and levy taxes to pay for bond.
Different types of districts that may be of interest to stakeholders considering resources for the Lake Worth watershed are described next. Conservation districts have been allowed since 1981,153 and are specifically authorized under Article 16, Section 59 of the Texas State Constitution (this provision also permits the creation of river authorities).154,155 This statue states that conservation districts can be established in order to conserve natural resources or develop park and recreational facilities.156 To create these, voters must petition the State Conservation Board, after which a hearing (if there are less than 100 voters in the area) or an election (two-thirds of the vote is needed to pass) will be held.157 In terms of funding, bonds can be issued by the local legislature, and some districts can levy taxes to develop, improve or maintain park and recreational facilities. As an example, the Edwards Aquifer Authority was created by the Texas Legislature in 1993 and was permissible under these conservation and reclamation district rules. This agency works across eight counties and regulates wells and water use. It can set user fees and issue revenue bonds.158 Tarrant Regional Water District (TRWD) is a water district in Texas, and officially considered a river authority by the Texas Commission of Environmental Quality.159 Like most water districts, TRWD is authorized to incur debt, levy taxes, assess user fees, enter into contracts, obtain easements
153 Combs, S (Texas Comptroller of Public Accounts). (2013). Local Taxing Entities: Creation and Dissolution Provisions. 154 Tex. Const. Art. XVI, Section 59. 155 Article 16, Section 59. 156 Tex. Const. Art. XVI, Section 59. “The conservation and development of all of the natural resources of this State, and development of parks and recreational facilities… [are] hereby declared public rights and duties; and the Legislature shall pass all such laws as may be appropriate thereto. [And] there may be created within the State of Texas, or the State may be divided into, such number of conservation and reclamation districts as may be determined to be essential to the accomplishment of the purposes of this amendment to the constitution.” 157 Agriculture Code, Section 201.044. 158 Combs, S (Texas Comptroller of Public Accounts). (2013). Local Taxing Entities: Creation and Dissolution Provisions. 159 Texas Commission of Environmental Quality. District Information.

LAKE WORTH GREENPRINT REPORT Page 96 of 116
(primarily to install or maintain water distribution infrastructure), and condemn property.160 As of 2013, Tarrant County has a total tax rate of $0.264 per $100 valuation, and the TRWD levies an additional total tax rate of $0.02 per $100 valuation.161 Both of these are well under the maximum property tax of $0.80 per $100.162 Public improvement districts have been allowed in Texas since 1977 (and are authorized under Chapter 372 of the Local Government Code), and can be created in order to landscape, establish or improve parks and other recreational facilities, or acquire public right-of-ways. 163 These districts can be initiated by local landowners, who request its establishment through a petition. An advisory board is then created to develop and present a plan to the local governing body. In order to fund projects in these districts, the local municipality or county can issue general obligation or revenue bonds, or levy taxes.164 For instance, Harris and Montgomery counties assess a sales tax to support their overlapping public improvement district.165 It is important to note that in other counties, where they are already at the maximum allowed tax rates, other types of special districts can be used to set additional taxes for projects that would otherwise be unfunded.
Tax Increment Financing Tax increment financing, or TIF, is becoming an increasingly popular tool to leverage limited public financing of public infrastructure and site preparation in order to attract private investment. TIF is most often used as part of an urban redevelopment plan. Upon establishment of a tax increment financing district, the current assessed valuation of property in the district is recorded, and taxing entities, such as the city and school districts, levy their normal tax rates upon this base assessed valuation and receive tax revenues from it. When the district's assessed valuation grows above the base, the difference between total district assessed valuation and the base valuation is called the incremental valuation. The same tax rates apply to the incremental valuation as to the base assessed valuation; however, tax revenues produced by the incremental assessed valuation are used for certain pledged purposes such as to bond debt service. In theory, tax increment bonds “pay for themselves." In other words, the infrastructure financed by the bond proceeds helps attract new private development, which in turn generates additional tax revenues. It is possible, however, that property values will not increase enough to cover debt service on the bonds, in which case additional taxes would need to be levied on the district. In Texas, tax increment financing is a tool authorized by Chapter 311 of the Texas Tax Code by which local governments can publicly finance needed structural improvements and enhanced infrastructure within a defined area called a reinvestment zone. Municipalities can use tax increment financing to acquire, construct, or reconstruct parks as long as these projects are consistent with the project plan for the zone.166 For example in the Midtown area of Houston, the city used Tax Increment Reinvestment Zone funds to acquire land and build a park.167
160 Texas Commission on Environmental Quality. (2004). Texas Water Districts: A General Guide. 161 Tarrant Appraisal District. 2013 Tax Rates per $100 Valuation for Tarrant County. 162 Combs, S (Texas Comptroller of Public Accounts). (2012). Your Money and The Taxing Facts. 163 House Select Committee on Special Purpose Districts. (2011). Texas House of Representatives Interim Report 2010. House of Representatives, 82nd Texas Legislature. 164 Chapter 372, Local Government Code. 165 House Select Committee on Special Purpose Districts. (2011). Texas House of Representatives Interim Report 2010. House of Representatives, 82nd Texas Legislature. 166 Chapter 311 of the Texas Tax Code. 167 Clark Stockton Lord. Understanding Texas TIRZ Statute –Chapter 311 Texas Tax Code. [Presentation].

LAKE WORTH GREENPRINT REPORT Page 97 of 116
To create a reinvestment zone, the municipality or county (and other taxing entities) begin by approving a participation agreement, which sets forth the percentage of the tax increment the taxing entity is willing to dedicate to the TIF fund. Then they have to meet several criteria to be considered for tax increment financing. As part of the process, the local government must hold a public hearing and a reasonable opportunity must be afforded to property owners within the proposed district to protest the inclusion of their property in that district. Then the governing body of the city or county may, by ordinance or order, designate a contiguous area as a reinvestment zone for tax increment financing purposes and create the board of directors for the reinvestment zone. In Fort Worth, the City of Fort Worth Housing and Economic Development Department receives and evaluates all TIF requests and applications. Depending on the exact nature and complexity of the proposed TIF, the estimated timeframe to complete the process for designation is at least six (6) months. Therefore, applications for the creation of a TIF must be submitted to the city by June 30 in order for the TIF to be established in the same calendar year. There are eleven active TIF districts in Fort Worth. According to the Texas Comptroller there are no TIF districts in Lake Worth or Lakeside.168
Oil and Gas Lease Revenue The City of Fort Worth and the Tarrant Regional Water District have a relatively unique revenue source in the form of oil and gas leases. A portion of these revenues have been expended on capital improvement projects to protect and improve Lake Worth as described in the paragraphs below. There may be opportunities to propose additional projects in the watershed to be supported by this funding source. The City of Fort Worth and the Water Department lease land for gas exploration and production in the Barnett Shale, which generates revenue for the city. Over the three-year period from 2008-2011, the City of Fort Worth received almost $84 million from lease bonuses, royalties, mineral taxes, and
other fees.169 While there has been a decreasing trend over the past few years (due to lower Gas Drilling and Gas utility franchise fees), revenues from leases and permits are expected to be about $45,557,225 for
2014 and that still accounts for 8% of total revenue for the city.170
In 2012, $1,429,000 of oil and gas
lease and royalty revenue was allocated for parks and community services capital improvements.171 For 2014, $126,228 is allocated to a park gas lease project fund for parks and community services and
$128,690 is allocated to a park gas lease project fund for planning and development.172 This represents less than 1% of the revenue generated for 2014. For gas leases directly associated with the Fort Worth Nature Center, 25 percent of all royalties received go to the Nature Center Capital Improvement Program, 25 percent go to the Park Gas Lease Project Fund, and 50 percent go to the Park-System Endowment Gas Lease Fund. In addition, the Lake Worth Trust Fund, which is managed by the Water Department, manages about 300 properties
168 http://www.texasahead.org/reports/TIF_Abatement/2012/registry.pdf 169 Chesapeake Energy. (2012). A Barnett Shale Update. [Presentation]. 170 City of Fort Worth. City of Fort Worth, Texas FY2014 Adopted Annual Budget and Program Objectives. 171 Financial Management Services Department, City of Fort Worth. (2012). Comprehensive Annual Financial Report. 172 City of Fort Worth. City of Fort Worth, Texas FY2014 Adopted Annual Budget and Program Objectives.

LAKE WORTH GREENPRINT REPORT Page 98 of 116
that generate approximately $180,000 per year, though this money is mainly used for services and
security in parks around the lake.173 In addition, the Tarrant Regional Water District (TRWD), which controls reservoirs and infrastructure
along the Trinity River and provides water to Tarrant County (including Fort Worth),174
leases land for oil and gas production. TRWD had $45,415,774 in total revenue in 2013, and $31,367,889, or 69% of this total revenue, was from oil and gas royalties. An additional $1,385,702 (3 percent) was from lease
rentals.175
In 2008, oil and gas royalties provided almost $70 million in revenue, and over the past ten
years, have provided an average of $32 million per year.176 The TRWD has built parks and as part of some of their projects there are recreational and open space components. For instance, the district acquired almost 400 acres of land in 2008 (along with other government and private funding) and
created Eagle Mountain Park.177
As part of one recent program, TRWD was the first partner to work with the United States Department of Agriculture to assess their watersheds to study nonpoint
source pollution and best management practices.178
ADDITIONAL LOCAL FUNDING SOURCES As mentioned earlier, there are many political jurisdictions and taxing authorities that may have an interest in protecting land in the Lake Worth watershed as well as funds to bring to bear including Tarrant and Parker counties, water suppliers, and state and federal conservation agencies. The Tarrant Regional Water District, for example, has broad authority to own and manage lands for water supply purposes. The District can levy taxes, issue bonds, and impose rates/fees. The District has partnered with Tarrant County, the City of Fort Worth and other entities to provide recreational opportunities on and around water supplies.
STATE CONSERVATION FUNDING PROGRAMS This section provides information on available state conservation funding programs, which are presented in alphabetical order. The State of Texas utilizes an allocation from sales tax revenue generated by sporting goods to provide funds for park operations, restoration and acquisition throughout the state, and offers outdoor recreation grants to local governments. Voters in Texas also approved (with 63 percent support) a $100 million bond measure in 2001 for park facilities (primarily major repairs to state parks), but the bond issuance did not include any funds for park land acquisition. In addition, in 2007, Texas voters approved Proposition 4 which authorized the issuance of up to $1 billion in general obligation bonds for construction projects, including $52 million to state parks. Other state funding programs with a park land acquisition component receive federal funding.
173 Ibid. 174 Tarrant Regional Water District. Overview. 175 Tarrant Regional Water District. (2013). Annual Financial Report. 176 Ibid. 177 Tarrant Regional Water District. History of TRWD

LAKE WORTH GREENPRINT REPORT Page 99 of 116
0
50
100
150
200
250
Federal State Local Private NGO
Tho
usa
nd
s
Acres protected, 1998-2008
$0
$50
$100
$150
$200
$250
$300
Federal State Local Private NGO
Mill
ion
sDollars spent, 1998-2008
Between 1998 and 2008 the state spent more than $17 million on land acquisitions totaling approximately 105,000 acres. However, when viewed more broadly, Texas ranks 49th nationally in terms of per capita spending for conservation. The table below shows the average spending of the top four states and states near to Texas.
State Conservation Programs In 1993, the 73rd Texas Legislature passed H.B. 706. This bill switched the revenue source for state and local parks from the state cigarette tax to draw from the general sales tax revenue attributable to sporting goods sales. However, legislators capped the amount of draw at $27 million for 1993 and 1994. In 1995, the cap was increased to $32 million and in 2007 the $32 million cap on the sporting goods tax was lifted. Beginning in FY2008, 94 percent of sporting good sales tax collections each biennium is credited to the Texas Parks and Wildlife Department (TPWD) and six percent to the Texas Historical Commission. The new legislation allots the State Parks Account with 74 percent of the proceeds credited to the TPWD to be used for larger counties within the Local Park Grant Program. The bill also credits the Texas Recreation and Parks account with 15 percent of the proceeds credited to TPWD each biennium to provide for grants in smaller communities through the Local Park Grant Program. Finally, the remaining one percent of the proceeds to TPWD goes to the Texas Parks and Wildlife Conservation and Capital Account. Allocations remain subject to appropriation by the Legislature, however, and the department has yet to receive "full funding" from this revenue source. Also in 2007, Texas voters approved Proposition 4 which allocated $52 million to state parks.
StateTotal state
spending$ per capita State
Total state
spending$ per capita
Alaska $176,155,782 $248 New Mexico $30,995,946 $15
Florida $2,869,414,876 $153 Arkansas $43,991,918 $15
Colorado $723,204,521 $144 Oklahoma $10,596,676 $3
North Carolina $1,064,878,995 $112 Texas $15,088,226 $1
State Spending for Conservation per Capita, 1998-2008, selected states
Source: Trust for Public Land, Conservation Almanac

LAKE WORTH GREENPRINT REPORT Page 100 of 116
Texas voters approved Proposition 8 in 2001 with 63 percent support, which provided $100 million in bond authority for major repairs to state parks and other TPWD sites. Such bonds require legislative appropriations for debt service funding to pay back the bond issue. In 2005 the Texas Legislature established the Texas Farm and Ranch Lands Conservation Program. The program enables Texas to purchase conservation easements from willing landowners in order to prevent the development of rural lands with outstanding ecological or cultural value. However, the legislature has not appropriated funding for this program to date.
Texas Parks and Wildlife Department The Parks and Wildlife Department (TPWD) uses proceeds from the sale of hunting and fishing licenses, the sale of a Horned Toad license plate, as well as park entrance fees to fund a $69 million annual operating budget for state parks and historical sites. TPWD also administers the Local Park Grant Programs, which encompass six separate grants. These include: Outdoor Recreation, Indoor Recreation, Urban Outdoor Recreation, Urban Indoor Recreation, Small Community and Regional Outdoor Recreation. The Texas Parks and Wildlife Department’s fiscal year 2014 operating and capital budget totals about $380 million, including $15.5 million for local parks grants to cities and counties across the state. The 2014 budget is an increase from the 2013 budget of $357 million, but still below the $423 million for 2011.
State Wildlife Grants & Horned Lizard License Plate Grants To fund conservation actions identified in the 2005 Texas Wildlife Action Plan, the Texas Parks and Wildlife Department offers competitive State Wildlife Grants (SWG) and Horned Lizard License Plate (HLLP) grants. 179 However, the SWG grant program only has about $189,000 in remaining grant funds from the Wildlife and Sport Fish Restoration program managed by the US Fish and Wildlife Service. The HLLP grant program has about $300,000 available in grant funding, which is generated from the Texas conservation license plate sales. Conservation projects should contribute to threat/impact reduction to improve the condition of species of greatest conservation need, habitats/systems on which they depend, and/or natural processes that support habitat function, as defined by the 2005 Texas Wildlife Action Plan. Additional priority will be given to projects that promote collaboration with partners and emphasize conservation on private lands. Eligible applicants include conservation practitioners from state agencies, universities, or non-governmental organizations and proposals should not exceed a maximum of $50,000 for a one-year project. In fiscal year 2011, the non-federal match requirement of SWG is 35 percent of the requested total project cost for eligible actions.
Texas Historical Commission: Certified Local Government Grants For projects with a historical preservation component, the Texas Historical Commission offers Certified Local Government (CLG) grants to participating city and county governments to develop and sustain an effective local preservation program critical to preserving local historic resources. To participate, city and county governments must be certified by the National Park Service as CLGs.
179 http://www.tpwd.state.tx.us/business/grants/wildlife/swgrants/

LAKE WORTH GREENPRINT REPORT Page 101 of 116
Funding for the CLG comes from annual allocations from the Historic Preservation Fund of the National Park Service, U.S. Department of the Interior, from which the Texas Historical Commission sets aside at least ten percent for distribution solely to CLGs. The CLG grants can be used for local historic preservation projects, including surveys of historic properties/districts, preparation of nominations to the National Register of Historic Places and other community-based preservation projects, though further research is required as to whether the grants may be used for land acquisition. All CLG grants require a local cash match budgeted on a one-to-one (dollar for dollar) match equal to a 50-50 ratio for the total cost of the project. Proposed projects utilizing all or partial matches of verifiable in-kind services and/or goods may also qualify as long as the local match equals a 50-50 ratio for the total cost of the project. Only non-federal monies may be used as a match, with the exception of Community Development Block Grants. The CLG grant applications are typically due in the late summer of each year. CLG grant awards typically range from $2,000 to $30,000.
Texas Parks & Wildlife Department: Recreation Grants Program With proceeds from the state sporting goods sales tax allocation, the TPWD offers a number of distinct recreation grants to local governments for outdoor recreation.180 Program assistance may be available to acquire lands and waters or interest in lands and waters for public recreation and to develop basic recreation facilities to serve the general public. To be eligible for assistance, there must be a present or future need for the acquisition and development of the property for which the grant is requested or the use is proposed; the project must be endorsed by the regional planning commission or council having jurisdiction in the area where the project is proposed; and the project must be submitted by an eligible sponsor.
Urban Outdoor Recreation Grants Grants are available to cities and counties with populations over 500,000 for the acquisition and development of park land. This assistance program is distributed in the form of 50 percent matching grant funds up to $1,000,000. Local governments must apply, permanently dedicate project areas for public recreational use, and assume responsibility for operation and maintenance. The deadline for this grant is March 1st each year.
Urban Indoor Recreation Grants Grants are available to cities and counties with populations over 500,000 for the acquisition, construction or renovation of indoor recreation facilities. This assistance is in the form of 50 percent matching grant funds up to $1,000,000. Local governments must apply, permanently dedicate the building for public recreational use, and assume responsibility for operation and maintenance. The annual application deadline is August 1st.
Recreational Trail Grants TPWD administers the National Recreational Trails Fund in Texas under the approval of the Federal Highway Administration. This federally funded program receives its funding from a portion of federal gas taxes paid on fuel used in non-highway recreational vehicles. Grants can be up to 80 percent of project cost with a maximum of $200,000 for non-motorized trail grants; there is no
180 http://www.tpwd.state.tx.us/business/grants/trpa/#trpa Another outdoor recreation grant program for boating access is not included in this report.

LAKE WORTH GREENPRINT REPORT Page 102 of 116
maximum for motorized trail grants. Funds can be spent on motorized and non-motorized recreational trail projects such as the construction of new recreational trails, to improve existing trails, to develop trailheads or trailside facilities, and to acquire trail corridors. The application deadline is February 1st each year. Funds can be accessed by municipal and other governmental units, in addition to non-profits. TPWD also provides three additional outdoor recreation grants to communities with smaller populations (such that the City of Forth Worth would not qualify for these grants but smaller communities within the Lake Worth watershed are eligible), as follows:
Outdoor Recreation Grants: This grant program provides 50 percent matching grant funds to municipalities, counties, special districts, and other local units of government with populations less than 500,000 to acquire and develop parkland or to renovate existing public recreation areas. There are two funding cycles each year with a maximum award of $500,000. Eligible sponsors include cities, counties, river authorities, and other special districts. Projects must be completed within three years of approval. Application deadlines are March 1st and August 1st each year. Award notifications occur approximately six months after deadlines.
Indoor Recreation Grants: This grant provides 50 percent matching grant funds to municipalities, counties and other local units of government with populations less than 50,000 to construct recreation centers, nature centers and other indoor recreation-related buildings. The grant maximum is $750,000. The application deadline is August 1st each year (the master plans submission deadline is at least 60 days prior to the application deadline). Award notifications occur the following January.
Small Community Grants: The Small Community grant program was created to meet the recreation needs of small Texas communities with a population of 20,000 and under. The grant provides 50 percent matching grant funds to eligible municipalities and counties. The maximum grant amount is $75,000. Funds must be used for development or acquisition of parkland. Eligible projects include ball fields, boating, fishing, and hunting facilities, picnic facilities, playgrounds, swimming pools, trails, camping facilities, beautification, restoration, gardens, sports courts and support facilities. The deadline for this grant is March 1st each year.

LAKE WORTH GREENPRINT REPORT Page 103 of 116
The table below shows Texas Parks and Wildlife grants to the city of Fort Worth for Fiscal Year 2014.
FEDERAL FUNDING OPPORTUNITIES The U.S. federal government is an important partner for state and local governments, parks and conservation organizations, and community advocates. This report provides a summary of numerous relevant federal conservation funds for open space and urban areas. The programs discussed are administered by federal agencies but vary in how funds are delivered for conservation projects. For example, some of these program funds are directed to the states, which in turn decide what projects to fund, while other program funds are granted by a federal agency through a competitive process. Each program has different requirements and offers various partnership opportunities (e.g. applying through the state, working with private landowners, etc.) that should be further evaluated to determine most likely funding outcomes. The descriptions are meant to provide a broad overview of funding sources. The Trust for Public Land can provide additional information on program rules and accessibility.
State Directed Federal Grants
Land and Water Conservation Fund (LWCF) Stateside The Land and Water Conservation Fund (LWCF) derives its funding from a small portion ($900 million) of annual offshore oil and gas drilling receipts that are deposited into a specific account and further appropriated by Congress. The Stateside LWCF program provides grants to the states to use for land protection and recreational facilities. The fund provides a 50 percent match to states for planning, developing and acquiring land and water areas for natural resource protection and recreation enhancement. Annual appropriations to the state grants LWCF program nationwide have ranged from a high of $369 million in 1979 to four years of zero funding between 1996 and 1999 and a level of $45 million in the most recent federal fiscal year 2012. Funds are distributed to states through a formula based on population and need. Once the funds are distributed to the states, it is up to each state to approve grant recipients, though NPS has final approval.
Texas Parks and Wildlife Department Grants - City of Fort Worth FY 2014 Budget
TITLE DEPARTMENT TOTAL COST AGENCY
COST
CITY OF
FORT
WORTH
Urban Outdoor Recreation GrantNorthwest Community Park Parks and
Community Services 2,000,000 1,000,000 1,000,000
Urban Outdoor Recreation GrantMarine Creek Corridor Parks and
Community Services 2,898,346 1,000,000 1,898,346
Indoor Urban Recreation GrantChisholm Trail Community Center Parks
and Community Services 4,622,854 1,000,000 3,622,854
Gateway Park Oxbow Parks and Community Services 4,000,000 2,000,000 2,000,000
Take Me Fishing Parks and Community Services 22,700 20,000 2,700
Rotary Park Trailhead at Trinity Park
(match Rotary Club & Strearns &
Valleys, Inc)
Parks and Community Services 220,000 110,000 0

LAKE WORTH GREENPRINT REPORT Page 104 of 116
Conservation Reserve Enhancement Program (CREP) An offspring of the Conservation Reserve Program (CRP), CREP is a voluntary program for agricultural landowners. Through CREP, state and federal partnerships allow landowners to receive incentive payments for installing specific conservation practices. Farmers can receive annual rental payments and cost-share assistance to establish long-term, resource-conserving covers on eligible land.
State Revolving Fund Programs (Clean Water and Drinking Water SRFs) Under the Clean Water Act, the U.S. Environmental Protection Agency (EPA) funds four water quality programs, with the Clean Water State Revolving Fund (CWSRF) being the largest by far. Clean Water State Revolving Fund (Section 212): The CWSRF provides loans for water quality improvements and has traditionally been used for wastewater treatment upgrades, although some states have used funding for land conservation. The annual capitalization grants totaled $1.46 billion in FY 2012. Drinking Water State Revolving Fund: The EPA awards grants to states to fund their Drinking Water State Revolving Funds (DWSRF). State DWSRFs provide loans and other assistance to eligible public water systems to finance the costs of infrastructure projects, including land acquisition. Up to 15 percent of the funds can be set-aside to fund source water protection activities, including land acquisition, although only 10 percent may go to a single purpose. The annual capitalization grants totaled $919 million in FY 2012. Nonpoint Source Program (Section 319): Provides grants for projects that address nonpoint source pollution, such as BMPs (best management practices) implementation, restoration and public education. On a very limited basis, Section 319 has been used for land conservation. Funding for FY 2012 totaled approximately $164.5 million. Clean Water State Revolving Fund (CWSRF) Under the CWSRF, the EPA provides annual grants to states that match the capitalization grants with 20 percent of their own funds. States use these capitalization grants to provide loans (grants are not permitted) to public and private borrowers, with a maximum term of 20 years. States may pool the federal capitalization grant with other funding and can also issue bonds using pool funds. Since the CWSRF Program began in 1987, the federal government has provided more than $32.8 billion in capitalization grants, which have been matched by $5.8 billion in state contributions. Nearly half the states have used these federal and state funds to back the issue of nearly $34 billion in bonds to fund projects and to create debt service reserves. In 2010, the average leveraging ratio was roughly 2:1. In total, almost $64 billion in funding has been created through the CWSRF program since it began. CWSRF Innovations: Land Conservation States file an intended use plan with the EPA that clearly spells out how they will allocate their CWSRF funds. Since the program’s inception, most states have used their CWSRF primarily for wastewater treatment plants. However, since 1995, more funding has been shifted into nonpoint source pollution control and estuary management, with roughly six percent of annual funds going for non-point source pollution, up from one percent in prior years. In particular, several states have used their CWSRF to help local governments and nonprofits purchase watershed land, restore watersheds, and reduce flooding.

LAKE WORTH GREENPRINT REPORT Page 105 of 116
Drinking Water State Revolving Fund (DWSRF) Under the Safe Drinking Water Act Amendments of 1996, the EPA is authorized to provide grants to states to capitalize Drinking Water State Revolving Funds. The State Revolving Funds provide loans and other assistance to eligible public water systems to finance the cost of infrastructure projects. States must file an intended use plan describing how they will use the proceeds and must match 20 percent of the grant. Up to 15 percent of the funds can be set-aside to fund source water protection activities, including land acquisition. However, no more than 10 percent of the set-asides can be used for a single type of activity. Grants are allotted to each state based on needs identified in the most recent Drinking Water Needs Survey. Clean Water Act Section 319 (h) -- Nonpoint Source Pollution In 1987 Congress recognized that state and local water authorities needed assistance with developing and implementing measures to control nonpoint source (NPS) pollution. The enactment of Section 319 of the Clean Water Act (CWA) established a national program to control nonpoint sources of water pollution, as well as a means to help fund state and local implementation of nonpoint source management programs. Under the provisions of Section 319, land acquisition can be used as a nonpoint source management tool. In EPA Region 4 (Southeastern U.S.), fifteen land acquisition projects were approved between fiscal years 1995 and 1999, at a total cost of $5.2 million. No acquisition projects have been funded using Section 319 funds between 2000 and 2012.
Farm and Ranch Lands Protection Program (FRPP) With passage of the 2002 Farm Bill, the Federal government took on a much greater ability to serve as a partner in the purchase of development rights (PDR), through conservation easements, on productive agricultural land. The 2008 Farm Bill nearly doubled the funding available for the U.S. Department of Agriculture’s Farm and Ranch Lands Protection Program (FRPP), authorizing $743 million between FYs 2008 and 2012, up from $499 million over the five year period covered in the prior Farm Bill. To date, more than 500,000 acres were protected through PDR as a result of the program. In fiscal year 20011, the FRPP provided $161 million in grants to states, local governments, tribes and nonprofit conservation groups to purchase conservation easements on agricultural land. Grants are awarded on a competitive basis, according to national and state criteria, and require a 50 per cent non-NRCS match to cover the cost of the easement. Up to 25 per cent of donated land value can be counted as the match.
Forest Legacy Program (FLP) The Forest Legacy Program was established in 1990 to provide federal matching grants to states to prevent the loss of private forestlands. States must first qualify for the program by preparing an Assessment of Need before becoming eligible for funds. The program requires at least a 25 percent non-federal match, which can be provided through public and private sources including land value donation. Appropriations for the program have increased from $5 million in FY 1992 to $53 million approved in FY 2012. There are currently 50 states and territories enrolled in the program.

LAKE WORTH GREENPRINT REPORT Page 106 of 116
North American Wetlands Conservation Act (NAWCA) The North American Wetlands Conservation Act was passed in 1989 to provide matching grants for the acquisition, restoration, and enhancement of wetland ecosystems for the benefit of waterfowl and other wetland-associated migratory species. Administered by the U.S. Fish and Wildlife Service, grants area available to nonprofit organizations, public agencies, and private individuals in the U.S., Canada and Mexico. Two types of grants are awarded: small grants for up to $75,000 and standard grants for up to $1 million. There is a 1:1 non-federal match requirement for each grant. The NAWCA matching grant program grew steadily from $15 million in FY 2000 to $66.1 million in FY 2006, but has seen decline in recent years. The FY 2012 appropriations level for NAWCA was $35.5 million. These funds are supplemented by funds from other sources and matched by significant levels of non-federal funding. From September 1990 through March 2011, some 4,500 partners in 2,067 projects have received more than $1.1 billion in grants. They have contributed another $2.32 billion in matching funds to affect 26.5 million acres of habitat and $1.21 billion in nonmatching funds to affect 234,820 acres of habitat.
State Wildlife Grants Created by Congress in 2001, the State Wildlife Grants Program is a matching grant program available to every state to support cost-effective, on-the-ground conservation efforts aimed at restoring or maintaining populations of native species before listing under the Endangered Species Act is required. In order to maximize the effectiveness of this program, Congress required each state to develop a comprehensive wildlife conservation strategy for the conservation of the state’s full array of wildlife and the habitats they depend upon. These plans identify species and habitats of greatest conservation need and outline the steps necessary to keep them from becoming endangered. The State Wildlife Grants Program provides matching funds that are to be used to implement the conservation recommendations outlined in these plans. Funds appropriated under the SWG program are allocated to every state according to a formula based on a state size and population. Since its inception in 2001, the State Wildlife Grants Program has played a critical role in the conservation of wildlife in all three states.
Direct Federal Acquisition Federal land holdings represent a significant component to the state’s system of protected natural areas including parks, forests and wildlife refuges. However, federal programs should not be expected to make significant contributions towards the state’s conservation goals as the number and size of current federal acquisitions is relatively small.
Land and Water Conservation Fund Federal The Land and Water Conservation Fund (LWCF) provides funding for federal agencies (Fish and Wildlife Service, Forest Service, National Park Service, and the Bureau of Land Management) to add land to existing parks, forests and refuges. This funding provides the bulk of the money available for this purpose.
Fish and Wildlife Service The National Wildlife Refuge System of the U.S. Fish and Wildlife Service (FWS), established over 100 years ago, has grown to 150 million acres. It now includes 560 refuges, more than 3,000 waterfowl

LAKE WORTH GREENPRINT REPORT Page 107 of 116
protection areas, and more than 38 wetland management districts and other protected areas spread across the 50 states and several U.S. territories.
U.S. Department of Agriculture The USDA Forest Service’s National Forest System includes 155 national forests, 20 national grasslands, 5 national monuments, the National Tallgrass Prairie, and 6 land utilization projects. These units are located in 44 states, Puerto Rico, and the Virgin Islands, and encompass over 192 million acres.
National Park Service The National Park Service (NPS) has 13 national parks and 110 community conservation and recreation projects (since 1987) in Texas. These units receive almost 4 million visitors a year, and they generate $188,100,000 million in economic benefit from visitors and tourism alone.181
Department of Defense - Readiness and Environmental Protection Integration (REPI) Responding to encroachment pressures such as sprawl, environmental regulations, and competition for land, airspace and water, the Department of Defense (DoD) asked Congress for authorization to address the challenges it faced to readiness and training. Congress responded by establishing the Readiness and Environmental Protection Integration (REPI) program. The program allows the military services (Army, Navy, Marine Corps, and Air Force) to enter into agreements with private conservation organizations as well as state and local governments to acquire conservation or restricted-use easements and other interests in land in the vicinity of military installations such as bases, posts, and forts. Since 2003, REPI has helped to protect more than 300,000 acres across the country. In Texas, REPI projects have been completed at Fort Bliss, Fort Hood, and JB San Antonio. REPI funds can be supplemented by additional DoD funding. Contributions from partners leverages total DoD funding approximately one to one. The Naval Air Station Fort Worth Joint Reserve Base (NAS JRB) is a major landholder in the watershed. NASJRB is a 1,800-acre base home to a variety of Navy, Marine Corps, Air Force, Army and Texas Air National Guard units. It includes Carswell Field, an active airbase. Currently there are 10,000 active civilian and non-civilian personnel stationed at the base.
Federal Funding Sources for Urban Areas
U.S. Army Corps of Engineers Civil Works Programs The U.S. Army Corps of Engineers has both military and civilian responsibilities. Under its civil works program, the Corps plans, constructs, operates, and maintains a wide range of water projects, headed by a civilian Assistant Secretary of the Army for Civil Works. A military Chief of Engineers oversees the Corps’ civil and military operations and reports on civil works matters to the Assistant Secretary for Civil Works. Projects generally originate with a request for assistance from a
181 National Park Service. 2013. Working with Texas: By the Numbers.

LAKE WORTH GREENPRINT REPORT Page 108 of 116
community or local government entity. A study of the project is often in order, allowing the Corps to investigate a problem and determine if there is a federal interest in proceeding further. The study must be authorized by Congress, usually in the Water Resources Development Act (WRDA), and must be funded through the annual Energy and Water Appropriations bill. Congress also provides authorizations and appropriations to the Corps for the Continuing Authorities Programs (CAP). Two programs, Section 1135 and Section 206 are of special interest. Section 1135 provides authority for the Corps of Engineers to investigate study, modify, and construct projects for the restoration of fish and wildlife habitats where degradation is attributable to water resource projects previously constructed by the Corps of Engineers. Project modifications are limited to a Federal cost of $5 million per project. The program limit for Section 1135 is $25 million. Aquatic Ecosystem Restoration (WRDA Section 206) provides authority for the Corps of Engineers to carry out aquatic ecosystem restoration and protection projects if the project will improve the quality of the environment, is in the public interest, and is cost effective. Each project is limited to a Federal cost of $5,000,000. The total program limit is $25 million.
Transportation Alternatives Program (TAP) – U.S. Department of Transportation In 2012 Congress passed MAP-21, a two-year surface transportation reauthorization bill covering FY 2013 and FY 2014. The bill consolidated several previous trail and recreation related programs into one pot: the Transportation Alternatives Program (TAP). TAP includes many of the activities of the former transportation enhancements program (TE), the Safe Routes to School program (SRTS) and the Recreational Trails Program (RTP). Previously these programs received guaranteed sums as determined by Congress. However, now they receive a lump sum that is distributed via formula to the states within the umbrella of eligible activities. TAP will receive about $815 million nationally for each of the two years. The Transportation Alternatives Program continues enhancements funding for trail and bike projects and rail-to-trail conversions, but no longer funds land acquisition. The following is a more detailed description of eligible activities: A. Construction, planning, and design of on-road and off-road trail facilities for pedestrians, bicyclists, and other nonmotorized forms of transportation, including sidewalks, bicycle infrastructure, pedestrian and bicycle signals, traffic calming techniques, lighting and other safety-related infrastructure, and transportation projects to achieve compliance with the Americans with Disabilities Act of 1990. B. Construction, planning, and design of infrastructure-related projects and systems that will provide safe routes for non-drivers, including children, older adults, and individuals with disabilities to access daily needs. C. Conversion and use of abandoned railroad corridors for trails for pedestrians, bicyclists, or other nonmotorized transportation users Safe Routes to School program includes funds for projects that encourage elementary and middle school children to safely walk and bike to school. A. Infrastructure-related projects.-planning, design, and construction of infrastructure-related projects on any public road or any bicycle or pedestrian pathway or trail in the vicinity of schools that will substantially improve the ability of students to walk and bicycle to school, including sidewalk improvements, traffic calming and speed reduction improvements, pedestrian and bicycle crossing

LAKE WORTH GREENPRINT REPORT Page 109 of 116
improvements, on-street bicycle facilities,off-street bicycle and pedestrian facilities, secure bicycle parking facilities, and traffic diversion improvements in the vicinity of schools. B. Noninfrastructure-related activities to encourage walking and bicycling to school, including public awareness campaigns and outreach to press and community leaders, traffic education and enforcement in the vicinity of schools, student sessions on bicycle and pedestrian safety, health, and environment, and funding for training, volunteers, and managers of safe routes to school programs. The Recreation Trails Program is a federal transportation program that provides monies for the maintenance, development, acquisition and construction of new and existing trail facilities for both motorized and nonmotorized recreational trail uses. Funds are distributed to the states according to a formula. Eligible applicants include nonprofit organizations, municipal agencies, state agencies, federal government agencies and other government entities (regional governments, port districts, etc.). Eligible projects include: (1) maintenance and restoration of existing trails, (2) development and rehabilitation of existing trails, (3) construction of new recreation trails, and (4) acquisition of easements and fee simple title to property. Grants are distributed annually and require a twenty (20) percent match. The Congestion Mitigation and Air Quality (CMAQ) program was created by Congress to help states and Metropolitan areas meet ambient air quality standards. The CMAQ program provides funding to areas that face the challenge of attaining or maintaining the air quality standards for ozone, carbon monoxide, or particulate matter. Funds are used on transportation projects that improve air quality, lower auto emissions, and reduce congestion. Eligible activities of potential interest for TPL projects include bike and pedestrian trail construction and parking and public right-of-ways for transit connections. Regional transportation authorities are responsible for allocating discretionary federal, state and local transportation funds to improve all modes of surface transportation. Generally a competitive process through the Metropolitan Planning Organization distributes discretionary capital transportation funds to regionally significant projects. While the MPO generally administers the CMAQ program, localities propose various projects to the MPO for consideration and prioritization. Local jurisdictions, transit operators, and other public agencies are encouraged to submit applications proposing projects for funding. MAP-21 allows states to transfer up to 50 percent of CMAQ funds to other programs. That is an increase from the 21 percent transfer allowed under the former law, SAFETEA-LU. This flexibility under MAP-21 demonstrates how environmental and progressive projects will become more competitive with other traditional road and highway projects. MAP-21 provides roughly $2.2 billion for the CMAQ program for each of the FY 2013 and FY 2014 spending years. Transportation Investment Generating Economic Recovery (TIGER) Discretionary Grants In 2012, there was hope that Congress would include the program in the new transportation authorization law, but MAP-21 neither authorizes it nor provides any funding. However, for FY 2014 DOT is authorized to award $600 million in TIGER (Transportation Investment Generating Economic Recovery) Discretionary Grants pursuant to the Consolidated Appropriations Act. This appropriation is similar, but not identical to the appropriation for the "TIGER" program authorized and

LAKE WORTH GREENPRINT REPORT Page 110 of 116
implemented pursuant to the American Recovery and Reinvestment Act of 2009 (aka "Stimulus" funding). Because of the similarity in program structure, DOT continues to refer to the program as ''TIGER Discretionary Grants.'' As with previous rounds of TIGER, funds for the FY 2014 TIGER program are to be awarded on a competitive basis for projects that will have a significant impact on the nation, a metropolitan area, or a region. The TIGER Discretionary Grant program, provides a unique opportunity for the U.S. Department of Transportation to invest in road, rail, transit and port projects that promise to achieve critical national objectives. Congress dedicated more than $4.1 billion to the program: $1.5 billion for TIGER I, $600 million for TIGER II, $526.944 million for FY 2011, $500 million for FY 2012, $473.847 million for FY2013, and $600 million for the FY 2014 round of TIGER Grants to fund projects that have a significant impact on the Nation, a region or a metropolitan area. TIGER's highly competitive process, galvanized by tremendous applicant interest, allowed DOT to fund 51 innovative capital projects in TIGER I, and an additional 42 capital projects in TIGER II. TIGER II also featured a new Planning Grant category and 33 planning projects were also funded through TIGER II. In the FY 2011 round of TIGER Grants, DOT awarded 46 capital projects in 33 states and Puerto Rico. The TIGER 2012 program funded 47 transportation projects in 34 states and the District of Columbia and the TIGER 2013 program announced 52 capital projects in 37 states. Each project is multi-modal, multi-jurisdictional or otherwise challenging to fund through existing programs. The TIGER program enables DOT to use a rigorous process to select projects with exceptional benefits, explore ways to deliver projects faster and save on construction costs, and make investments in the nation's infrastructure that make communities more livable and sustainable. Eligible Applicants for TIGER Discretionary Grants include: state, local, and tribal governments, transit agencies, port authorities, metropolitan planning organizations (MPOs), other political subdivisions of State or local governments, and multi-State or multi-jurisdictional groups applying through a single lead applicant. TPL could act as a sub-contractor and/or partner in the project. Projects in urban areas must meet a baseline of $10 million and have at least a 20 percent non-federal match. Successful applications would include cost benefit analysis for economic and environmental impacts, projections for job creation, and should generally have multiple stakeholders and political support. While funding cannot be used for land acquisition, activities of note to TPL include hard and soft costs for bike and pedestrian trails and environmental plans that include greenhouse gas reduction.
The Transportation Infrastructure Finance and Innovation Act (TIFIA) The Transportation Infrastructure Finance and Innovation Act (TIFIA) program provides Federal credit assistance in the form of direct loans, loan guarantees, and standby lines of credit to finance surface transportation projects of national and regional significance. TIFIA credit assistance provides improved access to capital markets, flexible repayment terms, and potentially more favorable interest rates than can be found in private capital markets for similar instruments. TIFIA can help advance qualified, large-scale projects that otherwise might be delayed or deferred because of size, complexity, or uncertainty over the timing of revenues. Many surface transportation projects - highway, transit, railroad, intermodal freight, and port access - are eligible for assistance. Each dollar

LAKE WORTH GREENPRINT REPORT Page 111 of 116
of Federal funds can provide up to $10 in TIFIA credit assistance - and leverage $30 in transportation infrastructure investment. The program's fundamental goal is to leverage Federal funds by attracting substantial private and other non-Federal co-investment in critical improvements to the nation's surface transportation system. TIFIA was created because state and local governments that sought to finance large-scale transportation projects with tolls and other forms of user-backed revenue often had difficulty obtaining financing at reasonable rates due to the uncertainties associated with these revenue streams. Tolls and other project-based revenues are difficult to predict, particularly for new facilities. Although tolls can become a predictable revenue source over the long term, it is difficult to estimate how many road users will pay tolls, particularly during the initial "ramp-up" years after construction of a new facility. Similarly, innovative revenue sources, such as proceeds from tax increment financing, are difficult to predict. TIFIA credit assistance is often available on more advantageous terms than in the financial market making it possible to obtain financing for needed projects when it might not otherwise be possible. The TIFIA credit program offers three distinct types of financial assistance designed to address the varying requirements of projects throughout their life cycles: • Secured (direct) loan - Offers flexible repayment terms and provides combined construction and permanent financing of capital costs. Maximum term of 35 years from substantial completion. Repayments can start up to five years after substantial completion to allow time for facility construction and ramp-up. • Loan guarantee - Provides full-faith-and-credit guarantees by the Federal Government and guarantees a borrower's repayments to non-Federal lender. Loan repayments to lender must commence no later than five years after substantial completion of project. • Standby line of credit - Represents a secondary source of funding in the form of a contingent Federal loan to supplement project revenues, if needed, during the first 10 years of project operations, available up to 10 years after substantial completion of project. The amount of Federal credit assistance may not exceed 33 percent of total reasonably anticipated eligible project costs. The exact terms for each loan are negotiated between the USDOT and the borrower, based on the project economics, the cost and revenue profile of the project, and any other relevant factors. For example, USDOT policy does not generally permit equity investors to receive project returns unless the borrower is current on TIFIA interest payments. TIFIA interest rates are equivalent to Treasury rates. Depending on market conditions, these rates are often lower than what most borrowers can obtain in the private markets. Unlike private commercial loans with variable rate debt, TIFIA interest rates are fixed. Overall, borrowers benefit from improved access to capital markets and potentially achieve earlier completion of large-scale, capital intensive projects that otherwise might be delayed or not built at all because of their size and complexity and the market's uncertainty over the timing of revenues. Any type of project that is eligible for Federal assistance through existing surface transportation programs (highway projects and transit capital projects) is eligible for the TIFIA credit program. An eligible project must be included in the applicable State Transportation Improvement Program. Major requirements include a capital cost of at least $50 million (or 33.3 percent of a state's annual apportionment of Federal-aid funds, whichever is less) or $15 million in the case of ITS. TIFIA credit assistance is limited to a maximum of 33 percent of the total eligible project costs.

LAKE WORTH GREENPRINT REPORT Page 112 of 116
Community Development Block Grants (CDBG) - U.S. Department of Housing and Urban Development The Department of Housing and Urban Development provides Entitlement Communities Grants for the principal cities of Metropolitan Statistical Areas (MSAs), other metropolitan cities with populations of at least 50,000; and qualified urban counties with populations of at least 200,000 (excluding the population of entitled cities). CDBG funds may be used for activities that include, but are not limited to acquisition of real property; relocation and demolition; and construction of public facilities and improvements, such as water and sewer facilities, streets, neighborhood centers, and the conversion of school buildings for eligible purposes. For specifics on which community received CDBG funds, go to the following webpage and click on the relevant state: http://portal.hud.gov/hudportal/HUD?src=/program_offices/comm_planning/about/budget/budget12. An additional HUD program is Brownfields Economic Development Initiative (BEDI). BEDI is a competitive grant program used to spur the return of brownfields to productive economic reuse. BEDI grants must be used in conjunction with a new Section 108 guaranteed loan. Both Section 108 loan proceeds and BEDI grant funds are initially made available by HUD to public entities approved for assistance. The Section 108 Loan Guarantee Program is a source of financing allotted for the economic development, housing rehabilitation, public facilities rehab, construction or installation for the benefit of low- to moderate-income persons, or to aid in the prevention of slums.
HUD Choice Neighborhoods Grants Choice Neighborhoods grants transform distressed neighborhoods and public and assisted projects into viable and sustainable mixed-income neighborhoods by linking housing improvements with appropriate services, schools, public assets, transportation, and access to jobs. A strong emphasis is placed on local community planning for access to high-quality educational opportunities, including early childhood education. Choice Neighborhoods grants build upon the successes of public housing transformation under HOPE VI to provide support for the preservation and rehabilitation of public and HUD-assisted housing, within the context of a broader approach to concentrated poverty. In addition to public housing authorities, the initiative will involve local governments, non-profits, and for-profit developers in undertaking comprehensive local planning with residents and the community. In the development of Choice Neighborhoods, HUD has focused on directing resources into three core goals: 1. Housing: Transform distressed public and assisted housing into energy efficient, mixed-income housing that is physically and financially viable over the long-term; 2. People: Support positive outcomes for families who live in the target development(s) and the surrounding neighborhood, particularly outcomes related to residents’ health, safety, employment, mobility, and education; and 3. Neighborhood: Transform neighborhoods of poverty into viable, mixed-income neighborhoods with access to well-functioning services, high quality public schools and education programs, high quality early learning programs and services, public assets, public transportation, and improved access to jobs.

LAKE WORTH GREENPRINT REPORT Page 113 of 116
Planning Grants Choice Neighborhoods Planning Grants support the development of comprehensive neighborhood revitalization plans which focused on directing resources to address three core goals: Housing, People and Neighborhoods. To achieve these core goals, communities must develop and implement a comprehensive neighborhood revitalization strategy, or Transformation Plan. The Transformation Plan will become the guiding document for the revitalization of the public and/or assisted housing units while simultaneously directing the transformation of the surrounding neighborhood and positive outcomes for families. In FY 2013, communities in 9 states received a total of $4.37 million in Choice Neighborhoods Planning Grants. The 9 communities each received between $400,000 and $500,000 for the development of comprehensive plans aimed at revitalizing public and assisted housing and linking that revitalization to a broader neighborhood transformation. The plans will connect rehabilitation of distressed public housing with strategies to eliminate neighborhood blight by addressing community needs such as education, public transportation, and economic opportunities. Implementation Grants In addition to the Planning Grants, the Choice Neighborhoods program also awards larger implementation grants to communities that have already completed the local planning process and are ready to implement their “Transformation Plan” to redevelop the neighborhood. In FY 2012 HUD announced that 4 communities will receive a combined $108.9 million to redevelop distressed housing and bring comprehensive neighborhood revitalization to blighted areas. The grantees were selected from nine finalists HUD announced in earlier in the year. Each of the finalists completed a comprehensive local planning process and ready to move forward with their plan to revitalize the housing and redevelop their target neighborhoods. Building on the successes of HUD’s HOPE VI Program, Choice links housing improvements with a wide variety of public services and neighborhood improvements to create neighborhoods of opportunity.
Brownfields Program - U.S. Environmental Protection Agency (EPA) If a property identified for acquisition or redevelopment is or might be a “brownfields” site, many programs and other benefits at the local, state and federal levels encourage its redevelopment. The U.S. Environmental Protection Agency’s Brownfields Program provides direct funding to eligible entities for brownfields assessment, cleanup, revolving loans, and environmental job training. In addition, legislation signed into law in 2001 limits the liability of certain contiguous property owners and prospective purchasers of brownfields properties, and innocent landowners are also afforded liability benefits to encourage revitalization and reuse of brownfield sites. EPA’s brownfields program provides several types of grants: • Assessment Grants provide funding for a grant recipient to inventory, characterize, assess, and conduct cleanup and redevelopment planning and community involvement related to brownfield sites. Eligible entities are states, local governments, regional planning and redevelopment agencies, and Indian tribes. An eligible entity may apply for up to $200,000 to assess a site contaminated by hazardous substances, pollutants, petroleum or contaminants co-mingled with petroleum, with a waiver up to $350,000 for site specific proposals. Such waivers must be based on the anticipated level of hazardous substances, pollutants, petroleum or contaminants (including hazardous substances co-mingled with petroleum) at a single site. Total grant fund requests must not exceed a

LAKE WORTH GREENPRINT REPORT Page 114 of 116
total of $400,000 per applicant unless the applicant requests a waiver. Due to budget limitations, no entity may apply for more than $700,000 in assessment funding. • Remediation grants are available for remediation of brownfield sites. These grants are limited to $200,000 per site, with no more than three applications per entity. There is a 20 percent cost-share. Eligible entities are the same as listed above, with the addition of NGOs, who are eligible to apply, but must have site control of the property. One site may qualify for two grants if pollutants include petroleum and non-petroleum contaminants. • Revolving Loan Fund grants (RLF) provide funding for a grant recipient to capitalize a revolving loan fund to provide sub grants to carry out cleanup activities at brownfields sites. Grants may be awarded up to $1 million per eligible entity, or a group of eligible entities, with a 20 percent cost share and a five-year time frame for completion. Eligible entities are the same as those listed under assessment grants. • Brownfields Area-Wide Planning grants may be used by communities to facilitate community involvement in developing an area-wide plan for brownfields assessment, cleanup and subsequent reuse on a catalyst site and other high-priority brownfield sites. Each grant is funded up to $200,000 for two years. • Technical Assistance to Brownfields Communities grants provide technical assistance to communities. The EPA awards of up to nine (9) cooperative agreement(s). Grants awarded under the Technical Assistance to Brownfields Communities (TAB) announcement will help communities tackle the challenge of assessing, cleaning up and preparing brownfields sites for redevelopment, especially underserved/rural/small and otherwise distressed communities. Technical assistance being provided through this grant should also be geared toward results and help to move brownfields sites forward in the process toward cleanup and reuse. The maximum value of each grant will be based on the technical assistance being provided. Annual grants are announced in approximately October of each calendar year.
Environmental Justice Small Grants - U.S. Environmental Protection Agency (EPA) Environmental Justice Small Grants support efforts aimed to ensure equal environmental and health protections for all Americans, regardless of race or socioeconomic status. The program assists recipients in building collaborative partnerships to help them understand and address environmental and public health issues in their communities. Successful collaborative partnerships involve not only well-designed strategic plans to build, maintain and sustain the partnerships, but also working towards addressing the local environmental and public health issues. The grants enable non-profit organizations to conduct research, provide education and develop solutions to local health and environmental issues in communities overburdened by harmful pollution. Successful past projects have addressed air quality, water quality, pollution, urban agriculture, and toxic substance abatement. Grant awards are up to $30,000 and no cost-sharing is required.
The National Endowment for the Arts - Our Town Grants Through the Our Town program the National Endowment for the Arts provides a limited number of grants, ranging from $25,000 to $200,000, for creative placemaking projects that contribute toward the livability of communities and help transform them into lively, beautiful, and sustainable places with the arts at their core. The grants are invested in creative and innovative projects in which communities improve their quality of life, encourage greater creative activity, foster stronger community identity and a sense of place, and revitalize economic development.

LAKE WORTH GREENPRINT REPORT Page 115 of 116
Projects may include arts engagement, cultural planning, and design activities. Arts engagement projects support artistically excellent artistic production or practice as the focus of creative placemaking work. Cultural planning projects support the development of artistically excellent local support systems necessary for creative placemaking to succeed. Design projects that demonstrate artistic excellence while supporting the development of environments where creative placemaking takes place, or where the identity of place is created or reinforced. All applications must have partnerships that involve two primary partners: a nonprofit organization and a local governmental entity. One of the two primary partners must be a cultural (arts or design) organization. Additional partners are encouraged.
The National Endowment for the Arts - Art Works Grants "Art Works" refers to three things: the works of art themselves, the ways art works on audiences, and the fact that art is work for the artists and arts professionals who make up the field. To make "art work," the NEA has included the advancement of innovation as a core component of its mission as a way to ensure the vitality of the arts. Through the projects that NEA supports in the Art Works category, the agency wants to achieve the following four outcomes: • Creation: The creation of art that meets the highest standards of excellence, • Engagement: Public engagement with diverse and excellent art, • Learning: Lifelong learning in the arts, and • Livability: The strengthening of communities through the arts. Partnerships can be valuable to the success of projects. While not required, applicants are encouraged to consider partnerships among organizations, both in and outside of the arts, as appropriate to their project. NEA is interested in projects that extend the arts to underserved populations – those whose opportunities to experience the arts are limited by geography, ethnicity, economics, or disability. This is achieved in part through the use of Challenge America funds. Grants generally will range from $10,000 to $100,000. Grants of $100,000 or more will be made only in rare instances and only for projects that the Arts Endowment determines demonstrate exceptional national or regional significance and impact. In recent years, well over half of the agency's grants have been for amounts less than $25,000. All grants require a nonfederal match of at least 50 percent. For example, if an organization receives a $10,000 grant, the total eligible project costs must be at least $20,000 and the organization must provide at least $10,000 toward the project from nonfederal sources.
Community Transformation Grants - Centers for Disease Control and Prevention The Centers for Disease Control and Prevention (CDC) continues its long-standing dedication to improving the health and wellness of all Americans through the Community Transformation Grant (CTG) Program. CDC supports and enables awardees to design and implement community-level programs that prevent chronic diseases such as cancer, diabetes, and heart disease. CTG supports state and local government agencies, tribes and territories, nonprofit organizations, and communities across the country. From the Prevention and Public Health Fund (PPHF) of the
LAKE WORTH GREENPRINT REPORT Page 116 of 116
Affordable Care Act and the Fiscal Year 12 Consolidated Appropriations Act, the program will support two-year projects to address health disparities in communities of up to 500,000 people. The Community Transformation Grant (CTG) program supports State and local governmental agencies and community-based organizations in the implementation, evaluation, and dissemination of evidence-based community health activities in order to reduce chronic disease rates, prevent the development of secondary conditions, address health disparities, and develop a stronger evidence-base of effective prevention programming. The overarching purpose of this program is to prevent heart attack, stroke, cancer, diabetes and other leading chronic disease-related causes of death or disability through a variety of “policy, environmental, programmatic, and, as appropriate, infrastructure” interventions to promote healthier lifestyles. Applicants propose activities in one or more of the following Strategic Directions: 1) Tobacco-free living; 2) Active living and healthy eating; 3) Quality clinical and other preventive services; 4) Social and emotional wellness; and 5) Healthy and safe physical environment. Coordination: Applicants should coordinate with multiple sectors in their area as appropriate for the interventions they will implement, such as public health, transportation, education, health care delivery, agriculture and others. If the applicant is not from the public health sector, a public health agency or organization should be included as a collaborator. Matching Funds: Although there is no statutory match requirement for this program, leveraging other resources and related on-going efforts to promote sustainability are strongly encouraged. Examples include complementary foundation funding, other US government funding sources including programs supported by the Department of Health and Human Services and other agencies. Intervention Population: The FY 2012 CTG program will support key evidence based program, policy, and infrastructure improvements in communities with populations up to 500,000 (such as small cities or towns), geographically distinct neighborhoods (with a designated Census tract), subpopulations of larger jurisdictions (such as school districts), selected populations (such as seniors or children), and tribes, including in rural and frontier areas. In 2011, CDC awarded $103 million to 61 state and local government agencies, tribes and territories, and nonprofit organizations in 36 states, along with nearly $4 million to 6 national networks of community-based organizations. In 2012, CTG was expanded to support areas with fewer than 500,000 people in neighborhoods, school districts, villages, towns, cities, and counties to increase opportunities to prevent chronic diseases and promote health. In an effort to reach more people, approximately $70 million was awarded to 40 communities to implement broad, sustainable strategies that will reduce health disparities and expand clinical and community preventive services that will directly impact about 9.2 million Americans. The expansion of CTG ensures that more Americans will benefit from healthier environments and have access to healthier options.


![2012 DVGBC Greenprint [#042 Special]](https://static.documents.pub/doc/80x56/568c4aa51a28ab491699030e/2012-dvgbc-greenprint-042-special.jpg)

