LAMAR COUNTY, MISSISSIPPI AND INCORPORATED AREAS COMMUNITY NAME COMMUNITY NUMBER LAMAR COUNTY, (UNINCORPORATED AREAS) 280304 LUMBERTON, CITY OF 280337 PURVIS, CITY OF 280318 SUMRALL, TOWN OF 280326 REVISED: Federal Emergency Management Agency FLOOD INSURANCE STUDY NUMBER 28073CV000C
Transcript
LAMAR COUNTY, MISSISSIPPI AND INCORPORATED AREAS
COMMUNITY NAME COMMUNITY NUMBERLAMAR COUNTY, (UNINCORPORATED AREAS) 280304
LUMBERTON, CITY OF 280337
PURVIS, CITY OF 280318
SUMRALL, TOWN OF 280326
REVISED:
Federal Emergency Management AgencyFLOOD INSURANCE STUDY NUMBER
28073CV000C
NOTICE TO
FLOOD INSURANCE STUDY USERS
Communities participating in the National Flood Insurance Program (NFIP) have established repositories of flood hazard data for floodplain management and flood insurance purposes. This Flood Insurance Study (FIS) may not contain all data available within the repository. It is advisable to contact the community repository for any additional data. Part or all of this FIS may be revised and republished at any time. In addition, part of this FIS may be revised by the Letter of Map Revision process, which does not involve republication or redistribution of the FIS report. It is, therefore, the responsibility of the user to consult with community officials and to check the community repository to obtain the most current FIS components. Initial Countywide FIS Effective Date: April 2, 1990 First Revised Countywide FIS Date: July 2, 1991 Revised Countywide FIS Date:
TABLE OF CONTENTS
Page
1.0 INTRODUCTION 1
1.1 Purpose of Study 1 1.2 Authority and Acknowledgments 1 1.3 Coordination 2
2.0 AREA STUDIED 2
2.1 Scope of Study 2 2.2 Community Description 3 2.3 Principal Flood Problems 4 2.4 Flood Protection Measures 4
Table 1 – Streams Studied by Detailed/Limited Detailed Methods 3 Table 2 – Summary of Discharges 5-6 Table 3 – Summary of Roughness Coefficients 8 Table 4 – Floodway Data Tables 13-15 Table 5 – Community Map History 18 EXHIBITS Exhibit 1 - Flood Profiles
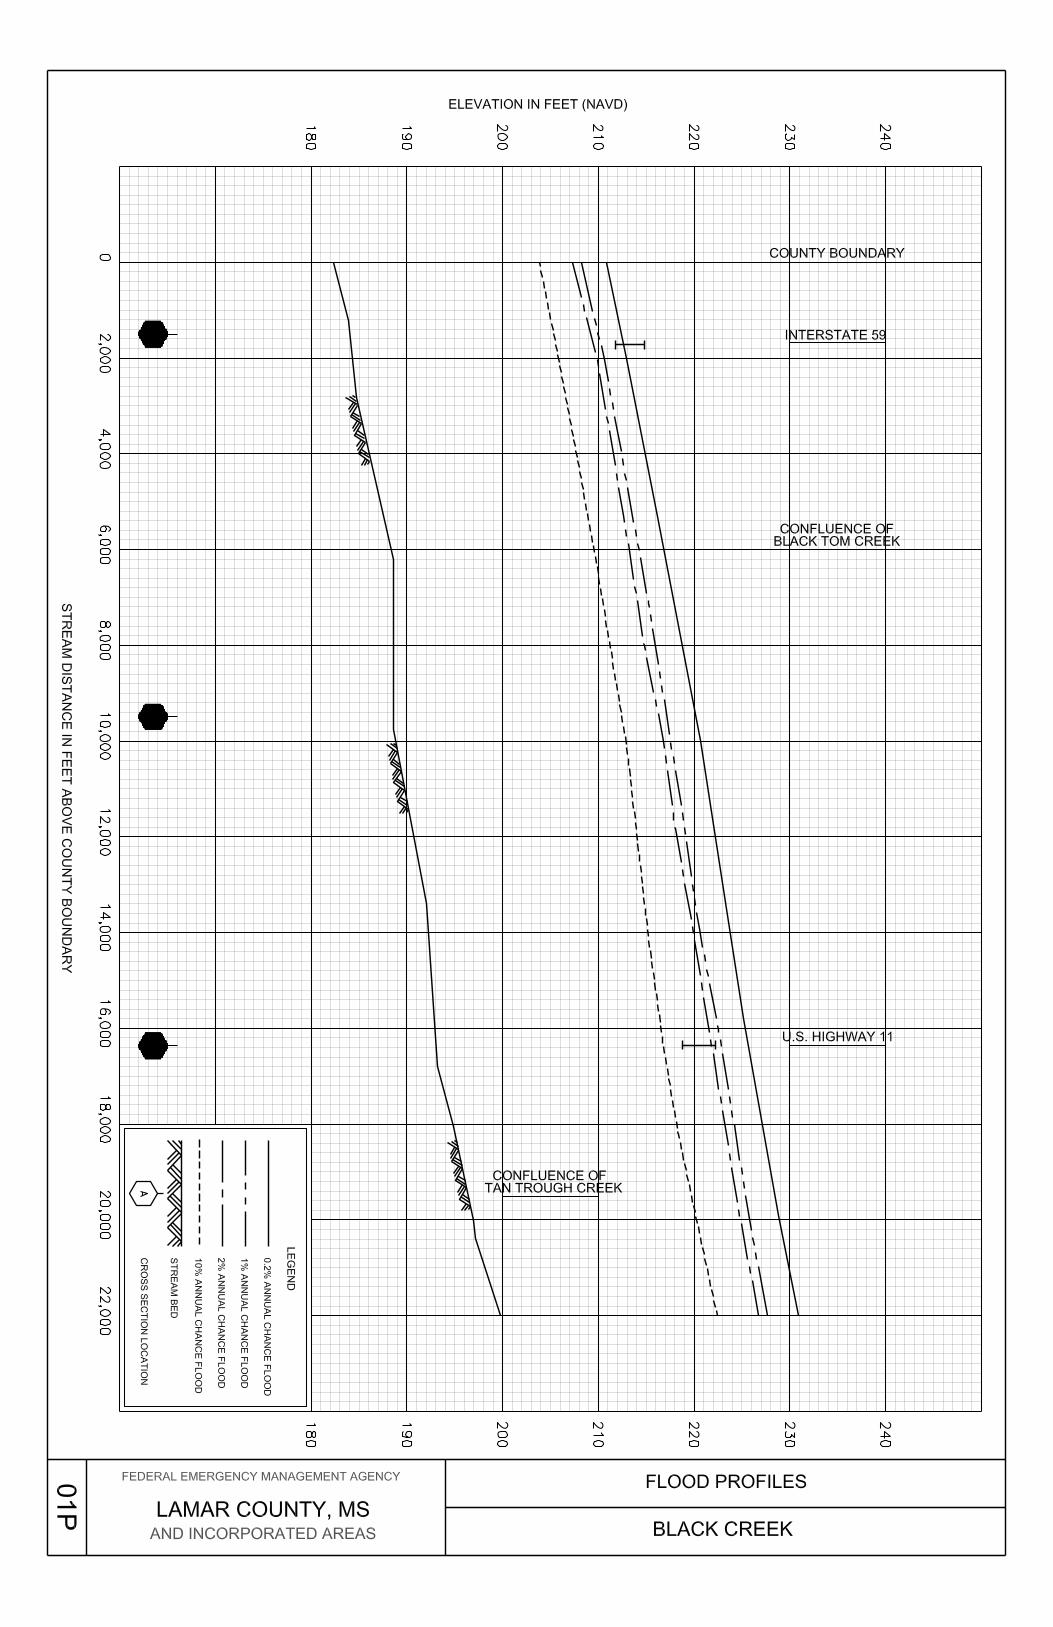
Black Creek Panels 01P-03P Gordons Creek Panel 04P Little Beaver Creek Panel 05P Little Black Creek Panels 06P-08P Mill Creek No. 1 Panels 09P-11P Mixons Creek Panels 12P-13P Mixons Creek Tributary 1 Panel 14P Mixons Creek Tributary 3 Panels 15P-16P Perkins Creek Panels 17P-18P
FLOOD INSURANCE STUDY LAMAR COUNTY, MISSISSIPPI AND INCORPORATED AREAS 1.0 INTRODUCTION
1.1 Purpose of Study
This Flood Insurance Study (FIS) revises and supersedes the FIS reports and/or Flood Insurance Rate Maps (FIRMs) in the geographic area of Lamar County, Mississippi, including the incorporated areas of the Town of Sumrall, the Cities of Purvis and Lumberton, and the Unincorporated Areas of Lamar County (hereinafter referred to collectively as Lamar County), and aids in the administration of the National Flood Insurance Act of 1968 and the Flood Disaster Protection Act of 1973. The City of Hattiesburg is included in its entirety in the Forrest County FIS and because it is not included in the Lamar County FIS, it is shown on the FIRM panels as Area Not Included. This study has developed flood risk data for various areas of the community that will be used to establish actuarial flood insurance rates. This information will also be used by Lamar County to update existing floodplain regulations as part of the Regular Phase of the National Flood Insurance Program (NFIP), and by local and regional planners to further promote sound land use and floodplain development. Minimum floodplain management requirements for participation in the NFIP are set forth in the Code of Federal Regulations at 44 CFR, 60.3. In some States or communities, floodplain management criteria or regulations may exist that are more restrictive or comprehensive than the minimum Federal requirements. In such cases, the more restrictive criteria take precedence and the State (or other jurisdictional agency) will be able to explain them.
1.2 Authority and Acknowledgments
The sources of authority for this Flood Insurance Study are the National Flood Insurance Act of 1968 and the Flood Disaster Protection Act of 1973. For the initial April 2, 1990 countywide FIS report, the hydrologic and hydraulic analyses were performed by Neel-Schaffer, Inc., Consulting Engineers (the Study Contractor) for the Federal Emergency Management Agency (FEMA), under Contract No. EMW-86-C-2246. This study was completed in September 1987. For the July 2, 1991 countywide FIS revision, the hydrologic and hydraulic analyses were obtained from the U.S. Army Corps of Engineers (USACE), Mobile District. FEMA reviewed and accepted these data for purposes of the revision. For this countywide FIS revision the hydrologic and hydraulic analyses were performed by the State of Mississippi for FEMA. This study was completed in August 2008, under contract No. EMA-2005CA-5215. Base map information shown on the FIRM was provided in digital format by the State of Mississippi. The digital orthoimagery was photogrammetrically compiled at a scale of 1:400 from aerial photography dated March 2006.
The digital FIRM was produced using the State Plane Coordinate System, Mississippi East, FIPS ZONE 2301. The horizontal datum was the North American Datum of 1983, GRS 80 spheroid. Distance units were measured in U.S. feet.
1.3 Coordination
For the initial April 2, 1990 countywide FIS report, an initial Consultation Coordination Officer’s (CCO) meeting was held at the county courthouse in Sumrall in February of 1986 to select community base maps and identify streams requiring detailed study. That meeting was attended by representatives of the Study Contractor, FEMA, and the community. Other coordination activities undertaken in connection with this study included meetings or conferences with the U.S. Army Corps of Engineers (USACE), the U.S. Geological Survey (USGS), and the Education and Research Center of Mississippi. A final CCO meeting was held with representatives from the community, FEMA, and the study contractor on April 5, 1989, a this meeting the results of the study were reviewed and accepted. For this countywide FIS revision, an initial Pre-Scoping Meeting was held on July 27, 2005. A Project Scoping Meeting was held on September 1, 2005 followed by a Post-Scoping Meeting on October 18, 2005. Attendees for these meetings included representatives from Mississippi Emergency Management Agency (MEMA), Mississippi Department of Environmental Quality (MDEQ), Mississippi Geographic Information, LLC (MGI), FEMA, Lamar County, and the incorporated communities within Lamar County.
2.0 AREA STUDIED
2.1 Scope of Study
This FIS covers the geographic area of Lamar County, Mississippi including the incorporated communities listed in Section 1.1. April 2, 1990 Countywide Analyses Flooding caused by overflow of Mixons Creek, Mixons Creek Tributary, Perkins Creek, Black Creek, Little Black Creek, and Gordons Creek was studied in detail. Approximate analyses were used to study those areas having low development potential or minimal flood hazards. Other areas having low development potential or minimal flood hazards were previously studied using approximate analyses. The results were shown on the FIRMs for the Town of Sumrall and the City of Purvis, and on the Flood Hazard Boundary Map for Lamar County (References 1, 2, and 3) and are incorporated into this FIS. The areas studied were selected with priority given to all known flood hazard areas and areas of projected development or proposed construction through September 1992. The scope and methods of study were proposed to and agreed upon by FEMA and Lamar County.
2
July 2, 1991 FIS Revision Analyses Detailed flooding information for the reach of Mill Creek No. 1 from about 1,000 feet upstream of its mouth to about 2,500 feet upstream of State Highway 42 has been incorporated into this FIS. The information was taken from a Section 205 Detailed Project Report prepared by the USACE (Reference 4). The area was previously studied by approximate methods. This Countywide Revision Analysis In this FIS, some streams have names other than those used in previously printed FISs. Details of these name changes are listed in the following tabulation:
Community Old Name New Name
Lamar County Mill Creek Mill Creek No. 1 Lamar County and Mixons Creek Tributary Mixons Creek Tributary 1
Town of Sumrall For this countywide FIS revision, Limited Detailed analyses were used to study those areas having a low development potential or minimal flood hazards. The scope and methods of study were proposed to, and agreed upon, by FEMA and the State of Mississippi. For this FIS revision, Table 1, “Streams Studied by Detailed/Limited Detailed Methods” lists the streams which were revised and newly studied by Detailed and Limited Detailed methods. TABLE 1. STREAMS STUDIED BY DETAILED/LIMITED DETAILED METHODS
Stream Limits of Revision/New Limited Detailed Study Gordons Creek From Interstate 59 to approximately 2,000 feet upstream of Interstate 59. Mill Creek No. 1 From approximately 925 feet upstream of the mouth to approximately 7,820 feet upstream of Highway 42. Mixons Creek From the county boundary to approximately 1,150 feet Upstream of the confluence with Mixons Creek Tributary 3 Mixons Creek Tributary 1 From the county boundary to the City of Hattiesburg/Lamar County boundary. Mixons Creek Tributary 3 From the mouth to the county boundary.
2.2 Community Description Lamar County is in southern Mississippi, approximately 80 miles southeast of Jackson, Mississippi, and 70 miles northeast of New Orleans, Louisiana. It is bordered by Jefferson Davis and Covington Counties on the north, Forrest County on the east, Pearl River County on the south, and Marion County on the west. Lamar County is served by Interstate 59, U.S. Highway 98, U.S. Highway 11, the Norfolk Southern Railway, and the
3
Illinois Central Railroad. The 2000 population of Lamar County was reported to be 39,070 (Reference 5).
2.3 Principal Flood Problems Development in the drainage basins of Mixons Creek, Mixons Creek Tributary 1, Black Creek, and Little Black Creek has increased recently, with many floodplain encroachments. Flood damage, though minimal in the past, in anticipated to increase, given the degree of development. Major flood-producing storms occur frequently in the winter and spring when the lack of vegetation and the high moisture content of the soil results in higher rates of storm runoff.
2.4 Flood Protection Measures
Flood protection measures are not known to exist within the study area.
3.0 ENGINEERING METHODS For the flooding sources studied by detailed methods in the community, standard hydrologic and hydraulic study methods were used to determine the flood hazard data required for this FIS. Flood events of a magnitude that are expected to be equaled or exceeded once on the average during any 10-, 50-, 100-, or 500-year period (recurrence interval) have been selected as having special significance for floodplain management and for flood insurance rates. These events, commonly termed the 10-, 50-, 100-, and 500-year floods, have a 10-, 2-, 1-, and 0.2-percent chance, respectively, of being equaled or exceeded during any year. Although the recurrence interval represents the long-term, average period between floods of a specific magnitude, rare floods could occur at short intervals or even within the same year. The risk of experiencing a rare flood increases when periods greater than 1 year are considered. For example, the risk of having a flood that equals or exceeds the 1-percent-annual-chance flood in any 50-year period is approximately 40 percent (4 in 10); for any 90-year period, the risk increases to approximately 60 percent (6 in 10). The analyses reported herein reflect flooding potentials based on conditions existing in the community at the time of completion of this study. Maps and flood elevations will be amended periodically to reflect future changes. 3.1 Hydrologic Analyses
Hydrologic analyses were carried out to establish peak discharge-frequency and peak elevation-frequency relationships for each flooding source studied by detailed methods affecting the community. April 2, 1990 Countywide Riverine Analyses
For the initial countywide FIS report, peak discharge-frequency data for Mixons Creek and Mixons Creek Tributary 1 were obtained from HEC-1 computer models developed by the USACE, Mobile District, for those streams (Reference 6). Peak discharge-frequency data for Perkins Creek, Black Creek, and Little Black Creek were computed using regional relationships relating basin characteristics to streamflow characteristics developed by the USGS (Reference 7). Peak discharge-frequency data for the Gordons Creek watershed were developed by the USACE (Reference 8).
4
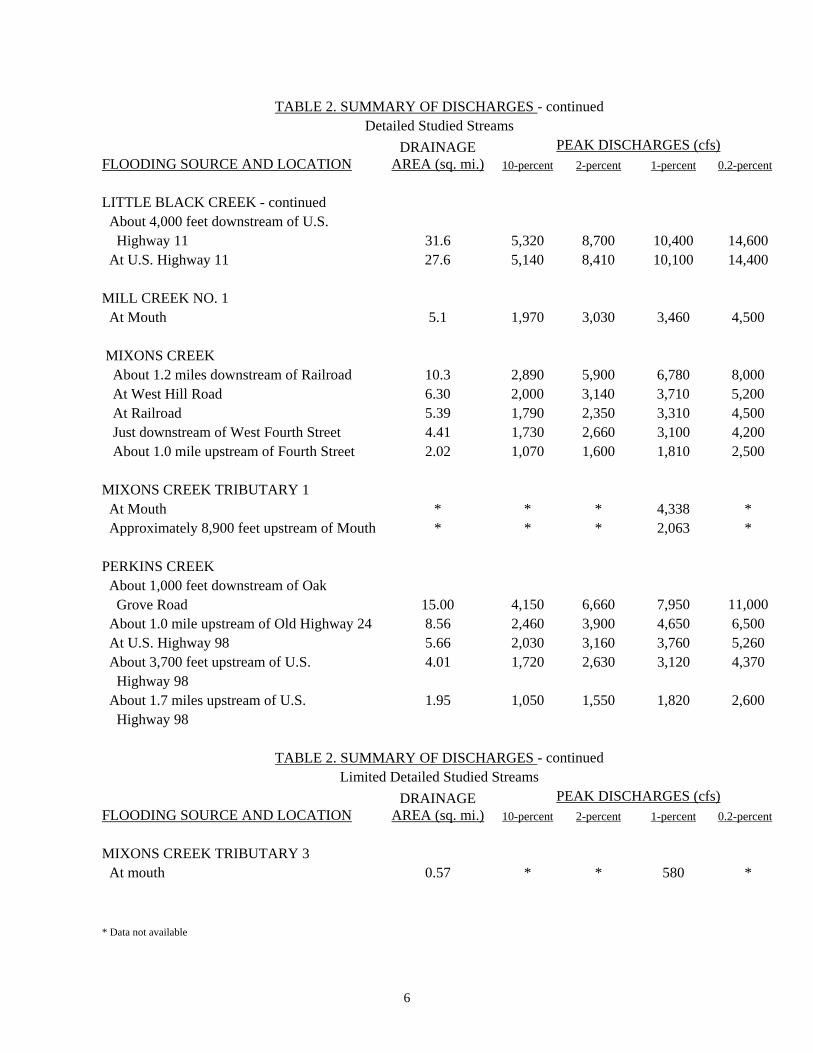
July 2, 1991 Revision Analyses The peak discharges for the 10-, 2-, and 1-percent-annual-chance frequency floods for Mill Creek No. 1 were determined using Flood Frequency of Mississippi Streams (Reference 7). Flows were then adjusted to account for those effects of urbanization using An Approach to Estimating Flood Frequency for Urban Areas in Oklahoma by V.B. Sauer (Reference 9). The adjusted flows were plotted on log-probability paper and extrapolated to obtain the peak discharge for the 0.2-percent-annual chance frequency flood. The peak discharge-drainage area relationships for the 10-, 2-, 1-, and 0.2-percent-annual-chance frequency floods for Mill Creek No. 1 are shown in Table 3, “Summary of Discharges”. This Countywide Revision Analyses Peak discharges for the streams studied by Limited Detailed methods were calculated based on USGS regional regression equations (Reference 10). For the discharges calculated based on regional regression equations, the rural regression values were updated to reflect urbanization as necessary. A summary of the drainage area-peak discharge relationships for all the streams is shown in Table 2, “Summary of Discharges.
TABLE 2. SUMMARY OF DISCHARGES
Detailed Studied Streams DRAINAGE
AREA (sq. mi.) PEAK DISCHARGES (cfs)
FLOODING SOURCE AND LOCATION 10-percent 2-percent 1-percent 0.2-percent BLACK CREEK At Interstate 59 186.7 13,700 22,300 25,300 36,500 At U.S. Highway 11 170.9 13,200 21,400 24,570 36,000 At Railroad 146.5 11,720 19,040 21,850 31,000 About 3.3 miles upstream of Railroad 75.90 7,850 12,800 14,920 20,000 At U.S. Highway 98 61.6 7,470 12,200 14,200 19,600 GORDONS CREEK Approximately 1,700 feet upstream of Interstate 59 * * * 998 * LITTLE BLACK CREEK About 2.1 miles downstream of Interstate 59 71.5 10,200 16,900 19,900 28,500 About 1,500 feet downstream of Interstate 59 61.6 9,790 16,200 19,200 28,000 About 2,900 feet upstream of Interstate 59 * 8,880 14,700 17,400 24,600 * Data not available
5
TABLE 2. SUMMARY OF DISCHARGES - continued Detailed Studied Streams
DRAINAGE AREA (sq. mi.)
PEAK DISCHARGES (cfs) FLOODING SOURCE AND LOCATION 10-percent 2-percent 1-percent 0.2-percent LITTLE BLACK CREEK - continued About 4,000 feet downstream of U.S. Highway 11 31.6 5,320 8,700 10,400 14,600 At U.S. Highway 11 27.6 5,140 8,410 10,100 14,400 MILL CREEK NO. 1 At Mouth 5.1 1,970 3,030 3,460 4,500 MIXONS CREEK About 1.2 miles downstream of Railroad 10.3 2,890 5,900 6,780 8,000 At West Hill Road 6.30 2,000 3,140 3,710 5,200 At Railroad 5.39 1,790 2,350 3,310 4,500 Just downstream of West Fourth Street 4.41 1,730 2,660 3,100 4,200 About 1.0 mile upstream of Fourth Street 2.02 1,070 1,600 1,810 2,500 MIXONS CREEK TRIBUTARY 1 At Mouth * * * 4,338 * Approximately 8,900 feet upstream of Mouth * * * 2,063 * PERKINS CREEK About 1,000 feet downstream of Oak Grove Road 15.00 4,150 6,660 7,950 11,000 About 1.0 mile upstream of Old Highway 24 8.56 2,460 3,900 4,650 6,500 At U.S. Highway 98 5.66 2,030 3,160 3,760 5,260 About 3,700 feet upstream of U.S. 4.01 1,720 2,630 3,120 4,370 Highway 98 About 1.7 miles upstream of U.S. 1.95 1,050 1,550 1,820 2,600 Highway 98
TABLE 2. SUMMARY OF DISCHARGES - continued Limited Detailed Studied Streams
DRAINAGE AREA (sq. mi.)
PEAK DISCHARGES (cfs) FLOODING SOURCE AND LOCATION 10-percent 2-percent 1-percent 0.2-percent MIXONS CREEK TRIBUTARY 3 At mouth 0.57 * * 580 * * Data not available
6
3.2 Hydraulic Analyses Analyses of the hydraulic characteristics of flooding from the sources studied were carried out to provide estimates of the elevations of floods of the selected recurrence intervals. Users should be aware that flood elevations shown on the FIRM represent rounded whole-foot elevations and may not exactly reflect the elevations shown on the Flood Profiles or in the Floodway Data Tables in the FIS report. Flood elevations shown on the FIRM are primarily intended for flood insurance rating purposes. For construction and/or floodplain management purposes, users are encouraged to use the flood elevation data presented in this FIS report in conjunction with the data shown on the FIRM.
April 2, 1990 Countywide Analyses Cross-section data were obtained by field survey. All roads and bridges were surveyed to obtain elevation data and structural geometry. Roughness coefficients (Manning’s “n”) for the computations were estimated on the basis of field inspection. These roughness coefficients ranged from 0.02 to 0.06 for the channel and from 0.10 to 0.24 for the overbank areas for Mixons Creek, Mixons Creek Tributary 1, Perkins Creek, Black Creek, and Little Black Creek. For Gordons Creek, roughness coefficients ranged from 0.025 to 0.07 for the main channel and from 0.10 to 0.20 for the overbank areas. Water-surface elevations were developed using the HEC-2 step-backwater computer model (Reference 11). Starting water-surface elevations were obtained by slope-conveyance methods. Flood profiles were drawn showing the computed water-surface elevations for floods of the selected recurrence intervals. In cases where the 2- and 1-percent-annual-chance flood elevations are close together, due to limitations of the profile scale, only the 1-percent-annual-chance profile has been shown. The hydraulic analyses for this study are based on the effects of unobstructed flow. The flood elevations shown on the profiles are thus considered valid only if hydraulic structures remain unobstructed, operate properly, and do not fail. July 2, 1991 Revision Analyses Analyses of the hydraulic characteristics of flooding from Mill Creek No. 1 were carried out to provide an estimate of the elevations for the 10-, 2-, 1-, and 0.2-percent-annual-chance frequency floods. Cross-section geometry data were developed from field surveys and from U.S. Geological Survey USGS quadrangle maps (Reference 12). Roughness coefficients (Manning’s “n”) ranged from 0.045 to 0.055 for the channel of Mill Creek No. 1 and from 0.8 to 0.15 for the overbank areas. The hydraulic analyses for Mill Creek No. 1 were performed using the USACE HEC-2 step-backwater computer program (Reference 11). The starting water-surface elevations for the 10-, 2-, 1-, and 0.2-percent-annual-chance frequency floods were determined using the slope-area method.
7
The 1- and 0.2-percent-annual-chance flood boundaries and the 1-percent-annual-chance floodway boundary were delineated using USGS quadrangle maps enlarged to a scale of 1:12,000 with a contour interval of 10 feet (Reference 12).
This Countywide Revision Analyses Detailed models were developed through a combination of effective HEC-2 model data and WISE by extracting cross section topographic data directly from the WISE terrain project and supplemented with field surveys. Structure data is based on Mississippi Department of Transportation (MDOT) as-built data where available and additional field surveys where it was not. Regional regression equations were used as a basis for the discharges in the HEC-RAS (Reference 13) models. Limited Detailed cross section geometries were obtained from a combination of terrain data and field surveys. Bridges and culverts located within the Limited Detailed study limits were field surveyed to obtain elevation data and structural geometry. Downstream boundary conditions for the hydraulics models were set to normal depth using a starting slope calculated from values taken from topographic data, or where applicable, derived from the water-surface elevations of existing effective flood elevations or recalculated flood elevations. Water-surface profiles were computed through the use of USACE HEC-RAS version 3.1.2 computer program (Reference 13). The model was run for the 1-percent-annual-chance storm for the Limited Detailed and approximate studies and for the 10-, 2-, 1-, and 0.2-percent-annual-chance-flood and floodway for Detailed studies. Mannings “n” values used in the hydraulic computations for both channel and overbank areas were based on recent digital orthophotography and field investigations. Table 3, “Summary of Roughness Coefficients,” shows the ranges of the channel and overbank roughness factors used in the computations for the streams redelineated, revised or newly studied by Detailed and Limited Detailed methods.
TABLE 3 - SUMMARY OF ROUGHNESS COEFFICIENTS Stream Channel “n” Overbank “n” Black Creek 0.02-0.06 0.10-0.24 Gordons Creek 0.012-0.042 0.02-0.15 Little Beaver Creek 0.050 0.060-0.140 Little Black Creek 0.02-0.06 0.10-0.24 Mill Creek No. 1 0.04 0.06-0.14 Mixons Creek 0.02-0.06 0.10-0.24 Mixons Creek Tributary 1 0.045-0.05 0.015-0.15 Mixons Creek Tributary 3 0.035-0.05 0.06-0.15 Perkins Creek 0.02-0.06 0.10-0.24
Locations of the selected cross sections used in the hydraulic analyses are shown on the Flood Profiles (Exhibit 1). For stream segments for which a floodway was computed (Section 4.2), selected cross section locations are also shown on the FIRM (Exhibit 2).
8
The hydraulic analyses for this study were based on unobstructed flow. The flood elevations shown on the Flood Profiles (Exhibit 1) are thus considered valid only if hydraulic structures remain unobstructed, operate properly, and do not fail. All elevations are referenced to NAVD88.
3.3 Vertical Datum
All FIS reports and FIRMS are referenced to a specific vertical datum. The vertical datum provides a starting point against which flood, ground, and structure elevations can be referenced and compared. Until recently, the standard vertical datum in use for newly created or revised FIS reports and FIRMs was the National Geodetic Vertical Datum of 1929 (NGVD29). With the finalization of the North American Vertical Datum of 1988 (NAVD88), many FIS reports and FIRMs are being prepared using NAVD88 as the referenced vertical datum. Qualifying bench marks within a given jurisdiction that are cataloged by the National Geodetic Survey (NGS) and entered into the National Spatial Reference System (NSRS) as First or Second Order Vertical and have a vertical stability classification of A, B, or C are shown and labeled on the FIRM with their 6-character NSRS permanent identifier. Bench marks cataloged by the NGS and entered into the NSRS vary widely in vertical stability classification. NSRS vertical stability classifications are as follows:
Stability A: Monuments of the most reliable nature, expected to hold position/elevation well (e.g., mounted in bedrock) Stability B: Monuments which generally hold their position/elevation well (e.g., concrete bridge abutment) Stability C: Monuments which may be affected by surface ground movements (e.g., concrete monuments below frost line) Stability D: Mark of questionable or unknown vertical stability (e.g., concrete monument above frost line, or steel witness post)
All flood elevations shown in this FIS report and on the FIRM are referenced to NAVD88. Structure and ground elevations in the community must, therefore, be referenced to NAVD88. It is important to note that adjacent communities may be referenced to NGVD29. This may result in differences in Base Flood Elevations (BFEs) across the corporate limits between the communities. The elevations shown in the FIS report and on the FIRM for Lamar County are referenced to NAVD88. Ground, structure, and flood elevations may be compared and/or referenced to NGVD29, add -0.07 feet to the NGVD29 elevation. The -0.07 feet value is an average for the entire county. The BFEs shown on the FIRM represent whole-foot rounded values. For example, a BFE of 12.4 feet will appear as 12 feet on the FIRM and 12.6 feet as 13 feet. Users who wish to convert the elevations in this FIS report to NGVD29 should apply the stated conversion factor to elevations shown on the Flood Profiles and supporting data tables in the FIS report, which are shown at a minimum to the nearest 0.1 foot.
9
To obtain current elevation, description, and/or location information for bench marks shown on the FIRM for this jurisdiction, or for information regarding conversion between the NGVD29 and NAVD88, see the FEMA publication entitled Converting the National Flood Insurance Program to the North American Vertical Datum of 1998 (FEMA, June 1992), or contact the Vertical Network Branch, National Geodetic Survey, Coast and Geodetic Survey, National Oceanic and Atmospheric Administration, Rockville, Maryland 20910 (Internet address http://www.ngs.noaa.gov). Temporary vertical monuments are often established during the preparation of a flood hazard analysis for the purpose of establishing local vertical control. Although these monuments are not shown on the FIRM, they may be found in the Technical Support Data Notebook associated with the FIS report and FIRM for this community. Interested individuals may contact FEMA to access these data.
4.0 FLOODPLAIN MANAGEMENT APPLICATIONS The NFIP encourages State and local governments to adopt sound floodplain management programs. To assist in this endeavor, each FIS provides 1-percent-annual-chance floodplain data, which may include a combination of the following: 10-, 2-, 1-, and 0.2-percent-annual chance flood elevations; delineations of the 1-percent and 0.2-percent-annual-chance floodplains; and 1-percent-annual-chance floodway. This information is presented on the FIRM and in many components of the FIS report, including Flood Profiles, Floodway Data Table, and Summary of Stillwater Elevations Table. Users should reference the data presented in the FIS report as well as additional information that may be available at the local community map repository before making flood elevation and/or floodplain boundary determinations.
4.1 Floodplain Boundaries To provide a national standard without regional discrimination, the 1-percent-annual-chance flood has been adopted by FEMA as the base flood for floodplain management purposes. The 0.2-percent-annual-chance flood is employed to indicate additional areas of flood risk in the County. For each stream studied by detailed methods, the 1- and 0.2-percent-annual-chance floodplain boundaries have been delineated using the flood elevations determined at each cross section. The 1- and 0.2-percent-annual-chance floodplain boundaries are shown on the FIRM (Exhibit 2). On this map, the 1-percent-annual-chance floodplain boundary corresponds to the boundary of the areas of special flood hazards (Zones A and AE), and the 0.2-percent-annual-chance floodplain boundary corresponds to the boundary of areas of moderate flood hazards. In cases where the 1- and 0.2-percent-annual-chance floodplain boundaries are close together, only the 1-percent-annual-chance floodplain boundary has been shown. Small areas within the floodplain boundaries may lie above the flood elevations but cannot be shown due to limitations of the map scale and/or lack of detailed topographic data. For the streams studied by Limited Detailed and approximate methods, only the 1-percent-annual-chance floodplain boundary is shown on the FIRM (Exhibit 2).
10
4.2 Floodways Encroachment on floodplains, such as structures and fill, reduces flood-carrying capacity,
increases flood heights and velocities, and increases flood hazards in areas beyond the encroachment itself. One aspect of floodplain management involves balancing the economic gain from floodplain development against the resulting increase in flood hazard. For purposes of the NFIP, a floodway is used as a tool to assist local communities in this aspect of floodplain management. Under this concept, the area of the 1-percent-annual-chance floodplain is divided into a floodway and a floodway fringe. The floodway is the channel of a stream, plus any adjacent floodplain areas, that must be kept free of encroachment so that the 1-percent-annual-chance flood can be carried without substantial increases in flood heights. Minimum Federal standards limit such increases to 1.0 foot, provided that hazardous velocities are not produced. The floodways in this FIS are presented to local agencies as minimum standards that can be adopted directly or that can be used as a basis for additional floodway studies.
The floodway presented in this FIS report and on the FIRM was computed for certain stream segments on the basis of equal-conveyance reduction from each side of the floodplain. Floodway widths were computed at cross sections. Between cross sections, the floodway boundaries were interpolated. The results of the floodway computations have been tabulated for selected cross sections of detailed study streams in Table 4. The computed floodways are shown on the FIRM (Exhibit 2). In cases where the floodway and 1-percent-annual-chance floodplain boundaries are either close together or collinear, only the floodway boundary is shown. Encroachment into areas subject to inundation by floodwaters having hazardous velocities aggravates the risk of flood damage, and heightens potential flood hazards by further increasing velocities. A listing of stream velocities at selected cross sections is provided in Table 4. In order to reduce the risk of property damage in areas where the stream velocities are high, the county may wish to restrict development in areas outside the floodway. The area between the floodway and 1-percent-annual-chance floodplain boundaries is termed the floodway fringe. The floodway fringe encompasses the portion of the floodplain that could be completely obstructed without increasing the water-surface elevation of the 1-percent-annual-chance flood more than 1.0 foot at any point. Typical relationships between the floodway and the floodway fringe and their significance to floodplain development are shown in Figure 1.
A 13,0641, 4 280 3,412 1.9 176.3 176.3 176.7 0.4 B 15,4401, 5 221 1,211 5.6 178.1 178.1 178.3 0.2 C 17,1001, 5 176 1,332 2.8 183.6 183.6 184.2 0.6 D 19,0001, 5 250 1,450 2.3 185.9 185.9 186.7 0.8
MIXONS CREEK TRIBUTARY 1
A 2,1042 131 940 2.7 176.0 175.36 176.2 0.9
PERKINS CREEK
A 1003 200 2,087 3.8 279.9 279.9 280.7 0.8 B 5,3503 691 3,550 1.3 287.0 287.0 288.0 1.0 C 10,1003 150 1,506 2.5 302.0 302.0 303.0 1.0
4 NEW DETAILED STUDY, MEASURED IN FEET ALONG STREAM LINE.5 REDELINEATED STUDY, MEASURED IN FEET ALONG PROFILE BASE LINE. 6 ELEVATION COMPUTED WITHOUT CONSIDERATION OF BACKWATER EFFECTS FROM MIXONS CREEK.
1 FEET ABOVE MOUTH 2 FEET ABOVE CONFLUENCE WITH MIXONS CREEK. 3 FEET ABOVE OLD HIGHWAY 24.
TAB
LE 6
FLOODWAY DATA FEDERAL EMERGENCY MANAGEMENT AGENCY
LAMAR COUNTY, MS AND INCORPORATED AREAS MIXONS CREEK – MIXONS CREEK TRIBUTARY 1 – PERKINS CREEK
5.0 INSURANCE APPLICATIONS
For flood insurance rating purposes, flood insurance zone designations are assigned to a community based on the results of the engineering analyses. These zones are as follows:
Zone A Zone A is the flood insurance rate zone that corresponds to the 1-percent-annual-chance floodplains that are determined in the FIS by approximate methods. Because detailed hydraulic analyses are not performed for such areas, no BFEs, or flood depths are shown within this zone. Zone AE Zone AE is the flood insurance rate zone that corresponds to the 1-percent-annual-chance floodplains that are determined in the FIS by detailed methods. In most instances, whole-foot BFEs derived from the detailed hydraulic analyses are shown at selected intervals within this zone. Zone AH Zone AH is the flood insurance rate zone that corresponds to the areas of 1-percent-annual-chance shallow flooding (usually areas of ponding) where average depths are between 1 and 3 feet. Whole-foot BFEs derived from the detailed hydraulic analyses are shown at selected intervals within this zone. Zone AO Zone AO is the flood insurance risk zone that corresponds to the areas of the 1-percent-annual-chance shallow flooding (usually areas of ponding) where average depths are between 1 and 3 feet. Average whole-foot base flood depths derived from the detailed hydraulic analyses are shown within this zone. Zone V Zone V is the flood insurance risk zone that corresponds to the 1-percent-annual-chance coastal floodplains that have additional hazards associated with storm waves. Because approximate hydraulic analyses are performed for such areas, no BFEs are shown within this zone. Zone VE Zone VE is the flood insurance risk zone that corresponds to the 1-percent-annual-chance coastal floodplains that have additional hazards associated with storm waves. Whole-foot BFEs derived from the detailed hydraulic analyses are shown at selected intervals within this zone.
Zone X Zone X is the flood insurance rate zone that corresponds to areas outside the 0.2-percent-annual-chance floodplain, areas within the 0.2-percent-annual-chance floodplain, areas of 1-percent-annual-chance flooding where average depths are less than 1 foot, areas of 1-percent-annual-chance flooding where the contributing drainage area is less than 1 square mile,
16
and areas protected from the base flood by levees. No BFEs or depths are shown within this zone. Zone D Zone D is the flood insurance rate zone that corresponds to unstudied areas where flood hazards are undetermined, but possible.
6.0 FLOOD INSURANCE RATE MAP
The FIRM is designed for flood insurance and floodplain management applications. For flood insurance applications, the map designates flood insurance rate zones as described in Section 5.0 and, in the 1-percent-annual-chance floodplains that were studied by detailed methods, shows selected whole foot BFEs or average depths. Insurance agents use the zones and BFEs in conjunction with information on structures and their contents to assign premium rates for flood insurance policies. For floodplain management applications, the map shows by tints, screens, and symbols, the 1- and 0.2-percent-annual-chance floodplains, floodways, and the locations of selected cross sections used in the hydraulic analyses and floodway computations. The countywide FIRM presents flooding information for the geographic area of Lamar County. Historical data relating to the maps prepared for each community are presented in Table 5, “Community Map History”.
17
COMMUNITY NAME
INITIAL IDENTIFICATION
FLOOD HAZARD BOUNDARY MAP REVISIONS DATE
FIRM EFFECTIVE DATE
FIRM REVISIONS DATE
Lamar County December 2, 1977 NONE April 2, 1990 July 2, 1991
Unincorporated Areas
Lumberton, City of March 24, 1989 NONE April 2, 1990 July 2, 1991
Purvis, City of November 3, 1978 NONE March 1, 1987 April 2, 1990 July 2, 1991
Sumrall, Town of November 3, 1978 August 31, 1979 August 19, 1985 April 2, 1990 July 2, 1991
TAB
LE 5
FEDERAL EMERGENCY MANAGEMENT AGENCY
LAMAR COUNTY, MS AND INCORPORATED AREAS
COMMUNITY MAP HISTORY
7.0 OTHER STUDIES This FIS supersedes the previously printed Flood Hazard Boundary Map for Lamar County (Reference 3), the FIRMs for the Town of Sumrall and the City of Purvis (References 1 and 2), and the portion of the previously published FIS for the City of Hattiesburg (Reference 14) lying within Lamar County.
8.0 LOCATION OF DATA
Information concerning the pertinent data used in the preparation of this study can be obtained by contacting Federal Insurance and Mitigation Division, FEMA Region IV, Koger-Center — Rutgers Building, 3003 Chamblee Tucker Road, Atlanta, GA 30341.
19
20
9.0 BIBLIOGRAPHY AND REFERENCES
1. Federal Emergency Management Agency, Flood Insurance Rate Map, Town of Sumrall, Lamar County, Mississippi, August 1985.
2. Federal Emergency Management Agency, Flood Insurance Rate Map, City of Purvis,
Lamar County, Mississippi, March 1987. 3. U.S. Department of Housing and Urban Development, Federal Insurance Administration,
Flood Hazard Boundary Map, Lamar County, Unincorporated Areas, Mississippi, December 1977.
4. U.S. Army Corps of Engineers, Mobile District, Section 205 Detailed Project Report on Mill Creek, Sumrall, Mississippi, November 1988. 5. U.S. Department of Commerce, Bureau of the Census, 2000 Census of Population, and
Housing, Washington, D.C. 6. U.S. Army Corps of Engineers, Mobile District, HEC-1 Computer Models for Mixons
Creek and Mixons Creek Tributary in Lamar County, Mississippi, unpublished. 7. U.S. Department of the Interior, Geological Survey, Flood Frequency of Mississippi
Streams, B.E. Colson and J.W. Hudson, 1976. 8. U.S. Army Corps of Engineers, Detailed Project Report on Gordons Creek, Hattiesburg,
Mississippi, December 1980. 9. U.S. Department of the Interior, Water Resources Investigations 23-74, An Approach to
Estimating Flood Frequency for Urban Areas in Oklahoma, V.B. Sauer, July 1974. 10. U.S. Department of the Interior, Geological Survey, Flood Characteristics of Mississippi
Streams, Water-Resources Investigations Report 91-4037, Jackson, Mississippi, 1991. 11. U.S. Army Corps of Engineers, Hydrologic Engineering Center, HEC-2 Water-Surface
Profiles, Generalized Computer Program, Davis, California, April 1984. 12. U.S. Department of the Interior, Geologic Survey, 7.5 Minute Series Topographic Maps,
13. U.S. Army Corps of Engineers, Hydrologic Engineering Center, HEC-RAS River Analysis System, User’s Manual, version 3.1, Davis, California, November 2002.
14. Federal Emergency Management Agency, Flood Insurance Study, City of Hattiesburg,