Chapter 3 General Profile, Land Use Classification and Land Use Pattern 17 Chapter 3 India - General Profile, Land Use Classification and Land Use Pattern _________________________________________________________ 3.1 General Topography 18 3.2 Climate 19 3.3. Natural Resources 19 3.3.1 Soils-Land 19 3.3.2 Water Resources 20 3.3.2.1 Railfall 20 3.3.2.2 Water Resources 20 - Surface Water - Ground Water 3.3.3 Forests 21 3.3.4 Biodiversity 21 3.4 Agriculture 23 3.5 Population Demography 23 3.5.1 Human 23 3.5.2 Livestock 24 3.6 Socio-Economic Profile 26 3.7 Land Use Classification 28 3.7.1. Agro-Climatic Regions 28 3.7.2. Agro-Ecological Regions 28 3.7.3. Bio-Climatic Regions 29 3.7.4 Agro-Meteorological Regions 31 3.8 Land Use Pattern 31 3.8.1 Classification of Land Use 32 3.8.2 Area under Agricultural Use 32 3.8.3 Land under Non-Agricultural Use 33 3.8.4 Area under Forests 33 3.8.5 Area under Grazing 34 3.8.6 Area classified under Common Property Resources (CPRs) 34
Transcript
Chapter 3 General Profile, Land Use Classification and Land Use Pattern
17
Chapter 3
India - General Profile, Land Use Classification and Land Use Pattern_________________________________________________________
3.1 General Topography 18
3.2 Climate 19
3.3. Natural Resources 193.3.1 Soils-Land 19
3.3.2 Water Resources 20
3.3.2.1 Railfall 20
3.3.2.2 Water Resources 20
- Surface Water
- Ground Water
3.3.3 Forests 21
3.3.4 Biodiversity 21
3.4 Agriculture 23
3.5 Population Demography 233.5.1 Human 23
3.5.2 Livestock 24
3.6 Socio-Economic Profile 26
3.7 Land Use Classification 283.7.1. Agro-Climatic Regions 28
3.7.2. Agro-Ecological Regions 28
3.7.3. Bio-Climatic Regions 29
3.7.4 Agro-Meteorological Regions 31
3.8 Land Use Pattern 313.8.1 Classification of Land Use 32
3.8.2 Area under Agricultural Use 32
3.8.3 Land under Non-Agricultural Use 33
3.8.4 Area under Forests 33
3.8.5 Area under Grazing 34
3.8.6 Area classified under Common Property Resources (CPRs) 34
Chapter 3 General Profile, Land Use Classification and Land Use Pattern
18
Chapter 3
India - General Profile, Land Use Classification and Land Use Pattern_______________________________________________________________________________________
Highlights of Chapter 3
India occupying only 2.4 % of the world’s geographical area, supports about 16.2% of the world’s human population. India
also has only 0.5% of the world’s grazing area but supports 18% of the world’s cattle population. India is endowed with a
variety of soils, climate, biodiversity and ecological regions. About 228 mha (69%) of its geographical area (about 328 mha)
fall within the dryland (arid, semi-arid and dry sub-humid) as per Thornthwaite classification . The Thar Desert lies in the
hot arid region of Western Rajasthan and is one of the most densely populated deserts of the world. The country has been
classified on the basis of agro-climatic, agro-ecological and agro-meteorological zones for the purpose of planning and
implementing various programmes and measures. Agriculture is the major sector of growth of the Indian economy. A large
percent of the population is still dependent on agriculture for its sustenance. Of the total cultivated area of 142 mha, major
part of agriculture in the country is rainfed, extending to over 97 mha and constituting nearly 68% of the net cultivated area.
The Chapter also addresses the various land use patterns and land use changes over 40 years.
3.1 General Topography
India’s mainland comprises four broad geographical areas: the Northern Mountains which has the great
Himalayas, the vast Indo-Gangetic plains, the Southern (Deccan) Penninsula bounded by the Western and
Eastern Ghats, and fourthly, the coastal plains and islands (Census of India, 1991).
(i) Northern Mountains: Corresponding with the Himalayan Zone, alongwith country’s northern boundaries
including the Jammu and Kashmir (J&K), Himachal Pradesh (H.P.), north-west Uttar Pradesh (U.P.), Sikkim,
part of Assam, and the North-Eastern States of Arunachal Pradesh, Nagaland, Manipur, Mizoram, Tripura
and Meghalaya. The Himalayas comprise of mountain ranges which form an indomitable physical barrier as
the world’s biggest and largest mountain range. The Himalayas also contain the cold arid deserts and fertile
valleys.
(ii) The Great Plains: Also known as the Indo-Gangetic plain is formed by the basin of three distinct river
systems - the Indus, the Ganga and the Brahmaputra. The Plains extend from Rajasthan in the West to
Brahmaputra valley in the East. This region covers the entire States of Punjab, Haryana, and the Union
Territory of Chandigarh and Delhi and major parts of U.P., Bihar, West Bengal, and parts of Assam. These
plains comprise one of the world’s greatest stretches of flat and deep alluvium and are among the most
densely populated areas of the world (456 persons per sq.km). The desert region, which contains the Great
Thar desert, extends from the edge of Rann of Kutchh to larger parts of Rajasthan (Western) and lower
regions of Punjab and Haryana.
(iii) The Deccan Penninsula: This zone covers the whole of South India which includes the States of Tamil
Nadu, Karnataka, Andhra Pradesh and Kerala. The Region also covers the State of Madhya Pradesh, and
parts of Bihar, Orissa, Puriliya district of West Bengal. Density of population is 202 persons per km2. The
Chapter 3 General Profile, Land Use Classification and Land Use Pattern
19
Indo-Gangetic plains and the penninsular plateau are separated by mountain and hill ranges known as the
Aravali, Vindhya, Satpura, Ajanta and Maikala ranges.
(iv)The Coastal Plains and Islands: The penninsula is flanked on either side by the Eastern Ghats and the
Western Ghats. On either side of the Ghats outward to the sea lies a coastal strip. The western coastal
plains lie between the Western Ghats and the Arabian sea in the West, whereas the Eastern Coastal Plains
face the Bay of Bengal in the East. This is also a region with very high-density population (349 persons per
km2).
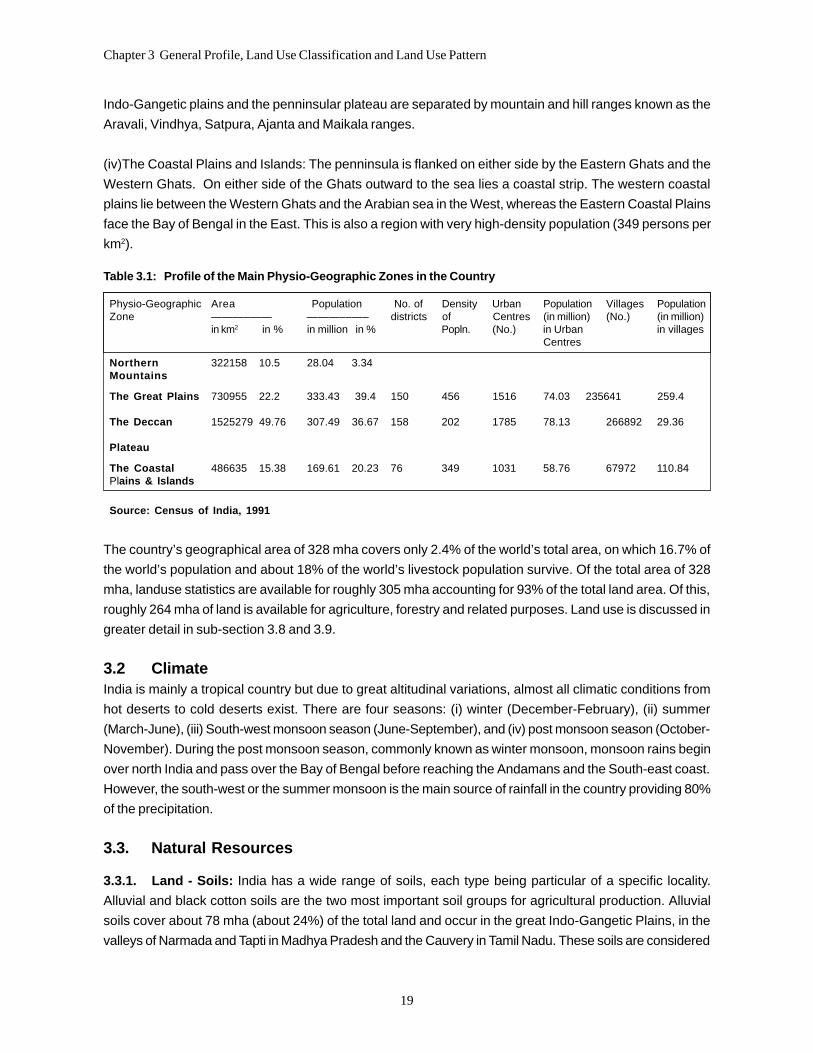
Table 3.1: Profile of the Main Physio-Geographic Zones in the Country
Physio-Geographic Area Population No. of Density Urban Population Villages PopulationZone ———–—— ———––—– districts of Centres (in million) (No.) (in million)
in km2 in % in million in % Popln. (No.) in Urban in villagesCentres
Northern 322158 10.5 28.04 3.34Mountains
The Great Plains 730955 22.2 333.43 39.4 150 456 1516 74.03 235641 259.4
The country’s geographical area of 328 mha covers only 2.4% of the world’s total area, on which 16.7% of
the world’s population and about 18% of the world’s livestock population survive. Of the total area of 328
mha, landuse statistics are available for roughly 305 mha accounting for 93% of the total land area. Of this,
roughly 264 mha of land is available for agriculture, forestry and related purposes. Land use is discussed in
greater detail in sub-section 3.8 and 3.9.
3.2 ClimateIndia is mainly a tropical country but due to great altitudinal variations, almost all climatic conditions from
hot deserts to cold deserts exist. There are four seasons: (i) winter (December-February), (ii) summer
(March-June), (iii) South-west monsoon season (June-September), and (iv) post monsoon season (October-
November). During the post monsoon season, commonly known as winter monsoon, monsoon rains begin
over north India and pass over the Bay of Bengal before reaching the Andamans and the South-east coast.
However, the south-west or the summer monsoon is the main source of rainfall in the country providing 80%
of the precipitation.
3.3. Natural Resources
3.3.1. Land - Soils: India has a wide range of soils, each type being particular of a specific locality.
Alluvial and black cotton soils are the two most important soil groups for agricultural production. Alluvial
soils cover about 78 mha (about 24%) of the total land and occur in the great Indo-Gangetic Plains, in the
valleys of Narmada and Tapti in Madhya Pradesh and the Cauvery in Tamil Nadu. These soils are considered
Chapter 3 General Profile, Land Use Classification and Land Use Pattern
20
very good for the production of wheat, rice other cereals, pulses, oil seeds, potato, sugarcane, etc. The
black cotton soils cover about 51.8 mha.and are found in the States of Mahrashtra, Gujarat, Madhya Pradesh,
Karnataka, Andhra Pradesh, Tamil Nadu, Uttar Pradesh and Rajasthan. These are also considered good for
cultivation of cotton, cereals, pulses, oil seeds, citrus fruits, vegetables, etc. In addition, Red soils have
been estimated to occur in 51.8 mha and are primarily found in Tamil Nadu, Karnataka, Kerala, Maharashtra,
Andhra Pradesh, Madhya Pradesh, Bihar and West Bengal. These are most suited for rice, ragi (millet),
tobacco and vegetable cultivation. Laterite and lateritic soils occur in 12.6 mha. These are not considered
good for agriculture. The area of desert soils is about 37 mha. These are also not found suitable for agriculture.
3.3.2. WATER
3.3.2.1 Rainfall: India receives annually about 4000 cubic kilometres of water through precipitation. About
80% of the country’s annual rainfall is mainly form the South-West monsoon season of June to September,
followed by the North-West monsoon in November-December. Most of rainfall is therefore few months in a
year, the country remaining dry for almost the rest of the year. Also, the rainfall is highly variable both
spatially and in quantity among the 35 meteorological sub-divisions, the country has been divided into
(Section 3.8.3). It varies from as low as 100 mm in western Rajasthan to as high as 9000 mm in Meghalaya
in the north-east India. Monsoon rainfall is usually torrential in intensity. This results in tremendous run-of
resulting in soil erosion (Sharma & Paul, 1999).
3.3.2.2. Water Resources: It is estimated that out of the total precipitation of around 400 million hectares
metres in the country, the surface water availability is about 187 million hectares. Of this only about 50%
can be put to beneficial use because of topographical and other constraints. Of the country’s utilisable water
resources of about 1100 cubic kilometres, surface sources, e.g. rivers account for roughly 60% and groundwater
sources, e.g., wells account for the remaining 40%.
Surface Waters: The country has been divided into 20 river basins- comprising of 12 major river basins,
each having a catchment area exceeding 20,000 sq.km and eight composite river basins (Sharma & Paul,
1999). In addition, other water resources include reservoirs, tanks, ponds and lakes which cover about 7
mha of the surface area of the country. India has 14 major river systems. The rivers may be classified as: (I)
Himalayan Rivers, (ii) peninsular rivers, (iii) coastal rivers and, (iv) rivers of inland drainage basin. Because of
the uneven precipitation, the availability of renewable freshwater varies enormously in different river basins.
The Himalayan rivers are snow-fed and perennial. The peninsular rivers are rainfed and therefore fluctuate in
volume. The coastal rivers are short in length with limited catchment areas. The rivers and tributaries of the
peninsular and coastal rivers are intermittent and non-perennial in nature. The streams of the inland drainage
basins of western Rajasthan are few and with little water holding capacity. Floods and drought affect vast
areas of the country. A third of the country is drought-prone. Floods affect an average area of around 9 million
hectares per year. According to the National Commission on Floods, the area susceptible to floods is
around 40 million hectares.
Groundwater: The groundwater potential varies in different regions of the country. Due to heavy extraction
of groundwater and its limited recharge, the groundwater is getting depleted at a fast rate. This depletion is
particularly marked in most of the dryland regions of States such as Andhra Pradesh, Karnataka, Rajasthan,
Madhya pradesh, Orissa and Maharashtra.
Chapter 3 General Profile, Land Use Classification and Land Use Pattern
21
3.3.3. Forests: Indian forests show greatest variation and range depending upon rainfall, soil topography
and climatic factors. The forests range from tropical rainforests to dry thorn forests and mountain -temperate
forests. There are four major forest types and 16 detailed forest types in the country (Table 3.2). More than
half of the forest area in India is tropical-moist and dry-deciduous types. Forests are both a resource and a
habitat for a rich flora and fauna found in the country. Of the 16 forest types in the country, the tropical
deciduous form the major forest type of India with 38.2 % of the total forest area. Other predominant forest
type is the moist deciduous covering 30.3 % of the forest area of the country.
Box. 3.1. Benefits of Natural Forests
Benefits of Natural Forests Soil protection.Soil fertility.Water conservation.Conservation of flora & fauna.Micro-climateConservation of genetic resourcesUse of varieties for genetic breeding and biotechnology.Integrated watershed management.Conservation of soil and regeneration of ecosystems as windbreaks andshelterbelts.
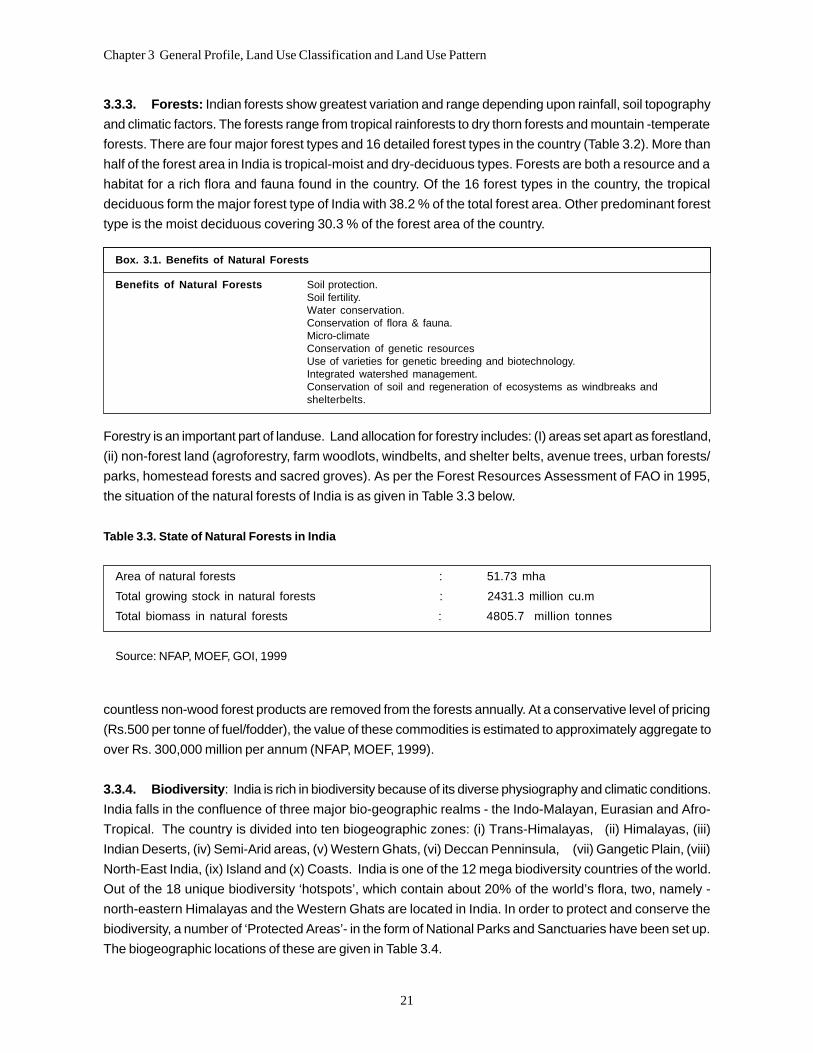
Forestry is an important part of landuse. Land allocation for forestry includes: (I) areas set apart as forestland,
(ii) non-forest land (agroforestry, farm woodlots, windbelts, and shelter belts, avenue trees, urban forests/
parks, homestead forests and sacred groves). As per the Forest Resources Assessment of FAO in 1995,
the situation of the natural forests of India is as given in Table 3.3 below.
Table 3.3. State of Natural Forests in India
Area of natural forests : 51.73 mha
Total growing stock in natural forests : 2431.3 million cu.m
Total biomass in natural forests : 4805.7 million tonnes
Source: NFAP, MOEF, GOI, 1999
countless non-wood forest products are removed from the forests annually. At a conservative level of pricing
(Rs.500 per tonne of fuel/fodder), the value of these commodities is estimated to approximately aggregate to
over Rs. 300,000 million per annum (NFAP, MOEF, 1999).
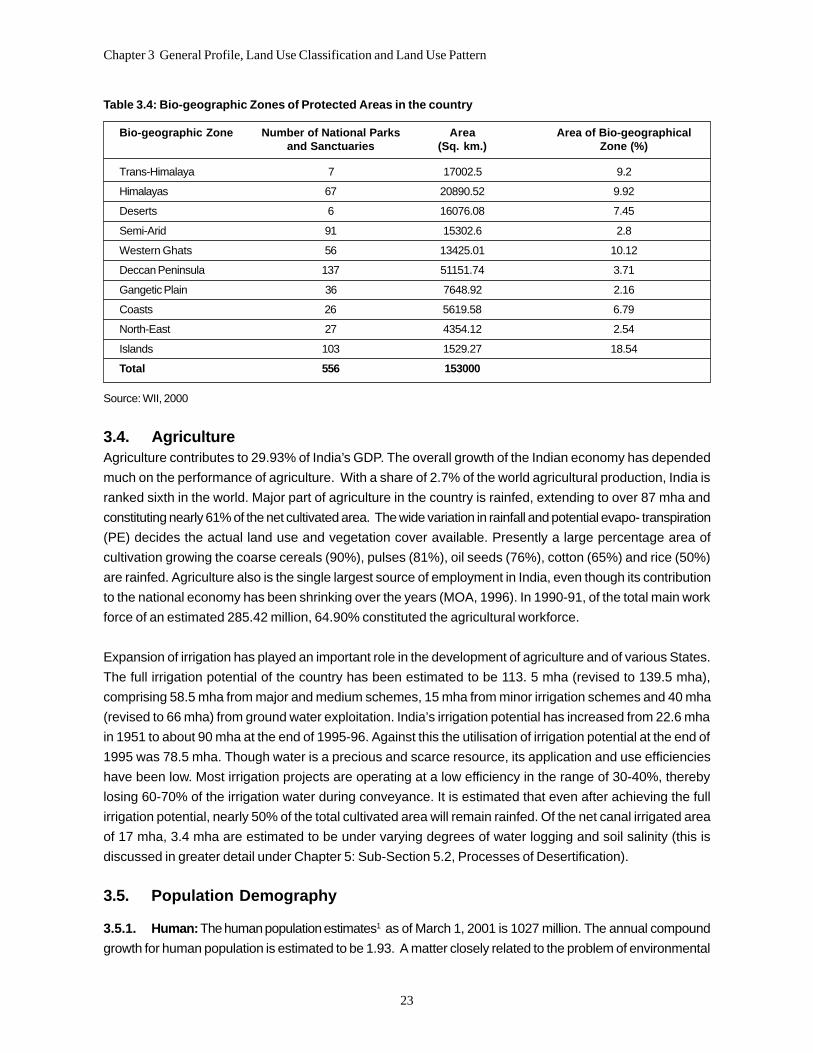
3.3.4. Biodiversity : India is rich in biodiversity because of its diverse physiography and climatic conditions.
India falls in the confluence of three major bio-geographic realms - the Indo-Malayan, Eurasian and Afro-
Tropical. The country is divided into ten biogeographic zones: (i) Trans-Himalayas, (ii) Himalayas, (iii)
Indian Deserts, (iv) Semi-Arid areas, (v) Western Ghats, (vi) Deccan Penninsula, (vii) Gangetic Plain, (viii)
North-East India, (ix) Island and (x) Coasts. India is one of the 12 mega biodiversity countries of the world.
Out of the 18 unique biodiversity ‘hotspots’, which contain about 20% of the world’s flora, two, namely -
north-eastern Himalayas and the Western Ghats are located in India. In order to protect and conserve the
biodiversity, a number of ‘Protected Areas’- in the form of National Parks and Sanctuaries have been set up.
The biogeographic locations of these are given in Table 3.4.
Chapter 3 General Profile, Land Use Classification and Land Use Pattern
22
Table 3.2: Major Forest Types Found in India
Forest Type Sub-Type Area % Occurrence in States/Union Territories(in mha)
Source: Agricultural Statistics at a Glance, 2001. Directorate of Economics & Statistics, Min. of Agriculture.
* Total Livestock includes cattle , buffaloes, sheep, goats, horses, pigs, donkeys & mules, camels, yaks, ‘mithuns’
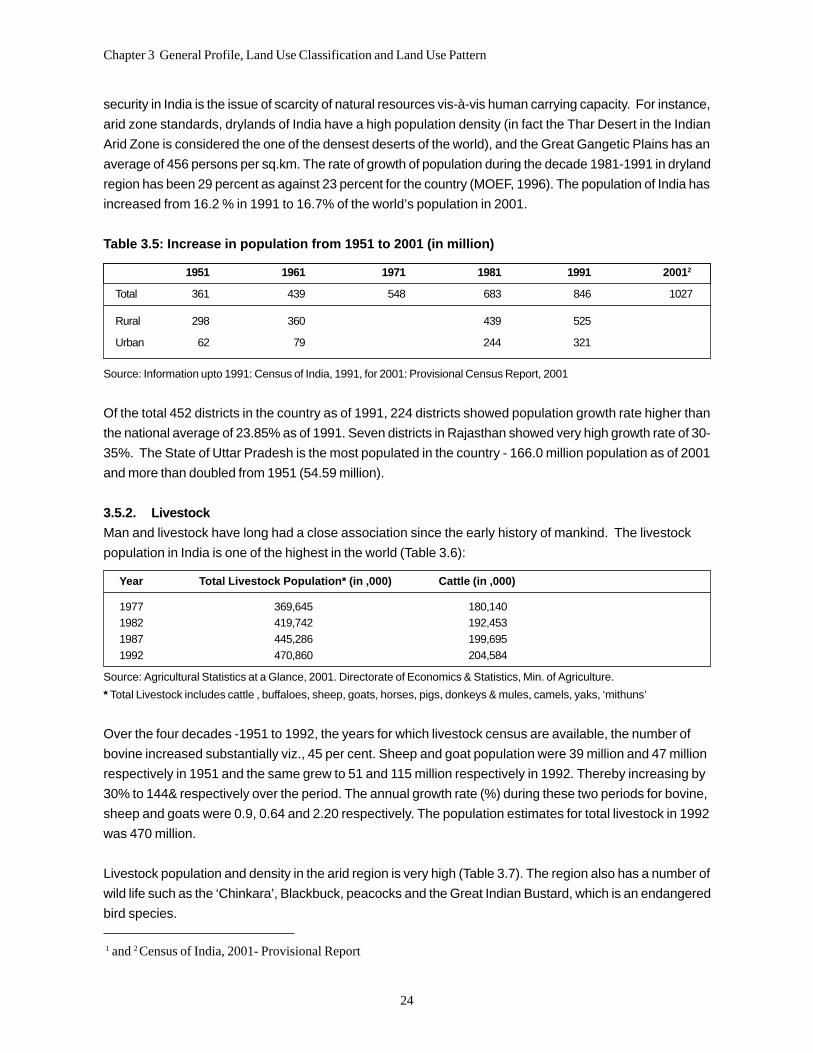
Over the four decades -1951 to 1992, the years for which livestock census are available, the number of
bovine increased substantially viz., 45 per cent. Sheep and goat population were 39 million and 47 million
respectively in 1951 and the same grew to 51 and 115 million respectively in 1992. Thereby increasing by
30% to 144& respectively over the period. The annual growth rate (%) during these two periods for bovine,
sheep and goats were 0.9, 0.64 and 2.20 respectively. The population estimates for total livestock in 1992
was 470 million.
Livestock population and density in the arid region is very high (Table 3.7). The region also has a number of
wild life such as the ‘Chinkara’, Blackbuck, peacocks and the Great Indian Bustard, which is an endangered
bird species.
1 and 2 Census of India, 2001- Provisional Report
Chapter 3 General Profile, Land Use Classification and Land Use Pattern
25
Table 3.7: Estimated Population of Livestock in the Hot Arid region.
LIVESTOCK POPULATION
Camels 1,001,000
Sheep and Goats 155,910,000
Cattle 199,695,000
Horses, Donkeys, & Mules 1,922,000
Yaks -
Elephants
Buffaloes 75,677,000
Others 175,000
Source: ICFRE, 1999
3.5.2.2. Income and employment from Livestock
Livestock is an important source of supplementary income of rural households; a nation wide survey of the
National Council of Applied Economic Research (NCAER) survey indicated that income from livestock
averages 22.5 per cent of total household incomes (MOA, 1996). Livestock in the Indian context, is thus a
major instrument for improving rural employment, particularly rural self-employment. In 1991, 65 per cent of
the total Indian working force of 185 million people was dependent on agriculture; 80 per cent of these
involved in livestock production, either as producers or as workers. The family women carry out some 60
percent of the work related to care and management of live stock in households. The total value of livestock
asset in 1993-94 was Rs.669 billion. This has increased to Rs.1302 billion in 1999-2000 as power the latest
estimates of National Accounts released by the Central Statistical Organisation. The GDP from livestock
sector is around 5-6% over the years and it is 5.5% in 1999-2000 at current prices. The value of output
(excluding draught power) Rs.436 billion, at 1996 price level. The draught output was valued at Rs.22 billion
on fuel equivalent basis. The livestock sector thus represents amongst the lowest capital/output ratios in the
economy while displaying high capacity for labour absorption. The livelihood challenge in the livestock
sector is of improving the productivity of and returns to the labour deployed on it (MOA, 1996). Livestock in
India is characterised by very large numbers and very low productivity, across all species. Yield of milk per
cattle head is poor compared to other countries.
Livestock production in India, is characterised by widely distributed small stock holdings, millions of them,
across the length and breadth of the country, stock holding size averaging from two to three animals per
holding for bovine, except in the nomadic herds of Gujarat and Rajasthan. For goats too this pattern prevails
– holding size increases for goats as part of the nomadic herds in Rajasthan and Gujarat. Sheep are usually
held in large flocks and are seldom found in small holdings – the flock size varies from a few heads to several
hundreds and are localised in specific areas in the state of Gujarat, Rajasthan, Uttar Pradesh, Tamil Nadu,
etc. Rural employment in livestock grew at 4.15 per cent between 1972 and 1982, a growth rate much higher
than of agriculture (1.15) and the entire rural sector (1.75). Since the organisation of livestock production has
largely maintained unchanged, the employment growth is on account of increased output, growing
marketisation, and increased activity level in intermediate processing and value addition.
3.5.2.3. Feed and Fodder for livestock
Livestock production in India is entirely dependent on crop residues and crop by-products. The total supply
Chapter 3 General Profile, Land Use Classification and Land Use Pattern
26
of feed and fodder in 1993 was straw 398 million tons, green fodder 573.50 million tons, and concentrates
41.98 million tons (MOEF 1993 estimates). While estimates of feed and fodder, past, current as well as
future, portray huge deficits (demand-supply gap), the livestock population increased across all species, 40-
300 per cent, and output of the sector tripled or quadrupled, all taking place within the supposedly diminishing
feed and fodder supply base. It is difficult to understand how this happens – either, it is unlikely that the
deficits are of the magnitude portrayed or all the increase in numbers and incremental production have taken
place at the expense of the ecology. However, fodder development continued to remain marginalised even in
the Seventh Plan – despite growing concern over the acute scarcity situation. The devastating effect of the
two-year stretch of severe drought, almost countrywide during the 1985-87 period focused attention on the
need for alternate strategies for feeding the livestock. The Seventh Plan however could not rise above the
usual departmental approach of fodder development schemes, mini kits, etc.
About a third of the total feed intake of the ruminants in India, large and small, is by grazing on common
property resources (CPRs). Overgrazing by herds far larger than what the land can sustain, year after year,
has progressively rendered them marginal or waste lands, grossly eroded - some estimates put annual
erosion of top soil at 6000 million tons - reduction in water points 55 to 92 per cent (MOA,1996), and
changing plant association, making them unsuitable for bovines and fit only for sheep and goats.
3.6 Socio-Economic DevelopmentThough agriculture has been the main occupation of the bulk of the Indian population, the founding fathers of
independent India had visions of the country becoming a prosperous and Modern State and accordingly
established a good industrial base. Since then, India has achieved a good measure of self-sufficiency in the
manufacture of a wide variety of basic and capital goods. However, even as of today, a large percentage of
the population in the country is dependent upon subsistence economy.
However, agricultural sector continued to receive the attention it deserved in the successive Five-Year Plans,
which provided momentum to the agricultural production and resilience to the economy. India today is not
only self-sufficient in grain production, but also has a substantial reserve, which helps in overcoming the
effects of drought and occasional failure of monsoon. In 1998-99, the primary sector comprising agriculture,
forestry and logging, fishery, mining and quarrying is estimated to have contributed 29 percent to the Gross
Domestic Product (Min. of Finance, 2000) and provide livelihood to about 67.5 percent of the work force in
the country (Census of India, 1991).
Rural employment in livestock grew at 4.15 per cent between 1972 and 1982, a growth rate much higher
than of agriculture (1.15) and the entire rural sector (1.75). Since the organisation of livestock production has
largely maintained unchanged, the employment growth is on account of increased output, growing
marketisation, and increased activity level in intermediate processing and value addition.
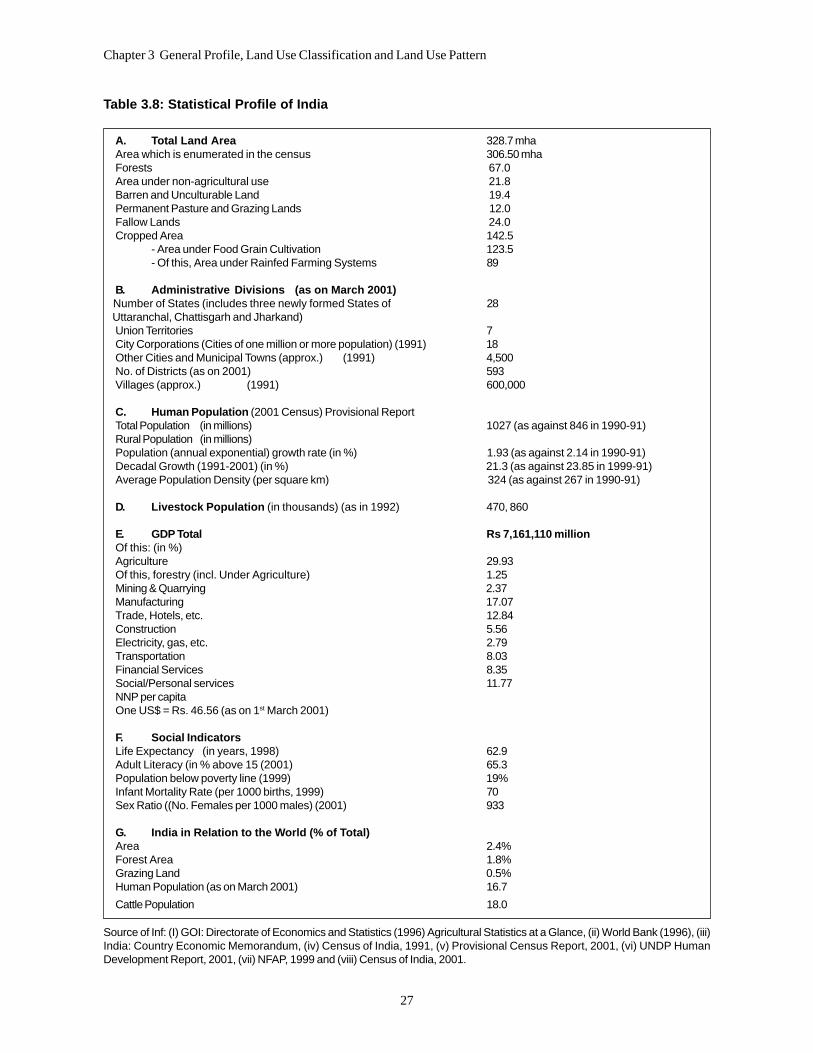
The statistical profile of the country is summarised in Table 3.8.
Chapter 3 General Profile, Land Use Classification and Land Use Pattern
27
Table 3.8: Statistical Profile of India
A. Total Land Area 328.7 mhaArea which is enumerated in the census 306.50 mhaForests 67.0Area under non-agricultural use 21.8Barren and Unculturable Land 19.4Permanent Pasture and Grazing Lands 12.0Fallow Lands 24.0Cropped Area 142.5
- Area under Food Grain Cultivation 123.5- Of this, Area under Rainfed Farming Systems 89
B. Administrative Divisions (as on March 2001) Number of States (includes three newly formed States of 28 Uttaranchal, Chattisgarh and Jharkand)
Union Territories 7City Corporations (Cities of one million or more population) (1991) 18Other Cities and Municipal Towns (approx.) (1991) 4,500No. of Districts (as on 2001) 593Villages (approx.) (1991) 600,000
C. Human Population (2001 Census) Provisional ReportTotal Population (in millions) 1027 (as against 846 in 1990-91)Rural Population (in millions)Population (annual exponential) growth rate (in %) 1.93 (as against 2.14 in 1990-91)Decadal Growth (1991-2001) (in %) 21.3 (as against 23.85 in 1999-91)Average Population Density (per square km) 324 (as against 267 in 1990-91)
D. Livestock Population (in thousands) (as in 1992) 470, 860
E. GDP Total Rs 7,161,110 millionOf this: (in %)Agriculture 29.93Of this, forestry (incl. Under Agriculture) 1.25Mining & Quarrying 2.37Manufacturing 17.07Trade, Hotels, etc. 12.84Construction 5.56Electricity, gas, etc. 2.79Transportation 8.03Financial Services 8.35Social/Personal services 11.77NNP per capitaOne US$ = Rs. 46.56 (as on 1st March 2001)
F. Social IndicatorsLife Expectancy (in years, 1998) 62.9Adult Literacy (in % above 15 (2001) 65.3Population below poverty line (1999) 19%Infant Mortality Rate (per 1000 births, 1999) 70Sex Ratio ((No. Females per 1000 males) (2001) 933
G. India in Relation to the World (% of Total)Area 2.4%Forest Area 1.8%Grazing Land 0.5%Human Population (as on March 2001) 16.7
Cattle Population 18.0
Source of Inf: (I) GOI: Directorate of Economics and Statistics (1996) Agricultural Statistics at a Glance, (ii) World Bank (1996), (iii)India: Country Economic Memorandum, (iv) Census of India, 1991, (v) Provisional Census Report, 2001, (vi) UNDP HumanDevelopment Report, 2001, (vii) NFAP, 1999 and (viii) Census of India, 2001.
Chapter 3 General Profile, Land Use Classification and Land Use Pattern
28
3.7 Land Use Classification
India has a diverse agro-climate, topography and soil types on the basis of which it has been categorised
into various regions. Major part of the country is rainfed. Rainfall, therefore, constitutes an important parameter
in the classification of the country into various regions for the purpose of planning.
3.7.1 Agro-Climatic Regions: India has been divided into 15 agro-climatic zones on the basis of climate,
in combination with soil and other factors that affect the agriculture in the region. This classification orginated
in 1979 by the Indian Council of Agricultural Research (ICAR) through the National Agricultural Research
Project (NARP). These are:
1. Western Himalayan Region.
2. Eastern Himalayan Region.
3. Lower Gangetic Plains Region.
4. Middle Gangetic Plains Region.
5. Upper Gangetic Plain Region.
6. Trans Gangetic Plains Region.
7. Eastern Plateu and Hill Region.
8. Central Plateau and Hill Region.
9. Western Plateau and Hill Region.
10. Southern Plateau and Hill Region.
11. East Coast Plains and Hill Region.
12. West Coast Plains and Ghat Region.
13. Gujarat Plains and Ghat Region.
14. Western Dry Region.
15. Island Region.
3.7.2 AGRO-ECOLOGICAL REGIONS (AERs) AND SUB-REGIONS (AESRs)
Agro-Ecological Regions: The country has also been categorised into 20 Agro-Ecological Regions on a
1:4 million scale map, based on physiography, soils, climate, growing period and also taking into account
available water capacity of the soil, etc. The mapping and classification of the various parts of the country for
generation of agro-ecological regions involved the superimposition of four base maps, namely physiography,
soils, bioclimate and length of growing period and have been used for resource planning at national level.
Agro-Ecological Sub-Regions (AESRs): The agro-ecological regions (see section 3.8.2) were subsequently
refined to prepare a 60 Agro-Ecological Sub-Regions (AESR) Map for regional level planning using the
detailed soil information at subgroup level, physiography at land form level, and bioclimate (refined limits of
arid, semi-arid and sub-humid bioclimate) (Annex, 3.) types and length of growing period (LGP) at 30 day
class interval. The AESR map is useful for regional level planning and resource allocation. The information of
length of growing period as well as agro-ecological zoning supported by moisture availability index can act
as an excellent base for crop modelling and crop suitability evaluation.
Chapter 3 General Profile, Land Use Classification and Land Use Pattern
29
3.7.3. Bio-Climatic Regions
The agro-ecological regions fall into 6 major climatic regions as given below:
(i) Arid
(ii) Semi-arid
(iii) Dry Sub-humid
(iv) Moist Sub-humid
(v) Humid
(vi) Per-humid
Based on the classification laid down by the National Bureau of Soil Science and Land Use Planning
(NBS&LUP) in the publication “Agro-Ecological Sub-regions of India for Planning and Development”
(Velayutham 1999) and the Method of the dryland classification of bioclimatic zonation of the country, main
areas/districts in the concerned regions falling in the various bioclimatic regions are given in Annex-3. It is
important to note that the Thornthwaite system of classification is used for agricultural planning in
the country considering the annual rainfall, moisture index and other aspects such as the growing
period of crops.
DRYLAND (ARID-SEMI ARID- DRY SUB-HUMID) REGIONS OF INDIA
According to NABBLUP, Nagpur the arid, semi-arid and dry sub-humid regions constituting the ‘drylands’
(as per Thornthwaite Classification) cover about 228.3 mha (69.6%) of the total land area (328 mha) of the
country (Table.3.9). A large number of States fall within the drylands. However, almost the entire North-
Eastern Region covering the States of Assam, Meghalaya, Nagaland, Tripura, Manipur, Mizoram, Sikkim
and Arunachal Pradesh), and the State of Uttaranchal in North India do not fall within the dryland region. In
addition, parts of Jammu & Kashmir, parts of Himachal Pradesh, coastal areas of Karnataka, Maharashtra,
Goa, and major parts of the States of Kerala, Orissa, West Bengal and the Islands of Andaman & Nicobar
and Lakshwadeep and Minicoy, which are predominantly humid/perhumid also do not fall within the dryland
regions. It is however important to note that land degradation is a serious problem even in the humid/per-
humid regions of the country, particularly in the hilly regions, where the main process of land degradation is
water erosion resulting in high losses of top soil and fertility. Major part of the dryland regions in the country
are rainfed, while some are irrigated. The country’s programmes are therefore, not targeted to addressing
land degradation in the drylands alone, although special emphasis is given to rainfed regions.
(I) ARID REGION: According to NBSSLUP, about 50.8 mha (15.8%) of the country’s geographical area is
arid (Table 3.8).
HOT ARID REGION: These include the hot arid regions that occupy major parts of Rajasthan (Western),
Gujarat, southern parts of Punjab and Haryana and a small portion of Deccan Penninsula in the States of
Andhra Pradesh, Karnataka, Maharashtra. Roughly, three-fourths of the State of Rajasthan, comprising of
12 western districts falls within the hot arid zone. These are the districts of: Barmar, Bikaner, Churu, Sri
Chapter 3 General Profile, Land Use Classification and Land Use Pattern
30
Table 3.9: Classification of ‘dryland’ regions in India using Thornthwaite Classification
S.N. REGION ANNUAL MOISTURE INDEX GROWING TOTAL LAND AREAAV. (As per PERIOD __________________RAINFALL Thornthwaite (in days) in mha in %(in mm) Classification)
1. Glaciers & Others - - - 5.2 1.5
2. Hyper Arid <100 <-83.3 0-60 22.9 7.0
3. Typic Arid 100-500 -66.7 to -83.2 60-90 22.7 7.0
4. Semi-Arid (dry) 500-750 -50 to -66.6 90-120 51.2 15.6
5. Semi-Arid (moist) 750-850 -49.9 to -33.4 120-150 72.2 22.0
6. Sub-humid (dry) 850-1000 -33.3 to 0 150-180 54.1 16.5
7. Sub-humid (moist) 1000-1500 0 to 20 180-270 39.8 12.1
Desert Area of no or minimal value 4270Area in danger of desertification 134300Cultivated area 128300 131670 123378Pastureland 59760 53800 52284Others 2840 3880 4285
Source: Report of MEA submitted to the CSD in 1995.
(II) SEMI-ARID
About 123.4 mha (37.6%) of the country’s geographical area consists of the semi-arid region. (NBSSLUP,
2001). The semiarid tropical areas (SAT) can be further classified into dry and wet. In the SAT, the crops and
cropping systems are quite diverse depending on the soil type and the length of growing season. Sorghum,
cotton, soyabean, groundnut and pulses are the major crops grown in this zone.
(III) DRY SUB-HUMID
About 54.1 mha (16.5%) of the country’s geographical area falls within the dry sub-humid region. The dry
sub-humid region receives fairly high rainfall providing ample opportunities for water harvesting. This can be
effectively integrated with the safe disposal of excess runoff to overcome water congestion of soils for crops
(other than rice). Rainfed rice is the predominant crop followed by pulses, oilseeds and to some extent,
vegetables. Fruit crops particularly in Orissa are also an important component of the production system.
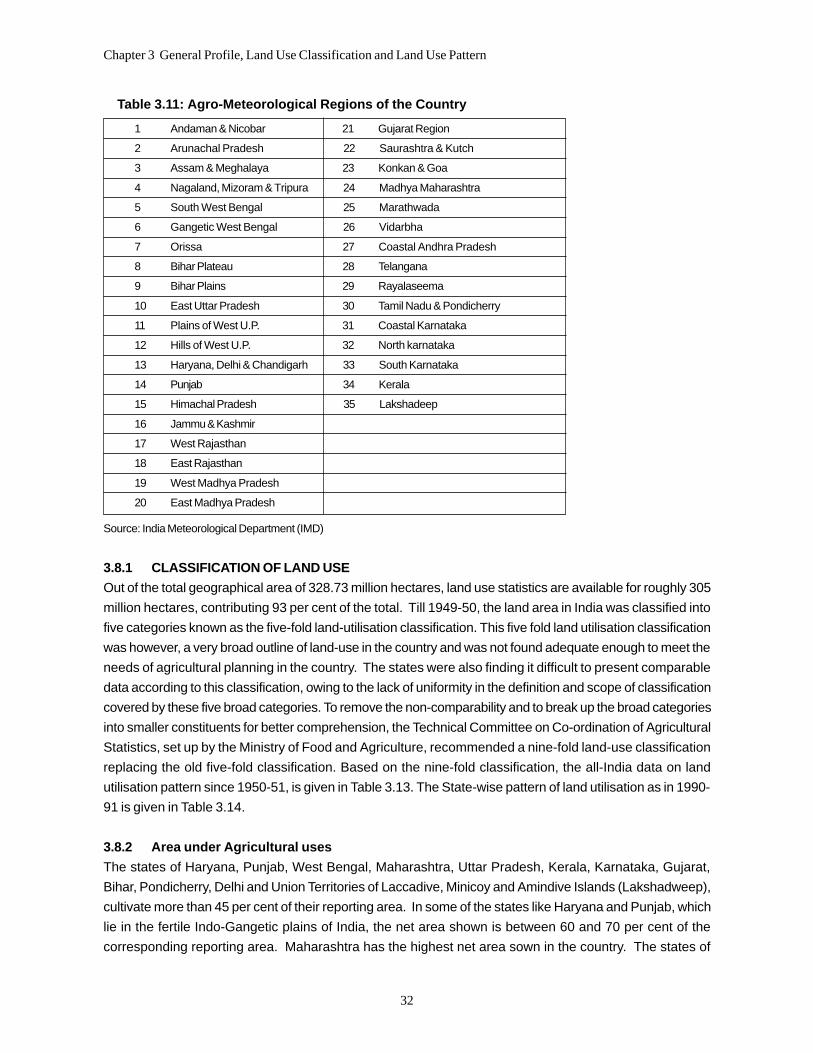
3.7.4 AGRO-METEOROLOGICAL REGIONS
The country has also been classified into 35 agro-meteorological divisions for the purpose of monitoring
rainfall intensity and drought. These are given in Table.3.11 below: The concept of drought on a sub-divisional/
district scale is presently under review.
3.8 Land Use Pattern in India
The pattern of land use of a country at any particular time is determined by the physical, economic and
institutional framework taken together. In other words, the existing land-use pattern in different regions in
India has been evolved as a result of the action and interaction of various factors, such as the physical
characteristics of land, the institutional framework, the structure of other resources (capital, labour etc.)
available, and the location of the region in relation to other aspects of economic development e.g. those
relating to transport as well as to industry and trade. The present pattern can, therefore, be considered in
some sort of static harmony and adjustment with the other main characteristics of the economy of the
region. A close study of the present land-use pattern and the trends during recent years will help to suggest
the scope for planned shifts in the pattern.
Chapter 3 General Profile, Land Use Classification and Land Use Pattern
32
Table 3.11: Agro-Meteorological Regions of the Country
Out of the total geographical area of 328.73 million hectares, land use statistics are available for roughly 305
million hectares, contributing 93 per cent of the total. Till 1949-50, the land area in India was classified into
five categories known as the five-fold land-utilisation classification. This five fold land utilisation classification
was however, a very broad outline of land-use in the country and was not found adequate enough to meet the
needs of agricultural planning in the country. The states were also finding it difficult to present comparable
data according to this classification, owing to the lack of uniformity in the definition and scope of classification
covered by these five broad categories. To remove the non-comparability and to break up the broad categories
into smaller constituents for better comprehension, the Technical Committee on Co-ordination of Agricultural
Statistics, set up by the Ministry of Food and Agriculture, recommended a nine-fold land-use classification
replacing the old five-fold classification. Based on the nine-fold classification, the all-India data on land
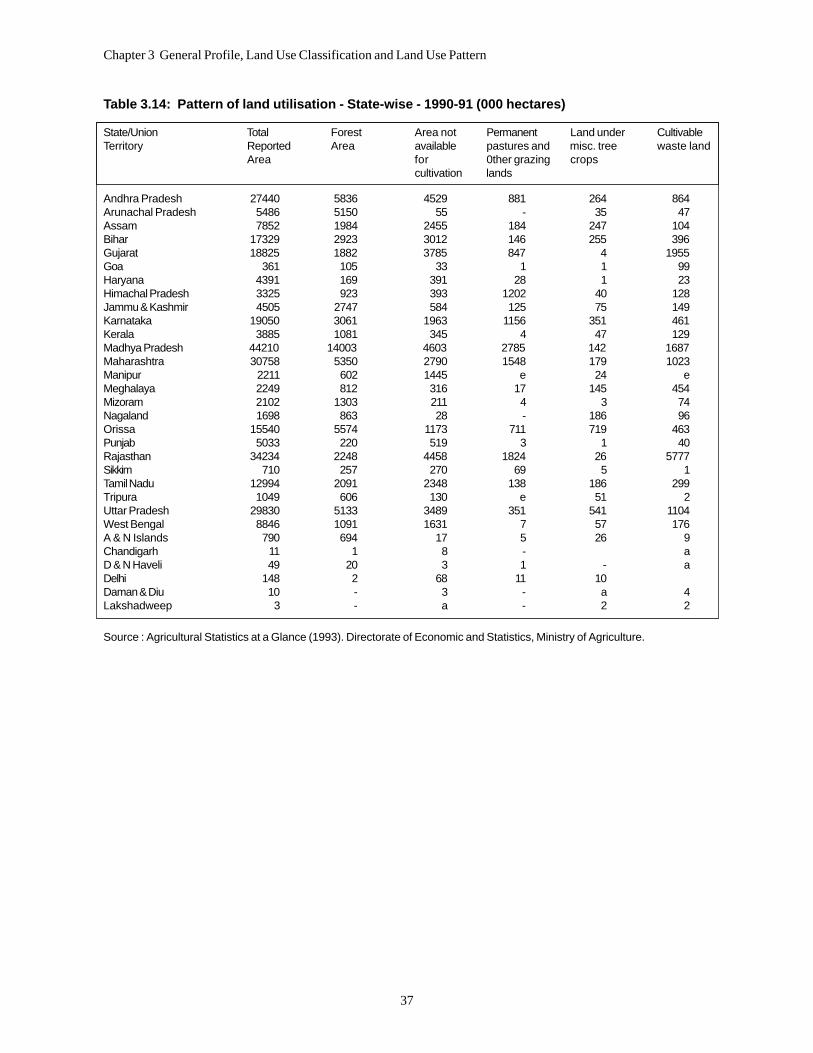
utilisation pattern since 1950-51, is given in Table 3.13. The State-wise pattern of land utilisation as in 1990-
91 is given in Table 3.14.
3.8.2 Area under Agricultural uses
The states of Haryana, Punjab, West Bengal, Maharashtra, Uttar Pradesh, Kerala, Karnataka, Gujarat,
Bihar, Pondicherry, Delhi and Union Territories of Laccadive, Minicoy and Amindive Islands (Lakshadweep),
cultivate more than 45 per cent of their reporting area. In some of the states like Haryana and Punjab, which
lie in the fertile Indo-Gangetic plains of India, the net area shown is between 60 and 70 per cent of the
corresponding reporting area. Maharashtra has the highest net area sown in the country. The states of
Chapter 3 General Profile, Land Use Classification and Land Use Pattern
33
Maharashtra, Madhya Pradesh, Karnataka, Gujarat and Bihar account for more than three-fourths of the
country’s net area sown.
3.8.3 Land under non-agricultural uses
This category includes all lands occupied by buildings, roads and railways, or under water, e.g. rivers and
canals, and other lands put to uses other than agricultural. During recent years, there has been an increase
in the area put to non-agricultural uses, as expected, because as a result of increase in the developmental
activities, more and more land is being used for industrial sites, housing, transport systems, recreational
purposes, irrigation systems etc. The states where the proportion of land under non-agricultural uses is
higher than the all-India average are Haryana, Jammu & Kashmir, Kerala, Orissa, Uttar Pradesh, Andhra
pradesh, Punjab, Tamil Nadu, Bihar, Assam, Goa, Delhi, Pondicherry and the Union Territory of Daman and
Diu. The states which account for more than two-thirds of the land under non-agricultural uses are Andhra
Pradesh, Madhya Pradesh, Uttar Pradesh, Bihar, Tamil Nadu, Rajasthan, Orissa and Karnataka.
The other types of areas, which are covered under barren and unculturable lands, are generally unsuitable for
agricultural use either because of the topography or because of their inaccessibility. Instances are the
desert areas in Rajasthan, the saline lands in parts of the Rann of Kutch in Gujarat, the weed infected and
ravine lands in Madhya Pradesh and alkaline lands in Uttar Pradesh. The proportions of barren and uncultivated
lands to the reporting areas are higher in the states of Rajasthan, West Bengal, Assam, Gujarat, Manipur,
Nagaland, Meghalaya, Arunachal Pradesh and Mizoram. The states of Rajasthan, Gujarat, Uttar Pradesh,
Madhya Pradesh, Meghalaya, Assam and Maharashtra together account for more than 67 per cent of the
land under this category in the country.
3.8.4 Area under Forests
The recorded forest area of the country is 76.52 mha as reported by the State Forest Departments (FSI,
1999). This area has been classified into Reserved, Protected and Unclassed forest, which constitute
54.44, 29.18 and 16.38% of the forest area respectively. As per data from remote sensing on the basis of
data and the FSI assessments, only 63.73 mha is estimated to be under actual forest cover as of 1999. The
discrepancy is basically due to differences in methods of data collection, legal records and ground truthing.
Any plantation which is less than 20 ha block cannot be interpreted by satellite imagery as per existing
technology.
Box 3.2 Classification of Recorded Forest Area
Reserved Forest An area notified under the provisions of Indian Forest Act having full degree ofprotection. In reserved forest, all activities are prohibited unless permitted.
Protected Forest An area notified under the provisions of the Indian Forest Acts having limited degreeof protection. In protected forests, all activities are permitted unless prohibited.
Unclassed Forest An area recorded as forest but not included in reserved or protected forest category.Ownership status of such forests varies from state to State.
Chapter 3 General Profile, Land Use Classification and Land Use Pattern
34
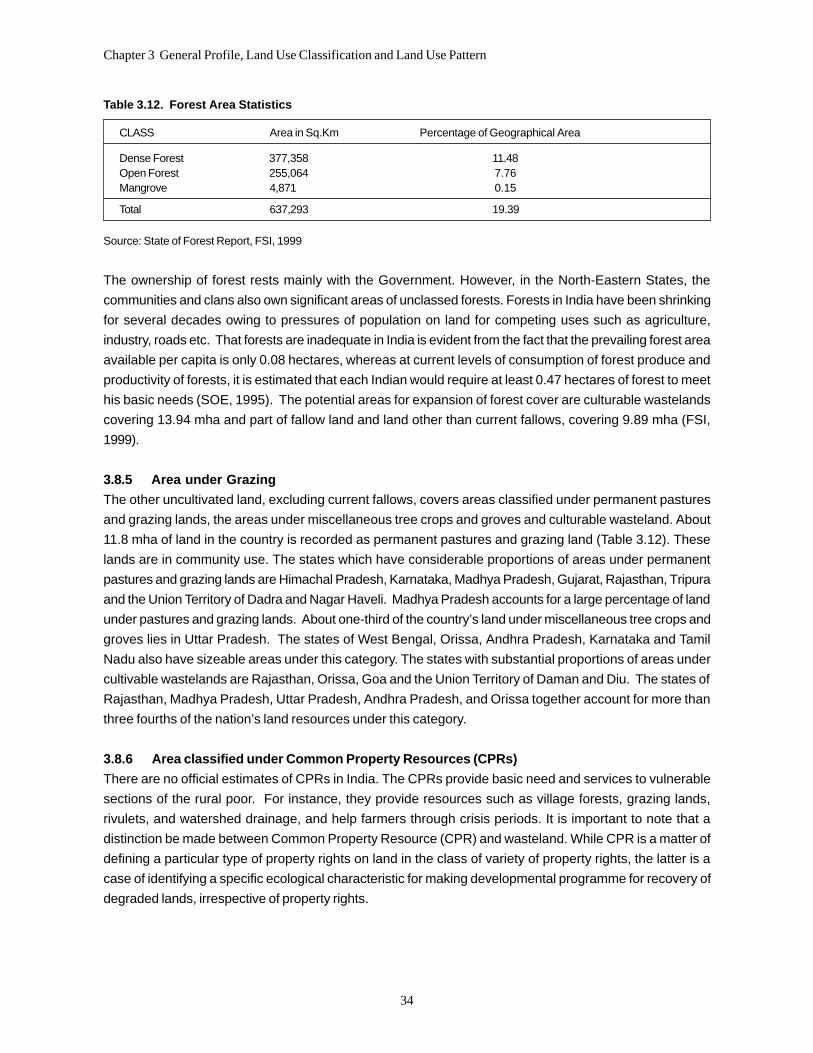
Table 3.12. Forest Area Statistics
CLASS Area in Sq.Km Percentage of Geographical Area