+ All Categories
Home > Documents > Land - EPA

Land - EPA

Date post: 12-Mar-2022
Category:
Upload: others
View: 1 times
Download: 0 times
Share this document with a friend
32
130 STATE OF THE ENVIRONMENT REPORT 2008 LAND Trends Goals Land use and a sustainable South Australia Land Use Residential land use: INCREASING in peri-urban regions with resulting pressures on biodiversity, water resources and agricultural land. Change from relatively low intensity land use (such as grazing) to higher intensity uses (such as viticulture and plantation forestry): INCREASING in some regions. Use of chemicals with residual impacts DECREASING. Awareness and knowledge of site contamination: INCREASING. Prosperous communities and industries using and managing natural resources within ecologically sustainable limits. Goal 2, State Natural Resources Management Plan 2006 Land uses have major implications for South Australia’s natural resources including its soil, water, plants and animals. Intensification of land uses away from relatively low intensity agriculture such as grazing, towards more intensive uses such as viticulture, horticulture and residential development, places greater pressure on water resources, highly productive agricultural land and biodiversity. Many of the most invasive weed species are derived from agricultural, pastoral, garden and forestry systems and their ranges are often associated with these production systems (Adelaide and Mount Lofty Ranges Natural Resources Management Board, 2008). If a particular land use is not compatible with the nature of the land – its soils, water and vegetation – and if ongoing management does not take into consideration the interaction of these factors in the long term, significant environmental, social and economic problems can occur. Crop selection and farm management practices for example, play a key role in processes affecting catchment salinity and water quality, as well as rates of soil erosion, acidification, nutrient decline and carbon loss. Problems can also occur if new land uses are not compatible with past land
Transcript

130 S TAT E O F T H E E N V I R O N M E N T R E P O RT 2 0 0 8

LAND

Trends

Goals

Land use and a sus ta inable South Aust ra l ia

Land Use

• Residentiallanduse:INCREASINGinperi-urbanregionswithresultingpressuresonbiodiversity,waterresourcesandagriculturalland.

• Changefromrelativelylowintensitylanduse(suchasgrazing)tohigherintensityuses(suchasviticultureandplantationforestry):INCREASINGinsomeregions.

• UseofchemicalswithresidualimpactsDECREASING.

• Awarenessandknowledgeofsitecontamination:INCREASING.

Prosperouscommunitiesandindustriesusingandmanagingnaturalresourceswithinecologicallysustainablelimits.

Goal 2, State Natural Resources Management Plan 2006

LanduseshavemajorimplicationsforSouthAustralia’snaturalresourcesincludingitssoil,water,plantsandanimals.

Intensification of land uses away from relativelylowintensityagriculturesuchasgrazing,towardsmoreintensiveusessuchasviticulture,horticultureandresidentialdevelopment,placesgreaterpressure

onwaterresources,highlyproductiveagriculturallandandbiodiversity.Manyofthemostinvasiveweedspeciesarederivedfromagricultural,pastoral,gardenandforestrysystemsandtheirrangesareoftenassociatedwiththeseproductionsystems(AdelaideandMountLoftyRangesNaturalResourcesManagementBoard,2008).

Ifaparticularlanduseisnotcompatiblewiththenatureoftheland–itssoils,waterandvegetation–andifongoingmanagementdoesnottakeintoconsiderationtheinteractionofthesefactors in the long term, significant environmental,socialandeconomicproblemscanoccur.Cropselectionandfarmmanagementpracticesforexample,playakeyroleinprocessesaffectingcatchmentsalinityandwaterquality,aswellasratesofsoilerosion,acidification, nutrient decline and carbonloss.

Problemscanalsooccurifnewlandusesarenotcompatiblewithpastland

131S TAT E O F T H E E N V I R O N M E N T R E P O RT 2 0 0 8

Indicators

P lant Remediat ion of Contaminated Land

Theuseofvegetationtohelprehabilitatealteredlandscapeshasbeenusedinmanysituationsincludingto:

• helpreducewatertableheightandtherefore,saltdamage

• increasespeciesvariationincludingbysupplyingfoodandshelter,toincreasetheindigenousbiodiversity

• modifysoilchemistrysuchasthroughlegumescyclingofnitrogen

• purifywater,e.g.inwetlands

However,theuseofMetallophytes(plantsevolvedtosurviveonmetal-richsoil),haslargelybeenignoredasameansofrehabilitatingcontaminatedlandssuchaspost-miningsites.

Metallophyteshavetheabilitytodrawmetalcontaminantsfromthesoil.Thesecontaminantscanthenbeharvestedfromtheplants,thusremovingthemfromthearea.

Thisprocesshasthepotentialtoaidtheremediationprocessfollowingmineclosures,shorteningthetimerequiredtoreturnthesitetonearitspreminedstatesooner.

Source:

Whiting,S.N.,Reeves,R.D.,Richards,D.,Johnson,M.S.,Cooke,J.A.,Malaisse,F.,Paton,A.,Smith,J.A.C.,Angle,J.S.,Chaney,R.L.,Ginocchio,R.,Jaffre,T.,Johns,R.,McIntyre,T.,Purvis,O.W.,Salt,D.E.,Schat,H.,Zhao,F.J.,andBaker,A.J.M.(2004).ResearchPrioritiesforConservationofMetallophyteBiodiversityandtheirPotentialforRestorationandSiteRemediation.RestorationEcology.Vol.12,no.1,pp106–116.

uses.Buildinghousesonunremediatedlandthatwasonceusedforindustrialpurposes,suchasafoundryortanneryforexamplecanhavehealthimplicationsforoccupantsincaseswheretheprevioususehasresultedinsoilcontaminationorpollution.Theuseofpesticidescanalsocausesitecontaminationonabroader,morediffusescale.SouthAustralia’slowlevelofpesticideapplicationbyworldstandardsmeansthatthisislesslikelyto be a significant problem in South Australia.

LanduseinformationisusedinAustraliatomanagecatchmentsalinity,nutrientandsedimentproblems,measuregreenhousegasemissionsandsinks,andtoassessagriculturalproductivity.Thisinformationcanbeusedinevaluationofcropalternativesandlandvaluedeterminations,inlocalandregionalplanning,pestanddiseasecontrolandemergencyresponseplanning.TheDepartmentofWater,LandandBiodiversityConservation(DWLBC)hasundertakenextensivelandusemappingofSouthAustralia’sregionalareas.

CONDITION INDICATOR

• Current land use in South Australia

Thisprovidesanindicationofcurrentlandusesandabaselineagainstwhichtoassesschangeovertime

PRESSURE INDICATORS

• Land use change in South Australia

Landusechangeisadirectmeasureofpotentialpressureontheenvironment

• Awareness and acknowledgement of site contamination

Awarenessandacknowledgmentofsitecontaminationreducesecologicalandhumanhealthimpactsassociatedwithsoilandgroundwatercontamination

Vineyards, Barossa Valley

Land Use

132 S TAT E O F T H E E N V I R O N M E N T R E P O RT 2 0 0 8

LAND

Cattle farm

Table 4.1: Land use in South Australia, 2008

What is thecurrent s i tuat ion?

CONDITION INDICATOR: Current land use in South Australia

TheState of the Environment Report 1998 indicatedthatinformationonlandusewaseitherveryoldorincomplete,makingit difficult to identify trends.

Information presented for the first time in theState of the Environment Report 2003 wasofmuchbetterqualityandin2008wearenowabletopresentsometrendinformation.ThedatahasbeensourcedfromtheLandUseandManagementMappingofSouthAustraliaProgramconductedbytheDWLBC.

Themajorlandusesinthisstatearelivestockgrazingonnativespecies,conservation,naturalenvironmentsanddrylandagriculture,whichincludesthegrowingofcropsandthegrazingoflivestock on modified pastures (Table 4.1).

What are the pressures?

Conservation and natural environments

Ofthelandthathasbeenmapped,conservationandnaturalenvironmentscover39.2%or38,511,184Haofthestate.Thisrepresentsa4.4%or1,789,617Hadecrease from the figure reported in the StateoftheEnvironmentReport2003.

However,the2003reportincludedLakeEyre,LakeTorrensandLakeGairdnerasNationalParks.Followingmoredetailedmappingofthestate’sfarnorthandareviewofmethodology,theseareasarenowincludedinthestatisticalWater classification. The majority of the conservationandnaturalenvironmentslanduseoccursinthefarnorth.

Thisbroadlandusecategoryissubjecttoarelativelylowlevelofhumanimpact.Specific land uses include National Parks andWildlifeReserves,Aboriginallands,

protectedlandscapesanddefenceandnaturereserves.NationalParksandWildlifeReservesoccupyaround49%ofthelandwithinthiscategory.

Itisimportanttorecogniseconservationofnaturalenvironmentsasalegitimatelanduse.Otherlandusescanimpingeontheeffectivenessofconservationreservestomaintainecologicalprocessesandconservebiodiversity.Inparticular,conservationareascanbeaffectedbypressurefromweeds,feralanimalsandfarmchemicals,becausetheyareadjacenttoagriculturalandresidentiallanduses.

Thepotentialimpactofotherlandusesonconservationareasislowestinthefarnorth,wheresuchareastendtobelargeandotherlandusesareofrelativelylowintensity(seefollowingsection).Conversely,itshouldberecognisedthatsomeunder-resourcedconservationareashaveweedimpactsonneighbouringproductiveland.

Production from relatively natural environments

ThisbroadlandusecategoryoccupiesthelargestproportionofSouthAustraliaataround43.6%or42,828,863Ha,adecreaseof2%or863,103haofmapped land from figures reported in 2003.Landinthiscategoryisgenerallysubjecttorelativelylowlevelsofhumanimpact.

ThemajorlanduseisgrazingonnativespeciesintheRangelandsregion.Sheepgrazingdominatessouthofthedingofenceandcattlegrazingnorthofit.

Over-stockingandgrazingbyrabbitsinthepasthasledtothedegradationofvegetationandsoilerosioninmanyregions.Theintroductionofrabbithaemorrhagicdisease(calicivirus)ledtothesuccessfulgerminationofnativespeciessuchasMulga(Acacia aneura)for the first time in one hundred years. Thedecreasingeffectivenessofthe

Primary Description Area (ha) % of the State

Conservation and Natural Environments 38,511,184 39.2

Production from Relatively Natural Environments 42,828,863 43.6

Production from Dryland Agriculture and Plantations 10,728,136 10.9

Production from Irrigated Agriculture and Plantations 264,461 0.3

Intensive Uses (including Human Settlement) 1,633,737 1.7

Water 4,207,673 4.3

Unmapped Areas 3,520 0.004

‘Itisimportantto

recognise

conservationof

naturalenvironments

asalegitimate

landuse.’

Source:DWLBC

133S TAT E O F T H E E N V I R O N M E N T R E P O RT 2 0 0 8

diseaseisnowapparentwithincreasingevidence of resistance. Recovery of flora isslowinsomeareasdespitedestocking,duetoaseriesofpoorseasonsandthevulnerabilityofsomespeciestoevenlowstockinglevels.

Adetailedleaseassessmentprogramestablishedin1989underthePastoral Land Management and Conservation Act 1989requiresregularassessmentsoflandcondition(includingnativevegetation)andestimatesofitsabilitytosupportstock.Thishashelpedtoimprovelandmanagementintheregionoverthelastdecadeorso.

Production from dryland agriculture and plantations

Sincethe2003report,thisbroadlandusehasincreased7.2%or722,770Haandnowoccupiesaround10.9%or10,728,136Haofthestate.Thisisbasedondrylandfarmingsystemswherethemajorityofnativevegetationhasbeencleared.

Typicallandusesincludestockgrazing,cropping,plantationforestryandawiderangeofhorticulturalproduction.In2005SouthAustraliaproduced24.6%ofthegrossvalueofAustralia’sbarleycropand12.3%ofthegrossvalueofthenation’swheat(ABS,2007a).

Agricultural land uses have significantly changedthelandscape.However,landandcropmanagementpracticesareimprovinginmanyregionsasaconsequenceofnewagriculturalandcommunicationtechnologiesandagrowing awareness of the benefits of changingtraditionalfarmingpractices.SoillossassociatedwithagriculturallanduseinSouthAustralia,forexample,hasreducedconsiderablyoverthepast50yearsandcontinuestodeclineasadirectresultofbetterlandmanagementpractices.

Forestryplantationsoccupyaround174,018hectaresoflandinSouthAustralia.Themajorityofthisisintheso-calledGreenTrianglearoundMountGambier.ThemajorityoftheremainderisfoundintheMountLoftyRangesandthestate’smidnorth.Mostoftheseforestryplantationsconsistofsoftwood,predominantlyPinus radiata,althoughthereisanincreasingtrendtowardstheestablishmentofhardwoodplantations,particularlyEucalyptusspecies.Thisreflects developing market opportunities forshortrotationhardwoodtimbercropsthatleadtohighereconomicreturns

Cropping, Pt Turton. Photo: Monica Moss

(Hamblin,2001).ForestrySAalsomanages24,000Haofnativeforestreserves.Thesehavemultiple-useobjectivesincludingrecreationandconservation.

Thereareconcernsthatgrowthoftheforestryindustry,particularlyinthelowerSouthEast,MountLoftyRangesandtheMiddleRivercatchmentonKangarooIsland,mayhaveapotentiallynegativeimpactonregionalwaterresourcesandbiodiversity.Carbonoffsetschemes,suchastheproposedCarbon Pollution Reduction Scheme,arelikelytoacceleratetheestablishmentofadditionalforestsascarbonsinks(forestsplantedforthepurposeofpermanentlystoringcarbon).Goodlanduseplanningwillberequiredtoavoidanyadverseenvironmentalimpactsfromtheintroductionofthisscheme.(DepartmentofClimateChange,2008).

Irrigated agriculture and horticulture

Thislanduseoccupiesaround0.3%or264,461haofSouthAustralia,anincreaseof 19% or 42,154 Ha from the 2003 figures andconsistsofirrigatedhorticulture,viticultureandpastures.

Theseactivitiescanplacegreaterpressuresontheenvironmentthanlessintensiveagriculturalusessuchascroppingandgrazing.Inparticular,irrigatedcropscanplacegreaterpressuresonsurfaceandgroundwaterresourcesduetohigherwaterdemand.

ThedrainageofirrigationwaterfromthedairypasturesalongthelowerRiverMurraybetweenMannumandWellington,hasbeencauseforconcernoveranumberofyears,particularlyintermsoftheimplicationsfortheriver’swaterquality.MonitoringbytheEnvironmentProtectionAuthority(EPA)indicateslevelsoffaecalbacteriaexceednationalguidelinesfordrinkingwaterandrecreationaluseatTailemBend,duelargelytopollutionfromirrigateddairypastures.

Amajorprogramtorehabilitate4,000hectaresoflowerMurraydairypastureswasannouncedbythestategovernmentin2003andwillbecompletedbyDecember2008.TheLowerMurrayReclaimedIrrigationAreaRestructuringandRehabilitationProgramseekstosignificantly reduce the pollutant load returnedtotheriverthrough:

• electronicwatermeteringandreha-bilitationofallintakesfromtherivertoimprove water efficiency

Land Use

134 S TAT E O F T H E E N V I R O N M E N T R E P O RT 2 0 0 8

LAND

• implementationofrunoffreusesystemsonallfarmstoeliminatesurfaceirrigationrunofftotheriverandtoretainthepollutedprimaryflush of the first 5 ML per 100 Ha of irrigatedareaofstormwaterrunoff

• fencingchannelsandleveebankstopreventstockaccess

• regradingofcattlelanewaystoreducerunofftodrainagechannels

• managementimprovementstofurtherreducepollutantdischargesthroughindividualon-farmEnviron-mentalImprovementManagementPlansincludingbettertimingforfertiliserapplications

• purchasingwaterentitlementsfromdairyfarmers

• purchasingoflandfromdairyfarmersandtakingitoutofproduction.

Theincreasingestablishmentofvinesacross South Australia was identified in previousState of the Environment Reports asbeinglargelydrivenbyabuoyantwineindustry.SouthAustraliaproduced44.4%ofthegrossvalueofAustralia’svineproductionin2005(ABS,2007a).Thisequatedto74,620Ha,anincreaseof12.3%since2003(www.phylloxera.com.au).

Intensive uses

Intensivelandusesoccupy1.7%ofSouthAustralianland,anincreaseof21.4%over 2003 figures. These uses involve high levelsofinterferencewiththenaturalenvironmentandaregenerallyassociatedwithhumansettlement.Theyincludeurbanandruralresidentialdevelopment,mining,transportandcommunication,manufacturingandwastetreatmentanddisposal.

SouthAustraliaisahighlyurbanisedstate,with73%ofthepopulationlivinginAdelaide(ABS,2007b).Bycomparison,only45%ofQueenslandersliveinBrisbanebecauseofthemoreregionalisednatureofsettlementinthatstate.

TheAdelaidemetropolitanareacontinuestospreadintotheMountLoftyRanges.

Thisexpansionisgenerallybutnotalways,intoareasthatwerepreviouslyusedforgrazing,croppingorhorticulture.Adverseeffectsfromthechangesincludethelossofbiodiversity,diminishedwaterqualityandlossofprimeagriculturalland.

Residentiallivingisalsoincreasingsignificantly along the South Australian

coastlineasagreaternumberofpeopleseekamorerelaxinglifestyleincloserproximitytoabeach(refertochapterCoastal and Marine Resources andUrban Form and Population forfurtherinformation).

MiningoccupiesonlyaverysmallproportionofSouthAustralia.Majorproductsincludecopper,gold,iron,gypsum,granite,oil,gas,coal,uraniumandopals.Ofthesenon-renewableresources,copperhasthehighestvalueofanyminedcommodityinSouthAustraliaat$1.36billionin200506,(ABS,2007c).

Theimpactofminingontheenvironment has been significantly reducedinrecentyears(Hamblin,2001).Nevertheless,theexpectedsubstantialgrowthintheminingsectorcould have significant negative environmentalimplicationsintermsofwateruse,infrastructurecosts,biodiversity,increaseddemandonthestate’senergysuppliesandpressureonemissionsreductiontargetsunlesswellmanaged(seealsotheNative Vegetation and Energychapters).

PRESSURE INDICATOR: Land use change in South Australia

Broadlandusecategoriesacrossthestatetendtoremainrelativelystable.However,distinctivetrendsandsmall-scalechangesareevidentinsomeregionsandforsomeparticulartypesoflanduse.

Thecurrenttrendawayfromrelativelylowintensityagriculturallandusessuchasgrazing,towardsmoreintensiveonessuchasviticulture,horticultureandresidentialdevelopment,meansthattherearenowgreaterpressuresbeingplacedontheenvironmentinsomeregions.Thisisincreasingpressureonwaterresources,highlyproductiveagriculturallandandnativevegetationinthoseregions.

LandusechangeinSouthAustraliathathasassociatedissuesforwhichthereisdataavailableinclude:

• increasingresidentialdevelopmentintheMountLoftyRanges

• theincreaseinareaplantedtograpevines

• impactofplantationforestlanduseonwateryieldfromcatchments

• anincreaseincoastaldevelopment.

Olive grove. Photo: Steven Mudge

‘Landusechange

fromagricultural

toresidentialare

particularlymarked

inthenorthernand

Fleurieusectionsofthe

AdelaideandMount

LoftyRangesregion.’

135S TAT E O F T H E E N V I R O N M E N T R E P O RT 2 0 0 8

Increasing residential development in the Mount Lofty Ranges

PreviousSouthAustralianStateoftheEnvironmentReportsin1993,1998and2003,havehighlightedtheexpansionofAdelaideintotheMountLoftyRangesasamajorpressureonruralandsemi-rurallandusesintheregion.Thisissuecontinuestocauseconcernin2008.

Analysisoflanduseintheregionin1993and2003showsthatduringthisperiodtherewasa128.3%increaseinruralresidentiallivingfrom9,029Hain1993to20,565Hain2003.Duringthattimetherewasan8.4%declineintheareaoccupiedbydrylandandirrigatedcropping.

TheEPAhasexpressedconcernabouttheenvironmentalimpactofincreasinghousingdevelopmentsintheMountLoftyRanges,particularlyintheMountLoftyRangesWatershed.

The EPA’s Watershed Protection Office haspreviouslyestimatedthatifallvacantallotmentsintheMountLoftyRangesweredevelopedtherewouldbea25%increaseinthenumberofhousesinthisenvironmentallysensitiveregion.Thereareconcernsthatinsensitivehousingdevelopmentswillleadtothefurtherlossandfragmentationofnativevegetation,exacerbation of bushfire risks to housingandhumanlife,andincreasingdegradationofwaterquality.

AdevelopmentriskassessmentstudyconductedbytheEPAinearly2003centredontheCrafers,Stirling,AldgateandBridgewaterareafoundthat22%ofthe350vacantallotmentsinspectedshouldnotbedevelopedforhousingdue to significant site constraints. These includedlandclosetowatercourses,coveredinnativevegetationandproneto flooding and/or water logging.

TheAdelaideandMountLoftyRangesNaturalResourcesManagementBoard’sStateoftheRegionReportidentifies pressures associated with urbandevelopmentatthenorthernandsouthernedgesofmetropolitanAdelaideandontheFleurieuPeninsula,aswellasintensification of agriculture (Adelaide andMountLoftyRangesNaturalResourcesManagementBoard,2008).

LandusechangefromagriculturaltoresidentialareparticularlymarkedinthenorthernandFleurieusectionsoftheAdelaideandMountLoftyRangesregion.Basedoncurrentdataregardingthenumberoflandtitlesoutsidethe

urbanandtownshipboundaries,thereispotentialforafurther40%increaseon2005dwellingnumberseffectivelydoubling1985levels.

Increasesinresidentialandruralresidentialusesandincreasesinmoreintenselandusessuchashorticulture(comparedtograzing)havethepotentialtocreateadditionallanduseinterfaceissuesandapplypressuretoprimeagriculturalandhorticulturalland(AdelaideandMountLoftyRangesNaturalResourcesManagementBoard,2008).

SimilarencroachmentisoccurringaroundregionaltownsintheupperYorkePeninsula,Riverland,andMtGambier,thatmayadverselyimpactonlandandinfrastructurethatisimportantforcurrentandfutureagriculturalactivity.Currently,DevelopmentPlansdonotdifferentiateruralareasonthebasisoftheirimportanceforprimaryindustryandmarket forces do not reflect the true cost oflossofproductiveagriculturalland.

The region has significant advantages andopportunitiesforsomeagriculturalenterprisesincludingsomeaccesstoreclaimedwater,proximitytolabour,marketsandfreightfacilitiesandforsomehorticulturalcrops,favourableclimaticandsoilconditionsnotfoundelsewhereinSouthAustralia.Thefurtherlossoftheseareastoresidentialdevelopmentpotentiallyrepresentsthelossofavaluableresourcetothestate.

Irrigated agriculture and plantations

One of the most significant changes in landuseoverthepastdecadehasbeenanincreaseintheareaoccupiedbyvineyards;oftenwithanassociatedlossofgrazingorcroppingland.IntheRiverlandregionvinesarereplacingcitrusandstonefruitcrops.

ThetotalareaofvineyardsinSouthAustraliaincreasedby150%between1994and2002,from26,584Hato66,456Ha,andbyafurther12.1%,to74,620Habetween2002and2005(www.phylloxera.com.au).

Figure4.1showsthetotalareaplantedtovineyardsinthestate’smajorestablishedgrapegrowingdistrictsbefore2003andin2005.Allareashaveshowngrowth.TheMountLoftyRangeshasshownthehighestrateofgrowth,withanincreaseof10.4%intheareaplantedsince2003.

Whereviticultureisreplacingdrylandfarmingactivities,thisdevelopment

Pre-2003

2005

0

5

10

15

20

25

Tota

l are

a p

lan

ted

to

vin

eya

rds

(Ha

)

Mo

un

t Lo

fty

Baro

ssa

Fle

urie

u

Low

er

Mu

rra

y

Lim

est

on

eC

oa

st

Region

Figure 4.1: Total area planted to vineyards

Land Use

Source:DWLBC

136 S TAT E O F T H E E N V I R O N M E N T R E P O RT 2 0 0 8

LAND

mayplacestrongdemandsonwaterinareasthatarealreadydevelopedtotheirsustainablelimit.TheseincludeareasoftheMountLoftyRangesandtheClareandBarossaValleys.Thefurtherdevelopmentofcropsrequiringirrigationwilllikelyrequireinvestmentinotherwatersourcessuchasreclaimedwater,asmostexistingaccessiblewaterresourcesarefullyprescribedandbeingmanagedwithinsustainablelimitsundertheNRM Act (2004).

Production from dryland agriculture, horticulture and plantations

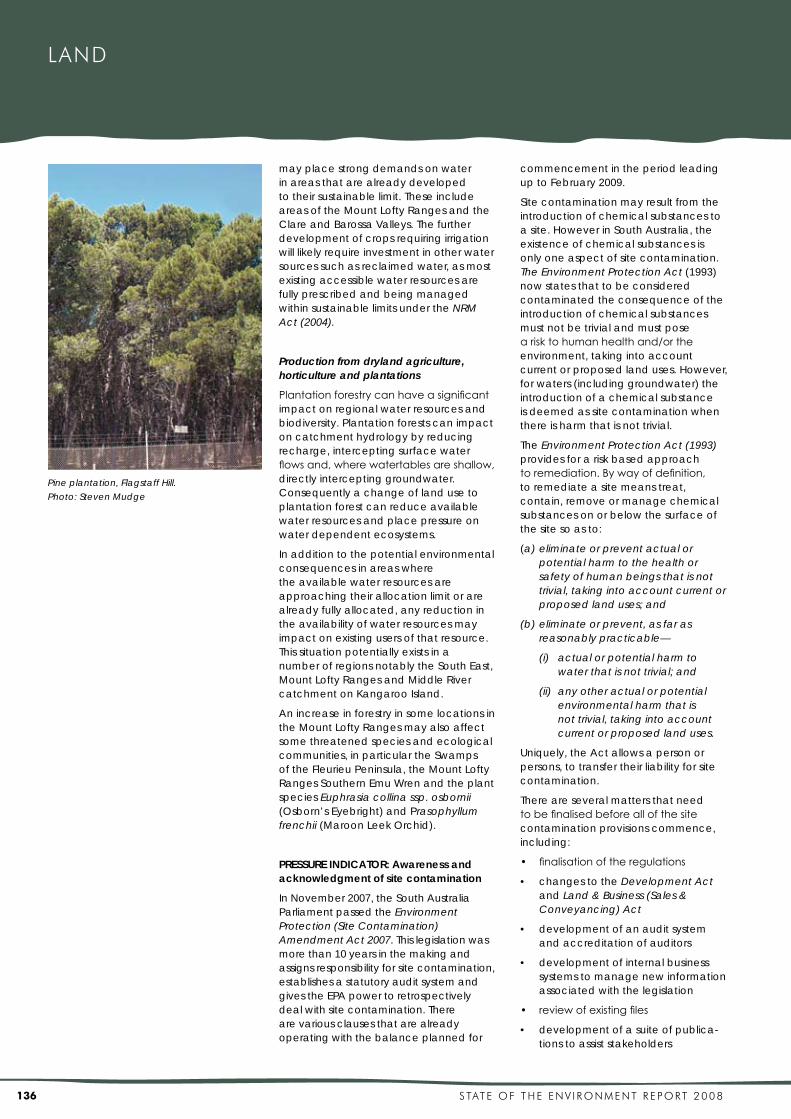
Plantation forestry can have a significant impactonregionalwaterresourcesandbiodiversity.Plantationforestscanimpactoncatchmenthydrologybyreducingrecharge,interceptingsurfacewaterflows and, where watertables are shallow, directlyinterceptinggroundwater.Consequentlyachangeoflandusetoplantationforestcanreduceavailablewaterresourcesandplacepressureonwaterdependentecosystems.

Inadditiontothepotentialenvironmentalconsequencesinareaswheretheavailablewaterresourcesareapproachingtheirallocationlimitorarealreadyfullyallocated,anyreductionintheavailabilityofwaterresourcesmayimpactonexistingusersofthatresource.ThissituationpotentiallyexistsinanumberofregionsnotablytheSouthEast,MountLoftyRangesandMiddleRivercatchmentonKangarooIsland.

AnincreaseinforestryinsomelocationsintheMountLoftyRangesmayalsoaffectsomethreatenedspeciesandecologicalcommunities,inparticulartheSwampsoftheFleurieuPeninsula,theMountLoftyRangesSouthernEmuWrenandtheplantspeciesEuphrasia collina ssp. osbornii (Osborn’sEyebright)andPrasophyllum frenchii(MaroonLeekOrchid).

PRESSURE INDICATOR: Awareness and acknowledgment of site contamination

InNovember2007,theSouthAustraliaParliamentpassedthe Environment Protection (Site Contamination) Amendment Act 2007.Thislegislationwasmorethan10yearsinthemakingandassignsresponsibilityforsitecontamination,establishesastatutoryauditsystemandgivestheEPApowertoretrospectivelydealwithsitecontamination.Therearevariousclausesthatarealreadyoperatingwiththebalanceplannedfor

commencementintheperiodleadinguptoFebruary2009.

Sitecontaminationmayresultfromtheintroductionofchemicalsubstancestoasite.HoweverinSouthAustralia,theexistenceofchemicalsubstancesisonlyoneaspectofsitecontamination.The Environment Protection Act(1993)nowstatesthattobeconsideredcontaminatedtheconsequenceoftheintroductionofchemicalsubstancesmustnotbetrivialandmustposea risk to human health and/or the environment,takingintoaccountcurrentorproposedlanduses.However,forwaters(includinggroundwater)theintroductionofachemicalsubstanceisdeemedassitecontaminationwhenthereisharmthatisnottrivial.

TheEnvironment Protection Act (1993) providesforariskbasedapproachto remediation. By way of definition, toremediateasitemeanstreat,contain,removeormanagechemicalsubstancesonorbelowthesurfaceofthesitesoasto:

(a) eliminate or prevent actual or potential harm to the health or safety of human beings that is not trivial, taking into account current or proposed land uses; and

(b) eliminate or prevent, as far as reasonably practicable—

(i) actual or potential harm to water that is not trivial; and

(ii) any other actual or potential environmental harm that is not trivial, taking into account current or proposed land uses.

Uniquely,theActallowsapersonorpersons,totransfertheirliabilityforsitecontamination.

Thereareseveralmattersthatneedto be finalised before all of the site contaminationprovisionscommence,including:

• finalisation of the regulations

• changestothe Development Act and Land & Business (Sales & Conveyancing) Act

• developmentofanauditsystemandaccreditationofauditors

• developmentofinternalbusinesssystemstomanagenewinformationassociatedwiththelegislation

• review of existing files

• developmentofasuiteofpublica-tionstoassiststakeholders

Pine plantation, Flagstaff Hill.

Photo: Steven Mudge

137S TAT E O F T H E E N V I R O N M E N T R E P O RT 2 0 0 8

• developmentanddeliveryofeducationprogramsforstake-holders.

TheNationalEnvironmentProtection(AssessmentofSiteContamination)Measure(1999)isbeingreviewedatthistimeandtheSouthAustralianEPAisacontributor.

Contaminationisalsorecognisedasbeinganissueofurbanconsolidationduetothetransformationofolder,inner-citysitesintoresidentialareas.Thesesitesweretypicallycontaminatedbypreviousindustrialusessuchasfoundriesandtanneries.

SensitivelandundertheEnvironment Protection Act (1993)nowincludesresidential,child-carecentres,pre-schoolsandprimaryschools.ItisintendedthattheDevelopmentActwillbeamendedsothatifasensitivelanduseisproposedforasitewheretherehasbeenacontaminatingactivity,asiteauditwillbemandatory.

ThenumberofsitesaffectedbycontaminationinSouthAustraliaislargelyunknown.However,sincepublicationoftheState of the Environment Report 1998,therehavebeen significant advances in our knowledgeandunderstandingofsitecontamination.Anumberofnationaland state initiatives have influenced themannerinwhichtheEPArecordsandreportsonissuesassociatedwiththecontaminationoflandandgroundwater.

Thetypesofactivitiesthatcanleadtositecontaminationincludeindustrialandcommerciallanduses;thedisposaloraccidentalspillageofwasteandchemicalsubstances;leakageduringplantoperation,storageortransportation;thespreadingofsewagesludge;andtheuseofpesticides.Examples of specific activities that can causesitecontaminationinclude:

• gasworks

• batterymanufacture,storageandrecycling

• drycleaning

• oilproduction,treatmentandstorage

• foundries

• railwayyards

• servicestations

• smelting and refining

• tanningandassociatedtrades

• scrapyards

• fertilisermanufacturingplants

• powerstations.

TheEPAisprioritisingknownsitesaccordingtoriskandwilltakeactiononariskbasistoeffectivelymanagesitecontaminationacrossthestate.

Inaddition,theEPAhascommenceddevelopmentofanUnderground Storage System Code of Practice tomanagehighriskactivities.TherelevantindustrysectorswillbethefocusoftheEPAstrategic(sitecontamination)educationcampaignintendedforlate2008.

Pesticide use

Pesticidescollectivelyincludechemicalscommonlyreferredtoasinsecticides,herbicides,fungicidesandgrowthpromotants.

Theuseofpesticideshasimprovedcropyields,increasedworldfoodsecurity,andassistedwiththecontrolofdiseaseglobally. These benefits are not without risks.Pesticidesbynaturehavethecapacitytonegativelyimpacttheenvironmentifusedincorrectlyandinsomecases,havethepotentialtoadverselyimpacthumanhealth.

Bothanimalsandhumanscanbeaffectedbyeatingfoodcontaminatedbypesticides,drinkingcontaminatedwater,breathingincontaminantsorabsorbingcontaminantsthroughtheskin.Thepublic’sperceptionoftheserisksinassociationwithhighergeneralenvironmentalawarenessinrecentyears,haveseengreaterlocalinterestinorganicfoodsandotherproducts(RuralIndustriesResearchandDevelopmentCorporation,2006).Thereisalsoagreaterawarenessinfoodsupplyindustriesoftheincreasinglycompetitiveandlucrativemarketforenvironmentallyfriendlyandsustainableproducethatiscleanandgreen.

Duetothemethodoftheirapplication,pesticideshavethepotentialtocausewidespreadcontaminationofsoilandwateratadiffuselevel.Broadspectrumchemicalsandthosewithanylongtermresidualeffectshavebeenprogressivelyeliminatedfromagriculturalsystems,howeverchemicalsofthisnatureremaininsoilswheretheyhavebeenusedforspotandbroadacrepestcontrol(DAFF,2005).

Theaccumulationofherbicideresiduesinsoilmayimpactnativevegetationandcrops,enhanceweedresistance,affect

Market gardening within metropolitan Adelaide

region. Photo: Steven Mudge

Land Use

138 S TAT E O F T H E E N V I R O N M E N T R E P O RT 2 0 0 8

LAND

soil microorganisms and nitrogen fixation, increasetheincidenceandseverityofrootdiseasesandinterferewiththeuptakeofnutrientsbyplants.

TheCommonwealthDepartmentofAgriculture,FisheriesandForestrythroughanumberofprogramsmanagesthepresenceoftheseresiduesandtheirimpactonfoodsatanationallevel.TheseprogramsincludetheNationalHormonalGrowthPromotant(HGP)Program,theNationalAntibacterialResidueMinimisation(NARM)ProgramandtheNationalOrganochlorineResidueManagement(NORM)Program.AswellasregisteringsitesacrossAustraliathatareknowntobecontaminated,theprogramsmanageandrestrictaccessoflivestocktothem.Farmersnowuseso-calledsoftchemicalsthatareactiveonthe specifically targeted species only at orimmediatelyafter,thetimeofapplication.

Australia’sandSouthAustralia’sverylowlevelsofpesticideusagearereflected in the levels of pesticides detectedinfoodsamples.TheNationalResidueSurveycoordinatesannualmonitoringofchemicalresidues,consistentlydemonstratingthattheyareonlydetectedatverylowlevelsintheAustraliandiet.The2003SoEReportshowedthatof274,000foodanalysesdoneintheNationalResidueSurveyduring2000–01,therewas99.97%complianceingrainandhorticulture,99.98% in meat and 100% in fish samples intermsofanypesticidesdetectedbeingbelowallowableMaximumResidueLimits(AATSE,2002).Inthe2006-07NationalResidueSurveytheresultsweresimilarlycompliant,with99.64%complianceingrain,98.74%inhorticulture,99.81%inmeat and 99.03% in fish samples (DAFF,2008).

ThereisalackofcomprehensivedataonpesticideuseinSouthAustraliaandthelevelofcontaminationofwaterandsoilresourcesthroughpesticideapplicationisunknown.

The Development Act 1993,DevelopmentRegulations1993,Planning Strategy and Council Development Plansprovidethelegalandstrategicframeworkthatcontrolslanduseacrossthestate.

ThefourvolumesofthePlanning Strategy – Planning Strategy for Regional South Australia, Planning Strategy for Metropolitan Adelaide, Planning Strategy for the Outer Metropolitan Adelaide Region and Yorke Peninsula Regional Land Use Framework – wereupdatedinDecember2007.Thesedocumentsacknowledgetheimportanceofintegratingnaturalresourcemanagementwithlanduseplanningandtheconsiderationoflandcapabilityintheplanningandassessmentprocess.Thestrategyaimstoimprovetheintegrationofenvironmentalissueswithplanningpolicyandsustainabilityprinciples.

ThePlanning Strategy for Metropolitan Adelaide introducedtheconceptofanurbanboundaryformetropolitanAdelaide(GovernmentofSouthAustralia,2007).ThePlanning Strategy for the Outer Metropolitan Adelaide RegionalsocontainsurbancontainmentboundariesforruraltownsintheBarossa,SouthernFleurieuandCentralAdelaideHills(GovernmentofSouthAustralia,2007).Thepurposeoftheboundariesisto:

• define the physical extent of urban growth

• protectviableagriculturalland

• provideforopenspacesandtheHillsFaceZone

• clearlydivideresidentiallandfromrurallandinordertopreventinherentconflicts

• promotemorecompacturbanforms

• maximisevaluefrominfrastructureinurbanareas

• protectthewatershedsoftheMountLofty Ranges from further intensification ofurbanareas.

TheYorkePeninsulaRegionalLandUseFrameworkwasadoptedasavolumeofthePlanningStrategyon13December2007.TheFrameworkwillguidefuturedevelopmentacrosstheYorkePeninsulaand Wakefield Plains Region and includes specific objectives and strategies to protect theregion’snaturalresources(GovernmentofSouthAustralia,2007).

What are we doing about i t?

Crop. Pt Turton. Photo: Monica Moss.

139S TAT E O F T H E E N V I R O N M E N T R E P O RT 2 0 0 8

InJuly2003theDevelopmentRegulationswereamendedtorequirethereferraltotheEPAofallnewhousingdevelopmentapplicationsincludingthoseforreplacementofexistinghouseswithintheMountLoftyRangesWatershed.TheEPAhasthepowertodirecttheCouncilorDevelopmentAssessmentCommissiontoeitherrefusethedevelopmentapplicationorimposeconditionsonitsapproval.Thecontinuingdevelopmentofhousingonenvironmentallysensitivesitesinthewatershedpromptedthisamendment. In 2005, the EPA defined threeprotectionareaswithintheMountLoftyRangesWatershedbasedondevelopmentcontrolobjectives.

Developmentcontrolswithineachoftheareasarebasedonriskstodrinkingwatersuppliesandnationalbestpracticewatershedmanagement.Theapproachseeks to find a balance between best practicewatershedprotectionanddevelopmentthatisachievedthrougharisk-basedplanninghierarchy,wherelanduseanddevelopmentarematchedtotheriskposedtothedrinkingwatersupply.

ThesubdivisionoftheWatershedintothreewaterprotectionareashasbeenincorporatedasapolicyintoSection3.1oftheAugust2006Planning Strategy for the Outer Metropolitan Adelaide Region (PlanningSA2006).

TheintroductionoftheNatural Resources Management Act 2004introducedanintegratedframeworktomanageimpactoflandusechangeonSouthAustralia’snaturalresources.ItprovidesatransparentnaturalresourcesmanagementsystemtoensureSouthAustralia’snaturalresourcesareusedsustainablyandintegratesanumberofpreviouslyseparateadministrativearrangementsintoonesystem.Italsobroughttogetherthepeopleandexpertiseneededtodeliverintegratedapproaches

TheActalsoestablishedlinkagesbetweennaturalresourcesandwaterallocationplansdevelopedunderitsauspicesandplanningpolicyfromtheDevelopmentAct.

Eightregionallybased,communitydrivenNaturalResourcesManagement(NRM)BoardsandaNaturalResourcesManagementCouncilwereestablishedundertheAct.

TheCouncilisSouthAustralia’speakadvisorybodyfornaturalresources.UndertheAct,theCouncilandregional

NRMBoardsarerequiredtodevelopplansknowncollectivelyastheStateNRMPlanandRegionalNRMPlans.

TheStateNRMPlanisSouthAustralia’sbigpictureplanfordealingwiththreatstoournaturalresourcesandopportunitiesforthelong-termsustainableuseofthoseresources.Itisaplantoguideandcoordinategovernment,industryandcommunityintheuse,managementandprotectionofthestate’snaturalresources.

RegionalNRMPlanssetoutthelong-termvisionfortheregionandguidetheactionsofregionalNRMBoardsandothers over three to five year timeframes.

ThegovernmentisundertakingareviewoftheadministrationoftheNative Vegetation Act 1991 anditsRegulations,tobetterintegratethemanagementofnaturalresourcesincludingnativevegetation,byimprovinglegislation,administration,communication,andregionalinvolvement.

AregulationtodeclarecommercialforestryawateraffectingactivityintheSouthEastcameintoeffectinJune2004.

On31July2007,theMinisterforEnvironmentandConservationannouncedthatthedirectextractionof water from shallow water tables (≤ 6m)byplantationforestryintheLowerSouthEastwouldalsoberegulatedasawateraffectingactivity.Theimpactofextractionbynewplantationdevelopmentsistobeoffsetwithanappropriatelicensedwaterallocation.Forfurtherinformationrefertothe Impacts of Commercial Forestrydocumentat:www.dwlbc.sa.gov.au/water/1overview/comercial_forestry/index.html

Land Use

References

AdelaideandMountLoftyRangesNRMBoard(2008).Creating a Sustainable Future – An Integrated Natural Resources Management Plan for the Adelaide and Mount Lofty Ranges Region(VolumeA–StateoftheRegionReport),www.amlrnrm.sa.gov.au/Portals/1/Our_Plans/Docs/vol_a_final_june08.pdf

Pesticide use in Australia,AustralianAcademyofTechnologicalSciencesandEngineering(AATSE)(2002).AATSE,Victoria.www.atse.org.au

South Australia at a glance,(2007a).AustralianBureauofStatisticsCatalogueNo.1306.4 www.abs.gov.au

140 S TAT E O F T H E E N V I R O N M E N T R E P O RT 2 0 0 8

LAND

Further information

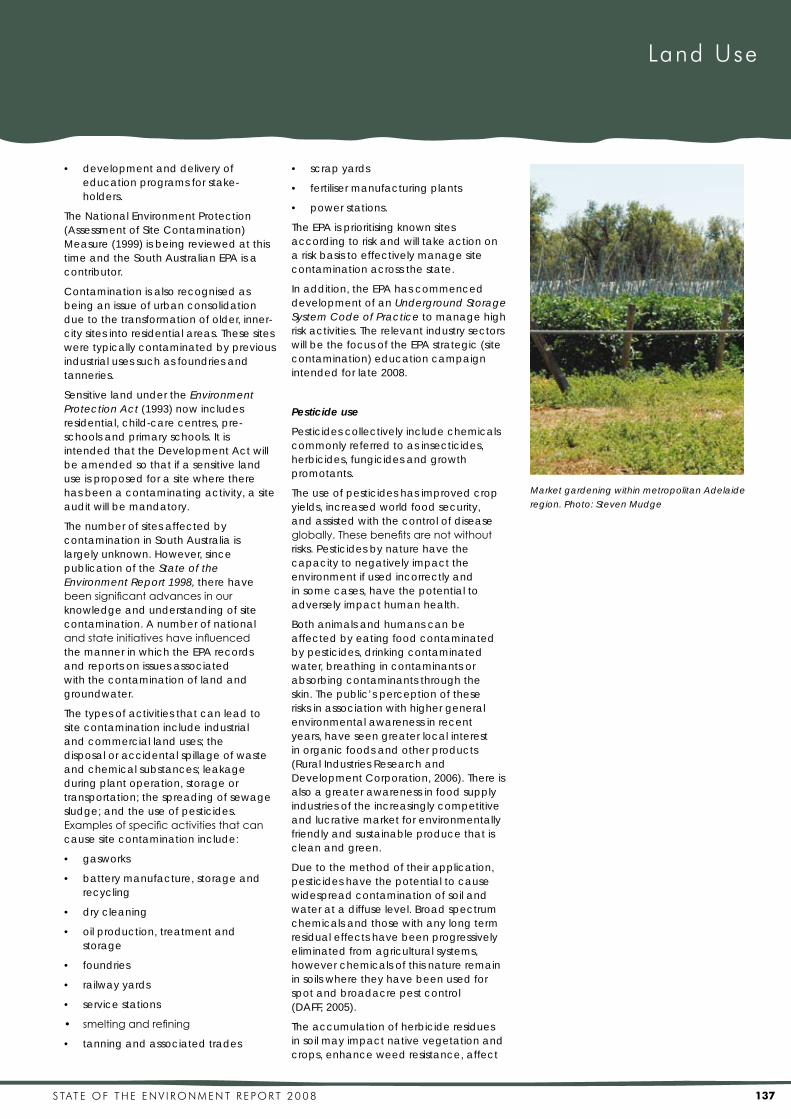
Market gardening, Northern Adelaide.

Photo: Monica Moss

What more should we be doing?TheEnvironmentProtectionAuthorityrecommendsthefollowing:

R4.1 Preservesuitablelandforeconomicagriculturalproductionandbiodiver-sity conservation, recognising that land supply is finite and the demand for housingisgrowing.

R4.2 Ensurethatanypotentialexpansionofcommercialtreeplantingdoesnotcompromisenaturalresources,includinglocalbiodiversity,andisaccountedforwithinwaterallocationplanning.

Census of Population and Housing 2006, (2007b).AustralianBureauofStatisticswww.abs.gov.au

Mining Operations,Australia2001-02to2005-06,(2007c).AustralianBureauofStatisticsCatalogueNo.8415.0,www.abs.gov.au

Independent Report to the Commonwealth Minister for the Environment and Heritage(2001).AustralianStateoftheEnvironmentCommittee(ASOEC).AustraliaStateoftheEnvironment2001.CSIROPublishingonbehalfoftheDepartmentoftheEnvironmentandHeritage,Canberra.

Department of Agriculture, Fisheries and Forestry (2008),NationalResidueSurvey2006-2007www.daff.gov.au

Department of Climate Change(2008),CarbonPollutionReductionScheme–GreenPaper. www.greenhouse.gov.au/greenpaper

Planning Strategy for Metropolitan Adelaide(2007),GovernmentofSouthAustralia,www.planning.sa.gov.au

Planning Strategy for the Outer Metropolitan Adelaide Region(2007),GovernmentofSouthAustraliawww.planning.sa.gov.au

Yorke Peninsula Regional Land Use Framework(2007),GovernmentofSouthAustraliawww.planning.sa.gov.au

Hamblin,A(2001).Land, Australian State of the Environment Report 2001 (Theme

Report),CSIROPublishingonbehalfoftheDepartmentofEnvironmentandHeritage,Canberra.

State Natural Resources Management Plan(2006),NaturalResourcesManagementCouncilwww.dwlbc.sa.gov.au/assets/files/NRM_StateNRMPlan2006.pdf

Organic Industry Research and Development Plan 2006-2011(2006),RuralIndustriesResearchandDevelopmentCorporationPublicationNumber 06/103, Australian Government, Canberra.

Department for Water Land and Biodiversity Conservation www.dwlbc.sa.gov.au/land/index.html

Environment Protection Authority www.epa.sa.gov.au

Phylloxera and Grape Industry Board of South Australia www.phylloxera.org.au/statistics

Planning SA www.planning.sa.gov.au

ForfurtherdetailonSouthAustralia’sStrategic Planvisitwww.stateplan.sa.gov.au

R4.1 R4.2

Growing Prosperity T1.22

Improving Wellbeing

Attaining Sustainability T3.1, T3.7 T3.1, T3.2, T3.3, T3.9

Fostering Creativity and Innovation

Building Communities T5.9

Expanding Opportunities

Alignment of Recommendations with South Australia’s Strategic Plan targets

141S TAT E O F T H E E N V I R O N M E N T R E P O RT 2 0 0 8

Trends

Key Facts

Goals

Soi l Eros ion and Acidi ty

• RatesofsoillosstowaterandwinderosioninSouthAustralia:SLOWLYDECLININGbutunsustainablelevelsofsoillossstilloccurduringextremeweatherevents.

• Theprotectionofagriculturalcroppinglandfromerosion:SLOWLY BUT STEADILY INCREASING.

• Extentofacidsoilsandratesofsoil acidification in South Australia: INCREASINGandwillcontinuetoincreaseunlesstheremedialactionissignificantly increased.

T3.3 Soil protection:By2014,achievea20%increaseinSouthAustralia’sagriculturalcroppinglandthatisadequatelyprotectedfromerosion.(baselineyearis2003)

South Australia’s Strategic Plan 2007

ErosionandacidityarenaturalprocessesintheAustralianlandscape.However,sinceEuropeansettlementlanduseandmanagementpracticeshaveincreasedtheiroccurrence.

Thereareapproximately10.4millionhectaresoflandusedforagricultureinSouthAustralia.Mosthasbeenclearedofitsnativevegetationandovertimealmost all has been significantly changed bylandmanagementpracticessuchasgrazing,tillage,theintroductionofexoticflora and fauna and the application of fertilisers,herbicidesandpesticides.

Soil erosion and soil acidification are two of the most significant problems thathaveresultedfromagriculturallandmanagementpractices.Without

Soil Erosion and Acidity and a sustainable South Australia

intervention,theycanpermanentlyreducetheproductivecapacityofagriculturallandsandhaveadversesocial,economicandenvironmentalimpacts.

Erosionoccurswhensoilparticlesarewashedorblownfromonesitetoanotherandresultsfromacomplexinteractionofclimaticconditions,soiltypeandtopography,andisexacerbatedbylandmanagementpractices.

Whileerosiondoesoccurinundisturbednaturalenvironments,soilisusuallylostfromagriculturallandataratemanytimeshigherthanoccursinnaturalsystems.Largescaleerosionoccurswhenextremerainfallorwindsactonloosesoilthatisinadequatelyprotectedbystandingvegetationorplantresidues.Climatechangeislikelytoincreasesoilerosiongiventhatitisexpectedtodeliveradryerclimatewithanincreaseofsevereweatherevents.Furtherresearchintoadaptiveresponsestoclimatechangeisnecessary.Map4.1detailsprojectedchangestowinderosionpotentialunderreducedrainfallconditions,demonstratingthelikelymanagementchallengesahead.

Manysoilsarenaturallyacidicandincreasing acidification is a natural processaffectingsusceptiblesoilswhererainfallishighenoughtoleachnitratesandbase-formingnutrientcations(calcium,magnesium,potassiumandsodium).Agricultureincreasestherate of acidification through the use ofnitrogenfertilisers,growinglegumeplants(especiallypasturespecies),theharvestingofagriculturalproductsandleachingofbaseformingcationsfromthesoil.Shallowrootedannualspeciesexacerbatetheprocessbecausetheyareunabletoretrieveandrecyclenitrogenandleachedcationsfromdepth.Strongaciditycanpermanentlyreducethefertilityofclaymineralsandifitdevelopstothepointwheresubsoilsareaffected,isvery difficult to treat.

Stronglyacidsoilsarelikelytocausenutrient deficiencies and/or toxicities that canseverelyreduceplantproduction.Inturn,poorplantvigourislikelytocontributetorisesinthewatertableanddrylandsalinity,aswellassoilerosion.

The rates and extent of soil acidification continuetoincreaseinthemostproductiveagriculturalareas,whileratesofsoilerosionhavedeclinedsomewhat,althoughnotnearlytoalevelthatwillensurelongtermsustainability.

• Thecriticalmanagementpracticesthataffecttheriskofsoilerosionare:

- Theoccurrence,intensityandtimingoftillageoperations

- Thequantityandnatureofsurfacecover.

• Thetimingoftillageoperationsisofutmostimportancebecausethelongerasoilisleftinaloose,barestatethehighertheprobabilityofacoincidenterosivewindorrainfallevent.

• Therateoflimeapplicationinmostagricultural regions is still signifi-cantlylowerthanthatrequiredtobalance the annual soil acidifica-tionrate,exceptfortheSouthEast.

No tillage sowing involves sowing the

seed in a narrow slot in the soil to minimise

soil disturbance and maximise residue

protection on the soil surface. Photo:

DWLBC

Soi l Eros ion and Acidi ty

142 S TAT E O F T H E E N V I R O N M E N T R E P O RT 2 0 0 8

LAND

Productivity decline

Increasedaciditycanleadtopoorplantgrowthandreducedwateruseandproductivityasaresultofnutrientdeficiencies or imbalances and/or inducedaluminiumormanganesetoxicity.

Organicmatterandmostnutrientscriticalforplantgrowthareusuallyconcentratedinthetopsoil(theupper10cmorsoofthe soil profile). Subsoils (those below 10cm)aregenerallyinfertileandcanoftenbehostiletorootgrowthduetonaturallyhighpH,sodiumorsalinity.Anylossoftopsoilbyerosionorotherdegradingprocesscancauselarge

scaleandverylong-termdeclinesinproductivity.

In2002theDepartmentofWater,LandandBiodiversityConservation(DWLBC)estimatedtheon-sitecostsofwinderosionintheagriculturalareasofSouthAustraliatobearound$8millionperannum.Ofthis,thecostoflostnutrientsamountedtoapproximately$6millionandlostproductivitycausedbysand-blastingofcropsaccountedfortheremainder

Soil acidification has caused a decline inproductivityinhigherrainfallareas,namelytheSouthEast,KangarooIslandandtheMountLoftyRanges.Onvery

Map 4.1: Wind erosion potentail by reduced rainfall scenarios

Sowing a crop using the direct drill

method. The adoption of improved land

management practices, particularly no-till

sowing and direct drill sowing combined

with stubble retention, has greatly increased

the protection of cropping land from soil

erosion. Photo: DWLBC

143S TAT E O F T H E E N V I R O N M E N T R E P O RT 2 0 0 8

acidicsoil,productivitycanbereducedbymorethan50%.Lowproductivityofcropsandpasturesleadsinturntoanincreaseintheamountofwaterleachingtothewatertable,contributingtodrylandsalinity.

Subsoil acidity is very difficult and expensivetotreat.Conventionalmethodssuchaslimeapplicationsatthesurface,havelittleimpactonthesubsoilduetotheirlowsolubility.

Degradation of watercourses and water resources

Watererosioncancauseoff-sitedegradationofwatercourses,wetlands,estuarineareasandthemarineenvironmentduetosiltation,turbidityandincreasednutrientlevels.Theleachingofnitrateandmetals,suchasaluminium,associated with soil acidification can causepollutionofwaterresourcesandsoposeahealthriskforbothlivestockandhumans.

Acidsulphatesoilsarenaturallyoccurringsoilsandsedimentscontaining iron sulfides that are a risk to waterbodies,vegetationandaquaticlife.Thisisbecauseoftheirpotentialtogenerateacidandreleasetoxicsubstances.

The exposure of the sulfide in these soils tooxygenbydrainageorexcavationleadstotheformationofsulphuricacid.Potentialacidsulfatesoilsoccurinlow-lyingcoastalenvironmentsaswellasinwaterloggedorlowlyinginlandareas.AcidsulfatesoilsarecoveredingreaterdepthintheRiver Murraychapter,whichdescribestheconsiderableproblemtheypose due to record low inflows to the river,andalsointheCoastal and Marine Resources chapter.

Impacts on infrastructure

Windandwatererosioncandamagebuildingsandotherinfrastructure,plantandequipmentaswellasincurthesignificant cost of removing soil from roads.Forexample,asaresultofaseverewinderosioneventintheMurrayPlainsDistrictinJune2003,sixroadswereclosedintheMidMurrayDistrictCouncilareaandafurther15requiredintensivegradingtobekeptopen.Dustfromwinderosionincreasesthecostofcleaningbuildings,airconditioningsystemsandelectricitytransformers.

Impact on rural communities

Landholderscansufferlongtermeconomiclossesduetoreducedproductivity, and/or have the additional costofrehabilitatingdegradedareas.Lossoffarmincomehasadirectimpactonlocalandstatewideeconomies.

Atmospheric pollution and human health

Winderosionduststormsresultinatmosphericpollutionandmaydisruptthewayinwhichpeoplegoabouttheirlivesinbothruralandurbanareas.Duststormscanreducevisibility,causenuisancethroughairbornedust,andalsocauseoff-siteimpactssuchasdisruptionsto aviation and road traffic incidents. Wind-blowndustreducesairqualityandisimplicatedintheoccurrenceofasthmaandassociatedhealthproblems.

ThemajorityofinformationpresentedinthisreporthasbeensourcedfromanannuallandconditionmonitoringprogramconductedbyDWLBCsince1999(McCord2004).Theprogram’ssoilerosioncomponentassessestheextenttowhichlandisprotectedoratriskfromerosion.Directmeasurementofactualsoillossistechnicallyimpractical.Theaimistoprovideaquantitativeindicatorofchangesinprotectionorriskduetomanagementpracticesoverthelong-term.

Anychangeinerosionprotectionorriskisexpectedtotranslateintoaproportionatechangeintheoverallrateofsoilloss.The soil acidification information is estimatedindirectlyusingmodelsthatincorporatesoiltype,climateandproductionsystems,andlevelsoflimeuse.BaselineinformationonacidityandothersoilandlandcharacteristicshasbeenderivedfromtheState Land and Soil Mapping Program(DWLBC,2007).

Stubble burning. Photo: DWLBC

Wheat growing in canola stubble.

Photo: DWLBC

Soi l Eros ion and Acidi ty

144 S TAT E O F T H E E N V I R O N M E N T R E P O RT 2 0 0 8

LAND

Indicators

PRESSURE INDICATORS

• Agricultural land with an inherent susceptibility to wind and water erosion

Thismeasurestheareaofclearedlandrequiringspecialmanagementmeasurestoavoidunacceptablesoilloss.

• The area of land at risk from soil acidity.

Thisindicatestheareasofclearedlandatrisk from significant soil acidification.

RESPONSE INDICATORS

• The protection of South Australia’s agricultural cropping land from erosion

Thisisexpressedastheaveragenumberofdaysperyearthatagriculturalcroppinglandisadequatelyprotectedfromerosion.

• Land and crop management practices – soil acidity

Theapplicationoflimeisthemainresponseindicatorforsoilacidity.

Mostofthe10.4millionHaoflandusedforagricultureinSouthAustraliahasaninherentsusceptibilitytosoilerosionasdeterminedbyitssoiltexture,slopeandclimaticconditionssuchasextendeddryperiodsorhighrainfallevents.

Wind erosion potential

Sandytexturedsoilsinregionswithlowrainfallandthehighlikelihoodofextendeddryspellsarethemostsusceptibletowinderosion.Approximately6.0millionHaor58%ofagriculturallandisinherentlysusceptibletowinderosionwiththemajorityofthisintheEyrePeninsula,MurrayDarlingBasin,SouthEastandNorthernandYorkeNaturalResourceManagement(NRM)regions(Table4.2).

Ofthis,2.2millionHa(21%)iscategorisedashavingamoderatetomoderatelyhighsusceptibilityduetosandysoiltypesandanelevatedtopographicposition,i.e.sandyrisesandsandhills.Althougharable

What is thecurrent s i tuat ion?

thislandrequiresspecialmanagementpracticestopreventerosion.Afurther3.6millionHaiscategorisedashavingmoderatelylowsusceptibilitytowinderosion.Whilelandinthiscategoryisstillpronetoerosionithashigherclaycontent,lowtopographicpositionormayoccurinhighrainfallareas,characteristicsthatmakeitmoreresistanttoerosion.

Water erosion potential

Approximately1.2millionHaor12%ofthestate’sclearedagriculturallandhaveamoderatetomoderatelyhighinherentsusceptibilitytowatererosion(Table4.3).Specialmanagementmeasuresareneededtoavoidunacceptablesoilloss,eventhoughthelandisarable.Thekeyfactorsthatpredisposeittowatererosionaresoiltypeandslope.

TheNorthernandYorkeNRMregionhasthegreatestproportionoflandinthiscategory,with562,000Haor45%ofthelandhavingamoderatetomoderatelyhighinherentsusceptibilitytowatererosion.Afurther1.7millionHaofclearedagriculturallandhaveamoderatelylowsusceptibilitytowatererosion,witharound1.3millionHaor80%ofthatlandlocatedintheEyrePeninsula,SAMurrayDarlingBasinandNorthernandYorkeNRMregions.

Landwithaninherentsusceptibilitytoerosionisunlikelytosufferfromerosionifthesoilisleftundisturbedandalayerofplantmatterprotectsthesurface.However,oncethesurfaceisloosenedandtheprotectiveplantcoverremoved,even low energy winds or water flows areabletoerodethesoil.Managementpracticesthatloosenthesoilalsoinevitablyresultinalossofsurfacecoverandsothecriticalmanagementpracticesaffectingerosionrisksaretheoccurrence,intensityandtimingoftillageoperationsandthequantityandnatureofsurfacecover.

Thetimingoftillageoperationsisofutmostimportancebecausethelongerasoilisleftinaloose,barestatethehighertheprobabilityofacoincidentalerosivewindorrainfallevent.

OfthetotalareaoflandusedforfarminginSouthAustralia,approximately8.1millionHa(80%)isusedforannualcroppingandpastureproductioni.e.thewheatandsheepzone.Theremaining2.1millionHaareinthestate’shighrainfallareaswherethedominantlanduseisperennialpasturewithalowriskoferosion.

Wind erosion damages fences, roads and

other infrastructure and removes organic

matter and other nutrients from the soil.

Any loss of topsoil by erosion can cause

large and very long-term declines in

productivity. Photo: DWLBC

145S TAT E O F T H E E N V I R O N M E N T R E P O RT 2 0 0 8

NRM REGION Low Moderately low Moderate to High and above TOTAL’000 Ha ’000 Ha moderately high ’000 Ha

’000 Ha

Arable Non-arable

Adelaide & Mt Lofty Ranges 343 42 9 1 395

Eyre Peninsula 307 1,698 802 32 2,839

Kangaroo Island 133 80 14 2 228

Northern & Yorke 1,385 566 217 11 2,178

SA Murray-Darling Basin 1,118 670 682 43 2,513

South East 1,069 564 469 133 2,234

TOTAL 4,355 3,619 2,192 221 10,387

Percentage 42% 35% 21% 2% 100%

Source: (DWLBC, 2007).

NRM REGION Low Moderately low Moderate to High Very High TOTAL’000 Ha ’000 Ha moderately high ’000 Ha to extreme

’000 Ha ’000 HaArable Non-arable

Adelaide & Mt Lofty Ranges 94 47 138 83 32 395

Eyre Peninsula 2,139 463 217 14 6 2,839

Kangaroo Island 109 50 58 7 6 230

Northern & Yorke 1,057 462 562 68 30 2,178

SA Murray-Darling Basin 1,784 404 211 84 31 2,513

South East 1,938 234 62 0 0 2,234

Total 7,121 1,660 1,248 256 104 10,389

Percentage 69% 16% 12% 2% 1% 100%

About5.2millionHa(64%)oflandwithinthewheatandsheepzonearesusceptibletowinderosionwhile2.4millionHa(30%)aresusceptibletowatererosion.Mostoftheseerosionrisksareduetocroppingpracticessuchastillageandstubbleburning.Aroundhalfthelandinthiszoneisbeingcroppedeachyear.

Grazingmanagementisaveryimportantcomponentofmanagingsoilerosionrisk,especiallyindryyearsanddroughts.Livestockgrazingreducesthesoil’svegetationcoversoilandcanloosenitssurface.Generallythehighestgrazingrisksoccurinlatesummerandautumnwhenfeedavailabilityandthecoverofannualcropandpastureresiduesisdeclining.

Soil Acidity

SoilacidityisrelativelywidespreadacrossSouthAustralianagriculturalland,butonasmallerscalethanmostotherstates.Acceleratedacidityduetoagriculturalactivitieshascausedadeclineinproductivity,todatemostlyaffectingunderimprovedlegumepasturesinhigherrainfallareas.However,itisnowemergingasamajorissuebecauserates of acidification have increased

significantly in parallel with increases in intensityofcroppingandproductivity.ExtensivesoilsurveydatacollectedbytheDWLBC identifies areas currently exhibiting soilacidity.Approximately1.9millionHa(20%)ofclearedagriculturallandareaffectedbysoilacidity.

Landthatissusceptibletosoilacidification includes that which is neutral oracidic.Italsohaslowclaycontentandnofreelime,togetherwitharelativelyhighrainfallandproductionlevels.Muchofthislandisalreadyshowingproductionlossestosomeextent.

TheSouthEastregionhasthelargestareaexhibiting significant soil acidity at around 647,000hectares(35%ofthestate’stotalacidicsoils).OftheotherNRMRegions,KangarooIslandandtheMtLoftyRangeshavethehighestproportionoflandaffectedbyaciditywith185,000Ha(80%)and266,000Ha(67%)respectively.Inaddition,thereare312,000HaaffectedbyacidityintheNorthernandYorkeregion,263,000haintheSAMurrayDarlingBasinand180,000ha,intheEyrePeninsulaNRM.

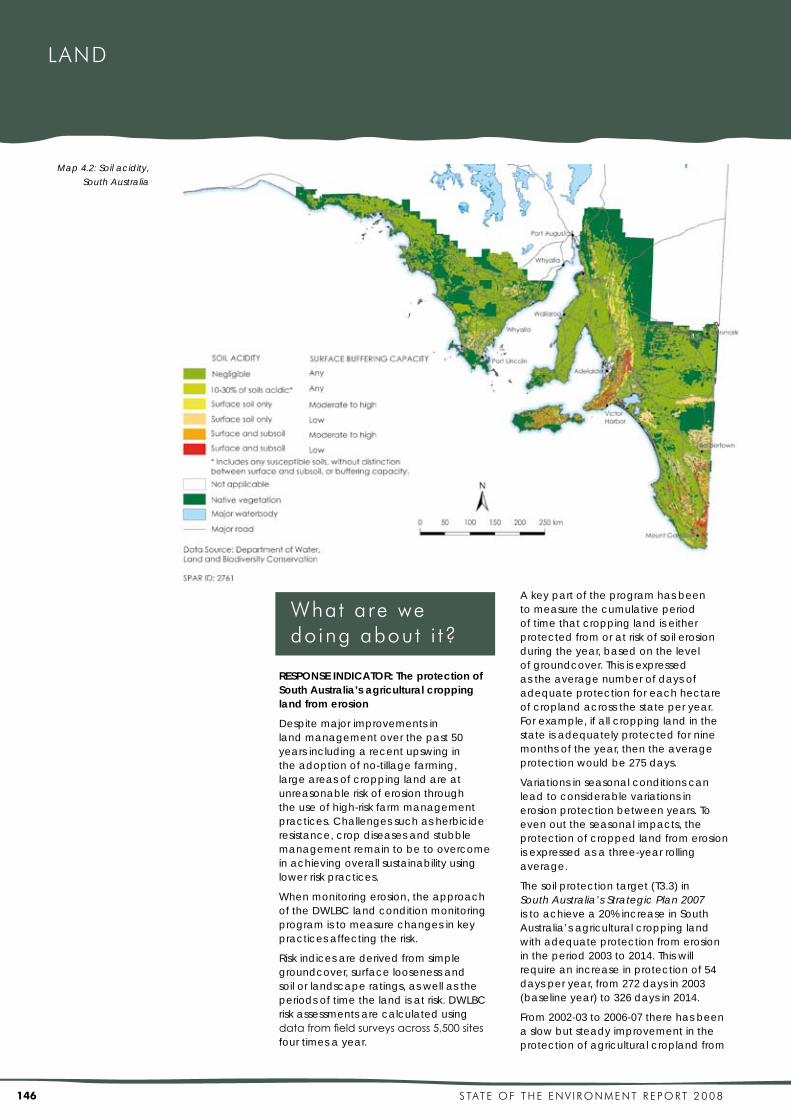
Stronglyacidicsoilsoccurexclusivelyinhighrainfall areas, where soil acidification poses thegreatestriskstoproductivity,waterqualityandtheenvironment(Map4.2).

Table 4.2: Area of cleared agricultural land with soils inherently susceptible to wind erosion by NRM

regions in South Australia

Table 4.3 Area of cleared agriculture land with soils inherently susceptible to water erosion by NRM

regions in South Australia

Water erosion removes topsoil and can cause

off-site degradation of water resources and

waterways through siltation, turbidity and

increased nutrient levels. Photo: DWLBC

Soi l Eros ion and Acidi ty

Source:(DWLBC,2007)

146 S TAT E O F T H E E N V I R O N M E N T R E P O RT 2 0 0 8

LAND

RESPONSE INDICATOR: The protection of South Australia’s agricultural cropping land from erosion

Despitemajorimprovementsinlandmanagementoverthepast50yearsincludingarecentupswingintheadoptionofno-tillagefarming,largeareasofcroppinglandareatunreasonableriskoferosionthroughtheuseofhigh-riskfarmmanagementpractices.Challengessuchasherbicideresistance,cropdiseasesandstubblemanagementremaintobetoovercomeinachievingoverallsustainabilityusinglowerriskpractices.

Whenmonitoringerosion,theapproachoftheDWLBClandconditionmonitoringprogramistomeasurechangesinkeypracticesaffectingtherisk.

Riskindicesarederivedfromsimplegroundcover,surfaceloosenessandsoilorlandscaperatings,aswellastheperiodsoftimethelandisatrisk.DWLBCriskassessmentsarecalculatedusingdata from field surveys across 5,500 sites fourtimesayear.

Akeypartoftheprogramhasbeentomeasurethecumulativeperiodoftimethatcroppinglandiseitherprotectedfromoratriskofsoilerosionduringtheyear,basedonthelevelofgroundcover.Thisisexpressedastheaveragenumberofdaysofadequateprotectionforeachhectareofcroplandacrossthestateperyear.Forexample,ifallcroppinglandinthestateisadequatelyprotectedforninemonthsoftheyear,thentheaverageprotectionwouldbe275days.

Variationsinseasonalconditionscanleadtoconsiderablevariationsinerosionprotectionbetweenyears.Toevenouttheseasonalimpacts,theprotectionofcroppedlandfromerosionisexpressedasathree-yearrollingaverage.

Thesoilprotectiontarget(T3.3)inSouth Australia’s Strategic Plan 2007 istoachievea20%increaseinSouthAustralia’sagriculturalcroppinglandwithadequateprotectionfromerosionintheperiod2003to2014.Thiswillrequireanincreaseinprotectionof54daysperyear,from272daysin2003(baselineyear)to326daysin2014.

From2002-03to2006-07therehasbeenaslowbutsteadyimprovementintheprotectionofagriculturalcroplandfrom

What are we doing about i t?

Map 4.2: Soil acidity,

South Australia

147S TAT E O F T H E E N V I R O N M E N T R E P O RT 2 0 0 8

erosion(Figure4.2).By2006-07thelevelofprotectionhadincreasedby18daysto290days,a6.7%improvementover2002-03.Duetothenegativeimpactofdroughtduring2006-07,therewasminimalimprovementinprotectioncomparedto2005-06.

Changes in farming practices

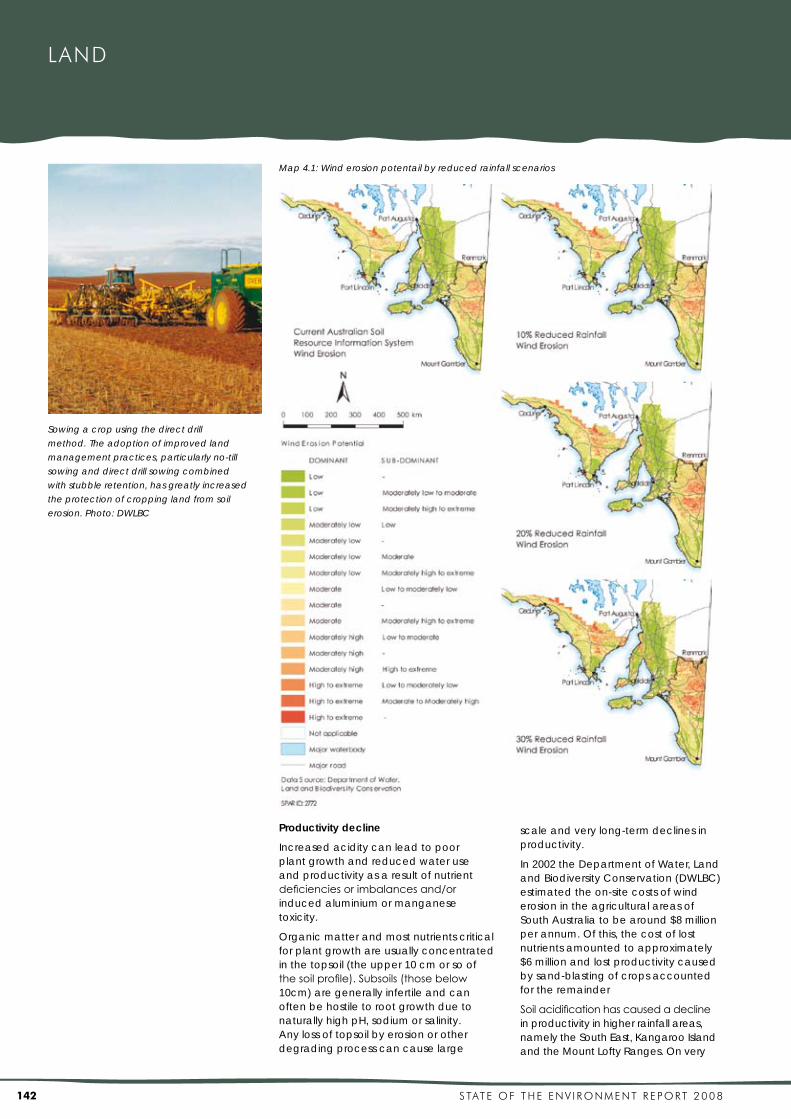
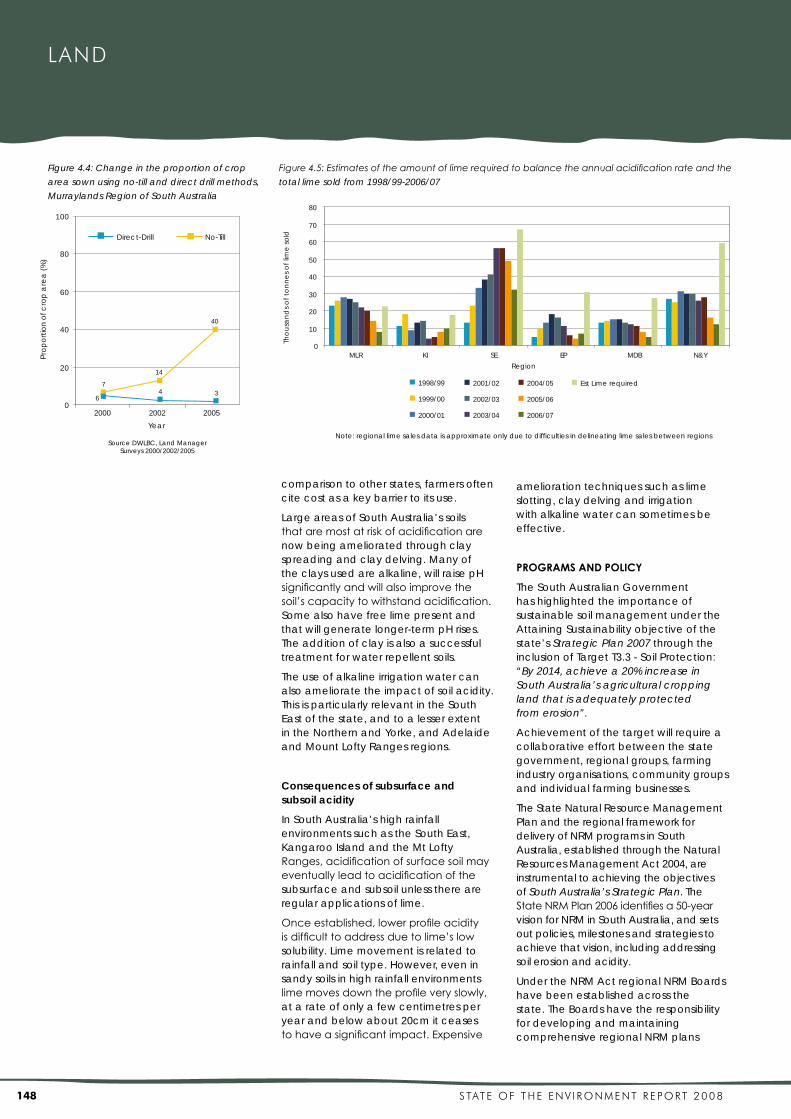
Theimprovementsince2003inprotectingcroppinglandfromerosionisattributedtoanincreaseintheadoptionofimprovedlandmanagementpractices,particularlyno-tillsowinganddirectdrillsowing,combinedwithstubbleretention.Notillsowing is the most significant practice for protectingcroplandfromerosionandinvolvessowingtheseedinanarrowslotinthesoiltominimisesoildisturbanceandmaximiseresidueprotectiononthesoilsurface.Direct-drillsowingthelandinvolvesploughing,butonlyduringsowing.

LandmanagementtelephonesurveysconductedforDWLBCshowthattheproportionofcropareasownusingno-tillmethodshasincreasedfrom13%in2000to47%in2005(Figure4.3).

ThegreatestchangehasoccurredintheMurraylandsregion,wheretheproportionofnotillsowingincreasedfromjust7%in2000to14%in2002andto40%2005(Figure4.4).Ithasbeenaremarkablechangetolong-establishedpracticesinashorttime.

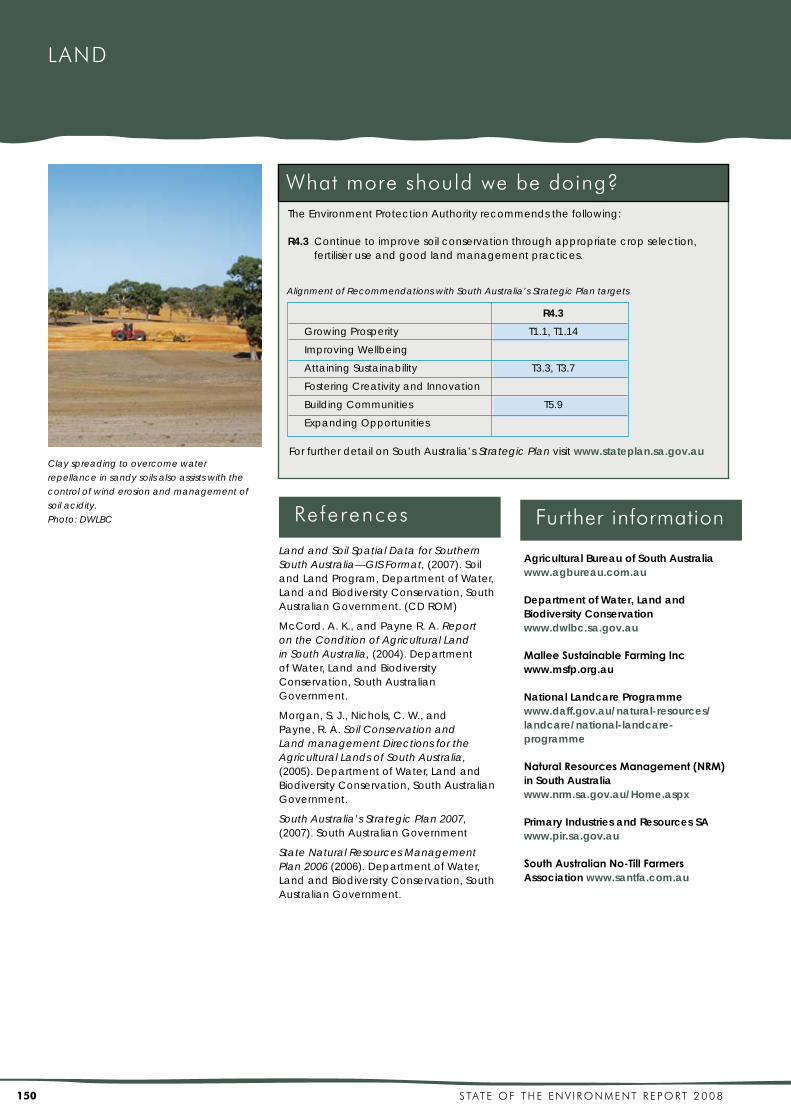
Theuseofclayspreadinganddelvingtomanagewaterrepellentsoilisbecominga significant factor in the protection of soilsfromwinderosion.Byincreasingtheclaycontentofthesurfacesoil,clayspreadinganddelvingincreasesoilstrengthandresistancetoerosion.Theprocessalsoimprovescropandpastureproduction,givinghigherlevelsofplantcovertoprotectthesoilfromerosion.Thesetechniquesarewidelyusedinthesouthernmalleeanduppersoutheastareaswheretherearelargeareasofseverelywaterrepellentsoils.

Improvedgrazingmanagementpractices,suchasrotationalgrazingandconfinement feeding, are also improving protectionforagriculturallandfromerosion. Confinement feeding enables stocktoberemovedfrompaddocksbeforesurfacecoverdeclinesbelowcriticalprotectivelevels.Itisaveryimportanttechniqueforpreventingerosionduringdroughtsandinlatesummerandautumnwhenground

coverisdeclining.Itismostvaluableinthemanagementofwinderosiononsandysoilssinceheavygrazingbystockcanloosenthesurfaceofthesesoilsmakingthemmorevulnerable.Itisalsoimportanttopreventfurtherareasbecomingsusceptibletoerosionandacidityduetoclearingandtorecognisetheopportunitiesthatrevegetationorregenerationmayprovidetoreduceerosionfromgrazingactivities.

Awiderangeofcommunity,industryandagencyprojectsfocusedoneducatingandinforminglandholdersandencouragingbestpracticehavedriventheadoptionofmanagementpracticesthatreducetheriskofsoilerosion.Theincreasedprevalenceofthesepracticesreflects a growing desire by farmers to use moresustainablemethods.

RESPONSE INDICATOR: Land and crop management practices – soil acidity

Improvedlandandcropmanagementpractices,particularlylimeapplications,havegonesomewaytoimprovingsoilconditionoverthepast50years,althoughtherateofadoptionofsustainablelandmanagementpracticesisstillnotasextensiveasitneedstobe.Whilelimeapplicationeffectivelytreatssoilacidity,bettermanagementofnitrogen-basedfertiliserregimesandtheuseofdeeprootedperennialpasturessuchaslucerne,can also influence the speed at which it developsinagriculturalareas.

Application of agricultural liming materials and clay

Withinconventionalagriculturalsystems,theonlypracticalwaytobalancetheacidification caused by agriculture is to applylimingmaterials.Monitoringtheuseoflimeprovidesanindirectmeasureoftheextenttowhichfarmershavebothrecognisedandaddressedsoilacidification.

Althoughratesoflimeusehaverisensubstantiallysincethemid-1990s,mostregionshaveshownasubsequentdeclineinlimeuseinrecentyears(Figure4.5).Theestimatedamountoflimerequiredto balance the annual acidification rate acrossthestateisapproximately211,000tonnes. In 2006/07 approximately 74,000 tonnesoflimewasapplied,slightlymorethanathirdofthatrequired.Verylargeareasoflandarecontinuingtoacidifytodamaginglevels.DespitetherelativelylowcostoflimeinSouthAustraliain

Year

150

200

250

300

350

99/0

0

00/0

1

01/0

2

02/0

3

03/0

4

04/0

5

05/0

6

06/0

7

Ave

rag

en

um

be

rof

da

ysp

rote

ctio

n

State Linear (State)

13

10 10

47

23

16

0

20

40

60

80

100

2000 2002 2005

Year

Pro

po

rtio

no

fcro

pa

rea

(%)

Direct Drill No Till

Source DWLBC, Land ManagerSurveys 2000/2002/2005

Figure 4.2: Trend in the average annual period

of protection of agricultural cropping land

from soil erosion, South Australia 2001/02-

2006/07 (days per year, 3 yr rolling mean)

Figure 4.3: Change in the proportion of crop

area sown using no-till and direct drill methods,

South Australia

Soi l Eros ion and Acidi ty

148 S TAT E O F T H E E N V I R O N M E N T R E P O RT 2 0 0 8

LAND

comparisontootherstates,farmersoftencitecostasakeybarriertoitsuse.

LargeareasofSouthAustralia’ssoilsthat are most at risk of acidification are nowbeingamelioratedthroughclayspreadingandclaydelving.Manyoftheclaysusedarealkaline,willraisepHsignificantly and will also improve the soil’s capacity to withstand acidification. Somealsohavefreelimepresentandthatwillgeneratelonger-termpHrises.Theadditionofclayisalsoasuccessfultreatmentforwaterrepellentsoils.

Theuseofalkalineirrigationwatercanalsoamelioratetheimpactofsoilacidity.ThisisparticularlyrelevantintheSouthEastofthestate,andtoalesserextentintheNorthernandYorke,andAdelaideandMountLoftyRangesregions.

Consequences of subsurface and subsoil acidity

InSouthAustralia’shighrainfallenvironmentssuchastheSouthEast,KangarooIslandandtheMtLoftyRanges, acidification of surface soil may eventually lead to acidification of the subsurfaceandsubsoilunlessthereareregularapplicationsoflime.

Once established, lower profile acidity is difficult to address due to lime’s low solubility.Limemovementisrelatedtorainfallandsoiltype.However,eveninsandysoilsinhighrainfallenvironmentslime moves down the profile very slowly, atarateofonlyafewcentimetresperyearandbelowabout20cmitceasesto have a significant impact. Expensive

ameliorationtechniquessuchaslimeslotting,claydelvingandirrigationwithalkalinewatercansometimesbeeffective.

PROGRAMS AND POLICY

TheSouthAustralianGovernmenthashighlightedtheimportanceofsustainablesoilmanagementundertheAttainingSustainabilityobjectiveofthestate’s Strategic Plan 2007throughtheinclusionofTargetT3.3-SoilProtection:“By 2014, achieve a 20% increase in South Australia’s agricultural cropping land that is adequately protected from erosion”.

Achievementofthetargetwillrequireacollaborativeeffortbetweenthestategovernment,regionalgroups,farmingindustryorganisations,communitygroupsandindividualfarmingbusinesses.

TheStateNaturalResourceManagementPlanandtheregionalframeworkfordeliveryofNRMprogramsinSouthAustralia,establishedthroughtheNaturalResourcesManagementAct2004,areinstrumentaltoachievingtheobjectivesofSouth Australia’s Strategic Plan.TheState NRM Plan 2006 identifies a 50-year visionforNRMinSouthAustralia,andsetsoutpolicies,milestonesandstrategiestoachievethatvision,includingaddressingsoilerosionandacidity.

UndertheNRMActregionalNRMBoardshavebeenestablishedacrossthestate.TheBoardshavetheresponsibilityfordevelopingandmaintainingcomprehensiveregionalNRMplans

0

20

40

60

80

100

2000 2002 2005

Year

Pro

po

rtio

no

fcro

pa

rea

(%)

Direct-Drill No-Till

346

40

14

7

Source DWLBC, Land ManagerSurveys 2000/2002/2005

0

10

20

30

40

50

60

70

80

MLR KI SE EP MDB N&Y

Region

Tho

usa

nd

so

fto

nn

es

of

lime

so

ld

1998/99

1999/00

2000/01

2001/02

2002/03

2003/04

2004/05

2005/06

2006/07

Est Lime required

Note: regional lime sales data is approximate only due to difficulties in delineating lime sales between regions

Figure 4.4: Change in the proportion of crop

area sown using no-till and direct drill methods,

Murraylands Region of South Australia

Figure 4.5: Estimates of the amount of lime required to balance the annual acidification rate and the

total lime sold from 1998/99-2006/07

149S TAT E O F T H E E N V I R O N M E N T R E P O RT 2 0 0 8

describingtheirgoalsinrelationtonaturalresourcesmanagement,targetsfornaturalresourcecondition,andpoliciesandprogramstoachievethem.ThedevelopmentandachievementofregionaltargetstoprotectcroppinglandfromsoilerosionwillbeakeystepinachievingthestatewideSoilProtectiontarget.TheBoardswillalsoprovidethecollaborationandcoordinationneededattheregionallevel.

RegionalNRMBoardsandindustryrequireinformationoncurrentstatusandtrendsintheprotectionofcroppinglandfromerosionaswellassoilerosionrisks,suchasdryseasons,andhowtomanagethem.ThelandconditionmonitoringprogramconductedbyDWLBCsince1999playsapivotalroleininformingNRMBoards,industryandagencypartnersofkeyissuesandcurrenttrendsinwindandwatererosionandsoilaciditytoimprovetheircapacity

todevelopandimplementappropriateprograms.

TheSouthAustralianGovernmentiscurrentlyinvolvedinarangeofprojectsaimedatincreasingtheadoptionofsustainablefarmingpracticessuchasno-tillfarming,inpartnershipwiththeNationalLandcareProgram,regionalfarmingsystemsgroupsandregionalNRMBoards.

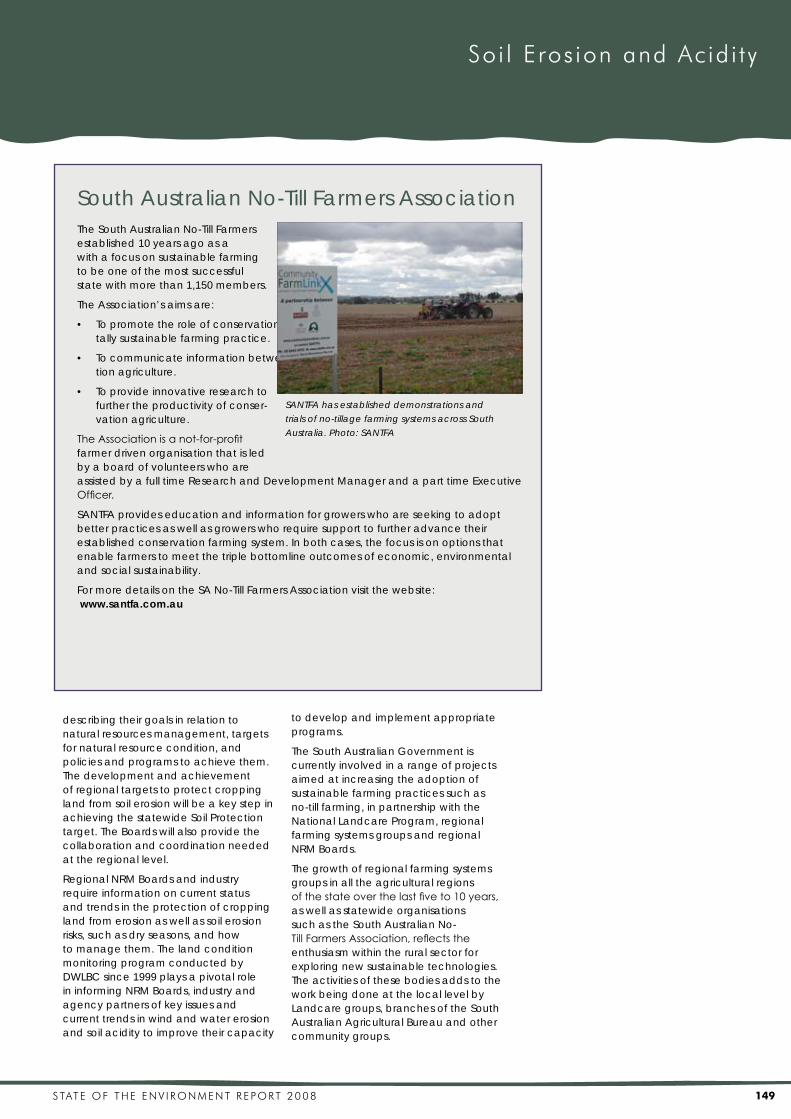
Thegrowthofregionalfarmingsystemsgroupsinalltheagriculturalregionsof the state over the last five to 10 years, aswellasstatewideorganisationssuchastheSouthAustralianNo-Till Farmers Association, reflects the enthusiasmwithintheruralsectorforexploringnewsustainabletechnologies.TheactivitiesofthesebodiesaddstotheworkbeingdoneatthelocallevelbyLandcaregroups,branchesoftheSouthAustralianAgriculturalBureauandothercommunitygroups.

SouthAustralianNo-TillFarmersAssociationTheSouthAustralianNo-TillFarmers Association(SANTFA)wasestablished10yearsagoasa statewidefarmingorganisationwithafocusonsustainablefarming systems.Ithassincegrowntobeoneofthemostsuccessful farmingsystemsgroupsinthestatewithmorethan1,150members.

TheAssociation’saimsare:

• Topromotetheroleofconservationagricultureasaneconomicandenvironmen-tallysustainablefarmingpractice.

• Tocommunicateinformationbetweenfarmersonapplyingsuccessfulconserva-tionagriculture.

• Toprovideinnovativeresearchtofurthertheproductivityofconser-vationagriculture.

The Association is a not-for-profit farmerdrivenorganisationthatisledbyaboardofvolunteerswhoareassistedbyafulltimeResearchandDevelopmentManagerandaparttimeExecutiveOfficer.

SANTFAprovideseducationandinformationforgrowerswhoareseekingtoadoptbetterpracticesaswellasgrowerswhorequiresupporttofurtheradvancetheirestablishedconservationfarmingsystem.Inbothcases,thefocusisonoptionsthatenablefarmerstomeetthetriplebottomlineoutcomesofeconomic,environmentalandsocialsustainability.

FormoredetailsontheSANo-TillFarmersAssociationvisitthewebsite: www.santfa.com.au

SANTFA has established demonstrations and

trials of no-tillage farming systems across South

Australia. Photo: SANTFA

Soi l Eros ion and Acidi ty

150 S TAT E O F T H E E N V I R O N M E N T R E P O RT 2 0 0 8

What more should we be doing?

LAND

Further information

Agricultural Bureau of South Australia www.agbureau.com.au

Department of Water, Land and Biodiversity Conservation www.dwlbc.sa.gov.au

Mallee Sustainable Farming Inc www.msfp.org.au

National Landcare Programme www.daff.gov.au/natural-resources/landcare/national-landcare-programme

Natural Resources Management (NRM) in South Australia www.nrm.sa.gov.au/Home.aspx

Primary Industries and Resources SA www.pir.sa.gov.au

South Australian No-Till Farmers Association www.santfa.com.au

References

Land and Soil Spatial Data for Southern South Australia—GIS Format, (2007).SoilandLandProgram,DepartmentofWater,LandandBiodiversityConservation,SouthAustralianGovernment.(CDROM)

McCord.A.K.,andPayneR.A.Report on the Condition of Agricultural Land in South Australia,(2004).DepartmentofWater,LandandBiodiversityConservation,SouthAustralianGovernment.

Morgan,S.J.,Nichols,C.W.,andPayne,R.A.Soil Conservation and Land management Directions for the Agricultural Lands of South Australia, (2005).DepartmentofWater,LandandBiodiversityConservation,SouthAustralianGovernment.

South Australia’s Strategic Plan 2007,(2007).SouthAustralianGovernment

State Natural Resources Management Plan 2006(2006).DepartmentofWater,LandandBiodiversityConservation,SouthAustralianGovernment.

TheEnvironmentProtectionAuthorityrecommendsthefollowing:

R4.3 Continuetoimprovesoilconservationthroughappropriatecropselection,fertiliseruseandgoodlandmanagementpractices.

Alignment of Recommendations with South Australia’s Strategic Plan targets

Clay spreading to overcome water

repellance in sandy soils also assists with the

control of wind erosion and management of

soil acidity.

Photo: DWLBC

ForfurtherdetailonSouthAustralia’sStrategic Planvisitwww.stateplan.sa.gov.au

R4.3

Growing Prosperity T1.1, T1.14

Improving Wellbeing

Attaining Sustainability T3.3, T3.7

Fostering Creativity and Innovation

Building Communities T5.9

Expanding Opportunities

151S TAT E O F T H E E N V I R O N M E N T R E P O RT 2 0 0 8

Trends

Goals

Dryland Salinity

• ShallowergroundwaterlevelsthroughouttheStatehavegenerallyexhibitedaDECREASINGtrend,mostlikelyduetorecentbelow-averagerainfall.Theexceptiontothishasbeenareasthathavenotbeenasseverelyaffectedbyextendedbelow-averagerainfall,forexampleKangarooIsland.

• DeepergroundwaterlevelsthroughouttheStatehavegenerallyexhibitedaSTABILISINGtrend,mostlikelyduetotheextendedperiodofbelow-averagerainfallsincethemid1990s,withtheexceptionoftheareasthathavenotbeenasseverelyaffectedbyextendedbelow-averagerainfall.

• Intheshort-termthereisgenerallyaREDUCEDRISKofdrylandsalinityinareasthathaveexperiencelowerthanaveragerainfallsincethemid1990s.

Protectlandresourcesfromsalinisation,minimisinganyadditionalareaoflandaffectedbydrylandsalinitybeyondyear2000levels(approximately330,000Ha).

• Protectournaturalenvironment,waterandbiodiversityresources,keepingsalinityimpactstocurrentlevelsorwherepossible,reducingthem.

• Protectoureconomicresourcebase,developingproductiveusesforirreversiblysalinelandandwater.

South Australian Dryland Salinity Strategy 2001

Dryland Salinity and a sustainable South Australia

DrylandsalinityinSouthAustraliahasasignificant impact on the state’s land, waterandbiodiversityassets,particularlyinbroadacredrylandfarmingareas.Inmanypartsofthestate,historicalclearanceofnativevegetationanditsreplacementwithannualcropsandpastureshasresultedinrisinggroundwaterlevels.Risinggroundwatercauseslandtobecomesaltaffectedandincreasessalinegroundwaterdischargetostreams.Aswellaslandandhabitatdegradation,drylandsalinityhassignificant economic and social impacts, particularlyinregionalcommunitieswheretherearehighcostsresultingfromlostagriculturalproductionplussaltdamagetoroads,buildingsandotherinfrastructure.

SalinityposesathreatinallagriculturalregionsofSouthAustralia.AsreportedintheState of the Environment Report (2003),risinggroundwaterwasexpectedto have a particularly significant impact ontheinfrastructureandagriculturallandoftheUpperSouthEastregion.

Salinityisnotanewissueinthatregion,butitsseverityincreasedwiththeadventof widespread flooding during the 1980sandearly1990s.Theinterdunalflats that characterise the region are particularly prone to flooding in years ofaboveaveragerainfall.Notonlydoes flooding damage crops, pastures andinfrastructure,italsorechargesthegroundwatersystem,whichfurtherexacerbatesthesalinitythreat.

Ruralcommunitiesaremostatriskfromdrylandsalinityandlandownerswhohavetheseproblemscanfaceeconomiclossesthroughreducedproductivity,the need to switch to less profitable enterprisesorinseverecases,theinabilitytocontinuefarmingaparticulararea.

In2000,thelossinagriculturalproductionasadirectresultofdrylandsalinitywasestimatedtobe$26.1millionandwaspredictedtoincreaseto$42millionby2050(Barnett,2000).Thisrepresentsonly1-2%ofthestatewidegrossmarginfromproductiononallagriculturalland,buttheeconomicburdenisspreadveryunevenly.Inaffectedruralareas,drylandsalinitycanalsocausedamagetobuiltinfrastructuresuchasroads,railway

• GroundbasedEMsurveysconductedinfocuscatchmentshaveshownthatinmostcasesthesaltlandareahasbeenrecedingatarateof2%to3%peryearsincetheearlytomid1990s.

• Onthelow-lyingCoastalPlainwatertablelevelsarecloselyalignedtowinterrainfall,notwithstandingtheimpactondrawdownbyperennialvegetation.Nowinterrechargewasobservedduringthe2006drought,withgroundwaterlevelsfallingabout0.5mto0.75mbelow2003levels–theyarenowthelowestrecordedsincemonitoringbeganin1980.

• InsomeareasoftheUpperSouthEast,adrawdowningroundwaterhasbeenobservedatadistanceupto2kmup-gradientofthedrains.

• OnKangarooIslandwherearisinggroundwatertrendhasbeenevident,theareaofsaltlandinafocuscatchmenthasincreasedatanaverageyearlyrateof2.5%from1991to2004.

Key Facts

Dry land Sal in i ty

152 S TAT E O F T H E E N V I R O N M E N T R E P O RT 2 0 0 8

linesandbuildings.Thelifeexpectancyofsealedroadsisreducedandunsealedroadsrequiremorefrequentmaintenance.

Thedegreeoflocalisedimpactonvaluableagricultural,biodiversityandinfrastructureassetsfromdrylandsalinity,ratherthanthespatialextentoftheproblem across the State should influence decisionsformanagingtheproblemrecognisingthatitsrelativeimpactdependsheavilyontheassetvalueofitslocality.

AcrossagriculturalareasandontheRiverMurray floodplain, numerous biodiversity assets have been identified as under threatfromdrylandsalinity,aswellassalinitycausedbyirrigation.Threatenedassetsincludelow-lyingremnantnativevegetation,wetlands,riparianzonesandconservationparks.

In2000,approximately18,000Haofnativevegetationand45,000Haofwetlandswereestimatedtobeaffectedbydrylandsalinity(NLWRA,2001).Particularlysignificant areas at risk include Biodiversity HotspotslistedbytheEndangeredSpeciesAdvisoryCommittee(Dooley,2003)suchasMessentandGumLagoonConservationParksintheUpperSouthEastandMurray’sLagoononKangarooIsland.Thesenationalparksandwildlifereservessupportareasofnativevegetationthatareofhighconservationvalue.

Sincetheoriginalbaselineassessmentsoftheareaaffectedbydrylandsalinity(NLWRA,2001;DWLBC2005),therehasbeennorevisedstatewideassessment.Insteadfocuscatchmentsthatarerepresentativeofthemajorregionalandlocal groundwater flow systems in dryland agriculturalregionshavebeenselectedforassessmentasindicatorsofchangesacrossthestate.AvarietyofinformationfromeachcatchmentisexaminedincludingEMsurveys,trendsindepthtogroundwaterand type of groundwater flow system, rainfallpatternsandchangesinlanduse(DWLBC,InPress).

Since2003belowaveragerainfallwiththeresultingfallinggroundwaterlevels,changesinlandusetoreducerechargeand the effect of an artificial drainage networkconstructedintheMidandUpperSouthEasthaveaffecteddrylandsalinity.

Thelowrainfallhasdeliveredastability,indepthtogroundwateracrossSouthAustralia,reducingthethreatposedbydrylandsalinity.Infact,afallingtrendinthisdepthhasbeenevidentinrepresentativelocal groundwater flow systems. A few areasincludingKangarooIsland,havenot

beenasseverelyaffectedbybelow-averagerainfallandsothefallingdepthtogroundwatertrendislessevident.

Infocusareaswhererainfallhasbeenbelow-averagerainfallforanextendperiod,groundbasedEMsurveysrevealanassociatedcontractionofsaltaffectedlandby2-3%peryear.Fordeepergroundwatersystems,previousrisingtrendshavealsonowgenerallystabilised,indicatingreducedlong-termriskofdrylandsalinity.

InsomeareasoftheUpperSouthEast,deepdrainagehasresultedinadraw-downingroundwateratadistanceofupto2kmupgradientofthedrains,reducingtheproportionoflandaffectedbydrylandsalinityinthearea.

Thistrendislikelytocontinuewithbelow-averagerainfalllinkedtoclimatechangepredictedforthelongerterm.Thisislikelytobeoneofthefewenvironmentalbenefits of adverse climate change in SouthAustralia.Furtherresearchisneededintothefullimpactofclimatechangeincluding lower spring/autumn rainfall, increasedevaporationandincreasedfrequencyofextremeweatherevents,onsalinityextentandrisk.

IndicatorsCONDITION INDICATOR

• Area affected by dryland salinity

Identifies the area of land affected by drylandsalinity.

PRESSURE INDICATOR

• Area threatened by dryland salinity

Identifies the area of land at risk from drylandsalinity.

CONDITION INDICATOR: Area of land affected by dryland salinity

DrylandsalinityoccurstosomeextentacrossallofSouthAustralia’smajoragriculturalNRMRegions.Theareaofaffectedlandhasbeenestimatedtobemorethan300,000Ha,with

What is thecurrent s i tuat ion?

LAND

Figure 4.6: Comparison of Jamestown

electomagnetic surveys 1991 and 2006

Source:DWLBC

153S TAT E O F T H E E N V I R O N M E N T R E P O RT 2 0 0 8

theUpperSouthEastbeingthemostseverelyaffectedregion(NLWRA,2001;DWLBC,2005).

Ithasbeenpredictedthatby2050thetotalareaoflandaffectedbydrylandsalinitywillincreaseto521,000Ha,undernormalrainfallconditionsandwithoutintervention.Sincethen,therehasbeennonewstatewideassessmentoftheareacurrentlyaffectedbydrylandsalinitytakingintoaccountrecentbelow-averagerainfall,changesinlandusetoreducerechargeortheeffect of the artificial drainage network constructedintheMidandUpperSouthEast.

TheNationalCoordinationCommitteeforSalinityhasagreedthatthelocation,sizeandintensityofsaltaffectedareasisausefulandscalableindicator,butmeasuringtheextentofsaltaffectedland,whileusefulforstatisticalpurposes,providesnoindicationofthehydrologicalstatusofacatchmentorparticularlandunit.Trendsintheareaofsaltaffectedlandmaygiveusanideaofpastorcurrentprocesses,butcurrentlycannotbeusedreliablytopredictchange(BureauofRuralSciences,2007).

Inordertomonitorchangesindrylandsalinityacrossthestate,assessmentshavebeenmadeofaselectionoffocuscatchmentsthatarerepresentativeofthemajorregionalandlocalgroundwater flow systems in key dryland agriculturaldistrictsacrosstheUpperSouthEast,NorthernandYorkePeninsula,EyrePeninsula,SAMurrayDarlingBasin,

-10

1

2

3

4

5

6

7

8

9

1011

12

13

1415

Jan-80 Dec-84 Jan-90 Jan-95 Jan-00 Jan-05

Date

Sta

nd

ing

Wa

terL

eve

l(m

,be

low

gro

un

dle

vel)

-400

-200

0

200

400

600

800

Cu

mu

lativ

ed

evi

atio

nfr

om

me

an

mo

nth

lyra

infa

ll(m

m)

MNL 003 [27m] Control / discharge MNL 012 [35m] Control / discharge

MNL 018 [18m] Treatment / discharge MNL 033 [35m] Treatment / discharge

MNL 036 [20.5m] Treatment / recharge MNL 039 [35m] Control / discharge

Minlaton residual rainfall curve

Source: SWL data from OBSWELL, Rainfall data from 'SILO Data Drill' [137.60degE, 34.80degS]

KangarooIslandandMountLoftyRanges.AvarietyofinformationfromeachfocusareawasevaluatedincludinggroundbasedEMsurveys(seeSpecialInterestSection),trendsindepthtogroundwaterand groundwater flow systems, rainfall patternsandchangesinlanduse(DWLBC,InPress).

Intwofocuscatchments,EMsurveyswereconductedtomeasurethechangeinsaltlandbetween1991and2006.Thesurveyshaveshownanaveragedecreaseinsaltlandareaof3%peryearatJamestown(Figure4.6)and2%peryearatMinlaton(2007SaltlandSnapshotNorthernandYorke,InPress).Thecontractioninsaltlandrelatestoadecliningtrendindepthtogroundwater,whichinturnparallelsalonger-termdeclineinaveragerainfall(seePressureIndicatorSection)

Figure4.6showsacomparisonofJamestownEMsurveys(red=highersalinity)in1991(left)and2006(right)overlaidonaerialphotographsofthearea.

AtWanillaandDarkePeakeontheEyrePeninsula,EMsurveyswereconductedtomeasurethechangeinsaltlandbetween1992and2005(2007SaltlandSnapshotEyrePeninsula,InPress).Thesurveysshowedadecreaseofabout2%peryearintheareaoflandaffectedbydrylandsalinityatWanilla.AtDarkePeakithasreducedby2.5%peryear.Thesereductionsareagainrelatedtothefallingtrendingroundwaterlevelsthat,inturn,correlateswithbelow-averagerainfall.

Dryland salinity, Hindmarsh Island.

Photo: Monica Moss

Figure 4.7: Falling groundwater trend and falling (cumulative residual) rainfall, Minlaton focus catchment

Dryland Sal in i ty

154 S TAT E O F T H E E N V I R O N M E N T R E P O RT 2 0 0 8

LAND

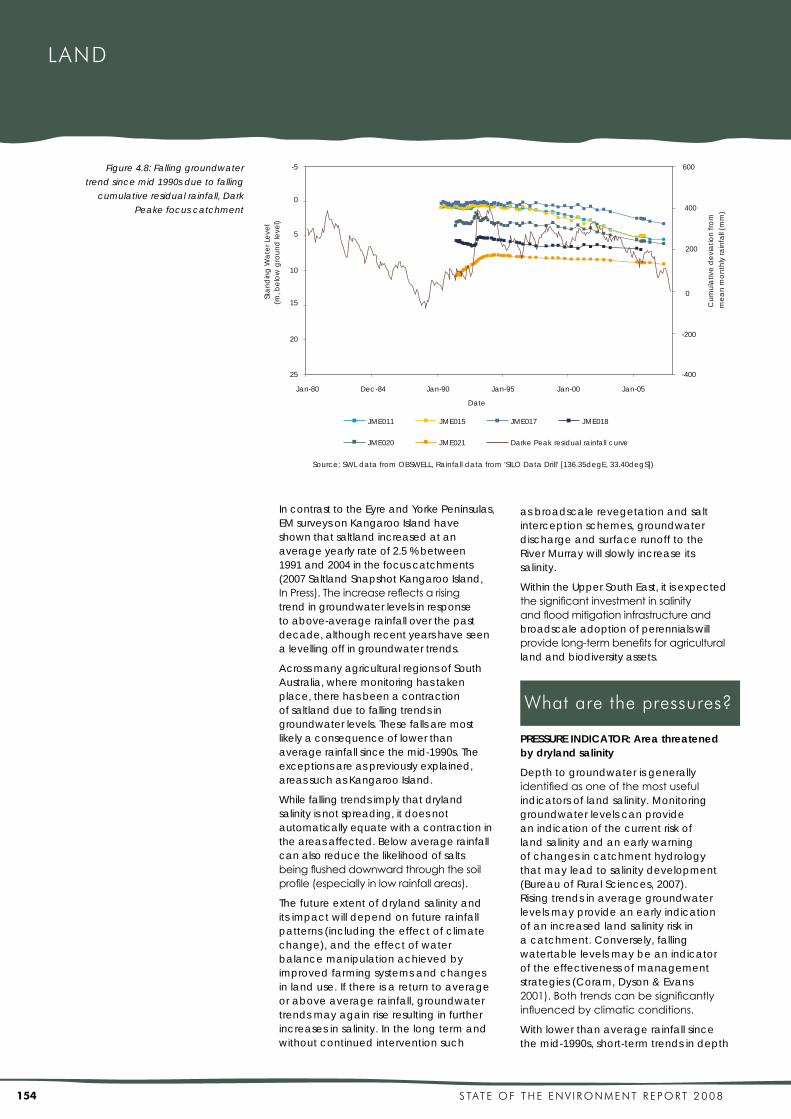
PRESSURE INDICATOR: Area threatened by dryland salinity

Depthtogroundwaterisgenerallyidentified as one of the most useful indicatorsoflandsalinity.Monitoringgroundwaterlevelscanprovideanindicationofthecurrentriskoflandsalinityandanearlywarningofchangesincatchmenthydrologythatmayleadtosalinitydevelopment(BureauofRuralSciences,2007).Risingtrendsinaveragegroundwaterlevelsmayprovideanearlyindicationofanincreasedlandsalinityriskinacatchment.Conversely,fallingwatertablelevelsmaybeanindicatoroftheeffectivenessofmanagementstrategies(Coram,Dyson&Evans2001). Both trends can be significantly influenced by climatic conditions.

Withlowerthanaveragerainfallsincethemid-1990s,short-termtrendsindepth

What are the pressures?

Jan-80 Dec-84 Jan-90 Jan-95 Jan-00 Jan-05

Date

-5

0

5

10

15

20

25

Sta

nd

ing

Wa

terL

eve

l(m

,be

low

gro

un

dle

vel)

-400

-200

0

200

400

600

Cu

mu

lativ

ed

evi

atio

nfr

om

me

an

mo

nth

lyra

infa

ll(m

m)

JME011 JME015 JME017 JME018

JME020 JME021 Darke Peak residual rainfall curve

Source: SWL data from OBSWELL, Rainfall data from 'SILO Data Drill' [136.35degE, 33.40degS])

IncontrasttotheEyreandYorkePeninsulas,EMsurveysonKangarooIslandhaveshownthatsaltlandincreasedatanaverageyearlyrateof2.5%between1991and2004inthefocuscatchments(2007SaltlandSnapshotKangarooIsland,In Press). The increase reflects a rising trendingroundwaterlevelsinresponsetoabove-averagerainfalloverthepastdecade,althoughrecentyearshaveseenalevellingoffingroundwatertrends.

AcrossmanyagriculturalregionsofSouthAustralia,wheremonitoringhastakenplace,therehasbeenacontractionofsaltlandduetofallingtrendsingroundwaterlevels.Thesefallsaremostlikelyaconsequenceoflowerthanaveragerainfallsincethemid-1990s.Theexceptionsareaspreviouslyexplained,areassuchasKangarooIsland.

Whilefallingtrendsimplythatdrylandsalinityisnotspreading,itdoesnotautomaticallyequatewithacontractionintheareasaffected.Belowaveragerainfallcanalsoreducethelikelihoodofsaltsbeing flushed downward through the soil profile (especially in low rainfall areas).

Thefutureextentofdrylandsalinityanditsimpactwilldependonfuturerainfallpatterns(includingtheeffectofclimatechange),andtheeffectofwaterbalancemanipulationachievedbyimprovedfarmingsystemsandchangesinlanduse.Ifthereisareturntoaverageoraboveaveragerainfall,groundwatertrendsmayagainriseresultinginfurtherincreasesinsalinity.Inthelongtermandwithoutcontinuedinterventionsuch

Figure 4.8: Falling groundwater

trend since mid 1990s due to falling

cumulative residual rainfall, Dark

Peake focus catchment

asbroadscalerevegetationandsaltinterceptionschemes,groundwaterdischargeandsurfacerunofftotheRiverMurraywillslowlyincreaseitssalinity.

WithintheUpperSouthEast,itisexpectedthe significant investment in salinity and flood mitigation infrastructure and broadscaleadoptionofperennialswillprovide long-term benefits for agricultural landandbiodiversityassets.

155S TAT E O F T H E E N V I R O N M E N T R E P O RT 2 0 0 8

togroundwaterarerelativelystableandinmanyinstanceslevelsarefalling.Fordeepergroundwatersystems,previousrisingtrendshavealsonowstabilised.Ifthesedrierconditionscontinueintheshorttermtheriskofdrylandsalinityislikelytobereduced.

Anyresumptionofaverageoraboveaveragerainfallpatterns,willincreasetheriskofdrylandsalinityspreadingastherearelikelytoberenewedrisinggroundwatertrendsandfurtherincreasesintheareaaffected.

Thefollowingoverviewofregionaltrendsingroundwaterlevelsprovideskeyinformationforassessingthethreatofshallowwatertablesandassociatedlevelsofsalinityrisk.

Upper Southeast groundwater level trends

Onthelow-lyingCoastalPlain,groundwaterlevelshaveaclosecorrelationwithwinterrainfall.Followingthe2006drought,whennegligiblewinterrechargeoccurred,groundwaterlevelsfellaround0.5mto0.75mbelow2003levelsduringearly2007.Theseweregenerallythelowestlevelssincemonitoringbeganin1980.

Despiteanextendedrunoflowerthanaveragerainfallyearsverysalinegroundwatertablesremainatshallowdepths,oftenlessthan1.5mbelowthesurfaceinthelow-lyingpartsofthelandscape,wheredrainageisundevelopedandsaltaccumulationin the upper soil profile is a real threat topastureandnativevegetation.Suchgroundwatertablesrespondimmediatelytorainfallbringingextremelysalinegroundwatertothesurface.

InsomeareasoftheUpperSouthEast,adeepdrainagenetworkhasresultedinadrawdowningroundwateratdistancesofupto2kmup-gradientofthedrains(Telfer,WhiteandSantich,2002).Thedrawdowneffectisresponsibleforareductioninareaaffectedbydrylandsalinityoneithersideofthedrainsthroughoutthenetwork(DWLBC,2006)howeverincreasedsoilsodicityisalsooccurringinmanyareasaffectedbythedrains.Whilesomestudieshavefocusedontheeffectivenessofthedrains(Morris,StrugnellandDunsford,2004;Durkay,2007),mostobservationsareanecdotal(SenateEnquiry,2005).Acomprehensiveevaluationoftheeffectofthedrainagenetworkontheareas

affectedbydrylandsalinityhasyettobeundertaken.TheUpperSouthEastDrylandSalinityandFloodManagementProgramispreparingtocommissionsuchasurvey.

Northern and Yorke Peninsula

RisingtrendsinwaterlevelshadbeenobservedinsomedeeperaquifersonYorkePeninsulaupuntil2002.Thisrevertedtoafallingtrendin2006-07(Figure4.7).Inshallowgroundwaterareas,levelshavebeenfalling(Figure4.7),probablyduetoacombinationofbelow-averagerainfallandlandusechange,resultinginarecessioninsaltlandareaandareducedriskofdrylandsalinity.

ManycatchmentsintheNorthernandYorkePeninsularegionsarenowatorapproaching,awaterequilibrium(2007SaltlandSnapshotNorthernandYorke,InPress).Theareaofsaltlandisexpectedtospreadandrecedeinlinewithlonger-termrainfallcycles.However,therecentextendedbelow-averagerainfallhasalsohighlightedthepotentialforincreasedevaporationandreducedvegetativecovertoexposeandexacerbatetheconditionofpreviouslycoveredsaltland.

The Eyre Peninsula

Probablyduetobelow-averagerainfall,afallingtrendindepthtogroundwaterhasbeenobservedformostareasonEyrePeninsulaoverthepast15years(Figure4.8),althoughrisinggroundwaterhasbeenrecordedforsomedeeperaquifersintheEasternCleveHills(2007SaltlandSnapshotEyrePeninsula,InPress).Ashort-termreductioninlandthreatenedbydrylandsalinityisinferredbythefallingtrend.

Aspike(rise)ingroundwaterlevelswasobservedontheLowerEyrePeninsulafollowing a bushfire in 2005, and a few newoutbreaksofsaltlandresulted(HenschkeandWright2007).Thisisatimelyreminderthat,whilemanyofthesecatchmentsmaybeatwaterequilibrium,adverse events such as bushfire, flood andclimatechange,canhaveasignificant impact on salinity.

Kangaroo Island

Insomecatchments,groundwaterhasriseninresponsetoabove-averagerainfalloverthepastdecade(Figure4.9)andlandclearingthatoccurredupuntilthe1970s.However,inrecentyearstherehasbeenagenerallevellingoff

Dryland Sal in i ty

156 S TAT E O F T H E E N V I R O N M E N T R E P O RT 2 0 0 8

Jan-80 Dec-84 Jan-90 Jan-95 Jan-00 Jan-05

Date

0

2

4

6

8

10

12

Sta

nd

ing

Wa

terL

eve

l(m

,be

low

gro

un

dle

vel)

-800

-600

-400

-200

0

200

400

Cu

mu

lativ

ed

evi

atio

nfr

om

me

an

mo

nth

lyra

infa

ll(m

m)

SED042 [35m] Narroonda residual rainfall curve

Jan-80 Dec-84 Jan-90 Jan-95 Jan-00 Jan-05

Date

-5

0

5

10

15

20

25

30

35

40

45

50

Sta

nd

ing

Wa

terL

eve

l

(m,b

elo

wg

rou

nd

leve

l)

-400

-200

0

200

400

600

800

Cu

mu

lativ

ed

evi

atio

nfr

om

me

an

mo

nth

lyra

infa

ll(m

m)

RBY003 [20m] RBY004 [2m]

CLN001 [37.5m] KKP001 [56m]

Coomandook residual rainfall curve

LAND

inthesetrends,withthepossibilitythatequilibriumhasnowbeenreachedinmostcatchments(2007SaltlandSnapshotKangarooIsland,InPress;Henschke,Evans,LiddicoatandDooley2005).

Mount Lofty Ranges groundwater level trends

Groundwaterlevelscorrelatecloselywithwinterrainfallinthisarea(2007SaltlandSnapshotMountLoftyRanges,InPress),andconsequently,levelsareabout0.5mbelow2003levelsduetothe2006drought.Averagerainfallhasdeclinedsinceahighpointintheearly1990s,withgroundwaterdepthfollowingasimilartrend.

Long-term rainfall trends will influence depthtogroundwater,butestablishinga significant area of a catchment withperennialsinthesetypicallylocalgroundwater flow systems (GFS) will

reducerechargeandhelpcontrolfuturesaltlandspread.

Detailedanalysis(Liddicoat)hasshown that the salinity benefits from revegetationinhigherrainfallpartsoftheBremerBarkerCatchmentmaybemorethanoffsetbythenegativeimpactsonsurface water flows and therefore, on salinitylevelsintheBremerRiver.SimilarscenariosmaypresentinotherMountLoftyRangescatchments.

SA Murray Darling Basin and River Murray salinity

AtCookePlains,saltdischargesfroma regional groundwater flow system emanatingfromVictoria.Groundwaterlevelsinthedeeperregionalsystemhavebeenrisingatarateof8cmperyearsince1990,againstabackdropofbelow-averagerainfall(Figure4.10)

Figure 4.10: Gradual rising

groundwater trend and falling

(cumulative residual) rainfall,

Coomandook focus catchment.

Source:DWLBC

Figure 4.9: Falling groundwater

trend since mid 1990s due to

falling cumulative residual rainfall,

Narroonda, Kangaroo Island focus

catchment.

Source:DWLBC

157S TAT E O F T H E E N V I R O N M E N T R E P O RT 2 0 0 8

Jan-80 Dec-84 Jan-90 Jan-95 Jan-00 Jan-05

Date

0

2

4

6

8

10

12

Sta

nd

ing

Wa

terL

eve

l(m

,be

low

gro

un

dle

vel)

-800

-600

-400

-200

0

200

400

Cu

mu

lativ

ed

evi

atio

nfr

om

me

an

mo

nth

lyra

infa

ll(m

m)

SED042 [35m] Narroonda residual rainfall curve

0

10

20

30

40

50

60

2000 2025 2050 2075 2100

Year

ECin

cre

ase

at

Mo

rga

n

Source: Barnett and Yan, 2006

What are we doing about i t?

Whereviableoptionsfordrylandsalinitymanagementdonotexist,suchasinthebroadscaleagriculturalareasoftheMurrayMallee,EyrePeninsulaandNorthernandYorkePeninsula,continuedresearchanddevelopmentisneededinto practical and profitable options for rechargemanagement.Thisisbeingaddressedbythestategovernment’spartnershipwiththeFutureFarmIndustriesCooperativeResearchCentre(FFICRC).

InresponsetothreatsposedbydrylandsalinitythestategovernmentinitiallydevelopedtheSouthAustralianDrylandSalinityStrategyin2001.SincethelastSOEreport,the Natural Resources Management Act 2004(NRMAct)wasenactedandthe State NRM Plan(2006)prepared,settingstrategicdirectionsfornaturalresourcesmanagementincludingdrylandsalinity.

TheNRMActputsgreateremphasisonintegratednaturalresourcemanagementratherthansingleissuessuchassalinity.ThiswasthebasisoftheNRMCouncil’sdecisiontodisbandtheSADrylandSalinityCommittee.However,theTechnicalAdvisoryGroupstillmeetsandnowreportsdirectlytotheNRMCouncil.TheActdoes

Figure 4.11:Predicted increase in salinity in

the River Murray (2000 – 2100)butoverrecentyears,havetendedtostabilisewithextendeddryconditions(2007SaltlandSnapshotSAMurrayDarlingBasin,InPress).

Itispredictedthatwithoutcontinuedon-groundaction,suchasrevegetationanddrainagetointerceptit,groundwaterwillslowlydraintowardstheRiverMurray,significantly increasing its salinity in the future.

Amodelingexercisecarriedoutrecently(BarnettandYan,2006)providedanupdatedestimateoftheimpactofrisingwatertablesduetoMalleeclearance,ontheRiverMurraysalinitylevel.Thisanalysisusedmuchimprovedrechargeestimatesandpredictedlagtimesbetweenclearingandwatertableresponse.Comparedtotheimpactfromirrigationdrainage,theclearing-inducedriseinsalinityisexpectedtoberelativelysmall,amountingtoa20ECincreaseatMorganovertheyears2000to2050.ThisismeasuredagainsttheBasintargetofmaintaininglevelsbelow800EC95%ofthetime(Basin Salinity Management Strategy, 2001).

provideforthelong-termmanagementofnaturalresourcethreatsincludingsalinity,throughNRMRegionalBoards.

Implementationofthe South Australian Dryland Salinity Strategyisarequirementdefined in Goal 2 of the South Australian StateNRMPlan.

TheNRMRegionalBoardsareworkinginpartnershipwithStateandAustralianGovernmentstodevisecomprehensiveplansthatmusttakeintoaccountgoalsandstrategieswithintheStateNRMPlan.Thiswillinvolvedevelopingrelevantagronomic,hydrologicalandbiologicalprogramstotacklesalinityandreportingontheirprogress.Thelevelofeffortdirectedtotheseprogramsdependsonthemagnitudeofsalinityrisk,valueoftheassetsunderthreat,costofmanagementactionsandlikelihoodofsuccess.

ManyNRMregionalprojectsfordrylandsalinitymanagementinvolveaddressingtheimbalanceofwaterinthelandscape.Themanagementchallengesinclude:

• Reducingrechargetogroundwatersystems,usuallywithdeeprootedperennial vegetation; and/or,

• Makingproductiveuseofthedischargearea,usuallywithsalt-tolerantpastureplants; and/or

• Engineeringsolutionstointerceptanddisposeofthesalinewater.

TheNRMActprovidesavehiclefortheimplementationofCommonwealthfundingprograms.Sincethe 2003 SOE Report,themajorsourcesoffundingsupportingdrylandsalinitymanagementhavebeentheNaturalHeritageTrust(NHT),NationalActionPlanforSalinityandWaterQuality(NAP)andtheNationalLandcareProgram(NLP).On1July2008,theseprogramswerereplacedby“Caring for our Country”whichseekstointegratetheestablishedfundingmodels.

TheUpperSouthEastisthelargestareaaffectedbyandatriskofdrylandsalinityinSouthAustralia.TheUSEProgramwasdevelopedintheearly1990stoaddresscommunityconcernsaboutdrylandsalinity,waterloggingandecosystemfragmentationanddegradation.Measuresadoptedtoaddresstheseconcernsincludedrainage,saltlandagronomy,revegetationandwetlandmanagement.Theprogramisclosetocompletionandwillcontinuetoprovideagronomic,hydrologicalandbiologicalprogramsintheregion.ItskeyachievementsareoutlinedintheCriticalProgramsectionofthisreportorformoreinformationvisitwww.dwlbc.sa.gov.au/land/programs/use/index.html

Dryland Sal in i ty

158 S TAT E O F T H E E N V I R O N M E N T R E P O RT 2 0 0 8

LAND

In areas where profitable land use options basedonperennialplantsexist,large-scaleon-groundchangehasbeenachieved.Forexample,intheCoorongDistrictatthelowerreachesoftheSouthAustralianMurrayDarlingBasin,salinitywasrecognisedasamajorproblemintheearly1990s.

InconsultationwithlocallandholdersaLocal Action Plan(LAP)wasdeveloped,includingthetargetofachievinga20%reductioninrechargeby2003.On-groundactiontocontroltheproblembeganin1997withfundsfromtheNHTandsubsequentlytheNAP.By2003,theLAPCommitteehadestablishedorprotectedapproximately100,000Haofperennialvegetationtocontroldrylandsalinity,achievingtherechargereductiontargetsetintheLAP(seeCaseStudy).

TheotherNRMBoardsmaintainavarietyofprogramstargetingthesalinitythreat.TheNorthernandYorke,andEyrePeninsulaNRMBoards,supportedbytheDepartmentofWater,LandandBiodiversityConservation(DWLBC),havesetupon-groundworksprogramspromotingestablishmentofperennials,theprotectionandinvigorationofremnantnativevegetationandlivingwithsaltoptionssuchas‘SustainableGrazingonSalineLand’sites.TheNorthernandYorke,andKangarooIslandNRMBoardsarealsoinstallingmajornewpiezometernetworksformonitoringgroundwater.TheKangarooIslandNRMBoardsupportsvariousprogramsforreducingrechargetothegroundwatersystemsincludingclayspreading,establishmentofperennials,protectionandinvigorationofremnantnativevegetationtogetherwithengineering(drainage)initiatives.

Furthermore,someNRMRegionscommissionedtheRuralSolutionsSASalinityTeam,withsupportfromtheDWLBCSoilandLandProgram,todevelopsalinityriskmodellingaspartoftheRegionalNRMdevelopmentprocess.Variousmodelshighlightedthelandandbiodiversityassetsinregionsatthegreatestriskofsalinityintheeventofrisingwatertables.

Inmanyofthebroadscaleagriculturalareasofthestate,suchastheMurrayMallee,EyrePeninsulaandNorthernandYorke Peninsula, practical and profitable optionsforrechargemanagementneedtobedeveloped.ThestategovernmententeredintopartnershipwiththeCRCforplant-basedmanagementofdrylandsalinityfrom2001-2007.ManyCRCresearch programs have made significant

progressintodevelopingnewlandusesystems for profitable use of saline and waterloggedland.Theresearchhascontinuedtoinvestigateopportunitiestodevelopcommerciallyviablefarmingandforestrysystemsthatwillreducerecharge.Forexample,akeyprojectisFloraSearch,whichhasmadeconsiderableprogressinidentifyingandselectingsuperiorperennialtreesandshrubsthatcouldcontributetoalternativelandmanagementsystemsforlowtomediumrainfallregions.Moretraditionalresearchisalsocontinuingontheuseofcommercialcrops,suchaslucerne,formanagingrecharge.

ManyCRCresearchprogramswillcontinueinthenewFutureFarmIndustries(FFI)CRC,whichbeganoperationinJuly2007.ThroughDWLBCandtheSouthAustralianResearchandDevelopmentInstitute(SARDI),thestategovernmenthasenteredintoanewpartnershipwiththeFFICRC.TheimportantFloraSearchprojectwillcontinue,linkingwithotherCRCprojects to develop profitable options forrechargemanagementatthescalerequiredtoaddressdrylandsalinityandothernaturalresourcemanagementissues, specifically soil erosion and biodiversity.

TheSustainableGrazingonSalineLandProducerParticipatoryResearchandDevelopmentprogramisanothersuccessfuljointindustryandgovernmentpartnershipthatcompletedresearchin2007 on profitable and sustainable uses oflandaffectedbydrylandsalinity.AsaresultofthisandotherinitiativesintheUpperSouthEast,morethan80%oftheaffectedareahashadsalttolerantpastureestablished,andperennialpasturessuchaslucerne,havebeenestablishedonapproximately30%oftheagriculturalland.

Ton

ne

s/d

ay

Natural

IrrigationClearance of native vegetation

2,000

1,750

1,500

1,250

1,000

750

500

250

0

1968

1998

2008

2018

2028

2038

2048

2058

2068

2078

2088

2098

Source: MDBC Salinity Registers data. Version 21/12/2007

Figure 4.12: Salt load to River Murray

in South Australia

159S TAT E O F T H E E N V I R O N M E N T R E P O RT 2 0 0 8

The Coorong District CouncilTheCoorongDistrictCouncilcovers8,835squarekilometresinSouthAustralia’sUpperSouthEastandLowerMurraylands(geographically,thestate’slargestCouncil)Themajorthreatstothedistrict’snaturalresourcemanagement(NRM)includedrylandsalinity,declinesinnativevegetation,wetlandsandgroundwaterqualityandquantity,windandwatererosionandunsustainableagriculturalpractices.

Thecouncil’sLocalActionPlan(LAP)Committeewasformedin1995toproduceaplanthataddressimgthedistrict’sNRMissueswithaninitialfocusondrylandsalinity.Theplanwasreleasedin1997andasaresult,morethan120,000Haofon-groundworkshavebeencarriedoutover11years,withfundingassistancefromtheCommonwealthgovernment’sNaturalHeritageTrustandNationalActionPlanforSalinityandWaterQuality.

ThecommunityhasembracedtheCouncil’sLAPwithmorethantwothirdsoflandholdersactivelyparticipatinginprojectsaimedatreducinggroundwaterlevelsandimprovedbiodiversity.Projectsincluderevegetation(Photos1and2),perennialpastures(Photo3),foddershrubs(Photo4),farmforestry,saltlandpastures,andprotectionofremnantnativevegetationandwetlands.Inaddition,participationratesfromlocallandholdersintheongroundworksexceeded75%.Whilemuchoftheestablishedperennialvegetationislucerne,largeareasofnativevegetationhavebeenfencedandprotectedfromgrazing.Tosustainthismomentum,theLAPCommittee runs workshops and fields days and produces factsheets and newsletters to maximise the participation rate and the benefits of on ground.

TheCouncilhasbeenapioneerinthedevelopmentofinlandaquacultureusingsalinegroundwater,demonstratingthepotentialofaviableaquacultureindustryaswell as delivering environmental benefits by alleviating rising water tables

Direct seeded revegetation at Salt Creek 2001.

Lucerne at Tintinara to reduce recharge.

Same site at Salt Creek after 3 years.

Saltbush at Coomandook.

Dryland Sal in i ty

160 S TAT E O F T H E E N V I R O N M E N T R E P O RT 2 0 0 8

What more should we be doing?

References

TheEnvironmentProtectionAuthorityrecommends:

R4.4 Usetargetedrevegetationtobettermanagesurfacewaterand groundwater, and achieve both economic and biodiversity benefits.

Barnett,S.andYan,W.(2006).Review of Mallee clearing saltloads to the River Murray in SA – 2005. South Australia. DepartmentofWater,LandandBiodiversityConservation,GovernmentofSouthAustralia,Adelaide.

Barnett,S.R(2000)Extent and Impacts of Dryland Salinity in South Australia. ReportfortheNationalLandandWaterResourcesAudit.Adelaide,DepartmentforWaterResources,GovernmentofSouthAustralia

Murray-DarlingBasinMinisterialCouncil(2001)Basin Salinity Management Strategy 2001–2015,MurrayDarlingBasinCommission,Canberra,ACT.

BureauofRuralSciences(2006)Indicators of Land Salinity assessment, September 2006, BureauofRuralSciences(BRS)ProjectfortheNationalLand&WaterResourcesAudit(NLWRA)aspartoftheAustralianSalinityInformationProject(ASIP),GovernmentofAustralia

BureauofRuralSciences(2007)Salinity Indicator Trials – National Summary Report, April 2007,GovernmentofAustralia

Coram,J.,Dyson,P.andEvans,R.(2001).An Evaluation Framework for Dryland Salinity,reportpreparedfortheNationalLand&WaterResourcesAudit(NLWRA),sponsoredbytheBureauofRuralSciences,NationalHeritageTrust,NLWRA

andNationalDrylandSalinityProgram,GovernmentofAustralia,Canberra

Dooley,T,Kuys,J,Ciganovic,P,Henschke,CandWalker,G(2004)Case Study Review Coorong District LAP Salinity Management Strategy,RuralSolutionsSA,Adelaide

Durkay,M.S.,2007.PhD study into drain effectiveness (commenced 2004) in prep.UniversityofAdelaide

DepartmentofWater,LandandBiodiversityConservation(InPress). 2007 Saltland Snapshot Northern and Yorke.,GovernmentofSouthAustralia,Adelaide

DepartmentofWater, Land and Biodiversity Conservation (In Press). 2007 Saltland Snapshot Kangaroo Island. GovernmentofSouthAustralia,Adelaide

DepartmentofWater,LandandBiodiversityConservation(InPress).2007 Saltland Snapshot Eyre Peninsula. GovernmentofSouthAustralia,Adelaide

DepartmentofWater,LandandBiodiversityConservation(InPress). 2007 Saltland Snapshot Adelaide & Mount Lofty Ranges.GovernmentofSouthAustralia,Adelaide

DepartmentofWater,LandandBiodiversityConservation(InPress).Monitoring and Evaluation (M&E) of Land Salinity in SA.GovernmentofSouthAustralia,Adelaide

DepartmentofWater,LandandBiodiversityConservation,(2006).The Upper South East Program ‘Confronting the

LAND

Alignment of Recommendations with South Australia’s Strategic Plan targets

ForfurtherdetailonSouthAustralia’sStrategic Plan visitwww.stateplan.sa.gov.au

R4.4

Growing Prosperity

Improving Wellbeing

Attaining Sustainability T3.1, T3.2, T3.5, T3.10, T3.11

Fostering Creativity and Innovation

Building Communities

Expanding Opportunities

161S TAT E O F T H E E N V I R O N M E N T R E P O RT 2 0 0 8

questions’ GovernmentofSouthAustralia,Adelaide. www.dwlbc.sa.gov.au/assets/files/ib_USEfactsheetfinalFeb06.pdf

DepartmentofWater,LandandBiodiversityConservation,(2005).Land and Soil Spatial Data for Southern South Australia – GIS format. Soil and Land Program,GovernmentofSouthAustralia,Adelaide[CDROM].

Dooley,T.(2003).Salinity & Biodiversity - Review of SA regional planning and investment concerning the impacts of salinity and salinity management on biodiversity values, Undertaken as part of the NAP Dryland Salinity Response Team Project, DepartmentofWater,LandandBiodiversityConservation,Adelaide

Henschke,C.J.andWright,S.(2007)Impact of 2005 bushfire on salinity in the Cummins-Wanilla Basin on EP. Draft report to Department of Water, Land and Biodiversity Conservation, GovernmentofSouthAustralia,Adelaide.

Henschke,C.J.,Evans,T.,Liddicoat,C.andDooley,T.J.(2005)Technical update for the Narroonda research catchment, KangarooIslandNaturalResourceManagementBoard,SouthAustralia

MorrisK.L.,StrugnellT.,andDunsfordA.,2004. Agronomic Component of Drainage Trial Monitoring on the Fairview Drain.ReportpreparedforUpperSouthEastDrylandSalinity&FloodManagementPlan.

NationalLandandWaterResourcesAudit(NLWRA),(2001).Australian Dryland Salinity Assessment 2000: extent of impacts, processes, monitoring and management options. NationalLandandWaterResourcesAudit,GovernmentofAustralia,ACT.

NationalLandandWaterResourcesAudit(NLWRA),(2004).Assessment and data and availability to address natural resource condition and trend indicators Part C: Evaluation of indicator protocols, September 2004,NationalLandandWaterResourcesAudit,GovernmentofAustralia,ACT.

SenateEnquiry(2005).Extent and economic impacts of salinity. Environment,Communications,InformationTechnologyandtheArtsReferencesCommittee,GovernmentofAustralia,ACTwww.aph.gov.au/hansard

SoilConservationCouncilofSouthAustraliaandPrimaryIndustriesandResourcesSouth Australian Dryland Salinity Strategy(2001),Governmentof

SouthAustralia,Adelaide.

DepartmentofWater,LandandBiodiversityConservationStateNatural Resources Management Plan 2006 (2006).GovernmentofSouthAustralia,Adelaide.

EnvironmentProtectionAgency(2003),State of the Environment Report for South Australia 2003,Adelaide.GovernmentofSouthAustralia,Adelaide

Telfer,A.,White,G.,andSantich,M.(2002).Upper South-east Drains – Effectiveness Trial Stage 1 assessment of impacts.PrimaryIndustriesandResourcesSA,GovernmentofSouthAustralia,Adelaide.

Coorong Districts Council www.coorong.sa.gov.au

Upper South East Dryland Salinity and Flood Management Program www.dwlbc.sa.gov.au/land/programs/use/index.html

Department of Water, Land and Biodiversity Conservation (Dryland Salinity)www.dwlbc.sa.gov.au/land/dryland/index.html

National Land and Water Resources Audit: Land Salinity www.nlwra.gov.au/Natural_Resource_Topics/Land_Salinity/index.aspx

National Action Plan for Salinity and Water Quality www.napswq.gov.au/

Regional Natural Resources Management Boards www.nrm.sa.gov.au/

The 2nd International Salinity Forum www.internationalsalinityforum.org/

Future Farm Industries CRC www.futurefarmcrc.com.au/

Further information

Dry land Sal in i ty

R4.4

Growing Prosperity

Improving Wellbeing

Attaining Sustainability T3.1, T3.2, T3.5, T3.10, T3.11

Fostering Creativity and Innovation

Building Communities

Expanding Opportunities


Recommended