LAND-OCEAN INTERACTIONS IN THE COASTAL ZONE (LOICZ) Core Project of the International Geosphere-Biosphere Programme: A Study of Global Change (IGBP) The National Centre for Marine Research, NCMR, of the Greek Ministry of Development The European Commission Energy, Environment and Sustainable Development Programme, Sub-programme Environment and Sustainable Development and United Nations Environment Programme (UNEP) supported by the Global Environment Facility (GEF) COASTAL AND ESTUARINE SYSTEMS OF THE MEDITERRANEAN AND BLACK SEA REGIONS: CARBON, NITROGEN AND PHOSPHORUS FLUXES Compiled and edited by V. Dupra, S.V. Smith, J.I. Marshall Crossland and C.J. Crossland LOICZ REPORTS & STUDIES NO. 19
Transcript
LAND-OCEAN INTERACTIONS IN THE COASTAL ZONE (LOICZ)Core Project of the
International Geosphere-Biosphere Programme: A Study of Global Change (IGBP)
The National Centre for Marine Research, NCMR, of the Greek Ministry of Development
The European Commission Energy, Environment and Sustainable Development Programme,Sub-programme Environment and Sustainable Development
and
United Nations Environment Programme (UNEP)supported by the Global Environment Facility (GEF)
COASTAL AND ESTUARINE SYSTEMS OF THE MEDITERRANEAN AND BLACKSEA REGIONS: CARBON, NITROGEN AND PHOSPHORUS FLUXES
Compiled and edited by V. Dupra, S.V. Smith, J.I. Marshall Crossland and C.J. Crossland
LOICZ REPORTS & STUDIES NO. 19
COASTAL AND ESTUARINE SYSTEMS OF THE MEDITERRANEAN AND BLACK SEAREGIONS:
CARBON, NITROGEN AND PHOSPHORUS FLUXES
V. Dupra & S.V. SmithSchool of Ocean and Earth Science and Technology
Honolulu, Hawaii, USA
J.I. Marshall Crossland & C.J. CrosslandLOICZ International Project Office
Texel, The Netherlands
The National Centre for Marine Research, NCMR, of the Greek Ministry of Development,
The European Commission Energy, Environment and Sustainable Development Programme,Sub-programme Environment and Sustainable Development
andUnited Nations Environment Programme
supported by financial assistance from the Global Environment Facility
LOICZ REPORTS & STUDIES NO. 19
Published in the Netherlands, 2001 by:LOICZ International Project OfficeNetherlands Institute for Sea ResearchP.O. Box 591790 AB Den Burg - TexelThe NetherlandsEmail: [email protected]
The Land-Ocean Interactions in the Coastal Zone Project is a Core Project of the “International Geosphere-Biosphere Programme: A Study Of Global Change” (IGBP), of the International Council of Scientific Unions.
The LOICZ IPO is financially supported through the Netherlands Organisation for Scientific Research by: theMinistry of Education, Culture and Science (OCenW); the Ministry of Transport, Public Works and WaterManagement (V&W RIKZ); and by The Royal Netherlands Academy of Sciences (KNAW), and TheNetherlands Institute for Sea Research (NIOZ).
This report and allied workshop are contributions to and supported by the:EU Commission’s “Energy, Environment and Sustainable Development” Programme (Contract EVK1-CT-2000-60012), Sub-programme Environment and Sustainable Development and the project cluster “European LandOcean Interaction Studies, ELOISE” supported by the European Commission Directorate General for Research;and
“The Role of the Coastal Ocean in the Disturbed and Undisturbed Nutrient and Carbon Cycles” (Project NumberGF 1100-99-07), implemented by LOICZ with the support of the United Nations Environment Programme andfinancial assistance from the Global Environment Facility, GEF.
COPYRIGHT 2001, Land-Ocean Interactions in the Coastal Zone Core Project of the IGBP.
Reproduction of this publication for educational or other, non-commercial purposes is authorisedwithout prior permission from the copyright holder.
Reproduction for resale or other purposes is prohibited without the prior, written permission ofthe copyright holder.
Citation: Dupra, V., Smith, S.V., Marshall Crossland, J.I. and Crossland, C.J. 2001 Coastal andestuarine systems of the Mediterranean and Black Sea regions: carbon, nitrogen andphosphorus fluxes. LOICZ Reports & Studies No. 19, i+101 pages, LOICZ, Texel, TheNetherlands.
ISSN: 1383-4304
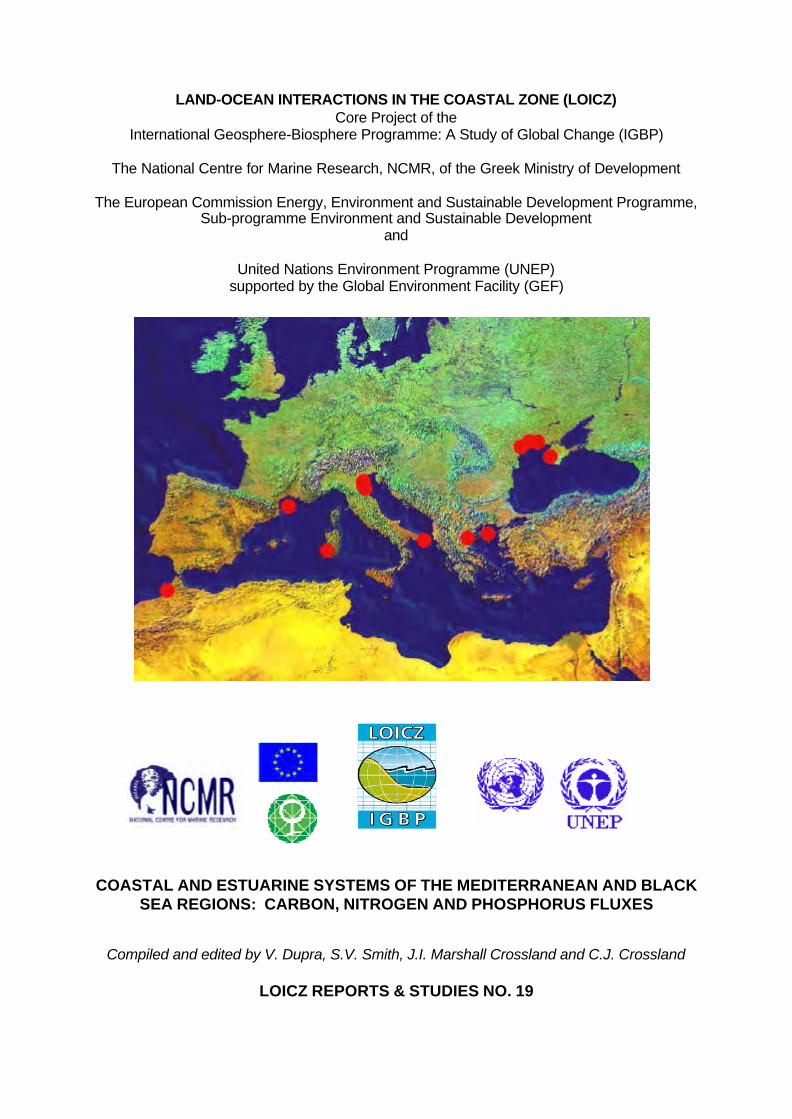
Cover: The cover shows an image of Europe (GTOPO30 elevation map), with the budgeted systemscircled.
Disclaimer: The designations employed and the presentation of the material contained in this report do notimply the expression of any opinion whatsoever on the part of LOICZ, the IGBP, the NCMR, theEuropean Commission or UNEP concerning the legal status of any state, territory, city or area,or concerning the delimitation of their frontiers or boundaries. This report contains the viewsexpressed by the authors and may not necessarily reflect the views of the IGBP, the EuropeanCommission or UNEP. Neither IGBP, NCMR, the European Commission, UNEP nor any personacting on behalf of them is responsible for the use which might be made of the followinginformation.
The LOICZ Reports and Studies Series is published and distributed free of charge to scientists involved in globalchange research in coastal areas.
i
TABLE OF CONTENTS
1. OVERVIEW
2. COASTAL SYSTEMS OF GREECEThe northern Aegean Sea and Thermaikos Gulf2.1 Inner Thermaikos Gulf (NW Aegean Sea, Eastern Mediterranean): a preliminary
approach – K. Pagou., E. Krasakopoulou., A. Pavlidou, G. Assimakopoulou, H.Kontoyiannis and Ch. Anagnostou
2.2 North-eastern Aegean Sea – E. Krasakopoulou, V. Zervakis, E. Souvermezoglouand D. Georgopoulos
3. COASTAL SYSTEMS OF UKRAINEThe north-western shelf of the Black Sea3.1 Dnieper Bug Estuary system, north-western Black Sea – Inna Yurkova3.2 Dniester Estuary, north-western Black Sea – Inna Yurkova3.3 Donuslav River Estuary, north-western Black Sea – Inna Yurkova3.4 Malii Adzalik Estuary, north-western Black Sea – Inna Yurkova
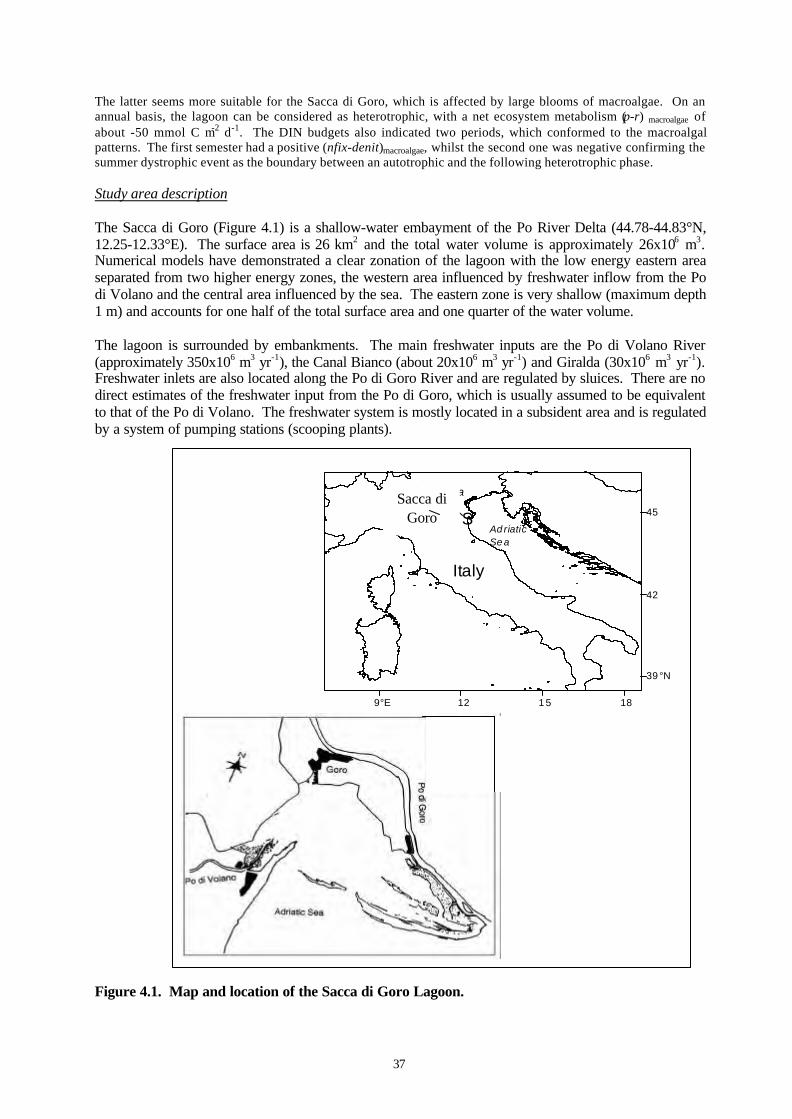
4. COASTAL SYSTEMS OF ITALYNorthern Adriatic Sea region4.1 Sacca di Goro Lagoon – P. Viaroli, G. Giordani, E. Cattaneo, J.M. Zaldívar and
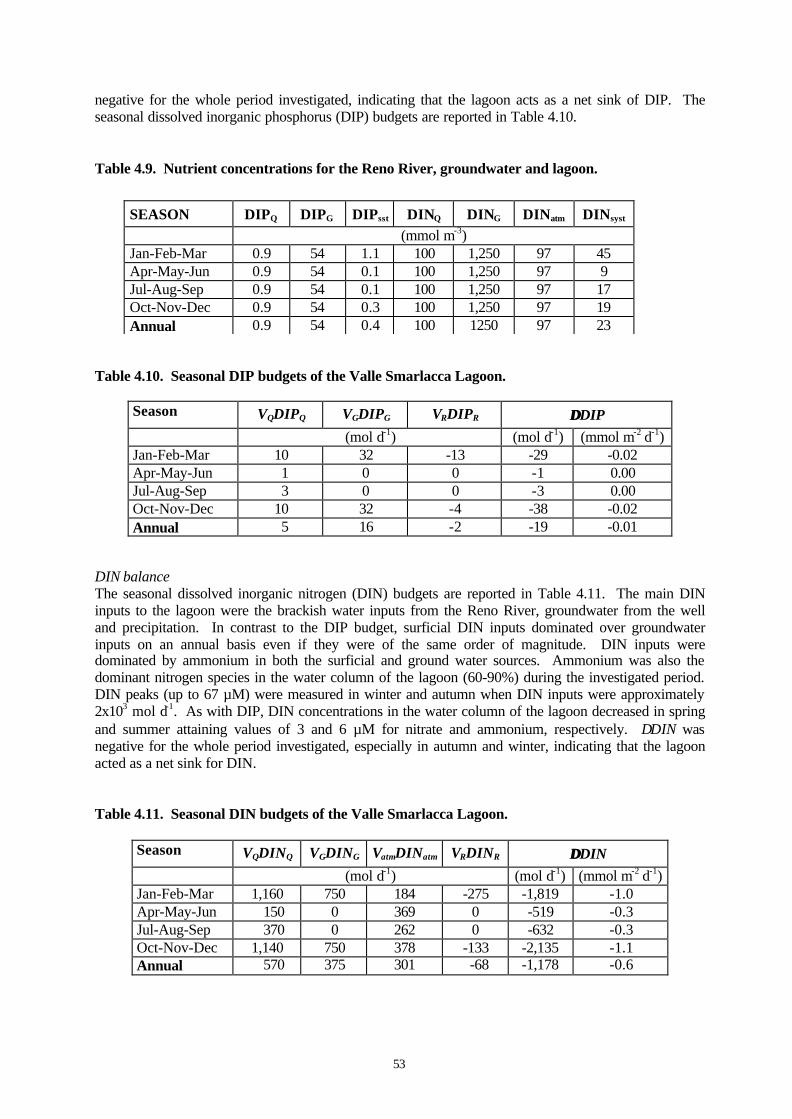
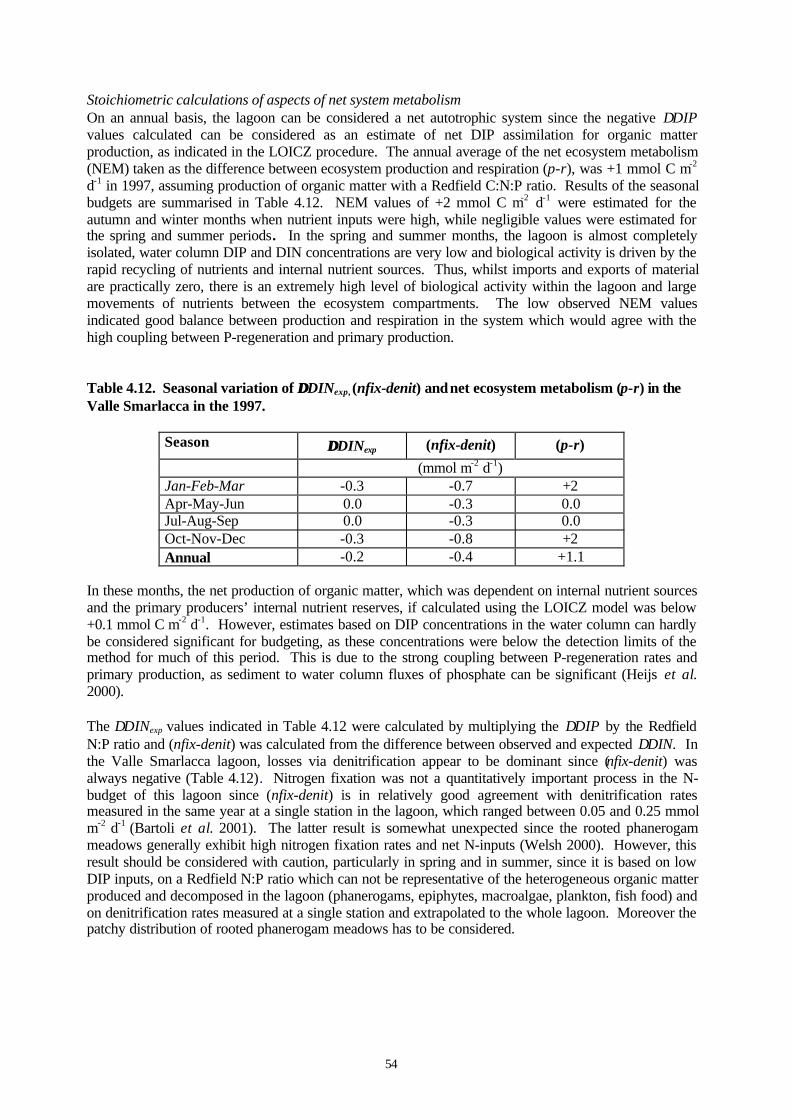
C.N. Murray4.2 Valle di Comacchio Lagoon – P. Viaroli and G. Giordani4.3 Valle Smarlacca (sub-system of the Valli di Comacchio lagoons) – P. Viaroli and
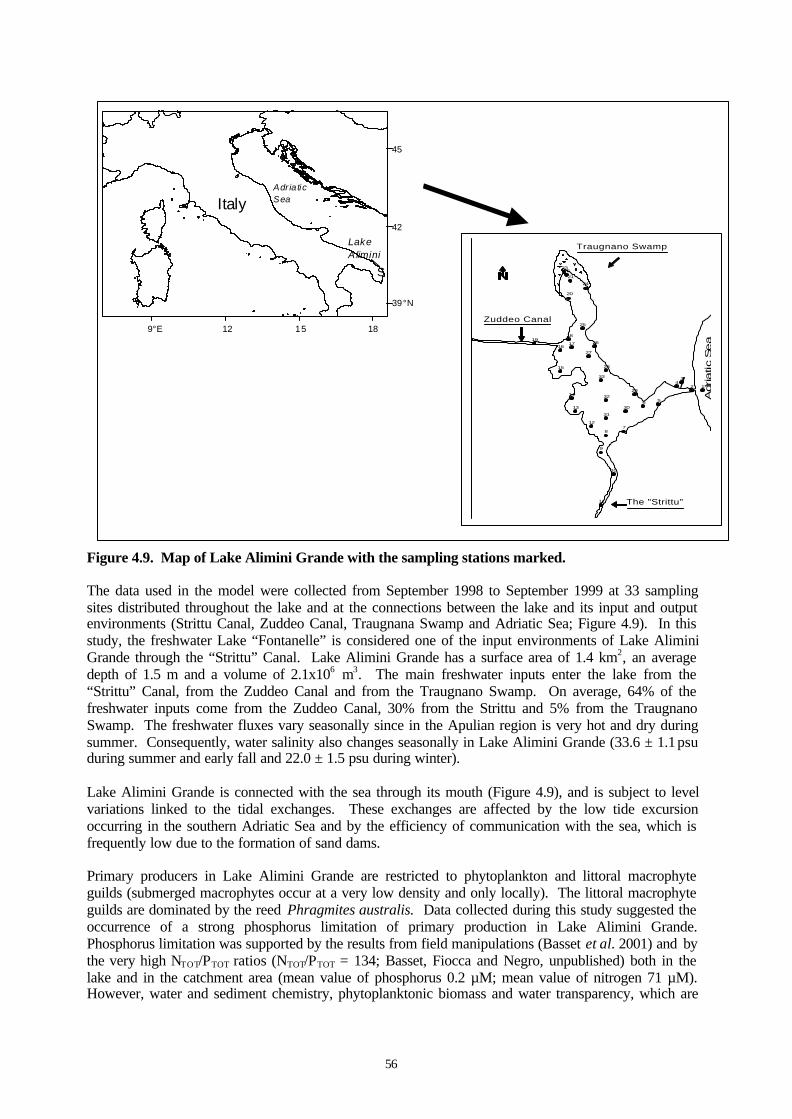
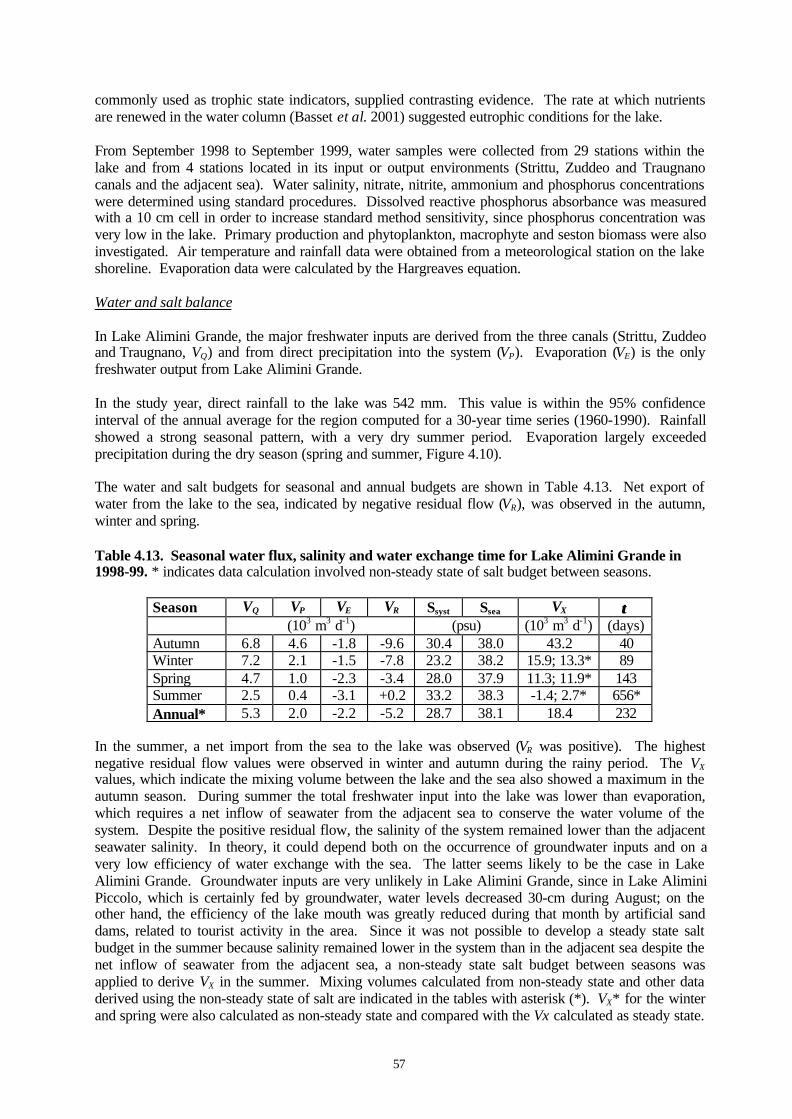
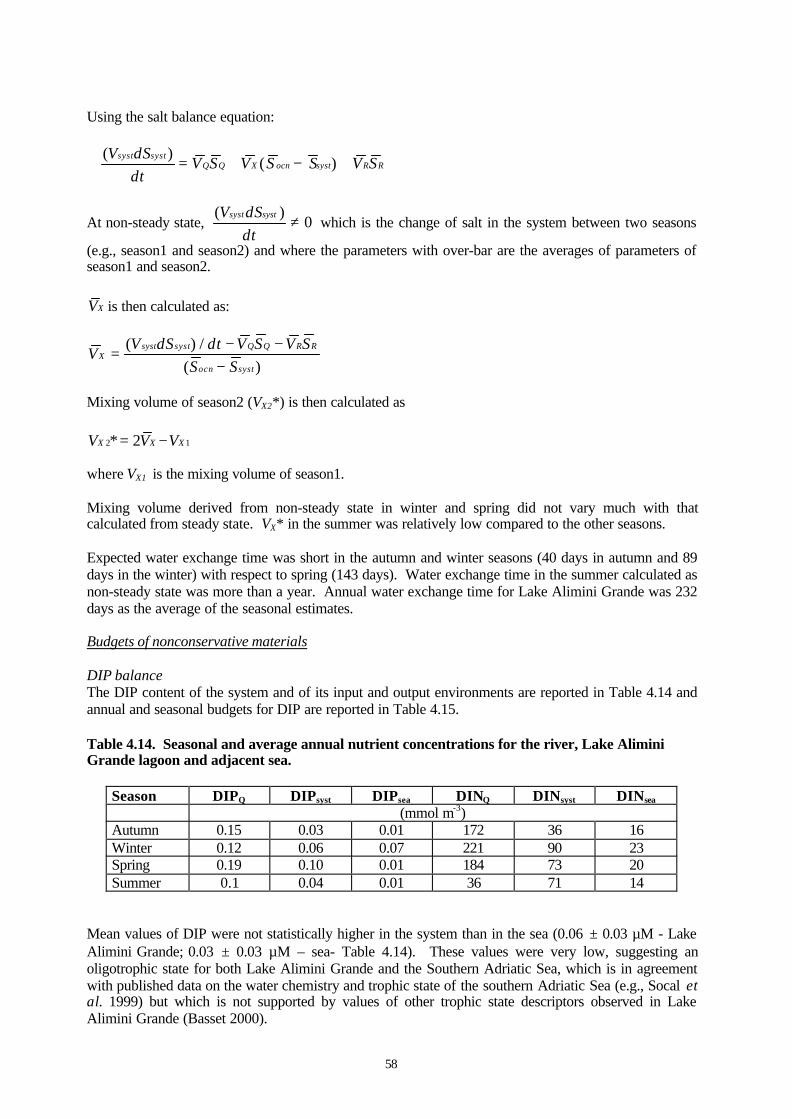
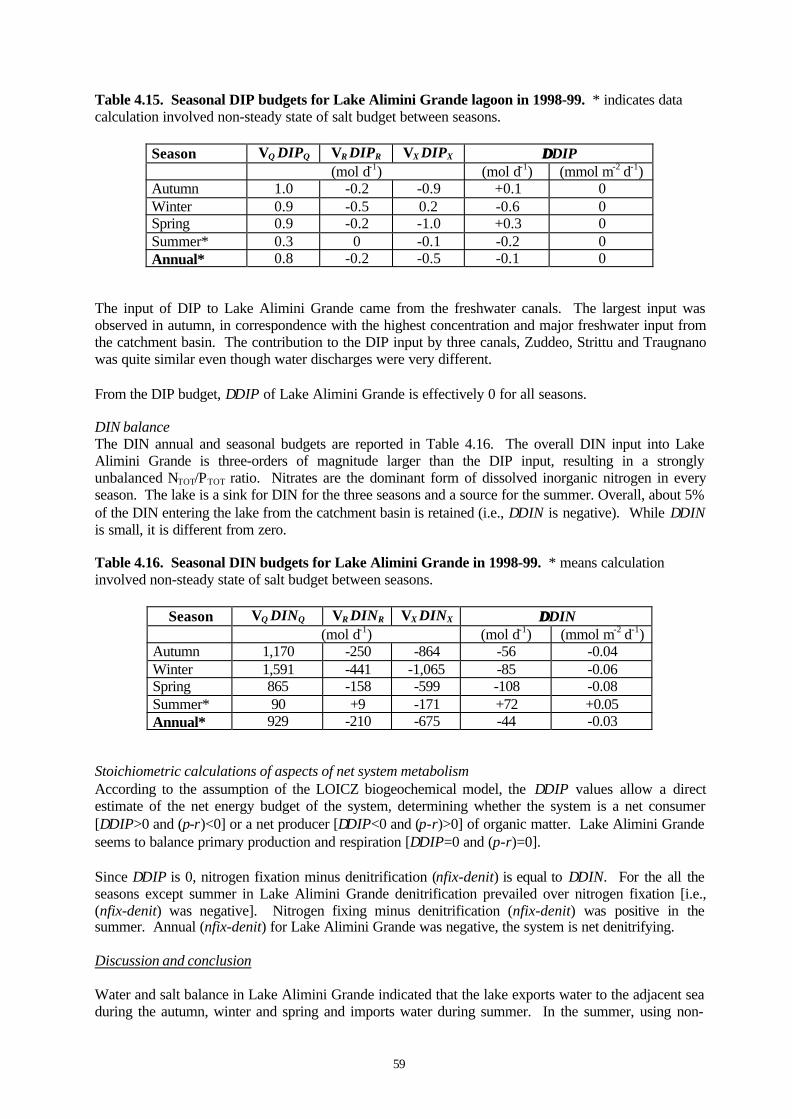
G. GiordaniSalento sub-region, Apulia (southern Italy)4.4 Lake Alimini Grande – M.R. Vadrucci, A. Fiocca, O. Negro, F. Sangiorgio, A.
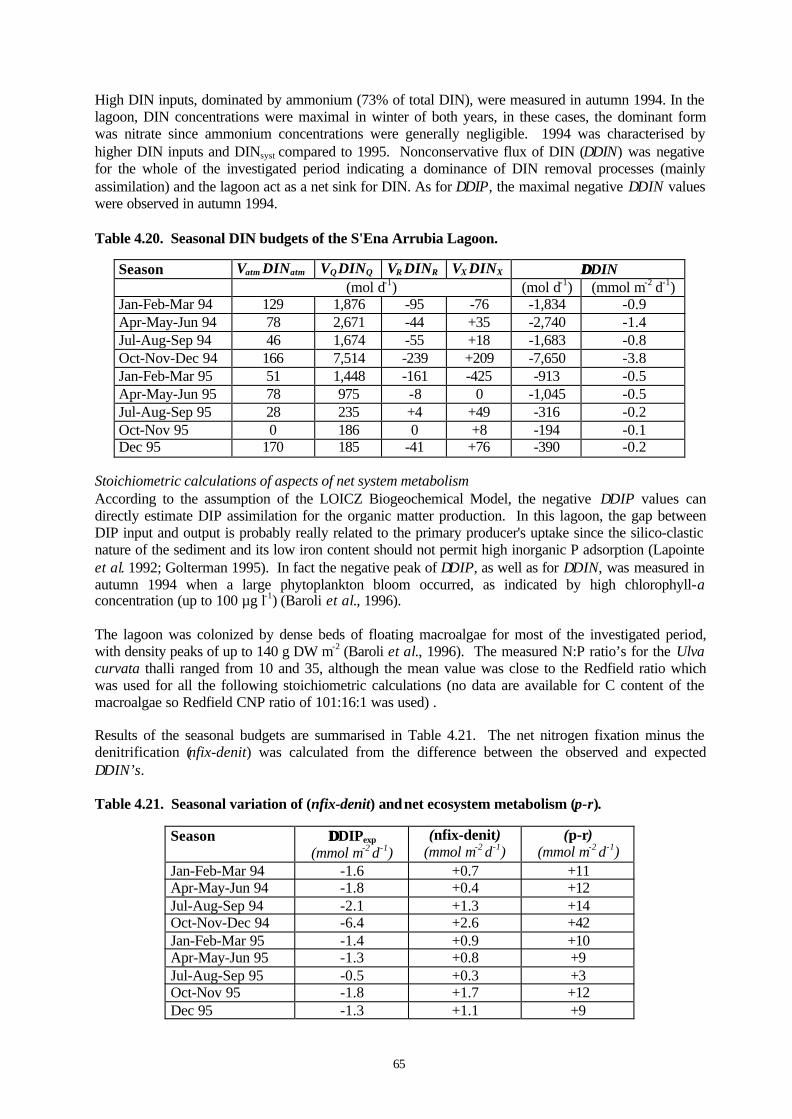
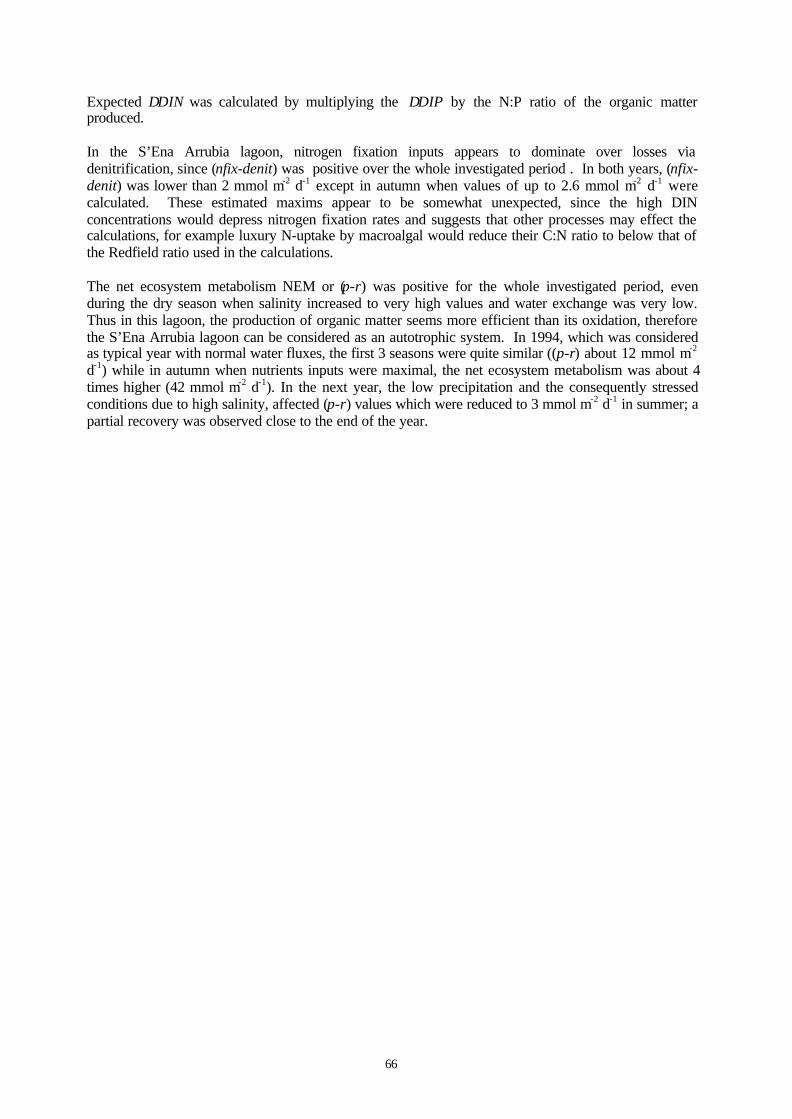
Semeraro and A. BassetOristano province, Sardinia4.5 S’Ena Arrubia Lagoon, western coast of Sardinia – G. Giordani, G. De Falco, M.
Baroli, S. Guerzoni and P. Viaroli
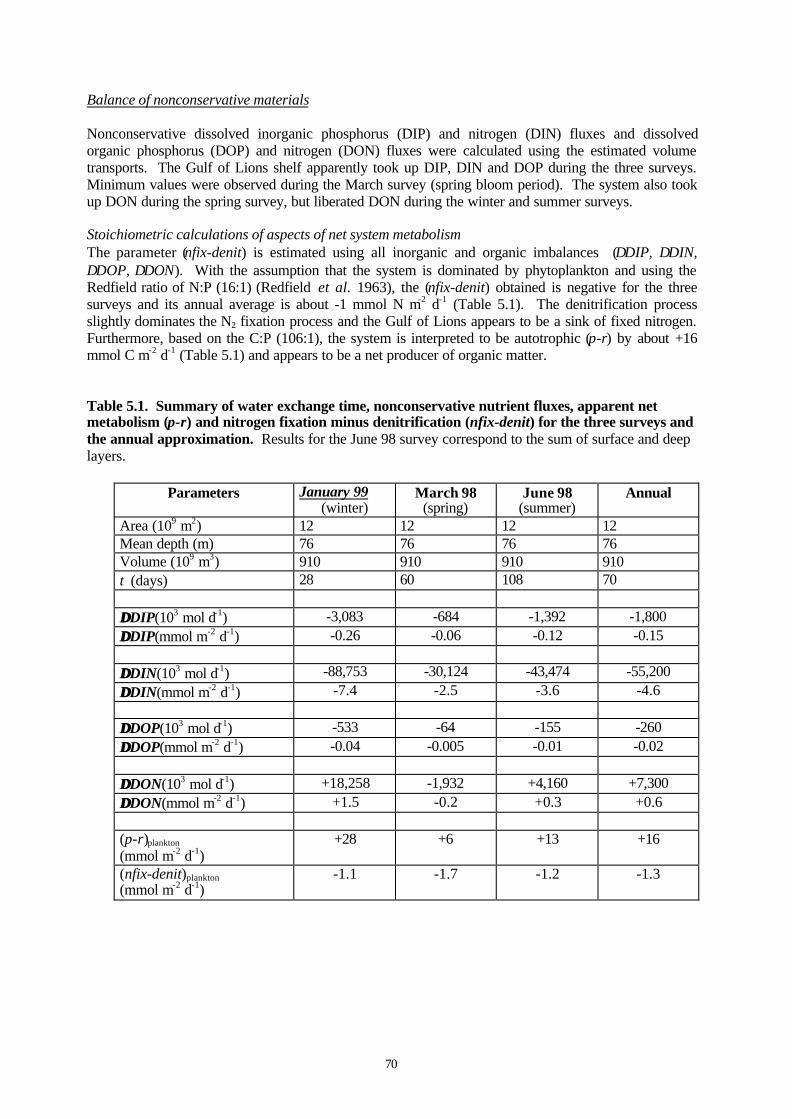
5. COASTAL SYSTEMS OF FRANCEWestern Mediterranean Sea5.1 Gulf of Lions – X. Durrieu de Madron, L. Denis, F. Diaz, N. Garcia, C. Guieu,
C. Grenz, M.D. Loÿe -Pilot, W. Ludwig, T. Moutin and P. Raimbault
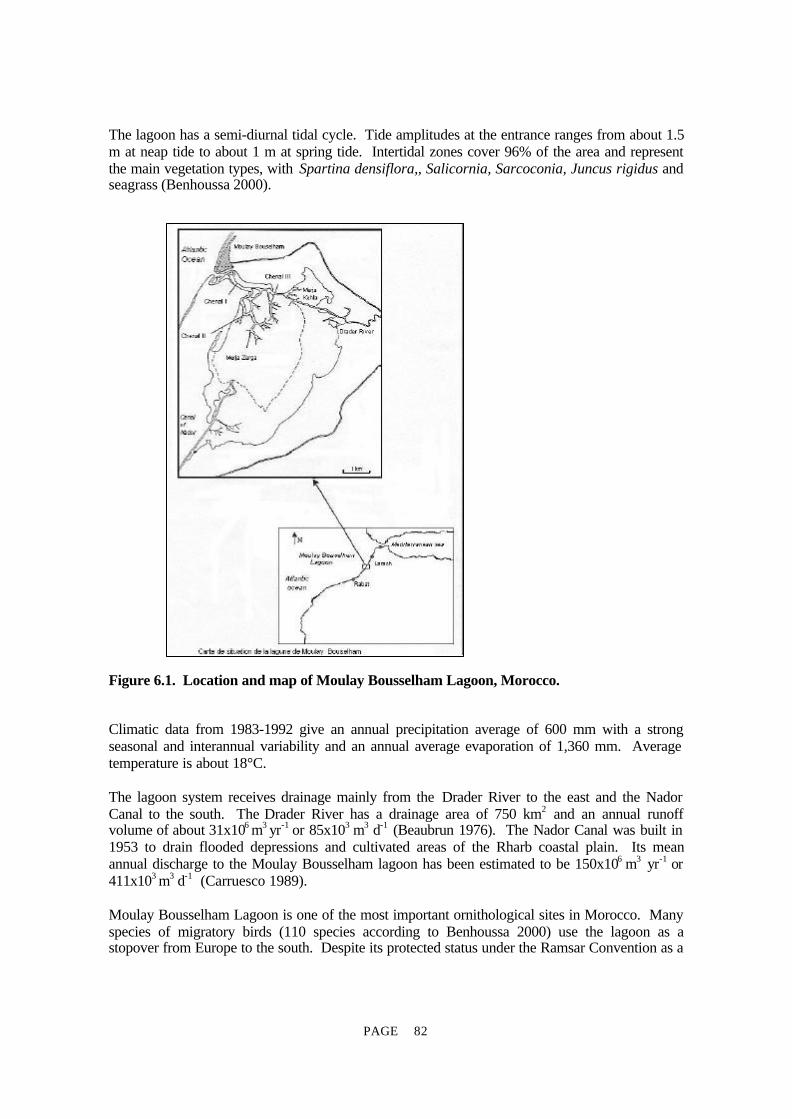
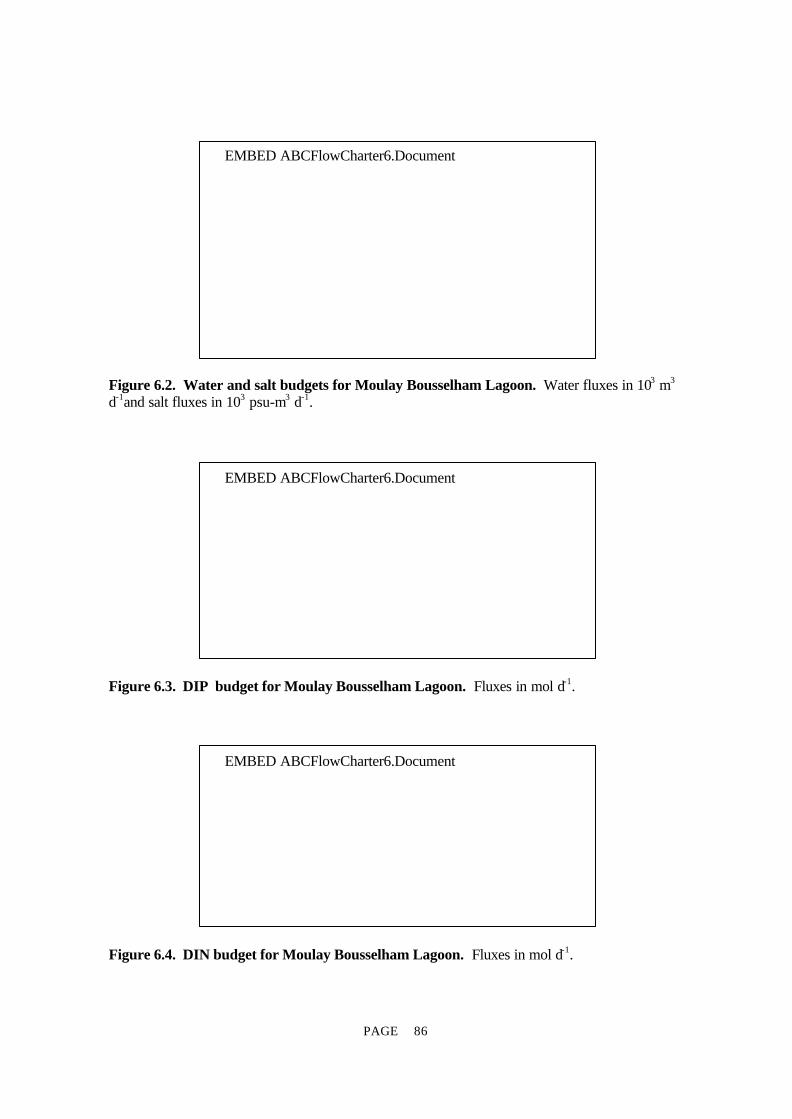
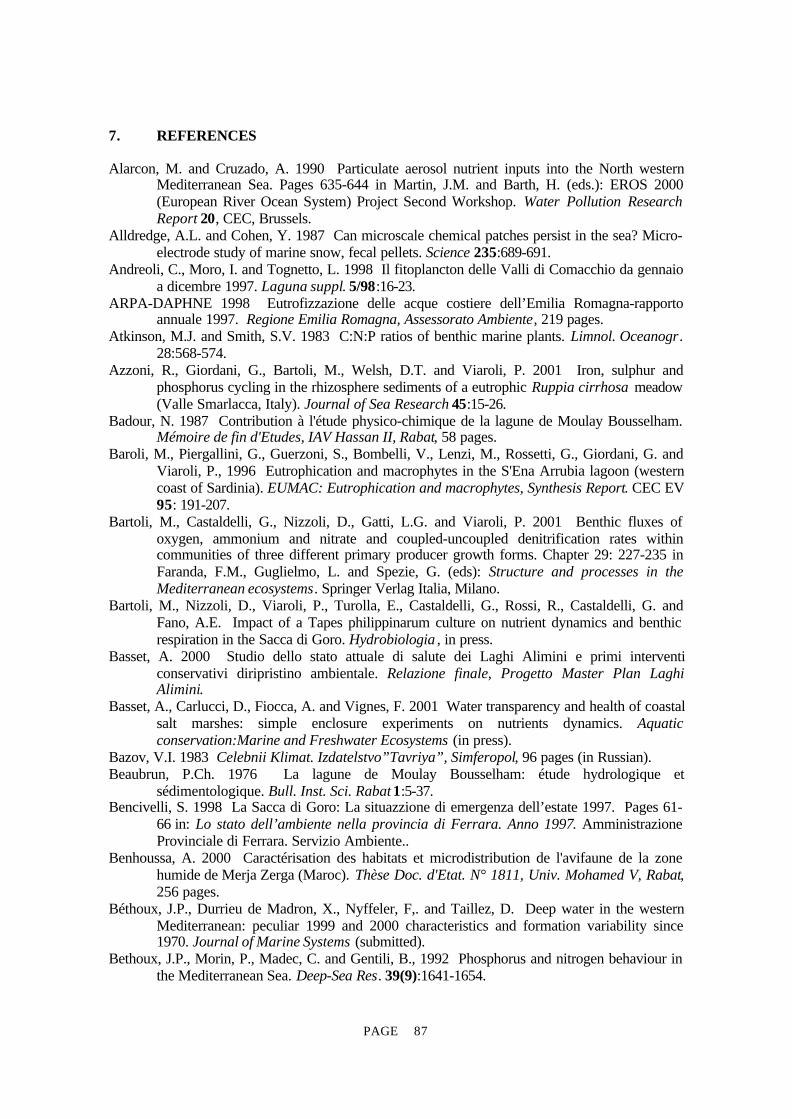
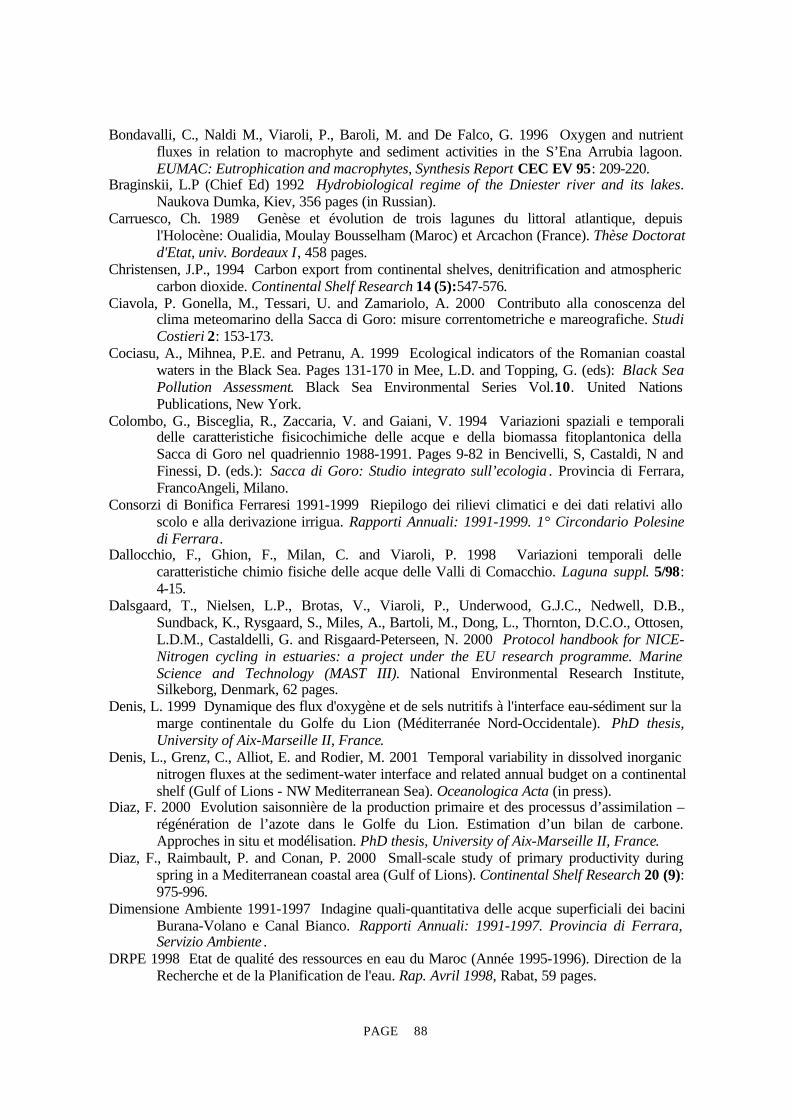
6. COASTAL SYSTEMS OF MOROCCO6.1 Moulay Bousselham Lagoon – M. Snoussi and L. Ouaknine
7. REFERENCES
APPENDICESAppendix I – Workshop ReportAppendix II – List of Participants and Contributing AuthorsAppendix III – Workshop AgendaAppendix IV – Terms of Reference for the WorkshopAppendix V – Glossary of Abbreviations
PAGE
1
666
12
181820252933
363636
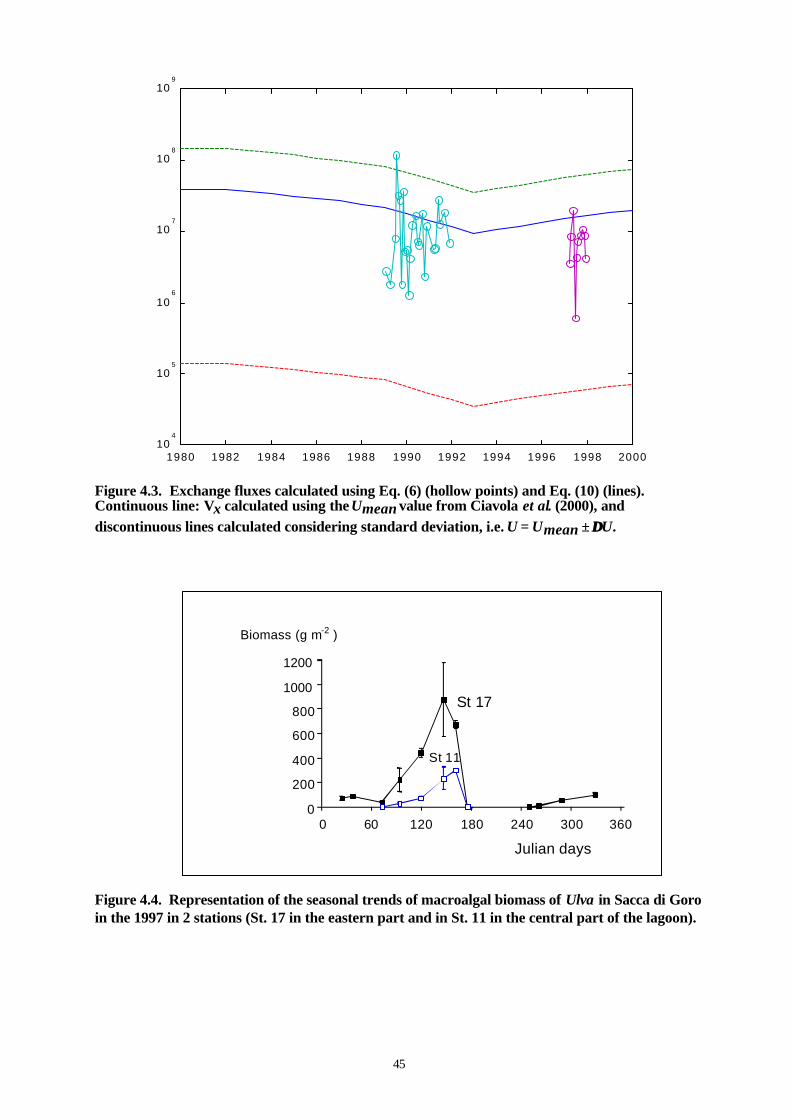
4550
5454
6161
676767
7777
83
8989929798
101
1
1. OVERVIEW
The key objectives of the Land-Ocean Interactions in the Coastal Zone (LOICZ) core project of theInternational Biosphere-Geosphere Programme (IGBP) are to:
• gain a better understanding of the global cycles of the key nutrient elements carbon (C), nitrogen(N) and phosphorus (P);
• understand how the coastal zone affects material fluxes through biogeochemical processes; and• characterise the relationship of these fluxes to environmental change, including human intervention
(Pernetta and Milliman 1995).
To achieve these objectives, the LOICZ programme of activities has two major thrusts. The first is thedevelopment of horizontal and, to a lesser extent, vertical material flux models and their dynamics fromcontinental basins through regional seas to continental oceanic margins, based on our understanding ofbiogeochemical processes and data for coastal ecosystems and habitats and the human dimension. Thesecond is the scaling of the material flux models to evaluate coastal changes at spatial scales to globallevels and, eventually, across temporal scales.
It is recognised that there is a large amount of existing and recorded data and work in progress aroundthe world on coastal habitats at a variety of scales. LOICZ is developing the scientific networks tointegrate the expertise and information at these levels in order to deliver science knowledge thataddresses our regional and global goals.
The United Nations Environment Programme (UNEP) and Global Environment Facility (GEF) havesimilar interests through the sub-programme: “Sustainable Management and Use of Natural Resources”.LOICZ and UNEP, with GEF funding support, have established a project: “The Role of the CoastalOcean in the Disturbed and Undisturbed Nutrient and Carbon Cycles” to address these mutual interests;this Workshop is the sixth of a series of regional activities within the project. The European Unionthrough its support of the LOICZ-associated ELOISE programme has similar interests in coastalmaterial flux research and, importantly, integration of project-based scientific results to Europeanregional syntheses. Consequently, the EU co-sponsored the workshop, thus providing an opportunityfor a number of key ELOISE scientists to trial the LOICZ approach for system comparisons and to gainan overview of the typological approach to scaling questions.
The Mediterranean and Black Seas are unique marine water bodies subject to strong and changingconditions of human pressures. Large riverine inputs from central and southern European basinsprovide a tapestry of conditions for point source discharges, with variable pollutant and contaminantloads. Submarine groundwater flows have been identified, but rarely quantified for either load or fluxrates. Coastal embayments and lagoon systems occur across a range of scales and are influenced bynatural and human-induced changes in run-off and a variety of point source and diffuse outflows.Differences in water residence times in coastal systems, marked seasonal climatic conditions and avariety of scales for external forcing across the region yield opportunities for “natural experiments” tobetter understand material flux processes and responses. Importantly, there have been a number ofcoastal management policies enacted and enforced in the region that are now in some places reflected indiminishing loads of nutrients. These conditions coupled with the often extensive databases about loadsand systems monitoring provide an opportunity to develop comprehensive “baseline” evaluations fromwhich to establish time-series assessments of coastal system function and response to managementpractices. The African coastline of the Mediterranean region stands in contrast to the northern shoreand systems. Relatively arid conditions with event-driven run-off adds to the contrast of settings.Limited data and information exists about these estuarine and coastal systems.
This Workshop is a first step by LOICZ to gain representative descriptions of the biogeochemicalperformance of the coastal zone ecosystems within the region, in order to address the goals of assessingglobal changes in material flux processes and the human dimension.
2
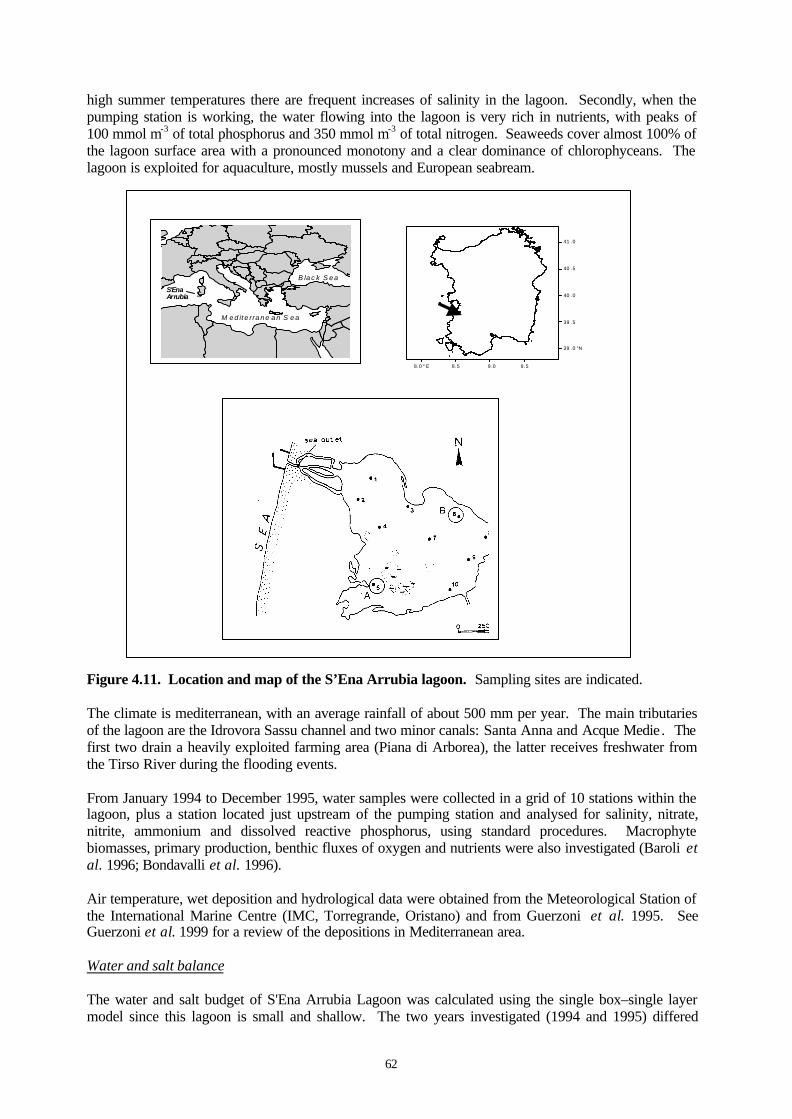
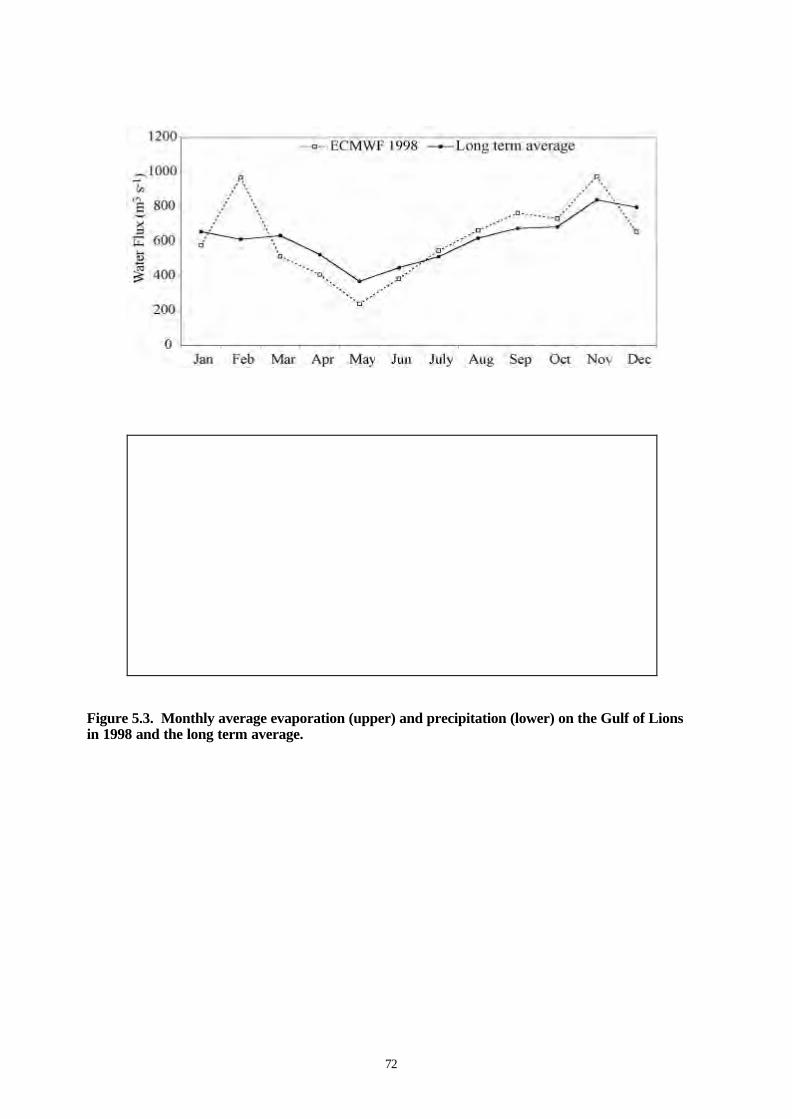
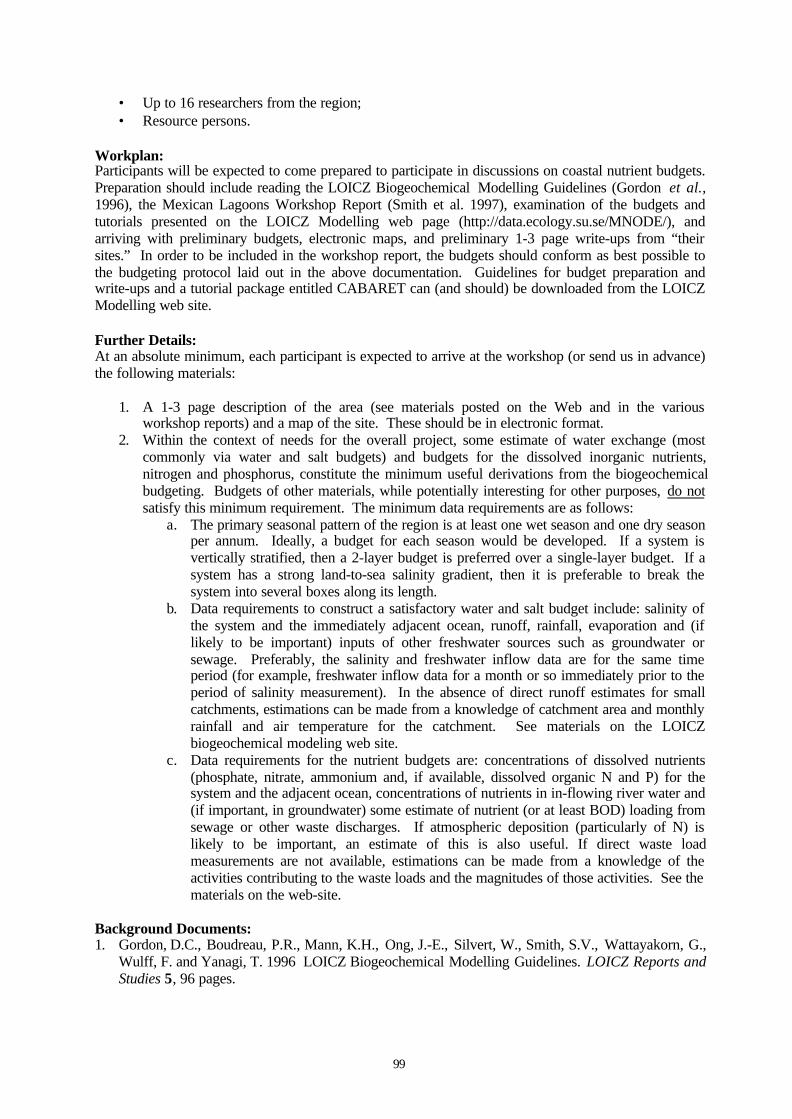
Figure 1.1 Location of budget sites developed by the Mediterranean- Black Sea regionalworkshop.
The Workshop was held in Athens, Greece on 5-8 February 2001. Ms Inna Yurkova, a postgraduatestudent from Ukraine and one of the Workshop participants, was awarded the LOICZ/UNEP RegionalTraining Scholarship to work with Prof. Fred Wulff at the University of Stockholm during May 2001.
The terms of reference for the Workshop (Appendix IV) and the activities (Appendices I and III) arecontained in this report. The resource personnel worked with Workshop participants (Appendix II)from seven countries (Greece, Ukraine, Bulgaria, Italy, France, Turkey and Morocco) to develop andassess biogeochemical budgets for thirteen coastal systems in the region, ranging from estuaries andlagoonal environments to large bays. Further site budgets are being developed at home institutions andwill be posted to the archival LOICZ web site.
The development of typology approaches and the integration of regional data were discussed as a keystrand of the Workshop, and the computer programme for calculation of sites budget and model(CABARET) was tested by the Workshop participants.
The initial plenary session of the Workshop outlined the tools and information developed at earlierworkshops, which provide a platform for site assessment and budget derivations. Presentation of theCABARET computer programme by Dr Laura David added a further dimension to the tools andtraining elements, with participants providing vital feedback for the design of the computer programme.Vilma Dupra demonstrated use of the LOICZ modelling approach. The LOICZ Budgets Modellingweb-site was described by Prof. Fred Wulff and Dennis Swaney, and the pivotal role of the electronicsite and its use by global scientists in making budget contributions to the LOICZ purpose wasemphasised. It was noted that contributing scientists are clearly attributed as authors of their
3
contributed budgets, and that there is provision to update and provide additional assessment of theirbudgets.
The group moved into small working groups to further develop the site budgets, returning to plenarysessions to discuss the budget developments and to debate points of approach and interpretation. Eightbudgets were developed during the Workshop (Figure 1.1, Table 1.1), with additional sites in Ukraineand further sites in Morocco and Italy refined and completed post-workshop. Budgets for sites for theBulgarian coast of the Black Sea and for the Sea of Marmara have been partially developed. Additionalfield samples or data from archival material is required to complete several of the budgets brought tothe Workshop. Those budgets will be added to the LOICZ web-site when they are completed.
The final day of the workshop was spent considering approaches that can be taken to synthesise thelocality budgets and information at regional and global scales. Dennis Swaney described the LOICZtypology tools, including databases and the clustering tool (LOICZView). On-line demonstrations ofthe typology use were made and some of the applications were shown. Potential for application to theEU regional synthesis needs was discussed. The plans for a LOICZ-UNEP training workshop intypology applications, scheduled for July 2001, were outlined and strong interest in attending wasexpressed by participants.
The common element in the budget descriptions is the use of the LOICZ approach to budgetdevelopment, which allows for regional and global comparisons, and application of the typologyapproach. Differences in the descriptive presentations reflect the variability in richness of site data, thecomplexity of the sites and processes, and the extent of detailed process understanding for the sites.Support information for the various locations, describing the physical environmental conditions andrelated forcing functions including the history and potential anthropogenic pressure, is an important partof the budget information for each site. These budgets, data and their wider availability in electronicform (CD-ROM, LOICZ web-site) will provide opportunity for further assessment, comparisons andpotential use with wider scales of patterns in system response and human pressures.
The budget information for each site is discussed individually and reported in units that are convenientfor that system (either as daily or annual rates). To provide for an overview and ease of comparison, thekey data are presented in an “annualised” form and nonconservative fluxes are reported per unit area(Tables 1.1 and 1.2).
Key outcomes and findings from the Workshop include:
1. A set of thirteen budgets representing a range of coastal settings for the Mediterranean/Black Searegion – estuaries, coastal lagoons and large embayments. These budgets provide insights intoseasonality, influence of human activities as drivers of change and sensitivity of systemperformance to nutrients derived from land and ocean. Further development of a number of thesebudgets and additional site models were foreshadowed by participants. To date participants haveacted on this intent and additional models are in draft for addition to the LOICZ web-site. Thesewill contribute to “replication” of system types and support further trend analyses of climatic andhuman forcings on biogeochemical processes in the region and in the global assessment beingcarried out by LOICZ.
2. A variety of site examples and different measurement/data types which show approaches that canbe taken under the LOICZ Modelling protocol for first-order evaluation of the system physics andestimation of net metabolism of coastal systems, and modelling to meet LOICZ global changegoals, UNEP project objectives and EU synthesis developments.
3. Assessment of systems across a range of areal scales, water residence conditions and underdiffering regions of riverine and oceanic dominance of fluxes. There is potential to nest some of thesites (within the Black Sea and across the north-western Mediterranean region) on completion offurther budgets.
4
4. A new tool (LOICZView) for scaling and regional synthesis was demonstrated. Its potential wasenthusiastically embraced by a number of the participants for application in their researchquestions.
5. Research information was drawn from several EU-supported projects in the development of anumber of site budget assessments, notably NICE, ROBUST and METRO-MED, making theworkshop a preliminary step in the EU intention to build a wider synthesis of ELOISE and relatedresearch results.
6. A proposal was made by the ELOISE Office-JRC and the University of Parma to convene a jointELOISE-LOICZ Workshop to develop very detailed CNP flux budgets for the whole of peninsularItaly.
The Workshop was hosted by the National Centre for Marine Research, Athens Greece, and the localcoordinator was Dr Christos Anagnostou. LOICZ is grateful for this support and indebted to theDirector of the Institute of Marine Biological Resources, Dr K. Papakonstantinou and Institute staff, andto the Workshop resource scientists for their contributions to the success of the Workshop. LOICZgratefully acknowledges the effort and work of the participants not only for their significantcontributions to the Workshop goals, but also for their continued interaction beyond the meetingactivities.
All participants gratefully acknowledged the support from the GEF-funded UNEP project and the EUsponsorship that provided opportunity to work together and to extend professional networking.
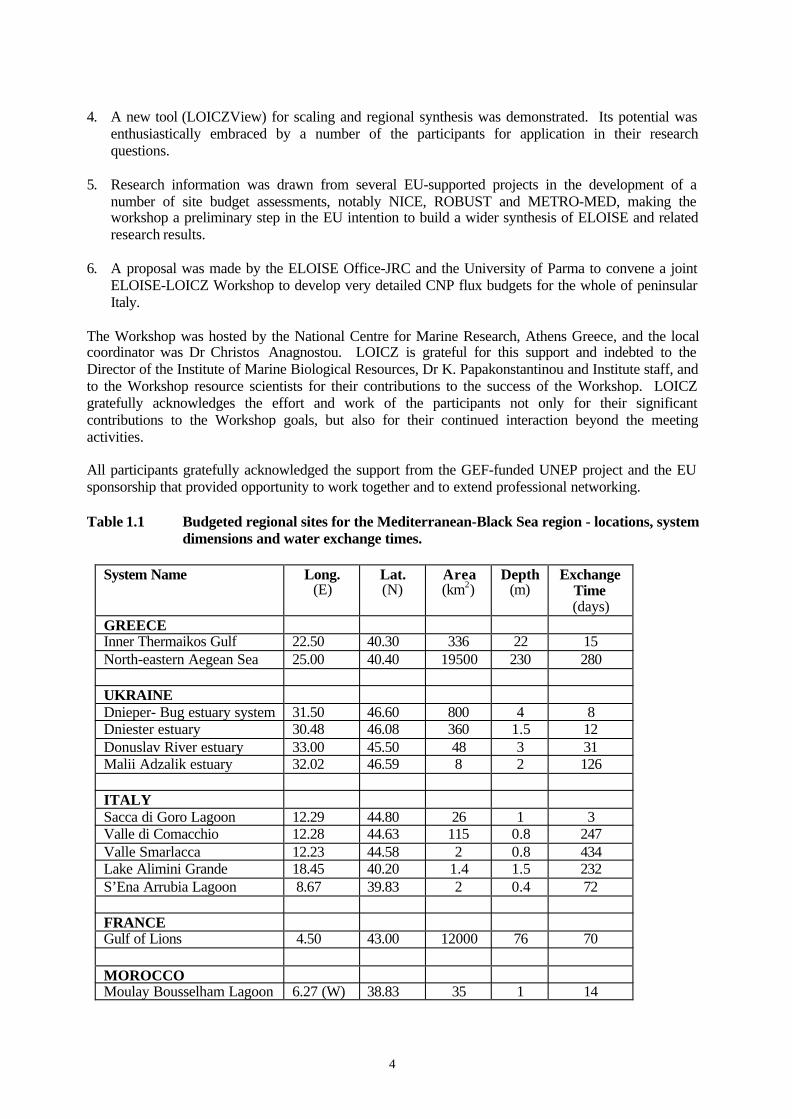
Table 1.1 Budgeted regional sites for the Mediterranean-Black Sea region - locations, systemdimensions and water exchange times.
Situated on the southernmost portion of the Balkan Peninsula, Greece is nearly surrounded by seas.The Aegean lies to the east, the Mediterranean to the south, and the Ionian to the west. ContinentalGreece is mountainous and rugged and the coast is highly indented - as the ancient Greek geographerStrabo (64? BC-24 AD) wrote, “the sea presses in upon the country with a thousand arms”. The coastalwaters of Greece are shallow, and penetrate far inland by means of the often narrow bays and gulfs.
The Aegean Sea constitutes the north-eastern part of the eastern Mediterranean Sea; it is bounded to theeast by the Turkish coastline, to the north and west by the Greek mainland and to the south by the islandof Crete and the other Cretan Arc islands. It communicates with the Sea of Marmara through theDardanelles Strait and with the Mediterranean through the straits of the Cretan Arc. The ThermaikosGulf is on the north-western continental margin of the Aegean Sea.
The Thermaikos coastal system includes rivers and ephemeral streams (Axios, Aliakmon, Gallikos andPinios). The sub-aerial part of the coastal zone includes mostly the deltaic plains of the aforementionedrivers, some low-relief late Quaternary coastal plains and cliffs. The coastal zone climate is semi-aridMediterranean, with rather cold winters. Annual air temperatures range between 0 and 38oC, while themean annual precipitation is 480 mm (in the city of Thessaloniki). Northerly winds blow throughoutthe year, more strongly during winter; these are Balkan cold air masses (locally named Vardaris wind)originating from the north/north-west following the valley of the Axios River. During summer the windis dominated by the Etesians which blow from the north/north-east and are relatively strong (>6m/s).
[from: S. E. Poulos, G. Th. Chronis, M. B. Collins and V. Lykousis (2000) Thermaikos Gulf CoastalSystem, NW Aegean Sea: an overview of water/sediment fluxes in relation to air-land-ocean interactionsand human activities. Journal of Marine Systems 25:47-76.]
2.1 Inner Thermaikos Gulf (NW Aegean Sea, E. Mediterranean): a preliminary approach
K. Pagou, E. Krasakopoulou, A. Pavlidou, G. Assimakopoulou, H. Kontoyiannis and Ch.Anagnostou
Study area description
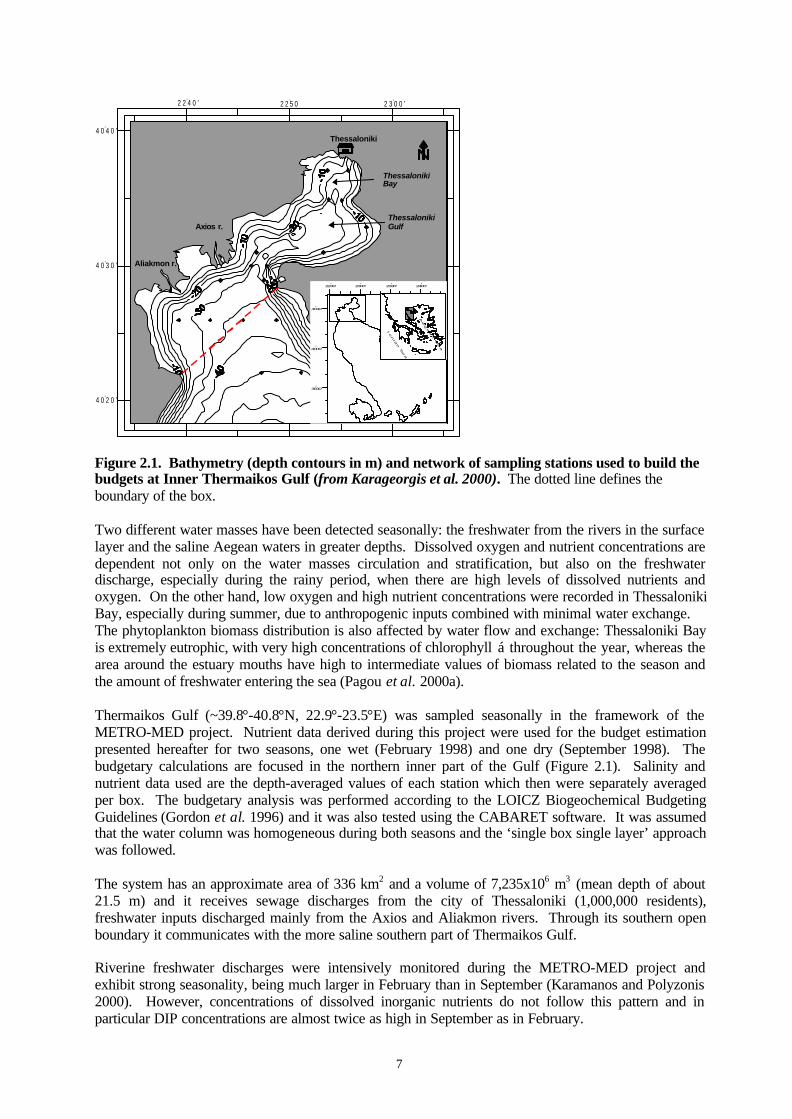
The Thermaikos Gulf (40.3-40.6oN, 22.3-22.9oE; Figure 2.1) forms the north-west Aegean continentalshelf and it is a typical deltaic platform. Four rivers (Axios, Loudias, Aliakmon, Pinios) constitute themajor sources of material input into the marine system of the Thermaikos Gulf. The drainage basincovers an area of ~72,000 km2. Measurements carried out during the METRO-MED project showed amean annual water discharge of the river system of about 207 m3 sec-1 or 18x106 m3 d-1 (Karamanos etal. 2000).
Thessaloniki Bay, the northern part of the Inner Thermaikos Gulf, receives domestic, agricultural andindustrial effluents not only through the rivers but also in sewage from the city of Thessaloniki. Fishingactivities and extensive aquaculture farming also occurs, along with water recreational activities. Thisnorthern part of the study area is characterized by eutrophic conditions due mostly to the intensenutrient supply through the sewage. The western coast of the Inner Thermaikos Gulf (depth: 0-50 m) isinfluenced by the three major river estuaries (Axios, Loudias, Aliakmon) and the prevailing eutrophicconditions are also related to this freshwater inflow, whereas the eastern coast is influenced by theoligotrophic Aegean Sea. However, depending to the seasonal variability, eutrophic conditions due tothe rivers can be recorded in the whole Inner Gulf area.
7
2 2 4 0 ’o
2 2 5 0o
2 3 0 0 ’o
4 0 4 0 ’o
4 0 3 0 ’o
4 0 2 0 ’o
Thessaloniki
Axios r.
Aliakmon r.
ThessalonikiBay
ThessalonikiGulf
2230’o
2400’o
2330’o
2300’o
3930’o
4000’o
4030’o
Ionia
n S
ea
Aegean S
ea
Figure 2.1. Bathymetry (depth contours in m) and network of sampling stations used to build thebudgets at Inner Thermaikos Gulf (from Karageorgis et al. 2000). The dotted line defines theboundary of the box.
Two different water masses have been detected seasonally: the freshwater from the rivers in the surfacelayer and the saline Aegean waters in greater depths. Dissolved oxygen and nutrient concentrations aredependent not only on the water masses circulation and stratification, but also on the freshwaterdischarge, especially during the rainy period, when there are high levels of dissolved nutrients andoxygen. On the other hand, low oxygen and high nutrient concentrations were recorded in ThessalonikiBay, especially during summer, due to anthropogenic inputs combined with minimal water exchange.The phytoplankton biomass distribution is also affected by water flow and exchange: Thessaloniki Bayis extremely eutrophic, with very high concentrations of chlorophyll á throughout the year, whereas thearea around the estuary mouths have high to intermediate values of biomass related to the season andthe amount of freshwater entering the sea (Pagou et al. 2000a).
Thermaikos Gulf (~39.8°-40.8°N, 22.9°-23.5°E) was sampled seasonally in the framework of theMETRO-MED project. Nutrient data derived during this project were used for the budget estimationpresented hereafter for two seasons, one wet (February 1998) and one dry (September 1998). Thebudgetary calculations are focused in the northern inner part of the Gulf (Figure 2.1). Salinity andnutrient data used are the depth-averaged values of each station which then were separately averagedper box. The budgetary analysis was performed according to the LOICZ Biogeochemical BudgetingGuidelines (Gordon et al. 1996) and it was also tested using the CABARET software. It was assumedthat the water column was homogeneous during both seasons and the ‘single box single layer’ approachwas followed.
The system has an approximate area of 336 km2 and a volume of 7,235x106 m3 (mean depth of about21.5 m) and it receives sewage discharges from the city of Thessaloniki (1,000,000 residents),freshwater inputs discharged mainly from the Axios and Aliakmon rivers. Through its southern openboundary it communicates with the more saline southern part of Thermaikos Gulf.
Riverine freshwater discharges were intensively monitored during the METRO-MED project andexhibit strong seasonality, being much larger in February than in September (Karamanos and Polyzonis2000). However, concentrations of dissolved inorganic nutrients do not follow this pattern and inparticular DIP concentrations are almost twice as high in September as in February.
8
In addition to the riverine supply, a substantial ‘freshwater’ input is contributed by the sewage outfall ofThessaloniki (1,000,000 residents). Although the water volume of the sewage is small relative to theother freshwater, inputs of dissolved N and P are highly concentrated in the effluent. Sewagedischarges to the sea are evaluated assuming a wastewater production of 250 liters per person per dayand the discharge coefficients proposed by Sogreah (1974), Padilla et al. (1997) and World Bank(1993).
At this stage of the study, due to the absence of any original data from local meteorological stations, themean annual values referred for the Aegean Sea by Poulos et al. (1997) will be used for both seasons(precipitation: 500 mm yr-1; evaporation: 1,280 mm yr-1). These precipitation and evaporation rates areconverted to volume fluxes by multiplying by the area of the system. However since rainfall is minimal(or does not occur) throughout the summer months, the precipitation value is probably overestimated atleast for September.
Although transport via the atmosphere is recognised as an important route by which nutrients andparticles are delivered to the sea surface, unfortunately there are no data available on atmospheric inputsfor the study area. Most of the available data on atmospheric inputs of nutrients refer to the westernMediterranean basin and the only published information on the eastern basin concerns measurements onthe Israeli coasts (Herut and Krom, 1996; Herut et al. 1999). The atmospheric inputs of inorganicnitrogen and phosphorus were estimated using the calculated values of the fluxes for the SEMediterranean (Herut et al. 1999) extrapolated to the surface area of the system. The estimated wetflux of inorganic phosphorus and nitrogen over the SE Mediterranean is about 0.018 g P m-2yr-1 or0.002 mmol P m-2 d-1 and about 0.24 g N m-2 yr-1 or 0.05 mmol N m-2 d-1, respectively. In the case ofphosphorus, the aforementioned value is the sum of wet and leachable fluxes because it is suggestedthat they represent the amount of phosphate that is bioavailable in the surface waters.
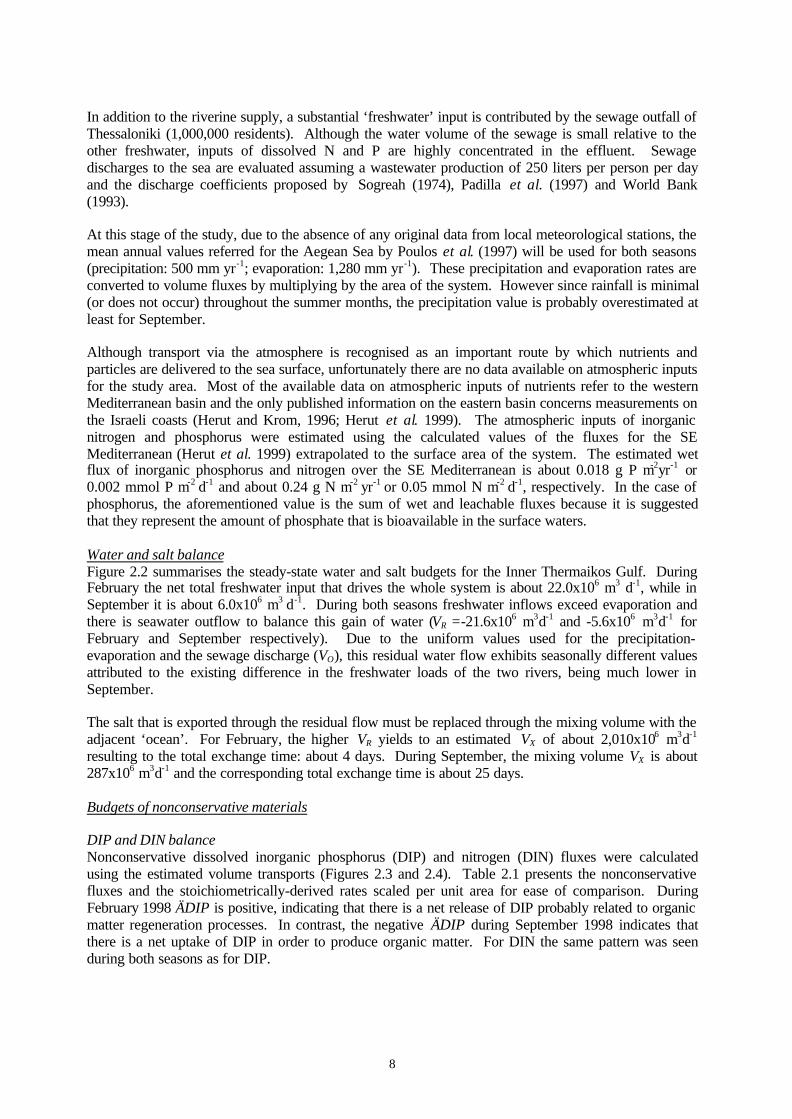
Water and salt balanceFigure 2.2 summarises the steady-state water and salt budgets for the Inner Thermaikos Gulf. DuringFebruary the net total freshwater input that drives the whole system is about 22.0x10⁶ m3 d-1, while inSeptember it is about 6.0x10⁶ m3 d-1. During both seasons freshwater inflows exceed evaporation andthere is seawater outflow to balance this gain of water (VR =-21.6x10⁶ m3d-1 and -5.6x10⁶ m3d-1 forFebruary and September respectively). Due to the uniform values used for the precipitation-evaporation and the sewage discharge (VO), this residual water flow exhibits seasonally different valuesattributed to the existing difference in the freshwater loads of the two rivers, being much lower inSeptember.
The salt that is exported through the residual flow must be replaced through the mixing volume with theadjacent ‘ocean’. For February, the higher VR yields to an estimated VX of about 2,010x106 m3d-1
resulting to the total exchange time: about 4 days. During September, the mixing volume VX is about287x106 m3d-1 and the corresponding total exchange time is about 25 days.
Budgets of nonconservative materials
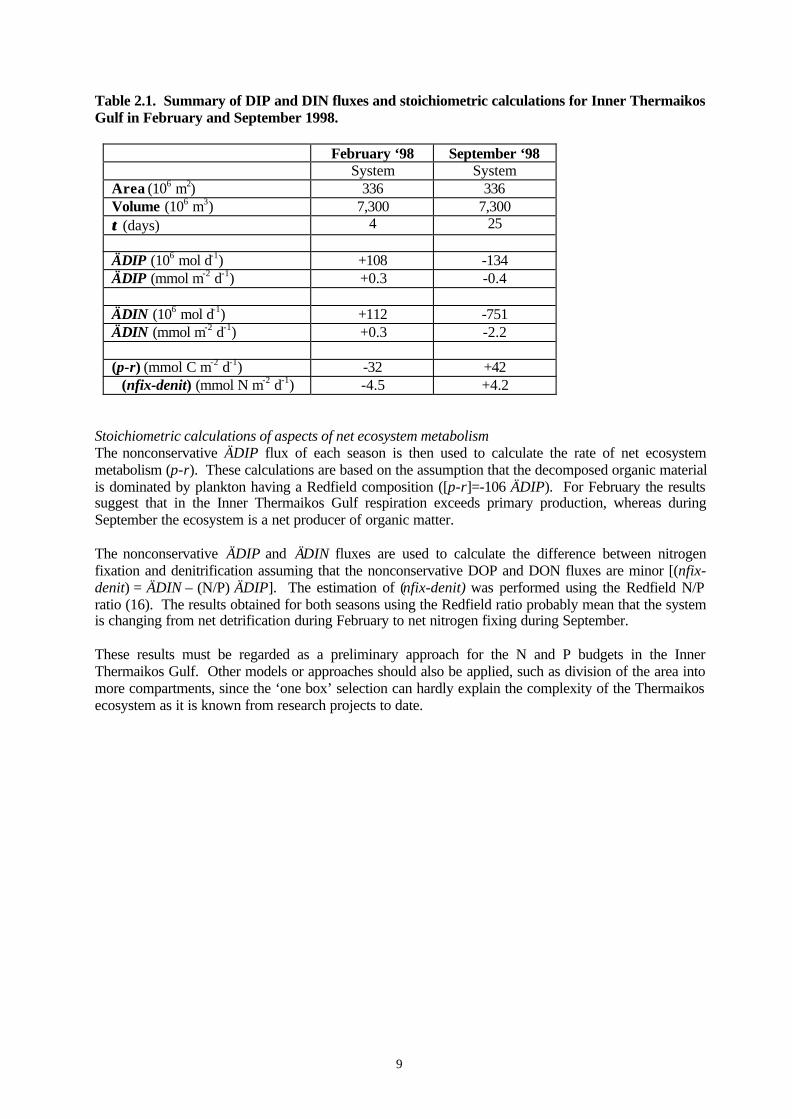
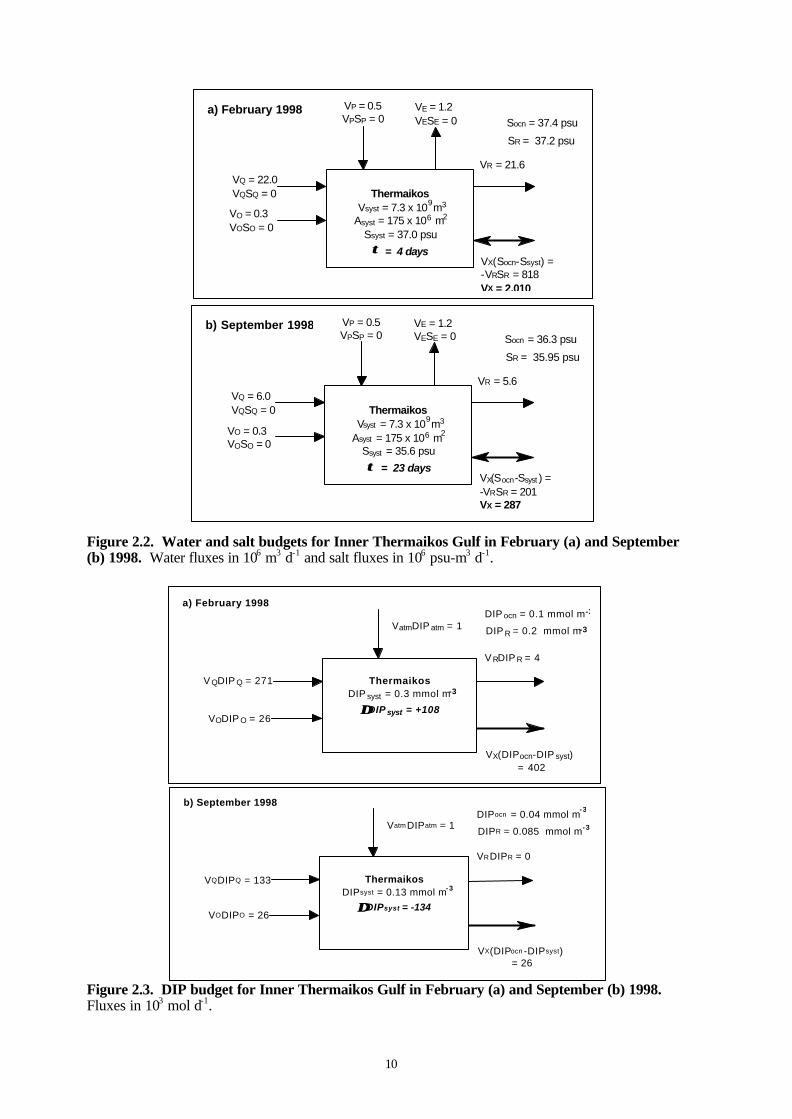
DIP and DIN balanceNonconservative dissolved inorganic phosphorus (DIP) and nitrogen (DIN) fluxes were calculatedusing the estimated volume transports (Figures 2.3 and 2.4). Table 2.1 presents the nonconservativefluxes and the stoichiometrically-derived rates scaled per unit area for ease of comparison. DuringFebruary 1998 ÄDIP is positive, indicating that there is a net release of DIP probably related to organicmatter regeneration processes. In contrast, the negative ÄDIP during September 1998 indicates thatthere is a net uptake of DIP in order to produce organic matter. For DIN the same pattern was seenduring both seasons as for DIP.
9
Table 2.1. Summary of DIP and DIN fluxes and stoichiometric calculations for Inner ThermaikosGulf in February and September 1998.
(p-r) (mmol C m-2 d-1) -32 +42(nfix-denit) (mmol N m-2 d-1) -4.5 +4.2
Stoichiometric calculations of aspects of net ecosystem metabolismThe nonconservative ÄDIP flux of each season is then used to calculate the rate of net ecosystemmetabolism (p-r). These calculations are based on the assumption that the decomposed organic materialis dominated by plankton having a Redfield composition ([p-r]=-106 ÄDIP). For February the resultssuggest that in the Inner Thermaikos Gulf respiration exceeds primary production, whereas duringSeptember the ecosystem is a net producer of organic matter.
The nonconservative ÄDIP and ÄDIN fluxes are used to calculate the difference between nitrogenfixation and denitrification assuming that the nonconservative DOP and DON fluxes are minor [(nfix-denit) = ÄDIN – (N/P) ÄDIP]. The estimation of (nfix-denit) was performed using the Redfield N/Pratio (16). The results obtained for both seasons using the Redfield ratio probably mean that the systemis changing from net detrification during February to net nitrogen fixing during September.
These results must be regarded as a preliminary approach for the N and P budgets in the InnerThermaikos Gulf. Other models or approaches should also be applied, such as division of the area intomore compartments, since the ‘one box’ selection can hardly explain the complexity of the Thermaikosecosystem as it is known from research projects to date.
10
Figure 2.2. Water and salt budgets for Inner Thermaikos Gulf in February (a) and September(b) 1998. Water fluxes in 106 m3 d-1 and salt fluxes in 106 psu-m3 d-1.
Figure 2.3. DIP budget for Inner Thermaikos Gulf in February (a) and September (b) 1998.Fluxes in 103 mol d-1.
Thermaikos Vsyst = 7.3 x 10 m Asyst = 175 x 10 m
Ssyst = 37.0 psu τ τ = 4 days
VP = 0.5 VPSP = 0
VQ = 22.0 VQSQ = 0
VR = 21.6
Socn = 37.4 psu
SR = 37.2 psu
VX(Socn-Ssyst) = -VRSR = 818 VX = 2,010
9 3
6 2
a) February 1998
VO = 0.3 VOSO = 0
VE = 1.2 VESE = 0
Thermaikos Vsyst = 7.3 x 10 m Asyst = 175 x 10 m
Ssyst = 35.6 psu
τ τ = 23 days
VP = 0.5 VPSP = 0
VQ = 6.0 VQSQ = 0
VR = 5.6
Socn = 36.3 psu
SR = 35.95 psu
VX(Socn-Ssyst ) = -VRSR = 201 VX = 287
9 3
6 2
b) September 1998
VO = 0.3 VOSO = 0
VE = 1.2 VESE = 0
Thermaikos DIP syst = 0.3 mmol m
∆∆DIP syst = +108
V QDIP Q = 271
V RDIP R = 4
DIP ocn = 0.1 mmol m
DIP R = 0.2 mmol m
VX(DIPocn-DIP syst) = 402
VatmDIP atm = 1
a) February 1998
VODIP O = 26
-3
-3
-3
Thermaikos DIPsyst = 0.13 mmol m
∆∆DIPsyst = -134
VQDIPQ = 133
VRDIPR = 0
DIPocn = 0.04 mmol m
DIPR = 0.085 mmol m
VX(DIPocn -DIPsyst) = 26
VatmDIPatm = 1
b) September 1998
VODIPO = 26
-3
-3
-3
11
Figure 2.4. DIN budget for Inner Thermaikos Gulf in February (a) and September (b) 1998.Fluxes in 103 mol d-1.
Thermaikos DINsyst = 2.7 mmol m
∆∆DINsyst = +112
VQDINQ = 3,419
VRDINR = 39
DINocn = 0.9 mmol m
DINR = 1.8 mmol m
VX(DINocn-DINsyst) = 3,618
VatmDINatm = 17
a) February 1998
VODINO = 109
-3
-3
-3
Thermaikos DINsyst = 1.6 mmol m
∆∆DINsyst = -751
VQDINQ = 663
VRDINR = 9
DINocn = 1.5 mmol m
DINR = 1.55 mmol m
VX(DINocn-DINsyst) = 29
VatmDINatm = 17
b) September 1998
VODINO = 109
-3
-3
-3
12
2.2 North-eastern Aegean Sea
E. Krasakopoulou, V. Zervakis, E. Souvermezoglou and D. Georgopoulos
Study area description
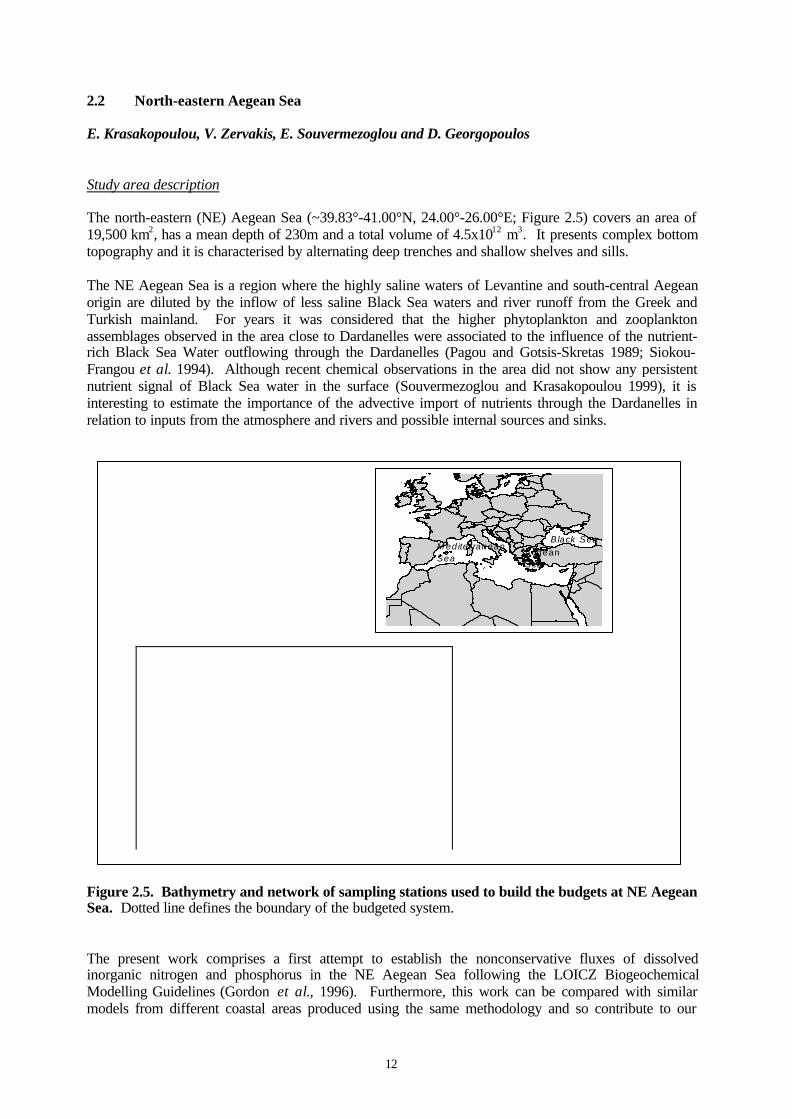
The north-eastern (NE) Aegean Sea (~39.83°-41.00°N, 24.00°-26.00°E; Figure 2.5) covers an area of19,500 km2, has a mean depth of 230m and a total volume of 4.5x10¹² m3. It presents complex bottomtopography and it is characterised by alternating deep trenches and shallow shelves and sills.
The NE Aegean Sea is a region where the highly saline waters of Levantine and south-central Aegeanorigin are diluted by the inflow of less saline Black Sea waters and river runoff from the Greek andTurkish mainland. For years it was considered that the higher phytoplankton and zooplanktonassemblages observed in the area close to Dardanelles were associated to the influence of the nutrient-rich Black Sea Water outflowing through the Dardanelles (Pagou and Gotsis-Skretas 1989; Siokou-Frangou et al. 1994). Although recent chemical observations in the area did not show any persistentnutrient signal of Black Sea water in the surface (Souvermezoglou and Krasakopoulou 1999), it isinteresting to estimate the importance of the advective import of nutrients through the Dardanelles inrelation to inputs from the atmosphere and rivers and possible internal sources and sinks.
Figure 2.5. Bathymetry and network of sampling stations used to build the budgets at NE AegeanSea. Dotted line defines the boundary of the budgeted system.
The present work comprises a first attempt to establish the nonconservative fluxes of dissolvedinorganic nitrogen and phosphorus in the NE Aegean Sea following the LOICZ BiogeochemicalModelling Guidelines (Gordon et al., 1996). Furthermore, this work can be compared with similarmodels from different coastal areas produced using the same methodology and so contribute to our
Black SeaM editer ranean Sea
Aegean Sea
13
knowledge on the role of the coastal zone in carbon, nitrogen and phosphorus cycling.The NE AegeanSea was sampled seasonally in the framework of the INTERREG-I project. Salinity and nutrient datacollected during the September 1998 cruise were used to develop budget calculations.
Water and salt balance
For budgeting purposes, the system is considered as a three layer system; the layers are separated by theisopycnal horizons of 28.8 and 29.3 σΦ , which define the interfaces separating the modified Black Sea,Levantine and North Aegean Deep water masses (Zervakis et al. 1998). Due to the irregularbathymetry of the area that exceeds 1,500m depth and to the presence of a sill ~500m deep which limitsthe lateral communication between the deep layers of the basins (Figure 2.5), it is assumed that thestudy system is ‘sealed’ below the 29.3 σΦ isopycnal horizon and the budget calculations are performedconsidering only the two upper layers. During September 1998 the mean thickness of the top layer(σΦ<28.8) is about 50m, and the thickness of the intermediate layer (28.8<σΦ<29.3) is about 155m.The intermediate layer has an area of about 14,800 km2. The top layer receives freshwater inputsdischarged from Evros, Strimon and Nestos rivers (VQ) and brackish waters of Black Sea origininflowing from the Dardanelles Strait (VDar-s); additionally through its western open boundary itcommunicates with the more saline western part of the North Aegean Sea (Vsurf). The intermediatelayer receives water from the adjacent intermediate layer of the western part of the North Aegean (VD)and at the same time it is assumed that the intermediate layer exports water towards the top layer (VD’)and the Dardanelles (VDar-d). Between the two layers of the NE Aegean Sea exists an additional flow,the vertical mixing flow (VZ) that exchanges surface and deeper waters within the system. A horizontalmixing (VX-s’) in the surface layer between NE Aegean Sea and the Dardanelles Strait is needed tobalance out the salt flux of the surface inflow and intermediate counter-flow from and to theDardanelles Strait. Horizontal mixing in the intermediate layers (VX-d’) is zero since the layers havealmost the same salinity. This means that there is no net horizontal transport of conservative materials(e.g. salt, nutrients) due to mixing between the intermediate layer of the system and lower layer of theDardanelles Strait.
The salinity and nutrient data of each layer used for the calculations are the depth-averaged values ofeach station which then were averaged per layer for the area included in the dashed lines (Figure 2.5).The same approach was followed in order to define the hydrochemical properties of the adjacent ocean,using the data of the stations that are close to the western boundary of the system. Data for the innereastern side of the system were not collected as shown by the absence of sampling stations in the area(Figure 2.5).
The annual brackish surface current outflowing from the Dardanelles into the Aegean carries between274 and 2,740x106 m3 d-1 and has a salinity ranging between 24-28 psu (Unluata et al. 1990). The flowregime exhibits significant seasonal variations depending on the meteorological and hydrologicalconditions in the adjacent seas and the total fresh water input to Black Sea. In general the net annualflow through the Dardanelles is about 822x106 m3 d-1 (Unluata et al. 1990; Polat and Turgul, 1996), sofor the budgeting calculations it was assumed that some 2,192x106 m3 d-1 of Black Sea water flows intothe top layer and that 1,370x106 m3 d-1 is exported from the intermediate layer towards the Dardanelles(Polat and Turgul 1996). Additionally, the sensitivity of the calculations was tested using a range offlows between 548 and 3,288x106 m3 d-1.
The riverine supply in the area is 20-100 times less than the Dardanelles inflow. The annual riverinefreshwater discharges and the corresponding concentrations of dissolved inorganic nutrients used forthe budget calculations are based on the values cited in EEA (1999).
In order to complete the freshwater budget of the system the mean annual precipitation and evaporationvalues referred for the Aegean Sea by Poulos et al. (1997) are used (500 mm yr-1 and 1,280 mm yr-1,respectively). These rates are converted to volume fluxes by multiplying with the area of the system.However, since the rainfall is limited (or does not occur) throughout the summer months, the
14
precipitation value is probably overestimated. However, since the water budget is largely driven by thewater flow from the Dardanelles Strait, precipitation is not important.
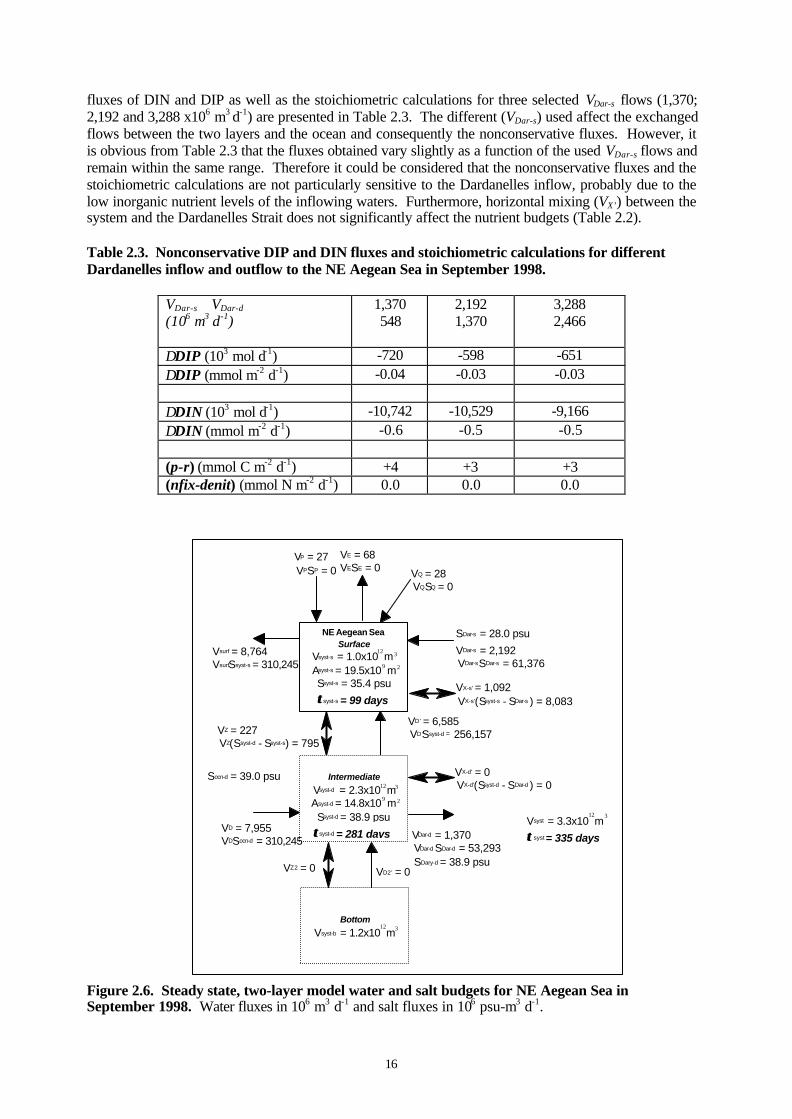
The equations describing the steady state water and salt balance for the two upper layers of the NEAegean were then constructed and solved in order to estimate the unknown water flows. The resultsarising through this simple approach are illustrated in Figure 2.6.
Freshwater inflow (VP+VQ) is almost equal to evaporative losses; the net total freshwater loss isestimated about 13x106 m3d-1. The surface inflow (VDar-s = 2,192x106 m3d-1) from the Dardanellesminus the net freshwater flow drives the water and salt budgets for the whole system. The total waterflow from the surface layer (Vsurf) of the system to the adjacent NW Aegean is 8,764x106 m3 d-1. Therequired counter flow to the deeper layer of the system from the deep layer of adjacent sea to replacethe salt loss due to Vsurf is 7,955x106 m3 d-1 (VD) which then is exported towards the upper layer (VD’)and the Dardanelles (VDar-d = 1,370x106 m3d-1). The bottom water upward flow (VD’) is 6,585x106 m3 d-
1. Vertical mixing (VZ) is 227x106 m3d-1. VZ is very much smaller than VD’. It is likely that the verticalmixing of this intermediate water with water below the 29.3 σΦ isopycnal horizon is even smaller,which supports the approximation that the bottom layer is sealed.
The salt flux imported through the Dardanelles Strait surface flow to the NE Aegean (61,376x106 psu-m3d-1) is greater than the salt exported from the Aegean back to the Dardanelles via the subsurfacecounter flow (53,293x106 psu-m3d-1). The mixing volume (VX-s’) required to balance this excess salt isestimated as 1,092x106 m3d-1.
Water exchange time in the upper 50 m layer was about 100 days and for the upper 200 m layer about ayear in September 1998.
Budgets of nonconservative materials
DIP and DIN balanceThe annual means of DIP and DIN (nitrate+nitrite) concentrations in the surface flow of the Dardanelles(reported by Polat and Turgul 1996) were used to evaluate the DIP and DIN budget. Ammonium(NH4+) data were not available and were assumed to be insignificant relative to (nitrate+nitrite).
Although transport via the atmosphere is recognised as an important route by which nutrients andparticles are delivered to the sea surface, there are no data available on atmospheric inputs for the studyarea. The atmospheric inputs of inorganic nitrogen and phosphorus were calculated using the estimatedwet fluxes of 0.018 g P m-2 yr-1 or 0.6 mmol P m-2 yr-1 and 0.24 g N m-2 yr-1 or 17 mmol N m-2 yr-1 overthe SE Mediterranean (Herut et al. 1999) extrapolated to the surface area of the system. In the case ofphosphorus, the aforementioned value is the sum of wet and leachable fluxes because they probablyrepresent the amount of phosphate that is bioavailable in the surface waters.
The nonconservative dissolved inorganic phosphorus (DIP) and nitrogen (DIN) fluxes were calculatedusing the estimated volume transports multiplied by the appropriate nutrient concentration (Figures 2.7and 2.8). In order to obtain reliable estimates of the nutrient fluxes it is important that the volumetransports estimated through the ‘hydrogaphic’ budget are accurate. Actually, the calculated verticalmixing volume VZ (227x106 m3 d-1) appears rather higher than similar estimates from open sea budgetsand roughly corresponds to a vertical velocity of about ~10.0 mm d-1 (Gargett 1984).
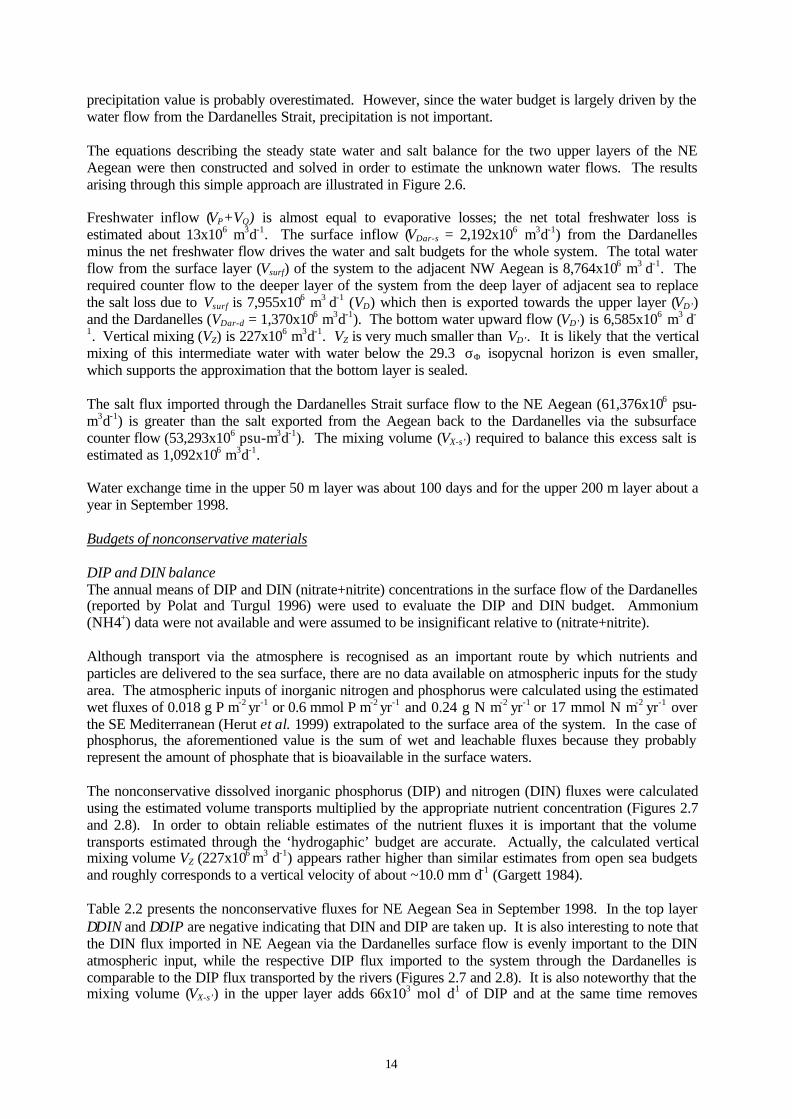
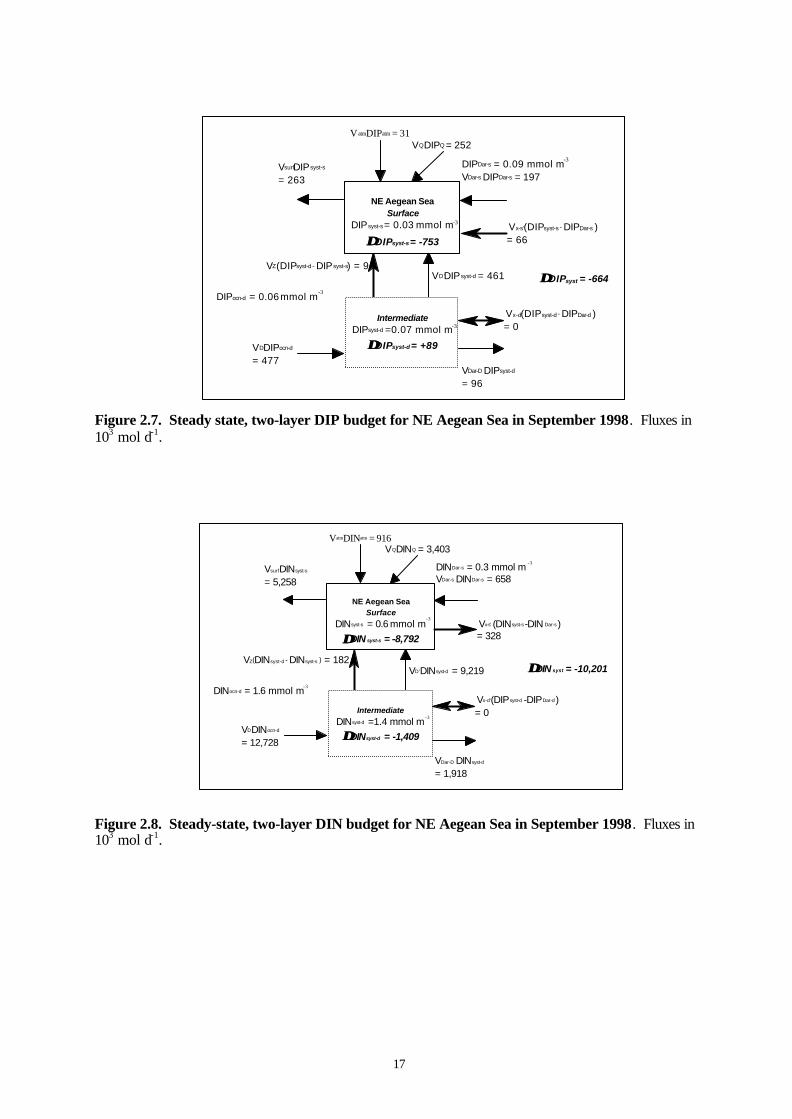
Table 2.2 presents the nonconservative fluxes for NE Aegean Sea in September 1998. In the top layer∆DIN and ∆DIP are negative indicating that DIN and DIP are taken up. It is also interesting to note thatthe DIN flux imported in NE Aegean via the Dardanelles surface flow is evenly important to the DINatmospheric input, while the respective DIP flux imported to the system through the Dardanelles iscomparable to the DIP flux transported by the rivers (Figures 2.7 and 2.8). It is also noteworthy that themixing volume (VX-s’) in the upper layer adds 66x103 mol d-1 of DIP and at the same time removes
15
328x103 mol d-1 of DIN, as a result of the existing differences in the nutrient concentrations between thesystem and the Dardanelles.
Table 2.2. Nonconservative DIP and DIN fluxes and stoichiometric calculations for NE AegeanSea in September 1998. w/o VX and w/ VX mean without and with VX, respectively.
Moreover it becomes clear that the intermediate layer of the adjacent ocean feeds with nutrients thelayer with 28.8<σΦ<29.3 (intermediate layer) and due to the vertical ‘loop circulation’ the major part ofthis supply flows upward and enriches the with σΦ<28.8 (surface layer) of the system.
Stoichiometric calculations of aspects of net ecosystem metabolism
Without further interpretation the nutrient budgets do not provide information on the processes whichaccount for the summed sources minus sinks. The nonconservative DIP flux (∆DIP) of each layer isthen used to calculate the rates of net ecosystem metabolism (p-r). These calculations are based on theassumption that the decomposed organic mater is dominated by plankton having a Redfield composition[(p-r) = -106 ∆DIP]. The surface layer with σΦ<28.8 is a net producer of organic matter, as primaryproduction exceeds respiration, while in the deeper layer with 28.8<σΦ<29.3 it seems that organicoxidation processes predominate. Data on pelagic primary production measured in the study areaduring September 1997 (Siokou et al. 2001) suggest that gross p is about 19.2 mmol C m-2 d-1 andtherefore about 84% of gross production is consumed through respiration; (p-r) = +0.16p. Although (p-r) is usually about ±0.1p, our estimate seems to be reasonable for this system because a major part ofthe system is shallow enough to support benthic primary production, so that gross p for the wholesystem is expected to be higher than 19.2 mmol C m-2 d-1 and consequently (p-r) approaches +0.1p.
The difference between nitrogen fixation and denitrification was also calculated, assuming that thenonconservative DOP and DON fluxes are minor [(nfix-denit) = ∆DIN – 16∆DIP]. In the surface layerwith σΦ<28.8, which includes the great part of the shallow coastal area, it seems that an importantportion of DIN could originate from biological fixation of atmospheric nitrogen by seagrasses(Posidonia oceanica) and by bacterioplankton species (Trichodesmium, Synechococcus) (Bethoux et al.1992). In contrast, in the layer with 28.8<σΦ<29.3 the denitrification obviously represents a large sinkof DIN. Although denitrification in the water column occurs under low oxygen conditions, insubsurface waters where rates of organic matter degradation are large enough to deplete the existingoxygen content, it is possible that denitrification occurs in microenvironments such as the interior ofsinking particulate organic matter and may account for the relatively high denitrification rate(Christensen 1994; Alldredge and Cohen, 1987). Overall, the whole system appears to balance nitrogenfixing and denitrification [(nfix-denit) = 0].
The budgetary calculations were also performed using a range of Dardanelles inflow (VDar-s) in the toplayer; the corresponding exported flow (VDar-d) was defined as the net annual flow through theDardanelles Strait, 822x106 m3 d-1 (Unluata et al. 1990; Polat and Turgul 1996). The nonconservative
16
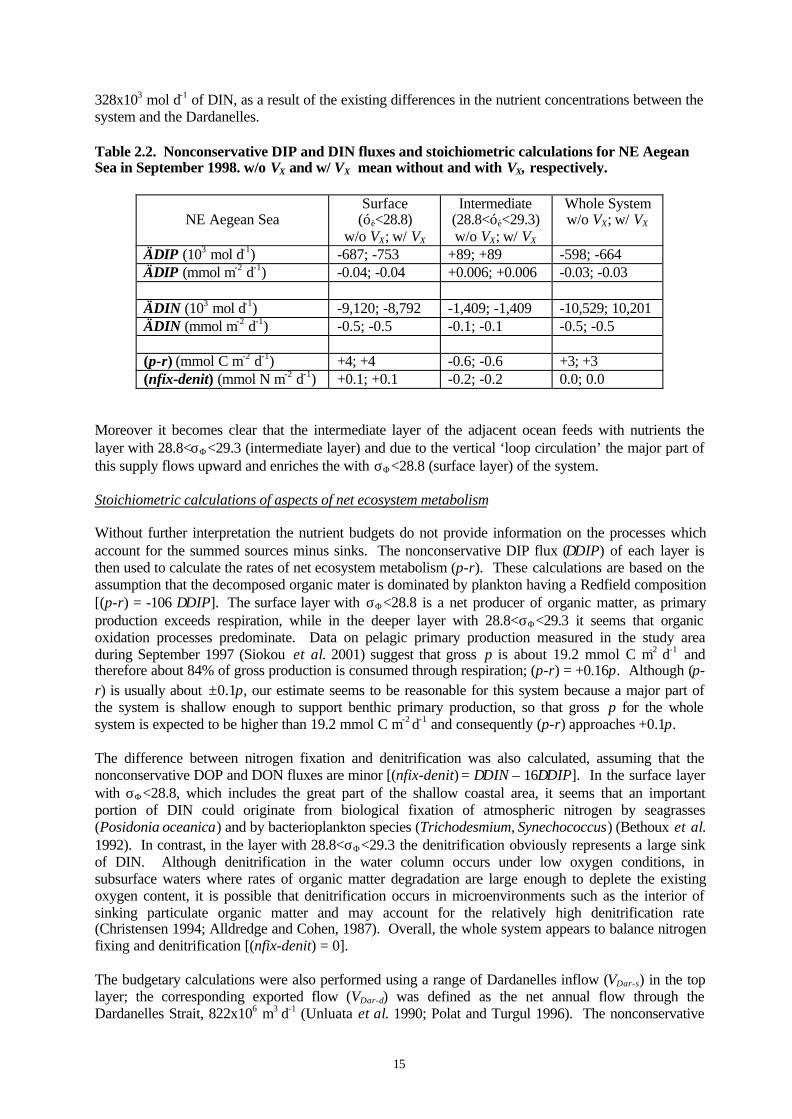
fluxes of DIN and DIP as well as the stoichiometric calculations for three selected VDar-s flows (1,370;2,192 and 3,288 x106 m3 d-1) are presented in Table 2.3. The different (VDar-s) used affect the exchangedflows between the two layers and the ocean and consequently the nonconservative fluxes. However, itis obvious from Table 2.3 that the fluxes obtained vary slightly as a function of the used VDar-s flows andremain within the same range. Therefore it could be considered that the nonconservative fluxes and thestoichiometric calculations are not particularly sensitive to the Dardanelles inflow, probably due to thelow inorganic nutrient levels of the inflowing waters. Furthermore, horizontal mixing (VX’) between thesystem and the Dardanelles Strait does not significantly affect the nutrient budgets (Table 2.2).
Table 2.3. Nonconservative DIP and DIN fluxes and stoichiometric calculations for differentDardanelles inflow and outflow to the NE Aegean Sea in September 1998.
(p-r) (mmol C m-2 d-1) +4 +3 +3(nfix-denit) (mmol N m-2 d-1) 0.0 0.0 0.0
Figure 2.6. Steady state, two-layer model water and salt budgets for NE Aegean Sea inSeptember 1998. Water fluxes in 106 m3 d-1 and salt fluxes in 106 psu-m3 d-1.
Vsurf = 8,764 VsurfSsyst-s = 310,245
NE Aegean Sea Surface
Vsyst-s = 1.0x10 m Asyst-s = 19.5x10 m Ssyst-s = 35.4 psu
ττsyst-s = 99 days
Intermediate
Vsyst-d = 2.3x10 m Asyst-d = 14.8x10 m Ssyst-d = 38.9 psu
ττsyst-d = 281 days
VQ = 28 VQSQ = 0
VD = 7,955 VDSocn-d = 310,245
VZ = 227 VZ(Ssyst-d - Ssyst-s) = 795
VD' = 6,585 VD'Ssyst-d = 256,157
Socn-d = 39.0 psu
VP = 27 VPSP = 0
VE = 68 VESE = 0
VDar-s = 2,192 VDar-sSDar-s = 61,376
Vsyst = 3.3x10 m
ττsyst = 335 days
9
12 3
2
12 3
12 3
VDar-d = 1,370 VDar-d SDar-d = 53,293
SDar-s = 28.0 psu
SDary-d = 38.9 psu
VX-s' = 1,092 VX-s'(Ssyst-s - SDar-s ) = 8,083
VX-d' = 0 VX-d'(Ssyst-d - SDar-d ) = 0
Bottom Vsyst-b = 1.2x10 m
12 3
9 2
VZ2 = 0 VD2' = 0
17
Figure 2.7. Steady state, two-layer DIP budget for NE Aegean Sea in September 1998. Fluxes in103 mol d-1.
Figure 2.8. Steady-state, two-layer DIN budget for NE Aegean Sea in September 1998. Fluxes in103 mol d-1.
The Black Sea and the Sea of Azov form the southern border of Ukraine, which consists of vast flatplains generally lower than 300 m high. Most rivers flow into the Black Sea, including the Dniesterinto the central part, the Southern Bug and Dnieper into the north-west, and the Danube into the farsouth. The major rivers discharge annually about 266 km3 from a watershed of 1,462, 820 km2. Thisfreshwater volume is about 80% of the total annual run-off to the Black Sea. The rivers have markedseasonal variations with a pronounced spring flood peak and low discharge during autumn.
The north-western shelf (NWS) of the Black Sea comprises the embayment north of the 45ºN, with anarea of 48,000 km2 and a volume of 1,150 km3. The coastlines of the Black Sea Lowland(“Prichernomorskaya nizmennost”) and Crimean Peninsula make up its north-western and easternboundaries. The western coast is relatively straight; the eastern one irregular, with several sandyislands, bays and lagoons deeply entrenching inland. The bottom gently slopes down toward the opensea. The maximum depth does not exceed 50 m and the mean depth is about 24 m. The dynamicallyimportant feature is a north-south depression in the center of the region. Cold and saline water from theopen sea penetrates far north along this depression. The shallow east-west Odessa bank (shoal) in thenorth has local dynamic effect in vicinity of the Dnieper-Bug estuary mouth (Tolmazin, 1987).
All rivers except the Danube drain into the sea via shallow estuaries called “limans”. The word “liman”(meaning harbor in Greek) is an echo of the colonization of the Black Sea region by Greeks in ancienttimes (beginning in VI-V centuries B.C.). Some 20 “limans” (water bodies with or without connectionto the sea) are located along the coast of the NWS. The largest are the Dnieper–Bug and Dniesterestuaries with surface areas of 800 km2 and 360 km2 and catchments areas of 577,610 km3 and 75, 200km3 respectively. The estuaries lie in the middle and southern zones of the Black Sea Lowland, with aflat steppe landscape. The land slopes from the north to the south (west coast of the NWS), to thesouth-east (north coast) and to the south-west (east coast). The shores of the estuaries are formed fromloess, red clay, sand and camstone. The bottom is covered by silt and sand. All estuaries have a longand narrow bar (barrier) of sand and gravel that protects them from the open sea. The estuarine systemsare highly productive, especially in comparison with spare steppe landscape around them. About 200species of estuarine fauna have been found there (Swebs 1988).
The climate of Ukraine is temperate and continental, with a subtropical mediterranean climate in thesouthern Crimea. Temperatures range from -8 to 2oC in winter, and 17-25 oC in summer. Rainfallaverages 400 mm annually, decreasing from the north-west to the south-east. Evaporation everywhereexceeds precipitation and is about 760 mm per year (Terziev 1986). The NWS lies in the moderate-continental climate, with short, relatively mild winters and hot, dry summers. The region experiencesinfluence of polar (continental and marine), tropical and arctic air masses. In winter, spurs of theSiberian anticyclone create a strong current of cold air, and the NWS cools down, with regular iceformation in the shallow coastal areas and estuaries. The invasion of polar continental air (average 185days annually) brings strong north-easterly winds, rapid temperature drops, and frequent precipitation.The annual air temperature in the region, averaged on the observations of the coastal meteorologicalstations, is 10.5º C. Average temperatures range from -1.3º C in winter to 22.3º C in summer.
The majority of people live in large towns as Odessa (1,122,000 inhabitants), Mykolajiv (518,700),Kherson (370,500) and surrounding suburban areas.
The coastal zone has been intensively used for urban development, industry, agriculture, fishing,recreation, and marine supply activities. The agricultural sector of the economy is focused on crops ofcorn, vegetables, fruits, grape and livestock products - cattle, pigs, poultry, milk, meat, and eggs. Thesoil consists of high fertile humus (north-west) and dark maroon humus (south-east). The arable land-includes 70-75% of total land.
19
Industry is mainly represented by ship-building and -repainting, fish processing, fishing; chemical andgas industries, cotton, cosmetics, sugar and textiles, tea-packing and food-processing. Marine activitiesinclude port operations, transportation and reloading of sea cargoes, crude oil and oil products (ports ofOdessa, Iljichevsk and Mykolajiv). Fishing, at present, is mostly oriented on fish catch in the Atlanticand Pacific oceans. Recreational resources are used for local fishing, swimming, and bathing.
High concentration of industrial enterprises along the coast, intensive use of land for agriculturalpurposes, location of several large ports in the estuaries and bays, increasing urbanization with oldsystems of sewage treatment and input of large European rivers have created serious threats to themarine and coastal environment of the NWS. In 1999, the level of pollution of the NWS was assessedas super high (west coast, at the Danube delta and the Dniester estuary mouth), very high (north coast),high (south-east coast) and average (Cap Tarchankut, western tip of the Crimean Peninsula). The mainpolluting components of the sea are petroleum products.
However, the environmental situation in the region is improving. Nutrient concentrations in the waterduring the last few years have stabilized at a point below the permissible levels for nitrates, nitrites andphosphates (MEPNSU, 1999). Romanian scientists have reported decreases in nutrient loads from theDanube River to the shelf and Romanian coastal waters (Cosiasu et. al. 1999). This is closely related toa reduced application of mineral fertilizers and pesticides to the arable land, that has led to decrease ofthe nutrients and polluting matters washing out from the rivers catchment basins, and is a consequenceof the economic collapse in central and eastern European countries in the past decade.
Inna Yurkova
Figure 3.1. Location of the northwestern shelf of the Black Sea.
20
3.1 Dnieper-Bug estuary system
Inna Yurkova
Study area description
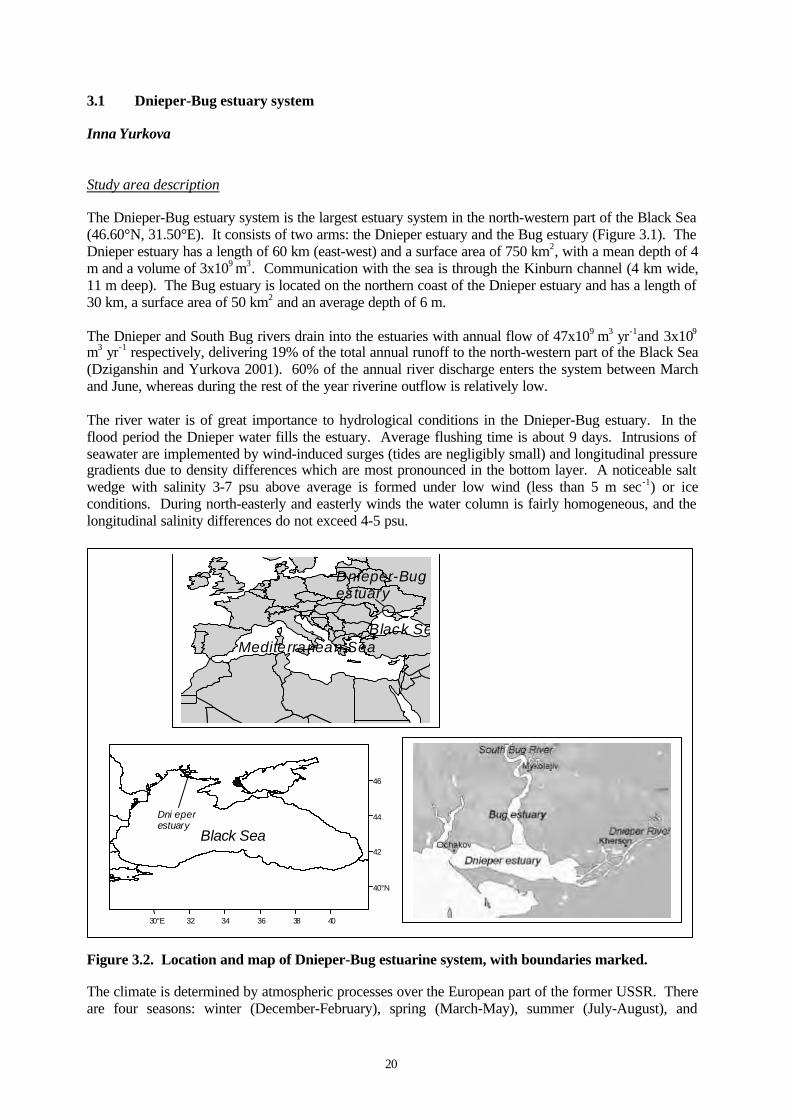
The Dnieper-Bug estuary system is the largest estuary system in the north-western part of the Black Sea(46.60°N, 31.50°E). It consists of two arms: the Dnieper estuary and the Bug estuary (Figure 3.1). TheDnieper estuary has a length of 60 km (east-west) and a surface area of 750 km2, with a mean depth of 4m and a volume of 3x10⁹ m3. Communication with the sea is through the Kinburn channel (4 km wide,11 m deep). The Bug estuary is located on the northern coast of the Dnieper estuary and has a length of30 km, a surface area of 50 km2 and an average depth of 6 m.
The Dnieper and South Bug rivers drain into the estuaries with annual flow of 47x109 m3 yr-1and 3x10⁹
m3 yr-1 respectively, delivering 19% of the total annual runoff to the north-western part of the Black Sea(Dziganshin and Yurkova 2001). 60% of the annual river discharge enters the system between Marchand June, whereas during the rest of the year riverine outflow is relatively low.
The river water is of great importance to hydrological conditions in the Dnieper-Bug estuary. In theflood period the Dnieper water fills the estuary. Average flushing time is about 9 days. Intrusions ofseawater are implemented by wind-induced surges (tides are negligibly small) and longitudinal pressuregradients due to density differences which are most pronounced in the bottom layer. A noticeable saltwedge with salinity 3-7 psu above average is formed under low wind (less than 5 m sec-1) or iceconditions. During north-easterly and easterly winds the water column is fairly homogeneous, and thelongitudinal salinity differences do not exceed 4-5 psu.
Figure 3.2. Location and map of Dnieper-Bug estuarine system, with boundaries marked.
The climate is determined by atmospheric processes over the European part of the former USSR. Thereare four seasons: winter (December-February), spring (March-May), summer (July-August), and
Black SeMediterranean Sea
Dnieper-Bugestuary
Black Sea
30°E 32 34 36 38 40
40°N
42
44
46
Dni eperestuary
21
autumn (September-November). The climate of the eastern part of the estuary is more continental thanin the west. The mean annual temperature of the air is 10.0ºC at the meteorological station in Kherson,9.7ºC in Mykolajiv, and 9.8ºC in Ochakov (see Figure 3.2 for location of these stations). The warmestmonths of the year are July and August, while the coldest months are January and February. Theaverage annual precipitation is 435 mm yr-1. Precipitation in autumn and winter is less than in summer.As summer evaporation exceeds precipitation there is drought in summer. Evaporation from the watersurface reaches 660 mm yr-1 (Kherson) and 860 mm yr-1 (Ochakov) being highest in July and lowest inJanuary/February. Evaporation from land is about 350 mm yr-1 (Mykolajiv), 340 mm yr-1 (Kherson),302 mm yr-1 (Ochakov). It snows from October to April, with 21-23 snow days at Kherson andOchakov and 29 days at Mykolajiv. The maximum number of days with snow are recorded in January:(8 days at Mykolajiv, 6 days at Ochakov and 5 days at Kherson) (Kostianitsyn 1964).
The Dnieper-Bug estuarine system has been impacted from port, industrial, urban, and agriculturaldevelopment in the region. Starting in the early 1950s, six large storage reservoirs and several smallerones (with a combined storage capacity of 44 km3) were built on the Dnieper River for producinghydroelectric power. When the hydroenergy complexes and water withdrawal and disposal systemsbecame fully operational in the early 1970’s, seasonal river flow patterns had been artificially modifiedand the annual river discharge from the Dnieper River had noticeably decreased. New flow conditionschanged the concentration of organic materials and nutrients, which determine the biologicalproductivity of the receiving basin. Following reservoir construction (1956-1969) the transport of thenitrogen in the lower Dnieper River and the estuary increased by 53% (Tolmazin 1985). In 1980-1990the discharge of total nitrogen from the Dnieper River increased by 1.6 times and the total phosphorusdischarge from the Dnieper River increased by 5 times compared to the discharges of 1951-1960(Zaitsev 1993).
The rivers and the port and metropolitan areas of Mykolajiv and Kherson remain the main sources ofpollutant fluxes to the estuary. There are >33 million people living in the Dnieper River basin, withpopulations of Mykolajiv and Kherson about 503,000 and 355,000. Annually, Mykolajiv contributesabout 49% of the total waste load of the Dnieper–Bug estuary and Kherson about 32%. About 63% ofwastewater discharges into the Bug estuary and 37% into the Dnieper estuary. In 1999 about 114x106
m3 of wastewater (including 7.2x10⁶ m3 without purification, 62.5x10⁶ m3 with insufficient purification,800 t of nitrogen and 289 t of phosphates) were discharged into the estuary (Ryabinin 2000). Thisamount was 1.7 times less than in 1995.
The budget calculations were based on the following data: the nutrient concentrations for the rivers andthe estuaries were taken from Gubanov et al. (1995) as averages for 1987-1991 years; salinity andnutrient concentrations for the adjacent coastal waters were taken from Garkavaya, et al. 2000; andsalinity for the estuaries were from Ryabinin (1999).
Water and salt balance
As the Dnieper-Bug estuary includes two estuaries, a two-box in series model was used for budgetcalculations.
Two rivers provide most of the freshwater input into the systems: the Dnieper River into the Dnieperestuary and the South Bug River into the Bug estuary. The river discharge is 128x106 m3 d-1 for theDnieper river and 8x10⁶ m3 d-1 for the South Bug river. The groundwater discharge is about 0.2x10 6 m3
d-1 (Timchenko 1990 ). The precipitation in the region is about 420 mm yr-1 for the Dnieper estuary and470 mm yr-1 (meteorological station Mykolajiv) for the Bug estuary. Evaporation is 760 mm yr-1 and764 mm yr-1 accordingly. As groundwater discharge, net precipitation and evaporation rates are smallcompared with riverine inputs, they are assumed equal to 0.
The salinity of the system increases from east (delta of the Dnieper) to west (Kinburn canal) withvertical and horizontal gradients of salinity, except of flooding time when the waters of the Dnieper fillthe estuary. Samples were usually taken at the surface (0-0.5m) and near the bottom (1m from the
22
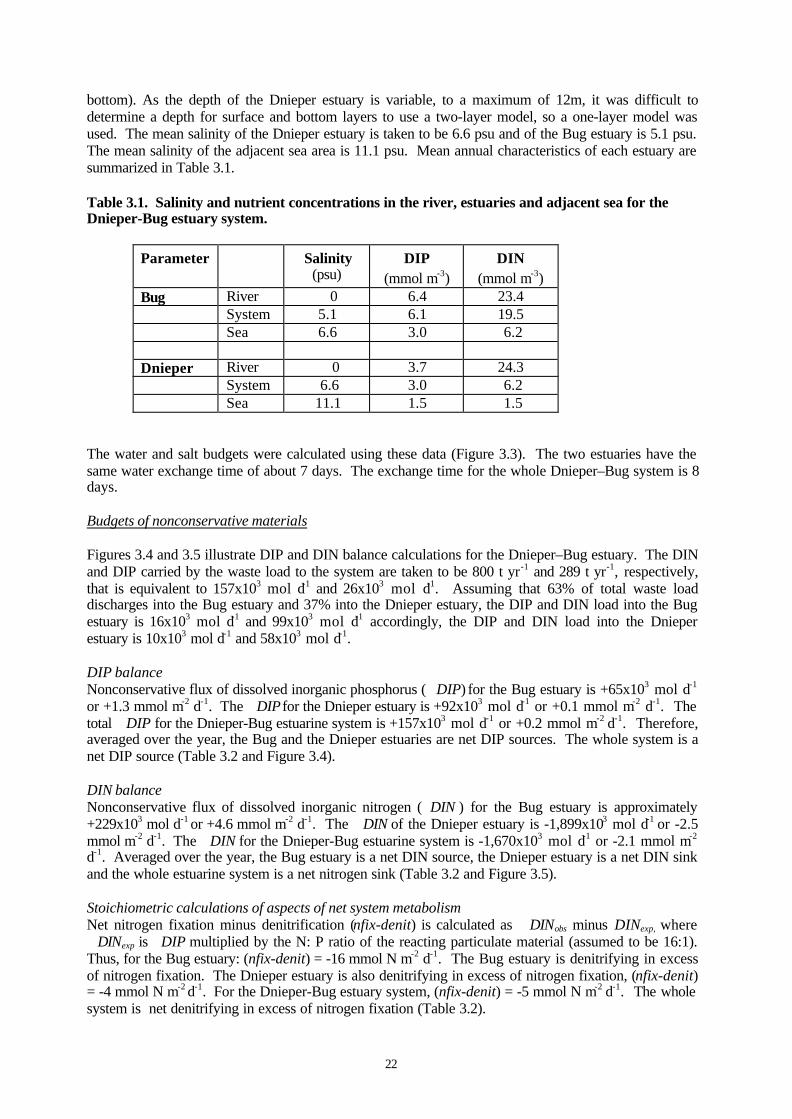
bottom). As the depth of the Dnieper estuary is variable, to a maximum of 12m, it was difficult todetermine a depth for surface and bottom layers to use a two-layer model, so a one-layer model wasused. The mean salinity of the Dnieper estuary is taken to be 6.6 psu and of the Bug estuary is 5.1 psu.The mean salinity of the adjacent sea area is 11.1 psu. Mean annual characteristics of each estuary aresummarized in Table 3.1.
Table 3.1. Salinity and nutrient concentrations in the river, estuaries and adjacent sea for theDnieper-Bug estuary system.
The water and salt budgets were calculated using these data (Figure 3.3). The two estuaries have thesame water exchange time of about 7 days. The exchange time for the whole Dnieper–Bug system is 8days.
Budgets of nonconservative materials
Figures 3.4 and 3.5 illustrate DIP and DIN balance calculations for the Dnieper–Bug estuary. The DINand DIP carried by the waste load to the system are taken to be 800 t yr-1 and 289 t yr-1, respectively,that is equivalent to 157x103 mol d-1 and 26x103 mol d-1. Assuming that 63% of total waste loaddischarges into the Bug estuary and 37% into the Dnieper estuary, the DIP and DIN load into the Bugestuary is 16x103 mol d-1 and 99x103 mol d-1 accordingly, the DIP and DIN load into the Dnieperestuary is 10x103 mol d-1 and 58x103 mol d-1.
DIP balanceNonconservative flux of dissolved inorganic phosphorus (�DIP) for the Bug estuary is +65x103 mol d-1
or +1.3 mmol m-2 d-1. The �DIP for the Dnieper estuary is +92x103 mol d-1 or +0.1 mmol m-2 d-1. Thetotal �DIP for the Dnieper-Bug estuarine system is +157x103 mol d-1 or +0.2 mmol m-2 d-1. Therefore,averaged over the year, the Bug and the Dnieper estuaries are net DIP sources. The whole system is anet DIP source (Table 3.2 and Figure 3.4).
DIN balanceNonconservative flux of dissolved inorganic nitrogen (�DIN ) for the Bug estuary is approximately+229x103 mol d-1 or +4.6 mmol m-2 d-1. The �DIN of the Dnieper estuary is -1,899x103 mol d-1 or -2.5mmol m-2 d-1. The �DIN for the Dnieper-Bug estuarine system is -1,670x103 mol d-1 or -2.1 mmol m-2
d-1. Averaged over the year, the Bug estuary is a net DIN source, the Dnieper estuary is a net DIN sinkand the whole estuarine system is a net nitrogen sink (Table 3.2 and Figure 3.5).
Stoichiometric calculations of aspects of net system metabolismNet nitrogen fixation minus denitrification (nfix-denit) is calculated as �DINobs minus DINexp, where�DINexp is �DIP multiplied by the N: P ratio of the reacting particulate material (assumed to be 16:1).Thus, for the Bug estuary: (nfix-denit) = -16 mmol N m-2 d-1. The Bug estuary is denitrifying in excessof nitrogen fixation. The Dnieper estuary is also denitrifying in excess of nitrogen fixation, (nfix-denit)= -4 mmol N m-2 d-1. For the Dnieper-Bug estuary system, (nfix-denit) = -5 mmol N m-2 d-1. The wholesystem is net denitrifying in excess of nitrogen fixation (Table 3.2).
23
Table 3.2. Summary of nonconservative nutrient fluxes, apparent net metabolism (p-r) andnitrogen fixation minus denitrification (nfix-denit) for the Dnieper-Bug estuary.
Net ecosystem metabolism, the difference between primary production and respiration (p-r) is estimatedas �DIP multiplied by the C:P ratio of the reacting organic material (assumed to be 106:1). Therefore,for the Bug estuary (p-r) is estimated to be -138 mmol C m-2 d-1. Bug estuary appears to be netheterotrophic. For the Dnieper estuary, (p-r) = -11 mmol C m-2 d-1) thus appears to be net heterotrophic.For Dnieper-Bug estuary system, (p-r) = -21 mmol C m-2 d-1. The whole system appears to be netheterotrophic (Table 3.2).
Figure 3.3. Water and salt budgets for the Dnieper-Bug estuary. Water flux in 106 m3 d-1 and saltflux in 106 psu-m3 d-1.
Dnieper V2 = 3 x 10 m A2 = 750 x 10 m
S2 = 6.6 psu ττ 2 2 = 7 days
VQ1 = 8 VQ2SQ2 = 0
Socn = 11.1 psu SR = 8.85 psu
ττsyst = 8 days
VR2 = 136 VR2 = 8
Bug V1 = 0.3 x 10 m A1 = 50 x 10 m S1 = 5.1 psu ττ 1 1 = 8 days
VP1 = 0 VP1SP1 = 0
VE1 = 0 VE1SE1 = 0
6 3
9 2236
9
VQ2 = 128 VQ2SQ2 = 0
VX1(S2-S1) = -VR1SR1 = 47 VX1 = 31
VP2 = 0 VP2SP2 = 0
VE2 = 0 VE2SE2 = 0
VX2(Socn-S2) = -VR2SR2 = 1,204 VX2 = 268
24
Figure 3.4. DIP budget for the Dnieper-Bug estuary. Flux in 103 mol d-1.
Figure 3.5. DIN budget for the Dnieper-Bug estuary. Flux in 103 mol d-1.
Dnieper DIP2 = 3.0 mmol m
∆∆DIP22 = +92
DIPQ1 = 6.4 mmol m VQ1DIPQ1 = 51
DIPocn = 1.5 mmol m VR2DIPR2 = 306
∆∆DIPsyst = +157
VR1DIPR1 = 36
Bug DIP1 = 6.1 mmol m
∆∆DIP1 1 = +65
DIPQ2 = 3.7 mmo m VQ2DIPQ2 = 474
VX2(DIPocn-DIP2) =402
VX1(DIP2-DIP1) = 96
-3-3
-3-3
-3
VO1DIPO1 = 16
VO2DIPO2 = 10
Dnieper DIN2 = 6.2 mmol m
∆∆DIN 22 = -1,899
DINQ1 = 23.4 mmol m VQ1DINQ1 = 187
DINocn = 1.5 mmol m VR2DINR2 = 524
∆∆DINsyst = -1,670
VR1DINR1 = 103
Bug DIN1 = 19.5 mmol m
∆∆DIN 1 1 = +229
DINQ2 = 24.3 mmo m VQ2DINQ2 = 3,110
VX2(DINocn -DIN2) = 1,260
VX1(DIN2-DIN1) = 412
-3 -3
-3-3
-3
VO1DINO1 = 99
VO2DINO2 = 58
25
3.2 Dniester River Estuary
Inna Yurkova
Study area description
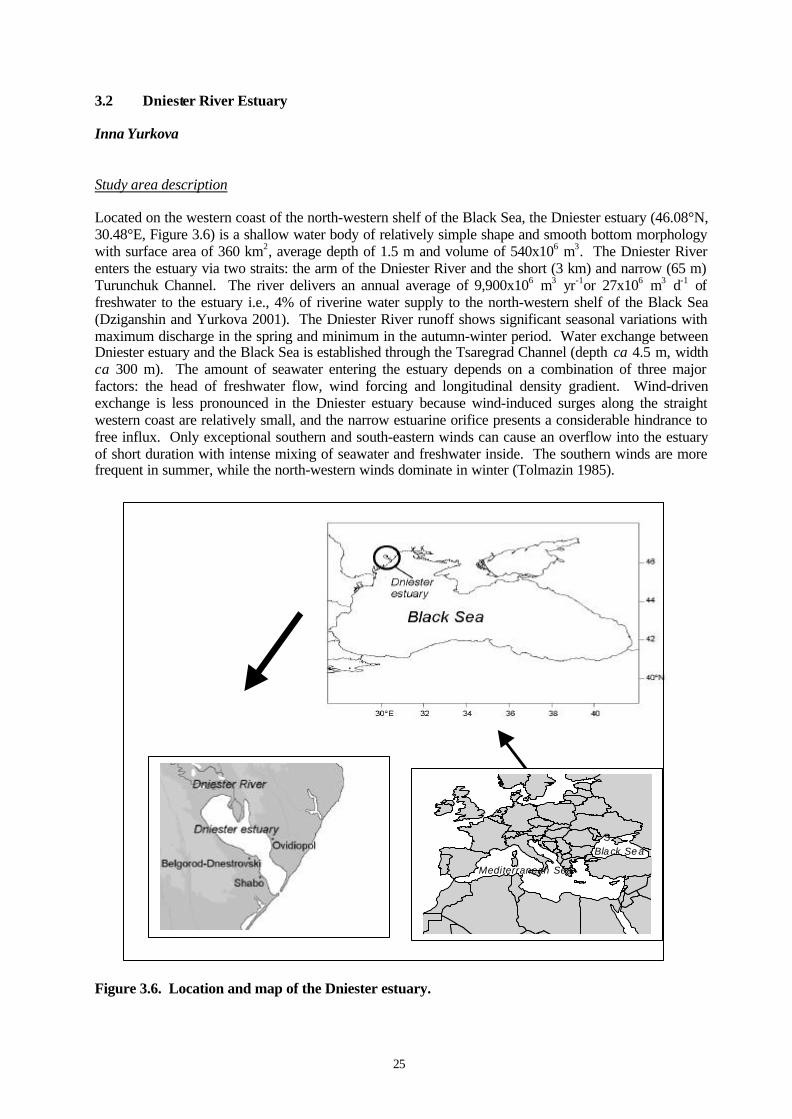
Located on the western coast of the north-western shelf of the Black Sea, the Dniester estuary (46.08°N,30.48°E, Figure 3.6) is a shallow water body of relatively simple shape and smooth bottom morphologywith surface area of 360 km2, average depth of 1.5 m and volume of 540x106 m3. The Dniester Riverenters the estuary via two straits: the arm of the Dniester River and the short (3 km) and narrow (65 m)Turunchuk Channel. The river delivers an annual average of 9,900x106 m3 yr-1or 27x106 m3 d-1 offreshwater to the estuary i.e., 4% of riverine water supply to the north-western shelf of the Black Sea(Dziganshin and Yurkova 2001). The Dniester River runoff shows significant seasonal variations withmaximum discharge in the spring and minimum in the autumn-winter period. Water exchange betweenDniester estuary and the Black Sea is established through the Tsaregrad Channel (depth ca 4.5 m, widthca 300 m). The amount of seawater entering the estuary depends on a combination of three majorfactors: the head of freshwater flow, wind forcing and longitudinal density gradient. Wind-drivenexchange is less pronounced in the Dniester estuary because wind-induced surges along the straightwestern coast are relatively small, and the narrow estuarine orifice presents a considerable hindrance tofree influx. Only exceptional southern and south-eastern winds can cause an overflow into the estuaryof short duration with intense mixing of seawater and freshwater inside. The southern winds are morefrequent in summer, while the north-western winds dominate in winter (Tolmazin 1985).
Figure 3.6. Location and map of the Dniester estuary.
Bla ck Se a
Mediterranean Sea
S
26
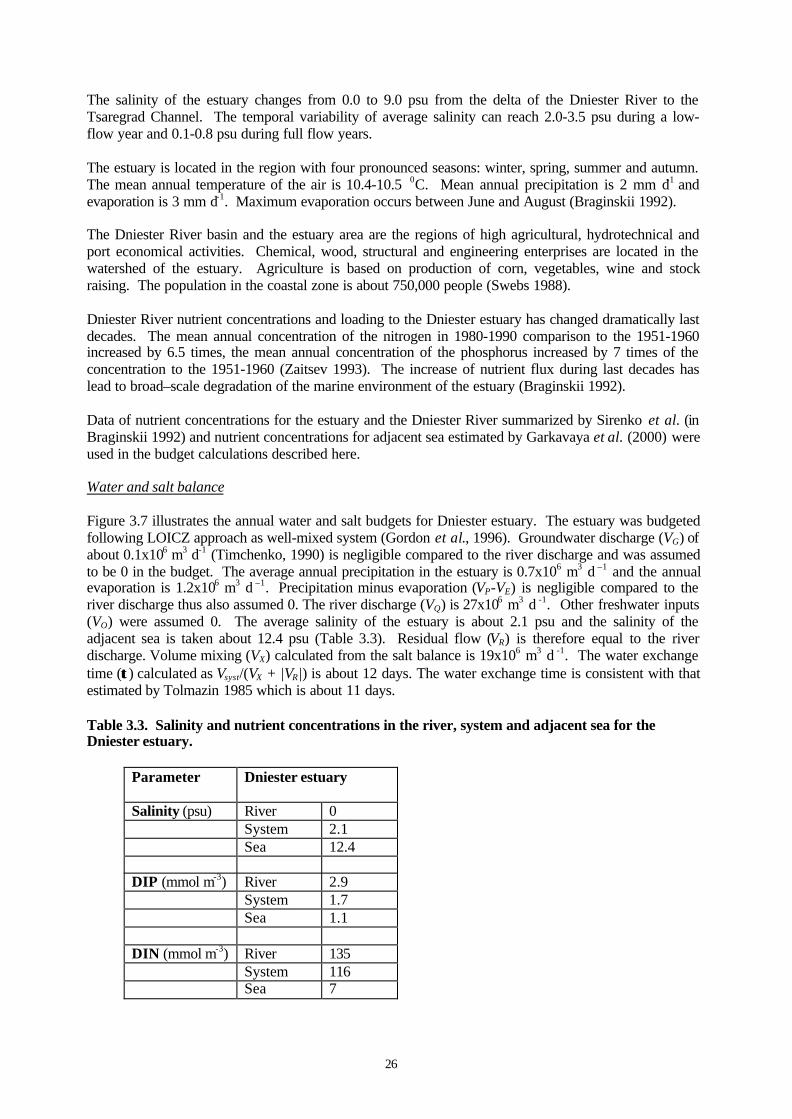
The salinity of the estuary changes from 0.0 to 9.0 psu from the delta of the Dniester River to theTsaregrad Channel. The temporal variability of average salinity can reach 2.0-3.5 psu during a low-flow year and 0.1-0.8 psu during full flow years.
The estuary is located in the region with four pronounced seasons: winter, spring, summer and autumn.The mean annual temperature of the air is 10.4-10.5 0C. Mean annual precipitation is 2 mm d-1 andevaporation is 3 mm d-1. Maximum evaporation occurs between June and August (Braginskii 1992).
The Dniester River basin and the estuary area are the regions of high agricultural, hydrotechnical andport economical activities. Chemical, wood, structural and engineering enterprises are located in thewatershed of the estuary. Agriculture is based on production of corn, vegetables, wine and stockraising. The population in the coastal zone is about 750,000 people (Swebs 1988).
Dniester River nutrient concentrations and loading to the Dniester estuary has changed dramatically lastdecades. The mean annual concentration of the nitrogen in 1980-1990 comparison to the 1951-1960increased by 6.5 times, the mean annual concentration of the phosphorus increased by 7 times of theconcentration to the 1951-1960 (Zaitsev 1993). The increase of nutrient flux during last decades haslead to broad–scale degradation of the marine environment of the estuary (Braginskii 1992).
Data of nutrient concentrations for the estuary and the Dniester River summarized by Sirenko et al. (inBraginskii 1992) and nutrient concentrations for adjacent sea estimated by Garkavaya et al. (2000) wereused in the budget calculations described here.
Water and salt balance
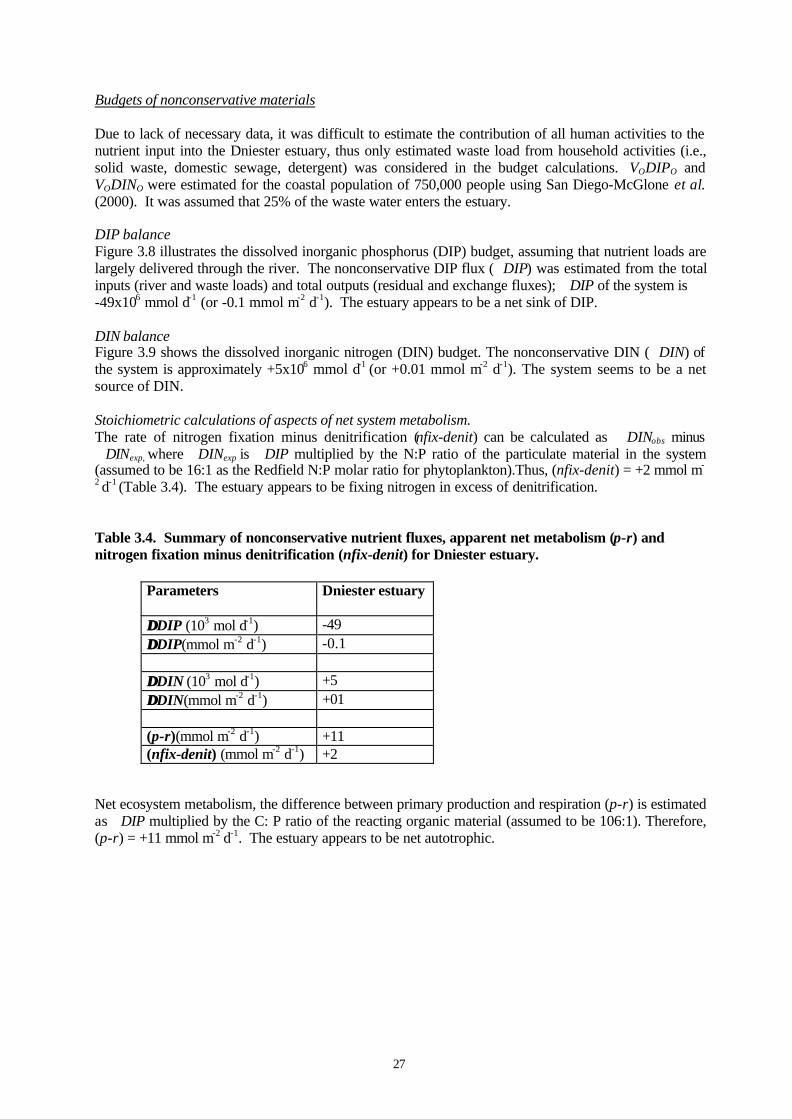
Figure 3.7 illustrates the annual water and salt budgets for Dniester estuary. The estuary was budgetedfollowing LOICZ approach as well-mixed system (Gordon et al., 1996). Groundwater discharge (VG) ofabout 0.1x10⁶ m3 d-1 (Timchenko, 1990) is negligible compared to the river discharge and was assumedto be 0 in the budget. The average annual precipitation in the estuary is 0.7x10⁶ m3 d –1 and the annualevaporation is 1.2x10⁶ m3 d –1. Precipitation minus evaporation (VP-VE) is negligible compared to theriver discharge thus also assumed 0. The river discharge (VQ) is 27x106 m3 d -1. Other freshwater inputs(VO) were assumed 0. The average salinity of the estuary is about 2.1 psu and the salinity of theadjacent sea is taken about 12.4 psu (Table 3.3). Residual flow (VR) is therefore equal to the riverdischarge. Volume mixing (VX) calculated from the salt balance is 19x106 m3 d -1. The water exchangetime (ττ) calculated as Vsyst/(VX + |VR|) is about 12 days. The water exchange time is consistent with thatestimated by Tolmazin 1985 which is about 11 days.
Table 3.3. Salinity and nutrient concentrations in the river, system and adjacent sea for theDniester estuary.
Parameter Dniester estuary
Salinity (psu) River 0System 2.1Sea 12.4
DIP (mmol m-3) River 2.9System 1.7Sea 1.1
DIN (mmol m-3) River 135System 116Sea 7
27
Budgets of nonconservative materials
Due to lack of necessary data, it was difficult to estimate the contribution of all human activities to thenutrient input into the Dniester estuary, thus only estimated waste load from household activities (i.e.,solid waste, domestic sewage, detergent) was considered in the budget calculations. VODIPO andVODINO were estimated for the coastal population of 750,000 people using San Diego-McGlone et al.(2000). It was assumed that 25% of the waste water enters the estuary.
DIP balanceFigure 3.8 illustrates the dissolved inorganic phosphorus (DIP) budget, assuming that nutrient loads arelargely delivered through the river. The nonconservative DIP flux (�DIP) was estimated from the totalinputs (river and waste loads) and total outputs (residual and exchange fluxes); �DIP of the system is-49x106 mmol d-1 (or -0.1 mmol m-2 d-1). The estuary appears to be a net sink of DIP.
DIN balanceFigure 3.9 shows the dissolved inorganic nitrogen (DIN) budget. The nonconservative DIN (�DIN) ofthe system is approximately +5x10⁶ mmol d-1 (or +0.01 mmol m-2 d-1). The system seems to be a netsource of DIN.
Stoichiometric calculations of aspects of net system metabolism.The rate of nitrogen fixation minus denitrification (nfix-denit) can be calculated as �DINobs minus�DINexp, where �DINexp is �DIP multiplied by the N:P ratio of the particulate material in the system(assumed to be 16:1 as the Redfield N:P molar ratio for phytoplankton).Thus, (nfix-denit) = +2 mmol m-
2 d-1 (Table 3.4). The estuary appears to be fixing nitrogen in excess of denitrification.
Table 3.4. Summary of nonconservative nutrient fluxes, apparent net metabolism (p-r) andnitrogen fixation minus denitrification (nfix-denit) for Dniester estuary.
Net ecosystem metabolism, the difference between primary production and respiration (p-r) is estimatedas �DIP multiplied by the C: P ratio of the reacting organic material (assumed to be 106:1). Therefore,(p-r) = +11 mmol m-2 d-1. The estuary appears to be net autotrophic.
28
Figure 3.7. Water and salt budgets for the Dniester estuary. Water flux in 106 m3 d-1 and salt fluxin 106 psu-m3 d-1.
Figure 3.8. DIP budget for the Dniester estuary. Flux in 103 mol d-1.
Figure 3.9. DIN budget for the Dniester estuary. Flux in 103 mol d-1.
Dniester estuary Vsyst = 540 x 10 m Asyst = 360 x 10 m
Ssyst = 2.1 psu
τ τ = 12 days
VQ = 27 VQSQ = 0
VR = 27
Socn = 12.4 psu
SR = 7.25 psu
VX(Socn-Ssyst) = -VRSR = 196 VX = 19
6 3VG = 0 VGSG = 0 9 2
VO = 0 VOSO = 0
VP = 0 VPSP = 0
VE = 0 VESE = 0
Dniester estuary DIPsyst = 1.7 mmol m
∆∆DIP = -49
VQDIPQ = 78 VRDIPR = 38
DIPocn = 1.1 mmol m
DIPR = 1.4 mmol m
VX(DIPocn-DIPsyst) = 11
VGDIPG = 0
VODIPO = 20
VatmDIPatm = 0
-3
-3
-3
Dniester estuary DINsyst = 116 mmol m
∆∆DIN = +5
VQDINQ = 3,645 VRDINR = 1,661
DINocn = 7 mmol m
DINR = 61.5 mmol m
VX(DINocn-DINsyst) = 2,071
VGDING = 0
VODINO = 82
VatmDINatm = 0
-3
-3
-3
29
3.3 Donuzlav Estuary
Inna Yurkova
Study area description.
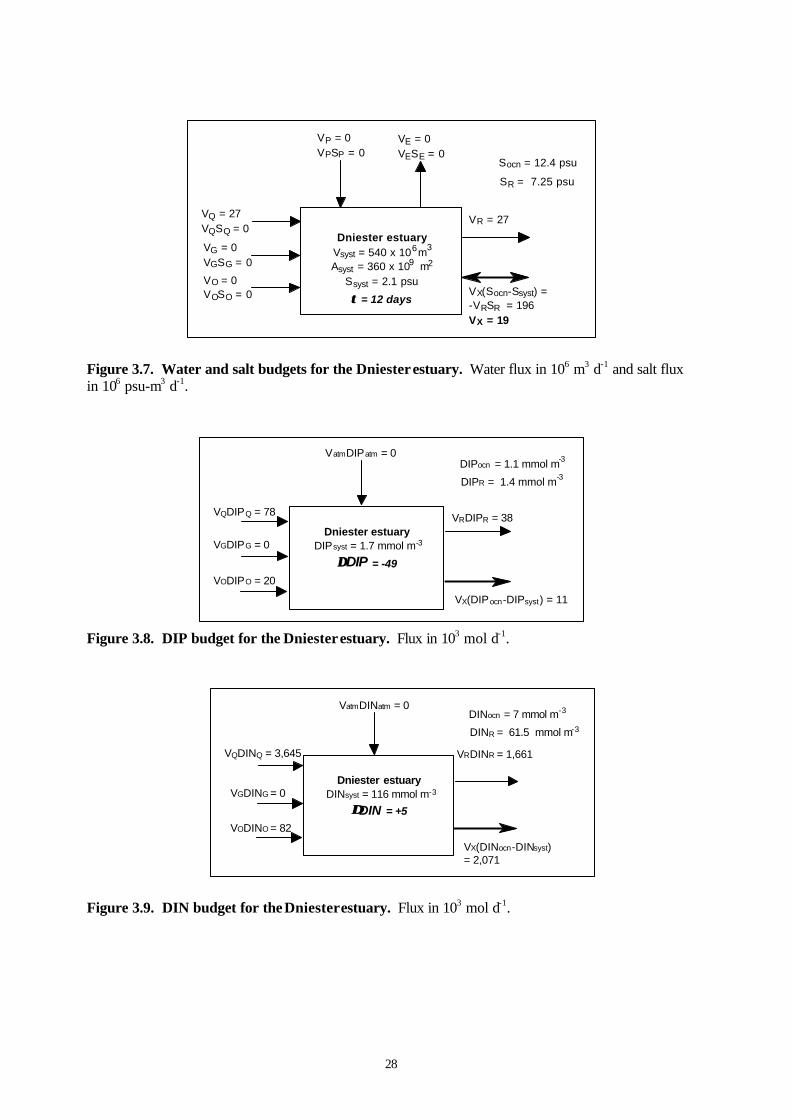
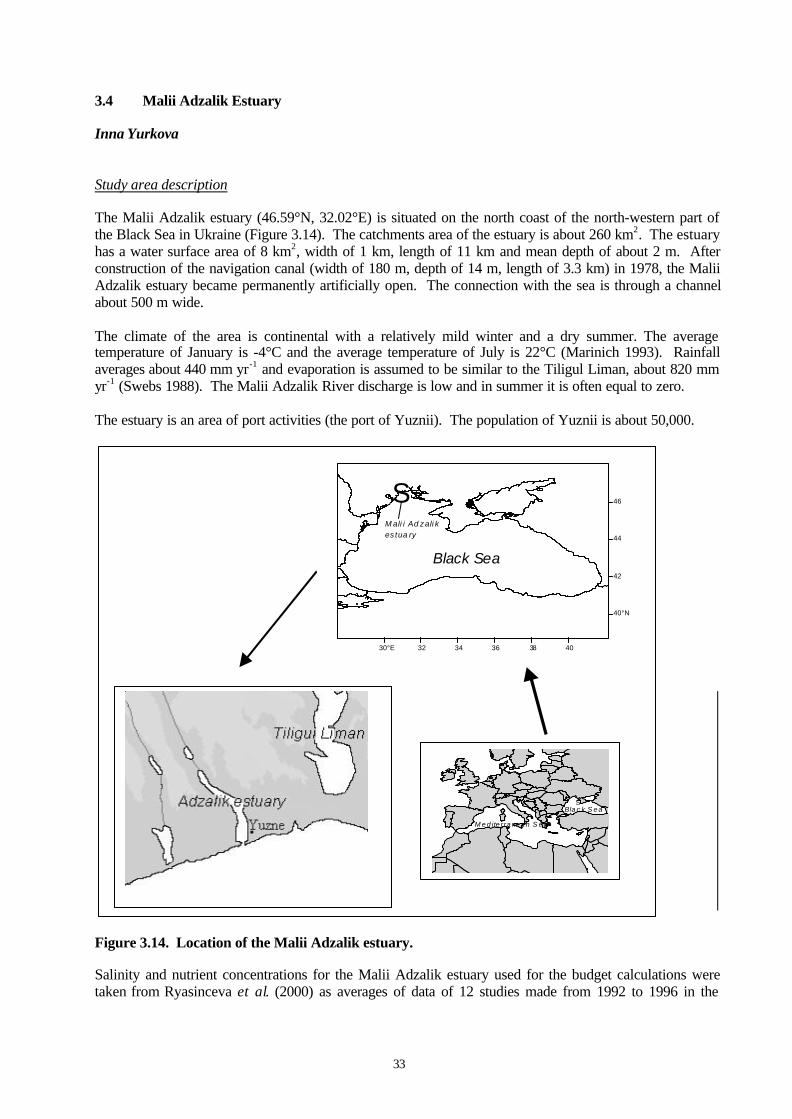
The Donuzlav estuary (45.5°N, 33.0°E; Figure 3.10) is located on the north-west coast of the CrimeanPeninsula in Ukraine. The estuary occupies an area of 48 km2 with a length of about 30 km orientedfrom north-east to south-west. The estuary is shallow (1-3 m), although the depths in the central roughreach 20-25 m.
Until the 1960s the Donuzlav estuary was isolated from the sea by a sand barrier and was the secondlargest salt lake in the Crimea. In 1961, the lake was connected to the sea by navigable canal (400 mwide, 12m deep). The salinity of the estuary equalised to the salinity of the adjacent coastal waters inthe 1970s, and now varies from 17.5 to 18.2 psu. The dynamics of the estuary are determined by itsmorphology and by wind conditions. Wind is the main force driving water exchange with the adjacentsea. The process of water mixing affects shallow waters from surface to bottom; water exchange in thedeeper part of the estuary occurs through anti-currents, cyclonic and anti-cyclonic circles. In some deeptrenches there is restricted water exchange leading to stagnation phenomena (Kovrigina. andNemirovsky 1999). There is no significant river discharge into the estuary.
The climate of the region is moderate-continental with a warm winter and a hot summer. The averageannual temperature of the air is 11.0°C, the mean temperature of the warmest month is 23.2°C, and themean temperature of the coldest one (January) is -0.1°C (Bazov 1983). Annual precipitation is about358 mm yr-1 and evaporation is about 785 mm yr-1.
Figure 3.10. Location and map of the Donuzlav estuary.
Black Sea
30° E 32 34 36 38 40
40°N
42
44
46
SD o nu zl ave s tuar y
Bla c k S e a
M e d ite rra ne a n S e a
S
30
The Donuzlav estuary is an area of reproduction and nursery for many valuable fish species, such asmullet, flatfish and sturgeon. It is also the location of one of the largest Ukrainian underwater sandquarrying operations, which occupies about 7.5 % of the shallow estuarine area. Approximately200x103 m3 to 300x103 m3 of sand are removed annually (1994 data). Investigations showed that thesand withdrawal did not negatively affect pelagic fish (Zuev and Boltachev 1999). The estuary alsocontains a naval base and several small towns with a total population of about 6,000 (as of 1992).
The hydro-chemical regime of the Donuzlav estuary is relatively poorly known. The first studies of theestuary (1963 to 1964) are reported in Shulgina (1966). Further studies were made 30 years later(Kovrigina and Kuftarkova 1997). The estuarine salinity and nutrient data used for the budgetcalculations were means of measurements collected in May-October 1990 and June-August 1997(Kovrigina and Nemirovsky 1999). The nutrient concentrations of the adjacent sea were taken fromGarkavaya et al. (2000).
Water and salt budgets.
Figure 3.11 shows the water and salt budgets for Donuzlav estuary. The estuary was treated as singlebox, single layer model due to developed mixing processes in the system. The mean salinity of theestuary is about 18.2 psu higher than salinity of the adjacent sea which is 18.0 psu (Kovrigina andNemirovsky 1999). As there is no significant river input to the estuary and data on the groundwaterdischarges are not available, they are assumed to be zero. The annual precipitation is 50x103 m3 d-1 andevaporation is 100x103 m3 d-1. The calculated residual flow is 50x103 m3 d-1 (VR). Mixing exchange isabout 4,500x103 m3 d-1 (VX). Estimated VX using an alternative equation without relying on the salinitydifference but vertical shear diffusion (Yanagi 2000) is about 4,600x103 m3 d-1 which agrees well withthe VX estimated through water and salt balance approach. Residual flow velocity (U) used in the sheardiffusion equation was 104 m d-1 or 0.1 m sec-1. Water exchange time for the Donuzlav estuary isestimated to be about a month (31 days).
Budgets of nonconservative materials
There are no data on waste load into the estuary, so the DIN and DIP export from the 6,000 peopleliving near the coast were calculated using LOICZ approach. It was assumed that because the sewage-disposal systems are old, 40% of the wastewater is discharged to the estuary. The calculated DIN andDIP fluxes (VODIPO and VODINO) from the population are 200 mol d-1 and 1,000 mol d-1, respectively.
DIP balanceFigure 3.12 summarizes the dissolved inorganic phosphorus (DIP) budget. The estuary is a net sink forthe dissolved inorganic phosphorus; ∆DIP = -210 mol d-1 (-0.004 mmol m-2 d-1).
DIN balanceFigure 3.13 summarizes the dissolved inorganic nitrogen (DIN) budget. The estuary is a net source forthe dissolved inorganic nitrogen; ∆DIN = +2.1x10³ mol d-1 (+0.04 mmol m-2 d-1).
Table 3.5. Salinity and nutrient concentrations in the Donuzlav estuary system and adjacent sea.
Parameter Donuzlav estuarySalinity (psu) System 18.2
Sea 18.0
DIP (mmol m-3) System 0.2Sea 0.2
DIN (mmol m-3) System 1.2Sea 0.5
31
Stoichiometric calculations of aspects of net system metabolismStoichiometric estimates can be based on the molar C:N:P ratio of reacting material in the system. It isassumed that this material is plankton, with a Redfield C:N:P molar ratio of 106:16:1.
Stoichiometric analysis of the nonconservative fluxes indicated that the estuary is net nitrogen-fixing:(nfix-denit) = +0.1 mmol m-2 d-1 and net autotrophic: (p-r) = +0.4 mmol m-2 d-1 (see Table 3.6).
Table 3.6. Summary of nonconservative nutrient fluxes, apparent net metabolism (p-r) andnitrogen fixation minus denitrification (nfix-denit) for the Donuzlav estuary.
Figure 3.11. Water and salt budgets for the Donuzlav estuary. Water flux in 103 m3 d-1 and saltflux in 103 psu-m3 d-1.
Donuzlav Estuary Vsyst = 144 x 10 m Asyst = 48 x 10 m
Ssyst = 18.2 psu
τ τ = 31 days
VQ = 0 VQSQ = 0
VR = 50
Socn = 18.0 psu
SR = 18.1 psu
VX(Socn-Ssyst) = -VRSR = 905 VX = 4,525
6 3VG = 0 VGSG = 0 6 2
VO = 0 VOSO = 0
VP = 50 VPSP = 0
VE = 100 VESE = 0
32
Figure 3.12. DIP budget for the Donuzlav estuary. Flux in mol d-1.
Figure 3.13. DIN budget for the Donuzlav estuary. Flux in mol d-1.
Donuzlav Estuary DIPsyst = 0.2 mmol m
∆∆DIP = -210
VQDIPQ = 0 VRDIPR = 10
DIPocn = 0.2 mmol m
DIPR = 0.2 mmol m
VX(DIPocn-DIPsyst) = 0
VGDIPG = 0
VODIPO = 200
VatmDIPatm = 0
-3
-3
-3
Donuzlav Estuary DINsyst = 1.2 mmol m
∆∆DIN = +2,125
VQDINQ = 0 VRDINR = 43
DINocn = 0.5 mmol m
DINR = 0.85 mmol m
VX(DINocn-DINsyst) = 3,168
VGDING = 0
VODINO = 1,000
VatmDINatm = 0
-3
-3
-3
33
3.4 Malii Adzalik Estuary
Inna Yurkova
Study area description
The Malii Adzalik estuary (46.59°N, 32.02°E) is situated on the north coast of the north-western part ofthe Black Sea in Ukraine (Figure 3.14). The catchments area of the estuary is about 260 km2. The estuaryhas a water surface area of 8 km2, width of 1 km, length of 11 km and mean depth of about 2 m. Afterconstruction of the navigation canal (width of 180 m, depth of 14 m, length of 3.3 km) in 1978, the MaliiAdzalik estuary became permanently artificially open. The connection with the sea is through a channelabout 500 m wide.
The climate of the area is continental with a relatively mild winter and a dry summer. The averagetemperature of January is -4°C and the average temperature of July is 22°C (Marinich 1993). Rainfallaverages about 440 mm yr-1 and evaporation is assumed to be similar to the Tiligul Liman, about 820 mmyr-1 (Swebs 1988). The Malii Adzalik River discharge is low and in summer it is often equal to zero.
The estuary is an area of port activities (the port of Yuznii). The population of Yuznii is about 50,000.
Figure 3.14. Location of the Malii Adzalik estuary.
Salinity and nutrient concentrations for the Malii Adzalik estuary used for the budget calculations weretaken from Ryasinceva et al. (2000) as averages of data of 12 studies made from 1992 to 1996 in the
Black Sea
30°E 32 34 36 38 40
40°N
42
44
46SM ali i Ad zali kes tua ry
Bla c k S e a
M e d ite rra ne a n S e a
S
34
estuary. Nutrient concentrations for the adjacent coastal waters were taken from Garkavaya et al. (2000);salinity of the sea was taken from Terziev (1986). The estuary was considered as a one-box model.
Water and salt balance
Precipitation (VP) and evaporation (VE) are 10x103 m3d–1 and 20x103 m3d–1, respectively. The riverdischarge in the water budget can apparently be ignored due to its insignificance and is assumed to bezero. The salinity of the system is 14.8 psu and the adjacent sea is 13.5 psu.
Figure 3.15 summarizes the water and salt budget calculations for the Malii Adzalik estuary. Thecalculated water exchange time is 126 days.
Budgets of nonconservative materials
Wasteload to the estuary was calculated using the LOICZ approach for the 50,000 residents of Yuznii.Assuming that only 25 % of the wastewater enters the estuary, the DIP and DIN fluxes are 1,400 mol d-1
and 5,400 mol d-1 , respectively.
Table 3.7. Salinity and nutrient concentrations in the system and adjacent sea for Malii Adzalikestuary.
Parameter Malii Adzalik estuary
Salinity (psu) System 14.8Sea 13.5
DIP (mmol m-3) System 0.8Sea 0.9
DIN (mmol m-3) System 1.6Sea 1.0
DIP balance.The �DIP of the system is -1,420 mol d-1 (-0.2 mmol m-2 d-1). The estuary is a net sink of phosphorus(Figure 3.16).
N balanceThe �DIN of the system is -5,348 mol d-1 (-0.7 mmol m-2 d-1). The estuary is a net sink of nitrogen(Figure 3.17).
Stoichiometric calculations of aspects of net system metabolismIt was assumed that reacting material in the system is plankton, with a Redfield C:N:P molar ratio of106:16:1. Net nitrogen fixation minus denitrification (nfix-denit) for the estuary is +2 mmol m-2 d-1.The estuary appears to be fixing nitrogen in excess of denitrification. Net ecosystem metabolism, thedifference between primary production and respiration (p-r) is +19 mmol m-2 d-1. The estuary appearsto be a net autotrophic (see Table 3.8).
35
Table 3.8. Summary of nonconservative nutrient fluxes, apparent net metabolism (p-r) andnitrogen fixation minus denitrification (nfix-denit) for the Malii Adzalik estuary.
Figure 3.15. Water and salt budgets for Malii Adzalik estuary. Water flux in 103 m3 d-1 and saltflux in 103 psu-m3 d-1.
Figure 3.16. DIP budget for Malii Adzalik estuary. Flux in mol d-1.
Figure 3.17. DIN budget for Malii Adzalik estuary. Flux in mol d-1.
Malii Adzalik Vsyst = 15 x 10 m Asyst = 8 x 10 m Ssyst = 14.8 psu
τ τ = 126 days
VQ = 0 VQSQ = 0
VR = 10
Socn = 13.5 psu
SR = 14.15 psu
VX(Socn-Ssyst) = -VRSR = 142 VX = 109
3VG = 0 VGSG = 0
6 2
VO = 0 VOSO = 0
VP = 10 VPSP = 0
VE = 20 VESE = 0
6
Malii Adzalik DIPsyst = 0.8 mmol m
∆∆DIP = -1,420
VQDIPQ = 0 VRDIPR = 9
DIPocn = 0.9 mmol m
DIPR = 0.85 mmol m
VX(DIPocn-DIPsyst) = 11
VGDIPG = 0
VODIPO = 1,400
VatmDIPatm = 0
-3
-3
-3
Malii Adzalik DINsyst = 1.6 mmol m
∆∆DIN = -5,348
VQDINQ = 0 VRDINR = 13
DINocn = 1.0 mmol m
DINR = 1.3 mmol m
VX(DINocn-DINsyst) = 65
VGDING = 0
VODINO = 5,400
VatmDINatm = 0
-3
-3
-3
36
ESTUARINE SYSTEMS OF ITALY
Northern Adriatic Sea region
The Northern Adriatic Sea is a sheltered marine system bounded to the east and north by the coastlineof Italy and to the west by the coastlines of Slovenia and Croatia. It covers an area of approximately40,000 km2 between 43°00'N and 45°45'N latitude and 12°15'E and 15°00'E longitude. It is veryshallow (average depth 30-40 m) with a bottom gently that slopes southward down to 100 m; thereaftera steeper slope separates the northern from the central basin of the Adriatic Sea. Although located inthe Mediterranean region, the climate is not typically "mediterranean" due to the high precipitation (upto 1000 mm) and low winter air temperatures (below 0oC). The climate is usually classified ascontinental and temperate with cold, foggy winters and hot, sultry summers. In winter, a strong, dry,cold wind called the “Bora” blows from the north with peak velocities of more than 100 km/h.
The circulation and distribution of the water masses along the Italian coast are strongly influenced byriverine inflow, temperature variations and Coriolis forcing. In winter, cold water diluted by thewestern river inflow remains confined within the coastal belt and flows southward along the coastline.In summer, this part of the Adriatic Sea is highly stratified with strong salinity and temperaturegradients and a wider area is affected by river discharge due to the lateral spreading of the low salinitywater. The Italian coastline from Trieste south to Ravenna is characterised by the presence of numerouscoastal lagoon and salt marsh systems which cover about 1000 km2 : these include very large systemssuch as Grado Marano and Venice lagoons, the Po River delta bays, the sheltered Valli di Comacchioand the Piallasse of Ravenna. These environments at the land-sea interface receive high nutrients loads.
The major freshwater inputs to the sea are from the Po and Adige rivers, plus a series of minorcontributors. The Po River drains a large part of northern Italy (67,000 km2) where about 15.5 millionpeople live and intense industrial and agricultural activity takes place. For this catchment, a total loadequivalent to 120 million inhabitants was used when industrial and agricultural inputs were estimated.The Adige River drains an area of 11,900 km2 with an estimated load equivalent to 8 millioninhabitants. Annual nutrient loads are estimated to be 190,000 and 14,900 tons of nitrogen and 13,200and 1,000 tons of phosphorus for the Po and Adige Rivers respectively. Due to these large nutrientinputs, the Italian coast of the Northern Adriatic Sea is highly eutrophic; in some areas large blooms ofphytoplankton occur and often induce summer anoxia causing widespread benthic mortality. Recentlythere have also been sporadic problems due to the formation of banks of mucillagenous materialthought to be derived from the phytoplankton blooms.
Gianmarco Giordani
4.1 Sacca di Goro Lagoon
P. Viaroli, G. Giordani, E. Cattaneo, J.M. Zaldívar and C.N. Murray2
SummaryThe Sacca di Goro is an eutrophic lagoon located along the North Adriatic Coast of Italy. It is the estuary of thesouthernmost branch of the Po River delta. This lagoon was investigated at two levels: water budgets wereestimated for the decade 1991-2000 and seasonal water and nutrients budgets were calculated for 1997. For bothlevels, a single box–single layer model was applied. Figure 4.3 shows the water exchange flows calculatedfollowing the two different procedures utilised (see text). For 1997, a mean water exchange time of 3 days wasestimated. Both annual mean ∆DIP and ∆DIN were positive indicating that the system is a net source of both DIPand DIN. On a seasonal basis, the system can be divided in two parts. The first semester with negative ∆DIP wascharacterised by high organic matter production. The second semester with positive ∆DIP was characterised byhigh organic matter mineralisation. These ∆DIP variations conformed to the seasonal trends of macroalgalbiomass growth and decomposition. Stoichiometric calculations were performed considering both the Redfieldratio (C:N:P=101:16:1) and the ratio for macroalgae (C:N:P=335:35:1) reported by Atkinson and Smith (1983).
37
The latter seems more suitable for the Sacca di Goro, which is affected by large blooms of macroalgae. On anannual basis, the lagoon can be considered as heterotrophic, with a net ecosystem metabolism (p-r) macroalgae ofabout -50 mmol C m-2 d-1. The DIN budgets also indicated two periods, which conformed to the macroalgalpatterns. The first semester had a positive (nfix-denit)macroalgae, whilst the second one was negative confirming thesummer dystrophic event as the boundary between an autotrophic and the following heterotrophic phase.
Study area description
The Sacca di Goro (Figure 4.1) is a shallow-water embayment of the Po River Delta (44.78-44.83°N,12.25-12.33°E). The surface area is 26 km2 and the total water volume is approximately 26x106 m3.Numerical models have demonstrated a clear zonation of the lagoon with the low energy eastern areaseparated from two higher energy zones, the western area influenced by freshwater inflow from the Podi Volano and the central area influenced by the sea. The eastern zone is very shallow (maximum depth1 m) and accounts for one half of the total surface area and one quarter of the water volume.
The lagoon is surrounded by embankments. The main freshwater inputs are the Po di Volano River(approximately 350x106 m3 yr-1), the Canal Bianco (about 20x106 m3 yr-1) and Giralda (30x106 m3 yr-1).Freshwater inlets are also located along the Po di Goro River and are regulated by sluices. There are nodirect estimates of the freshwater input from the Po di Goro, which is usually assumed to be equivalentto that of the Po di Volano. The freshwater system is mostly located in a subsident area and is regulatedby a system of pumping stations (scooping plants).
Figure 4.1. Map and location of the Sacca di Goro Lagoon.
9°E 12 1 5 18
39 °N
42
45
Italy
S
O'Osacca di Goro
Ad riaticSe a
Sacca diGoro
38
The bottom of the lagoon is flat and the sediment is alluvial mud with high clay and silt content in thenorthern and central zones. Sand is more abundant near the southern shoreline, whilst sandy mudoccurs in the eastern area.
The climate of the region is mediterranean with some continental influence (wet mediterranean).Precipitation is approximately 600 mm yr-1, with late spring and autumn peaks. However, this pattern isundergoing significant changes with an increase of short-term intense events.
The catchment is heavily exploited for agriculture, whilst the lagoon is one of the most importantaquacultural systems in Italy. About 10 km2 of the aquatic surface are exploited for farming of theManila clam (Tapes philippinarum), with an annual production of about 15,000 tons. The annualrevenue has been oscillating during the last few years around 100 million Euros.
In the last decade the nitrogen loading has been persistently high (about 2,000 t yr-1), whilst thephosphorus loading has decreased from ca 200 to ca 60 t yr-1. The lagoon is subjected to anthropogeniceutrophication, which causes extensive growth of seaweeds, especially the chlorophyceans (Ulva sp.and Cladophora sp.) in the sheltered eastern area and phytoplankton in the deeper central zone.Macroalgal growth is responsible for summer anoxia and dystrophy, which usually take place in theeastern area (for an updated review see Viaroli et al. 2001). Recent studies have also demonstrated thatthe clam stock can contribute to the oxygen depletion and internal loading (Bartoli et al. in press).
For Sacca di Goro water budgets were estimated for the decade 1991-2000 and seasonal water andnutrients budgets for 1997, when the lagoon was studied with the financial support of two EU-ELOISEprojects.
Meteorological data from the Volano station for the period 1987-2000 were supplied by the RegionalAgency for Environmental Protection (ARPA, Regione Emilia-Romagna, Bologna). Temperature andsalinity of coastal waters for the period 1984-1998 were provided by ARPA-DAPHNE Cesenatico. Weused mainly data from Station 2 (44º47’07”, 12º15’45”; depth 3 m; distance from coast 500 m), in frontof Sacca di Goro. Data concerning temperature and salinity for Sacca di Goro were obtained fromColombo et al. (1994) and Milan (1999). Data concerning freshwater loadings were obtained fromDimensione Ambiente (1991-1997) and Consorzi di Bonifica Ferraresi (1991-1999).
For 1997, four periods were identified: January-March, April-June, July-September, and October-December. Data were obtained from the ELOISE Projects “NICE: nitrogen cycling in estuaries” and“ROBUST: the role of buffering capacities in stabilising coastal lagoon ecosystems”. From January toDecember 1997, water samples were collected in the central part of the lagoon and analysed for nitrate,nitrite, ammonium and dissolved reactive phosphorus using standard analytical procedures (Dalsgaardet al. 2000). Macrophyte biomasses, primary production, benthic fluxes of oxygen and nutrients,denitrification rates and sulphur, phosphorus, iron and nitrogen were also investigated (Bartoli et al.,2001, Viaroli et al. 2001). Air temperature and wet deposition data were obtained from themeteorological network of the Province of Ferrara. The meteorological stations considered are locatedclose to the lagoon. Hydrochemical data for the Adriatic Sea stations are reported by ARPA-DAPHNE(1998). Freshwater discharge in the lagoon and additional hydrochemical data have also been obtainedfrom Bencivelli (1998).
Water and salt balance
Because the Sacca di Goro Lagoon is so shallow, the water and salt budgets were calculated using asingle box−single layer model.
The LOICZ water budget can be written as:
dVSGt/dt = VQ+ VP+ VG+ VO+ VE+ VR (1)
39
where VSG refers to the Sacca di Goro volume, VQ include the inflows from stream runoff, VP is the flowdue to direct precipitation, VG refers to groundwater, VO refers to other inflows such as sewage, VE refersto evaporation and VR refers to residual flow. For LOICZ conventions, each of the fluxes may havenegative or positive value depending on the direction of the flow (negative value for outflow from thesystem and positive for inflow to the system). Note that, by this convention, the numerical value for VE
is negative.
It is useful to consider that VR is the difference between Vin and Vout which driven by the water budget(VR = Vin- Vout). In fact, VR can be obtained assuming dVSG/dt = 0 as:
VR = Vin-Vout =-VQ-VP-VG-VO-VE (2)
For the Sacca di Goro water budget, as we used monthly evaluations of the fluxes, the term dVSG/dt inEq. (1) will tend towards zero (this term should be considered in case of time periods similar to a singletide cycle). VQ was evaluated using data from 1980 to 1997 from Dimensione Ambiente (1991-1997)and Consorzi di Bonifica Ferraresi (1991-1999). An exact estimation of the VQ entering into Sacca diGoro is difficult since we have not found data on the amount entering from Po di Goro due to thecontinually changing connections between the river and the lagoon. This flow is considered of the sameorder of magnitude of Po di Volano.
VP has been obtained from meteorological data from Po di Volano station, whereas VE has beenevaluated using an equation based on the rate of heat loss by evaporation (HE):
210E SGE
W W
H AV
ρ λ
−⋅ ⋅=⋅
(3)
where ρW is the water density in g cm-3, λW is the latent heat of vaporisation in cal g-1, ASG is the Saccadi Goro surface in m2, and HE can be evaluated using Thomann and Mueller, 1987:
HE = (19.0+0.95 ws2)(Pvs-Pva) (4)
where ws is the wind speed in m s-1 and Pvs and Pva are the saturated vapour pressure of water (mm Hg)at surface temperature and the saturated vapour pressure of water at air temperature multiplied by therelative air humidity.As can be seen from the calculations (Figure 4.2), the contributions from direct precipitation andevaporation could be neglected, as a first approximation, in comparison with the stream runoff from Podi Volano and Canal Bianco. This is due to the fact that both terms are, generally, one order ofmagnitude lower than VQ and with opposite signs. VG and VO were also considered negligible. In thesubsequent calculations, we have used VR whenever possible, otherwise we have replaced VR by -VQ.
The salt budget can be written as:
2 2( ) ( ) / 2SGSG
SG in out SG
dSV V S S V S S
dt= ⋅ − − ⋅ + (5)
where SSG refers to the Sacca di Goro salinity and S2 is the salinity in the sea just outside the lagoon. Ithas been assumed that other salinity values (runoff, groundwater, etc.) are likely to be small and can beconsidered to be zero. In this equation, the mixing terms Vin and Vout remain as the unknowns. Bycombining equations (2) and (5), it is possible to obtain:
22
1( ) / 2
( )SG
in SG R SGSG
dSV V V S S
S S dt = − + −
(6)
This flow is called the water mixing flow and, using LOICZ notation, is called VX.
There is an alternative to estimate the mixing flow (VX) without relying on a salinity difference betweenthe system and the ocean (Yanagi 2000). In this method the value of the horizontal dispersion
40
coefficient DH (m2 s-1) is estimated from the current shear and the diffusivity normal to the current shearby the following equations (Taylor 1953):
a) In case of dominant vertical shear (narrow and deep estuarine system)24
1201
=
HU
KH
DV
H (7)
b) In the case of dominant horizontal shear (wide and shallow estuarine system)
24
1201
=
WU
KW
Dh
H (8)
where H (m) is the average depth of the open boundary system; W (m) is the length of the openboundary, that is the width of the open system mouth; U (m s-1) is the residual flow velocity at thesurface layer of the open boundary; KV is the vertical diffusivity (typically 10-4 m2 s-1 in the case ofstratification or 10-3 m2 s-1 in the case of vertically well-mixed system); and Kh is the horizontaldiffusivity (m2 s-1), which may be estimated using Okubo’s (1971) relationship:
15.118WKh = (9)
where Kh is given in m2 d-1 (for LOICZ notation).
In order to decide which type of equation one should employ for a particular system, i.e., narrow anddeep or wide and shallow, Yanagi (2000) established the following criteria:
-narrow and deep: L/W > 2 and W/H<500-wide and shallow: L/W<2 and W/H>500
where L (m) is the distance from the centre of the system to its mouth.
Once DH is calculated then Vx can be evaluated using the following equation:
=
FADV Hx (10)
where A denotes the cross-sectional area of the open boundary of the system (m2) and F is the distance(m) between the geographic center of the system and the observation point for oceanic salinity.
Vin (or Vx) has been calculated using Eq. (6) and salinity data from Colombo et al. (1991, 1994) andMilan (1999). In parallel, the method developed by Yanagi (2000) has been applied. For this reason,we have evaluated the variation of W (width of the Sacca di Goro mouth) during the last 20 years(Table 4.1) using data from Simeoni et al. (2000).
Table 4.1. Width evolution of the Sacca di Goro mouth(s) from 1980 to 2000 (Simeoni et al. 2000).
The principal mouth of Sacca di Goro has suffered a progressive decrease over the last 20 years. Inorder to compensate for this decrease a channel was opened in 1993. This channel has evolved in asecond mouth (~860 m) while the main mouth has continued to decrease (~930 m). Table 4.2 showsthe relative parameters used for the calculation. The Sacca di Goro may be considered as a wide andshallow lagoon and, hence, Eq. (8) must be employed to calculate DH.
41
Table 4.2. Data for the calculation of Vx for the Sacca di Goro Lagoon.
Variable/System Sacca di GoroL(m) 2,270Wmin (m) 1,200W max (m) 2,580H (m) 1.5Amin (m
2) 1,800Amax (m
2) 3,870L/ Wmin 1.89L/W max 0.88Wmin/H 800W max /H 1,720Classification wide & shallowF (m) 4,760U (m/d) 11,490*
*From Ciavola et al. (2000): mean 0.133 m/s; min. 6.0 10-3 m/s; max. 0.42 m/s; standard deviation 0.125 m/s.
Figure 4.3 represents the exchange flows calculated following both procedures, i.e. Eq. (6) and Eq. (10).Points represent the calculation based on the salinity budget Eq. (6), lines represent the calculationbased on Eq. (10) taking into account the mean value of the current measurement and the standarddeviation points. These experimental measurements were performed during a few days in May, so theirvalidity for representing a whole year is not guaranteed. However, both procedures gave similar valuesand probably incorporated all the uncertainties. The calculations based on the mean salinity showed ahigh variability, which was mainly due to the wide salinity ranges in both the Sacca di Goro (15-35 psu)and the adjacent sea (15-35 psu). Considerable differences also occurred among stations in the lagoon,since several stations are dominated by freshwater inputs whereas others are mainly influenced by theAdriatic Sea. Furthermore, the marine Station 2 is affected by freshwater of the Po River plume.Therefore the coastal environment of the Sacca di Goro should be considered as a transient dynamicsystem. Intra-station salinity changes up to 20 psu may also occur in the short term (e.g. daily), mostlyduring extreme events, namely riverine floods and spring tides. Considering the above-mentionedfeatures of the coastal system, the salt balance should be estimated at a time-scale as short as possible,probably from days to weeks. Unfortunately, there are not data enough to carry out such calculations,since the sampling frequency is from weekly to monthly. However, the short-term variability can beevaluated based on the data recorded by an oceanographic buoy which is deployed in the central part ofthe lagoon (see for example Viaroli et al. 1996a).
This first generation budget does not consider the above constraints. Salt budgets were calculatedfollowing Eq. (6). The annual and four seasonal budgets for the 1997 are summarised in Table 4.3. Onan annual basis, freshwater inputs were dominated by riverine discharges which were about 5 timeslower than the sea-lagoon exchange flow. Freshwater inputs peaked in spring and summer (Table 4.3),VR was negative for all seasons indicating a continuous net export of lagoonal water to the sea and VX
ranged from 6 to 11x106 m3 d-1. Water exchange time ranged from 2 to 4 days depending on waterfluxes.
Table 4.3. Seasonal water and salt budgets for Sacca di Goro lagoon in 1997. Water fluxes in 103
m3 d-1, water exchange time (τ) in days and salinity in psu.
The equation for a mass balance for compound(s) which undergo chemical transformations within thecoastal lagoon is:
2( )SGSG Q Q atm atm R R X SG SG
dYV V Y V Y V Y V Y Y Y
dt= + + + − + ∆ (11)
where Y refers to the concentration of the chemical species (Table 4.4), and ∆Y is the netnonconservative flux. The last term (∆Y) of Eq. (11) represents the tendency of the system to be sink orsource for Y.
Table 4.4. Seasonal nutrient concentrations for the river, Sacca di Goro lagoon and adjacentAdriatic Sea.
The nonconservative flux (∆Y) can be written as RVSG, where R is the sum of all the processes(physical, chemical or biological) taking place within the system:
∑=
⋅=n
iii rR
1
ν (12)
where νi is the stoichiometric coefficient for the i-th transformation.
DIP balanceThe annual and seasonal DIP budgets for 1997 are summarised in Table 4.5. A net annual export ofabout 5x10³ moles P d-1 from the lagoon was estimated, whilst the net input of freshwater DIP wasabout 2x10³ moles P d-1. The highest seasonal DIP input was estimated in spring with value of about3x103 moles P d-1. Therefore, assuming steady state conditions, a net annual internal source of +3x10³
moles P d-1 was estimated. Thus, on an annual basis, the lagoons acted as a DIP source with a ∆DIPmean of +0.12 mmol m-2 d-1. Since data on dry deposition are not available, we assumed atmosphericDIP inputs to be zero. However, atmospheric loads may account for some of the DIP input to thelagoon. ∆DIP was negative in winter and spring and positive in summer and autumn. These ∆DIPvariations conformed to the seasonal trends of macroalgal biomass growth and decomposition (Viaroliet al. 2001). Spring was characterised by high macroalgal growth rates and high DIP uptake wasexpected. Macroalgal biomasses reached maximal values early in summer. Afterwards, rapiddecomposition processes took place with high rates of organic matter mineralisation and DIP release.Due to the relatively high temperature (up to 20°C) a residual net DIP mineralisation was estimated alsoearly autumn, while in winter a moderate DIP uptake was recorded due to a new Ulva growth cycle.
Table 4.5. Seasonal DIP budgets for Sacca di Goro lagoon in 1997.
DIN balanceThe annual and seasonal DIN budget for 1997 are shown in Table 4.6. The annual DIN input was163x103 moles N d-1, with peaks in winter. On the annual basis, ammonium and nitrate loads weresimilar. In the lagoon, DIN concentrations were highest in winter and consisted mainly of nitrate (60-70%) and were lowest in summer when the main form was ammonium (70-75%). The net export of380x103 moles N d-1 from the lagoon accounted for a net mobilisation of 215x103 moles N d-1.Therefore, the lagoon was expected to act as a source of DIN with a mean ∆DIN of +8.3 mmol m-2 d-1.The seasonal ∆DIN were always positive indicating a dominance of DIN release processes overassimilation. However, the remobilisation within the lagoon was supported by the high riverine loadsof organic nitrogen. For example, in the Po di Volano channel dissolved and particulate organicnitrogen accounted for 70% of the annual load in 1997 (Viaroli unpublished data).
Table 4.6. Seasonal DIN budgets for Sacca di Goro lagoon in 1997.
Stoichiometric calculations of aspects of net system metabolismThe LOICZ biogeochemical model makes the assumption that net organic matter production ormineralisation in the system can be directly estimated by ∆DIP. In Sacca di Goro, the differencesbetween DIP input and output are related to the balance of all the processes occurring in the system,therefore the net balance inherently includes inorganic nutrient fluxes at the water-sediment interface.The negative values of ∆DIP in the first half of the 1997 were consistent with the macroalgal bloomsoccurring in the same period with density peaks of up to 1,200 g DW m-2 (Figure 4.4). In this period,DIP and DIN were intensively assimilated above macroalgal need (luxury uptake, Viaroli et al. 1996b).The surficial sediment was oxidised due to high oxygen concentration in the water column (up to200%) and DIP was actively adsorbed (Giordani et al. 1997). In the subsequent period thedecomposition of Ulva biomasses supported high mineralisation rates with net release of DIP and DIN.The surficial sediment was also reduced due to the anoxic conditions, with a further release of DIP.
Since the lagoon was colonised by dense beds of floating macroalgae for most of the investigatedperiod and by intense blooms of phytoplankton, two different C:N:P ratios were used in thestoichiometric calculations. The Redfield ratio (C:N:P=101:16:1) was used for phytoplankton and theC:N:P=335:35:1 (Atkinson and Smith 1983) was applied for macroalgae.
Results of the seasonal budgets are summarised in Table 4.7. ∆DINexp is the DIN variation expected onthe basis of organic matter production and mineralisation and was calculated by multiplying the ∆DIPby the N:P ratio of the dominant primary producer. Net nitrogen fixation minus the denitrification(nfix-denit) was calculated by the difference between the observed and expected ∆DIN’s. Using theRedfield ratio, (nfix-denit)plankton was positive over the whole investigated period, indicating that netDIN inputs such as nitrogen fixation appeared to dominate over losses via denitrification. Using theAtkinson and Smith ratio, which seems more suitable for the Sacca di Goro, the year can be divided intwo parts, one with positive (nfix-denit)macroalgae and the other with negative (nfix-denit) macroalgae. Even ifthe values are really high and the explanations for that trend are mainly speculative, the presence of a"switch" after the peak of macroalgal biomass can be confirmed.
44
Table 4.7. Seasonal variation of ∆∆DINexp, (nfix-denit) and net ecosystem metabolism (p-r) forSacca di Goro lagoon in 1997.
The net ecosystem metabolism NEM or (p-r) was positive for the first semester of the investigatedperiod with values of 1 to 50 mmol m-2 d-1 depending on the C:P ratio considered, whilst in the secondpart, (p-r) was negative (-20 to -200 mmol m-2 d-1). The high negative ∆DIP which relates to (p-r) inthe first phase was probably due to combination of organic matter assimilation of DIP and abioticprocesses (i.e., phosphate adsorption). The high positive ∆DIP in the second phase was probably due toorganic matter mineralisation and surficial sediment release of DIP in the reduced environment. Thesystem is apparently highly autotrophic in the first semester and highly heterotrophic in the remainingpart of the year. For 1997, on the annual basis, the Sacca di Goro can be considered as an heterotrophicsystem, since organic matter mineralisation exceeded production of 15 or 40 mmol C m-2 d-1 dependingof the C:P considered.
Figure 4.2. Estimated freshwater monthly contribution of Burana-Volano watershed (VQ) inSacca di Goro from 1980 to 2000 in comparison with VP, -VE and -VR. Note the offset scale for VP
and -VE.
0
2
4
6
8
10
12
14
16
mill
ion
cubi
c m
eter
s pe
r mon
th
0.0
0.1
0.2
0.3
million cubic m
eters per month
198
0
198
2
198
4
198
6
198
8
199
0
199
2
199
4
199
8
2000
199
6
VQ
VP-VE
-VR
45
Figure 4.3. Exchange fluxes calculated using Eq. (6) (hollow points) and Eq. (10) (lines).Continuous line: Vx calculated using the Umean value from Ciavola et al. (2000), anddiscontinuous lines calculated considering standard deviation, i.e. U = Umean ± ∆∆U.
Figure 4.4. Representation of the seasonal trends of macroalgal biomass of Ulva in Sacca di Goroin the 1997 in 2 stations (St. 17 in the eastern part and in St. 11 in the central part of the lagoon).
SummaryThe Valli di Comacchio is a wide hyper-eutrophic lagoon system situated on the Adriatic coast of the EmiliaRomagna region of Italy. It was studied in 1997 applying a single box–single layer model. The water exchangeswere low since freshwater inputs were absent and the connection with the sea was limited to three channels. Asexpected, a long water exchange time was calculated (about 247 days). The main inputs of DIP were from thesea, while DIN inputs were dominated by precipitation. The lagoon acts as a source for DIP and a sink for DINeven if ∆DIP and ∆DIN are very low considered on a surface area basis (+1 and -27 µmol m-2 d-1, respectively).Denitrification appears to dominate over nitrogen fixation, with an estimated net N loss equivalent to 0.04 mmolm-2 d-1. In this system organic matter mineralisation seems slightly dominant over production since (p-r) wasestimated to be -0.1 mmol C m-2 d-1. Thus, the Valli di Comacchio can be considered as a net heterotrophicsystem.
Study area description
The Valli di Comacchio lagoon system is located on the coast of the Adriatic Sea, 20 km south of thePo River delta (44.63°N, 12.28°E; Figure 4.5). It consists of three main lagoons (Magnavacca, Fossaand Campo) plus a series of smaller ponds, with a total surface area of 115 km2 and a mean depth of 0.8m. It is separated from the sea by a 2.5 km wide spit and exchanges with the marine area are via 3narrow man-regulated channels.
The Valli di Comacchio can only be considered to some extent as a natural system as it has beensubjected to intensive modifications and controls by aquaculture activities. In fact, for centuries, theValli di Comacchio was among the most valuable fishing grounds in Italy, being rich in eels, mullet,clams, shrimp and other animals.
Figure 4.5. Location and map of Valli di Comacchio Lagoon. The three connection canals to theAdriatic Sea are indicated with double-headed arrows.
47
However, during recent decades it has suffered what Sorokin et al. (1996) described as “an ecologicalcatastrophe” due to the occurrence of extremely dense blooms of picocyanobacteria. Recent results(Andreoli et al. 1998) disagree with this description but confirm the hyper-eutrophic conditions of thelagoons.
Water exchange with the Adriatic Sea via the three regulated communication channels occurs only inspring and autumn. In spring, water mainly enters into the lagoon to allow the entrance of juvenilefishes while in autumn the flow is mainly towards the sea. Thus, water exchanges are limited and theirevaluation is difficult since they are dependent upon the timing of the channel openings. Limited waterexchanges are also observed with the southern Reno River which is nutrient-rich and heavily polluted.The water inputs from the Adriatic Sea are also nutrient-rich since the Po River delta is nearby and theriver plume affects the area in front of the lagoon. The main water exchanges are with the atmospherebut these do not significantly affect nutrient availability. Salinity ranges between 30 and 38 psu withpeaks in the summer months.
The climate is mediterranean, with some continental influence. Precipitation is approximately 600 mmyr-1, with late spring and autumn peaks.
An annual single box–single layer model was applied to the 1997 data, because the Valli di Comacchiosystem is characterised by a complicated net of water and nutrients fluxes between the individualincompletely defined shallow lagoons. Temperature and wet deposition data were obtained from themeteorological network of the Province of Ferrara, while hydrochemical data for Adriatic Sea and Vallidi Comacchio stations are reported in ARPA-DAPHNE (1998) and Dallocchio et al. (1998)respectively.
Water and salt balance
The water and salt budgets of Valli di Comacchio are shown in Figure 4.6.
Freshwater inputs to the lagoon are considered negligible in comparison to the volume of the system.Losses of lagoonal water via ground filtration have been calculated by Vincenzi (1995) and were takeninto consideration. Precipitation data (VP) were obtained from the Meteorological Station of Ferraraand evaporation losses (VE) were calculated according to the Hargreaves’ equation.
To balance the water losses via infiltration and evaporation, a net water input of 50x103 m3 d-1 from thesea were evaluated (VR). While, considering the salinity gradient between the lagoon system and thesea, the exchange flux (VX) was calculated at 321x103 m3 d-1. Salinity of the seawater in front of thelagoon is low due to the Po River influence. The estimated water residence time was 247 days.
These calculated water fluxes are somewhat larger but of in the same order of magnitude as thosepreviously reported for the lagoon (Vincenzi 1995) from direct measurements carried out in 1991-1992with current-meters positioned in the three channels which connect the lagoons to the sea. Vincenzievaluated the water output from the system at 202x103 m3 d-1 and the water inputs at 162x103 m3 d-1.
Budgets of nonconservative materials
DIP balanceThe annual DIP budget for the year 1997 is shown in Figure 4.7. Atmospheric DIP inputs wereassumed to be zero since no data on dry deposition were available.
The input of DIP to the lagoon was from the net water inputs from the sea (VRDIPR) while bigger DIPoutputs were calculated from the water exchanges between the sea and the system (VX(DIPocn-DIPsyst)and for groundwater losses (VGDIPsyst). To balance for these outputs (138 mol d-1) and residual inputfrom the sea (20 mol d-1), a release of DIP of 116 mol d-1 would be required to maintain the steady stateconditions.
48
Thus, for the investigated period, the Valli di Comacchio lagoons acted as a net source of DIP (∆DIP =116 mol d-1) although this value is low (1 µmol m-2d-1) when referred to the surface area of the system.
DIN balanceThe annual DIN budget for 1997 is shown in Figure 4.8. DIN concentrations in the lagoon were low forthe whole investigated period with winter peaks of 34.7 µM. Ammonium was the dominant formaccounting for 47-95 % of DIN. Higher DIN concentrations were measured in both the seawater andrainwater inputs. Quantitatively, the main load of DIN to the lagoons was due to precipitation (18x103
mol d-1) because of the high surface area of the lagoon system and the high average DIN concentrationin the rainwater (97 µM). The DIN input from the sea was also significant, since the exchanges ofwater account for a net input of DIN estimated at 3x10³ mol d-1. The sum of the estimated DIN inputsquantitatively dominate the DIN outputs which mainly occur via groundwater, indicating an internal netremoval of DIN.
During 1997, the lagoon acted as a net sink for DIN since ∆DIN was negative (-3x10³ mol d-1) even ifthe ∆DIN calculated on areal basis is very low (-0.03 mmol m-2 d-1).
Stoichiometric calculations of aspects of net system metabolismIn accordance with the assumptions of the model, positive ∆DIP values can be considered as anindication of net organic matter mineralisation and can be directly estimated from the coupled DIPrelease.
In 1997, the lagoons were affected by persistent blooms of phytoplankton of Nannochloropsis andSynechococcus genera (Andreoli et al. 1998), while the rooted phanerogam community had almostdisappeared (Piccoli 1998). The Redfield C:N:P ratio (106:16:1) was used for the stoichiometriccalculations.
During 1997, an expected ∆DIN of 0.02 mmol m-2 d-1 was calculated for the Valli di Comacchiolagoons by multiplying the observed ∆DIP by the N:P ratio of the organic matter mineralised. Thedifference between the observed and expected ∆DIN was considered as the net ecosystem nitrogenfixation minus denitrification (nfix-denit). In the Valli di Comacchio lagoons, (nfix-denit) was -0.2mmol m-2 d-1 , indicating that denitrification losses dominate over nitrogen fixation inputs.
These results indicate that denitrification dominates despite the relatively high densities of N2-fixingcyanobacteria (up to 300 cells ml-1 of Synechococcus sp.) in the lagoon. High denitrification rates canoccur in these lagoons as indicated by low concentrations of DIN in the water column although noestimations of denitrification rates are available for this system.
The net ecosystem metabolism NEM or (p-r) was calculated from ∆DIP values considering the C:Pratio of the mineralised organic matter. During the investigated period (p-r) was negative indicating anet mineralisation of organic matter even if the value estimated was very low (-0.1 mmol m-2 d-1).Thus, the Valli di Comacchio lagoons can be considered as slightly heterotrophic in terms of total netmetabolism.
49
Figure 4.6. Water and salt budgets for Valli di Comacchio Lagoon for 1997. Water fluxes in 103
m3 d-1 and salt fluxes in 103 psu m3 d-1.
Figure 4.6. DIP budget for Valli di Comacchio Lagoon for 1997. Fluxes in mol d-1.
Figure 4.7. DIN budget for Valli di Comacchio lagoon for 1997. Fluxes in mol d-1.
Valli di Comacchio Vsyst = 92 x 10 m
Asyst = 115 x 10 m Ssyst = 29.4 psu τ τ = 247 days
VP = 190 VPSP = 0
VQ = 0 VQSQ = 0
VR = 50
Socn = 26.0 psu
SR = 27.7 psu
VX(Socn-Ssyst) = -VRSR-VGSG = -1,091 VX = 321
6 3
VG=10 VGSG = 294
6 2
VO = 0 VOSO = 0
VE = 230 VESE = 0
Valli di Comacchio DIPsyst = 0.6 mmol m
∆∆DIPsyst = +116
VQDIPQ = 0
VRDIPR = 20
DIPocn = 0.2 mmol m
DIPR = 0.4 mmol m
VX(DIPocn -DIPsyst) = 128
VGDIPG = 8
VatmDIPatm = 0
VODIPO = 0
-3
-3
-3
Valli di Comacchio DINsyst = 7 mmol m
∆∆DINsyst = -22,000
VQDINQ = 0
VRDINR = 625
DINocn = 18 mmol m
DINR = 12.5 mmol m
VX(DINocn -DIN syst) = 3,531
VGDING = 70
VatmDINatm = 18,000
VODINO = 0
-3
-3
-3
50
4.3 Valle Smarlacca Lagoon (sub system of the Valli di Comacchio lagoons)
G. Giordani and P. Viaroli
SummaryWater and nutrient budgets were calculated for Valle Smarlacca, a small and shallow Italian lagoon, using a singlebox–single layer model. This lagoon is used for aquaculture and water fluxes are artificially regulated with tworeplacements per year of approximately half the water volume, in October and February. In spring and summerthe lagoon is completely isolated except for small water inputs to compensate for evaporation. In 1997, DIPinputs were largely dominated by groundwater inputs from a well, which was used to warm the intensive fishbreeding ponds. DIN input from brackish water pumped from the Reno River was slightly higher than DIN inputfrom groundwater. Due to the peculiar hydrology, the mean water exchange time estimated for the 1997approximates to a year and water exchange time is particularly long in spring and summer (1,060 and 430 days,respectively). In 1997 the Valle Smarlacca acted as a sink for both DIN and DIP since the output was lower thanthe total input, so the system can be considered autotrophic with a net production of organic matter of about 2mmol C m-2 d-1 in autumn and winter. For the spring and summer months, the system seems to be regulated by arapid turnover and internal nutrient sources; net ecosystem metabolism was close to zero. Denitrificationdominated over nitrogen fixation since (nfix-denit) was negative for the whole of the investigated period (-0.3 to -0.8 mmol N m-2 d-1, average of -0.5 mmol N m-2 d-1). Independent measurement for gross denitrification rates inthe system (0.05 to 0.25 mmol N m-2 d-1) is within the same magnitude of the net denitrification estimated by theLOICZ approach.
Study area description
The Valle Smarlacca Lagoon is located on the north-western Adriatic coast of Italy, in the Emilia-Romagna region (Figure 4.8).
Figure 4.8. Map and location of the Valle Smarlacca Lagoon.
Reno River Adriatic Sea (6 km)
51
The lagoon is part of the Valli di Comacchio lagoonal system (44.58°N, 12.23°E), a wide complex ofshallow water impoundments covering 115 km2 (see the Valli di Comacchio, this report). The ValleSmarlacca Lagoon is located in the south-east corner of Valli di Comacchio, close to the Reno River. Ithas surface area of 2 km2 and a mean water depth of 0.8 m. The surficial sediment is mainly composedof organic-rich silts. This organic layer is 10-20 cm thick and overlies a deeper clay layer. The salinityis relatively stable (22 to 24 psu) but can rise to 25-30 psu in summer due to evaporation. The lagoon issurrounded by embankments and is completely separated from the other lagoons of the Valli diComacchio system. The Valle Smarlacca receives freshwater and nutrient inputs from the adjacentReno River through artificially-regulated sluices and from a well by which groundwater is pumped intothe lagoon.
The lagoon is exploited for fish farming of european seabass (Dicentrarchus labrus) and giltheadseabream (Sparus auratus). The aquatic phanerogam Ruppia cirrhosa forms patchy meadow,alternating between areas of dense canopy and areas devoid of plants.
The lagoon is regularly subjected to dystrophic crises during summer, a phenomenon widely describedin other European shallow water lagoons. During the warmest summer months, the emerging Ruppiafronds become covered by dense tufts of epiphytic algae, whose decomposition leads to a significantoxygen uptake as well as sulphide accumulation in the water column.
The climate is mediterranean with some continental influence. Precipitation is approximately 600 mmper year, with late spring and autumn peaks. However, this pattern is undergoing significant changeswith an increase of short-term intense events.
The data set used is from the year 1997 and was obtained during the ELOISE Projects “NICE-nitrogencycling in estuaries” and “ROBUST: the role of buffering capacities in stabilising coastal lagoonecosystems”.
From January to December 1997, water samples were collected in the central part of the lagoon andanalysed for nitrate, nitrite, ammonium, dissolved reactive phosphorus by standard procedures(Dalsgaard et al. 2000). Macrophyte biomasses, primary production, benthic fluxes of oxygen andnutrients, denitrification rates and sulphur, phosphorus, iron and nitrogen were also investigated (Hejiset al. 2000; Azzoni et al. 2001; Bartoli et al. 2001).
Air temperature and wet deposition data were obtained from the meteorological network of theProvince of Ferrara. Hydrochemical data for the Reno River were directly measured and for AdriaticSea stations are reported in ARPA-DAPHNE (1998).
Water and salt balance
The water budget of the Valle Smarlacca Lagoon was calculated on a seasonal basis, using a singlebox–single layer model since this lagoon is small and shallow.
The lagoon exchanges water with the Reno River through a pumping station, which is artificiallyregulated depending on aquaculture requirements. Every February the water level of the lagoon islowered by 50-60 cm to force the fish to move to the deepest point of the lagoon for harvesting.Following fish collection, the pumping station is activated and water is pumped from the Reno Riverinto the lagoon to restore the water level. The pumping station is activated mainly at high tide when thesalt wedge in the Reno River reaches the canal which connects the river to the lagoon. The watercollected by the pumping station is normally brackish since the salinity of the water moving from thesea is higher than the freshwater of the Reno River, which is heavily polluted. From spring to summerthe lagoon is isolated from the Reno River, with only occasional inputs from the pumping station tocompensate for evaporation losses. In October the water level is lowered again for the second annualfish harvest and subsequently the normal water level is restored by pumping brackish water from the
52
Reno River in the lagoon. Due to these constraints, it is not possible to calculate a water budget basedon salinity variations in the lagoon water.
The bottom of the lagoon is composed of a thick layer of clay which is not permeable to groundwater,but in late autumn and in winter when the temperature is lowest, “warm” groundwater (14°C) ispumped from a well into the intensive fish farming ponds and it then flows into the lagoon. Thisgroundwater is rich in dissolved inorganic P (54 µM) and ammonium (1,250 µM) of fossil origin and isan important source of nutrient input, inducing intense blooms of phytoplankton in the following spring(chlorophyll-a up to 330 µg L-1).
Precipitation data (VP) for 1997 were obtained from the Meteorological Station and evaporation (VE)was calculated by the Hargreaves equation. VE and VP were similar on an annual basis even evaporationexceed precipitation in spring and summer while precipitation dominated in autumn.
Since all the water fluxes except evaporation and precipitation are completely artificially regulatedsome assumptions were made. Firstly, the water volume input and output of the lagoon in the fishingperiods were calculated by multiplying the water level changes by the lagoonal surface area. Secondly,since the water inputs and the water outputs are temporally separated and no exchanges of water occursbetween the River and the lagoon, the mixing volume (VX) was considered to be zero. In the budgets,VQ indicates the brackish water input from the Reno River, VG the groundwater input from the well andVR the water export from the lagoon via the pumping station. For these reasons the salt budget was notcalculated.
The seasonal water budgets are summarised in Table 4.8. Mean daily water inputs and outputs wereextremely small, compared to the volume of the lagoon and consequently the estimated water exchangetime (τ) was very long, more than a year. On a seasonal basis, τ is very long in spring when the pumpdoes not operate. A lower water exchange time was estimated for summer due to higher evaporationrates and the water pumped in from the river to compensate for evaporation losses. In winter andautumn water exchange time was approximated 4 months.
Table 4.8. Seasonal water budgets of the Valle Smarlacca lagoon in 1997. Mixing volume (Vx) wasconsidered zero.
DIP balanceSince no data on dry deposition was available, atmospheric DIP inputs were assumed to be zero. On anannual basis, the DIP exchanges were very low and nonconservative flux of DIP (∆DIP) averaged -0.01mmol m-2 d-1. The main DIP sources were the groundwater inputs pumped from the well, which wereabout 7 times higher than the surficial inputs. In spring and in summer, DIP concentrations in the watercolumn were below the detection limit of the method (0.1 µM) for most of the time (Table 4.9). This isin agreement with the low inputs reported for these periods and with the high metabolic activity of thebiotic community composed mainly of rooted phanerogams, epiphytes, macroalgae and phytoplanktonwhich need P for growth. ∆DIP was very low, close to zero in spring and summer, and reached valuesof -0.02 mmol m-2 d-1 in winter and autumn when DIP inputs were close to 40 mol d-1. ∆DIP was
53
negative for the whole period investigated, indicating that the lagoon acts as a net sink of DIP. Theseasonal dissolved inorganic phosphorus (DIP) budgets are reported in Table 4.10.
Table 4.9. Nutrient concentrations for the Reno River, groundwater and lagoon.
Table 4.10. Seasonal DIP budgets of the Valle Smarlacca Lagoon.
DIN balanceThe seasonal dissolved inorganic nitrogen (DIN) budgets are reported in Table 4.11. The main DINinputs to the lagoon were the brackish water inputs from the Reno River, groundwater from the welland precipitation. In contrast to the DIP budget, surficial DIN inputs dominated over groundwaterinputs on an annual basis even if they were of the same order of magnitude. DIN inputs weredominated by ammonium in both the surficial and ground water sources. Ammonium was also thedominant nitrogen species in the water column of the lagoon (60-90%) during the investigated period.DIN peaks (up to 67 µM) were measured in winter and autumn when DIN inputs were approximately2x103 mol d-1. As with DIP, DIN concentrations in the water column of the lagoon decreased in springand summer attaining values of 3 and 6 µM for nitrate and ammonium, respectively. ∆DIN wasnegative for the whole period investigated, especially in autumn and winter, indicating that the lagoonacted as a net sink for DIN.
Table 4.11. Seasonal DIN budgets of the Valle Smarlacca Lagoon.
Stoichiometric calculations of aspects of net system metabolismOn an annual basis, the lagoon can be considered a net autotrophic system since the negative ∆DIPvalues calculated can be considered as an estimate of net DIP assimilation for organic matterproduction, as indicated in the LOICZ procedure. The annual average of the net ecosystem metabolism(NEM) taken as the difference between ecosystem production and respiration (p-r), was +1 mmol C m-2
d-1 in 1997, assuming production of organic matter with a Redfield C:N:P ratio. Results of the seasonalbudgets are summarised in Table 4.12. NEM values of +2 mmol C m-2 d-1 were estimated for theautumn and winter months when nutrient inputs were high, while negligible values were estimated forthe spring and summer periods. In the spring and summer months, the lagoon is almost completelyisolated, water column DIP and DIN concentrations are very low and biological activity is driven by therapid recycling of nutrients and internal nutrient sources. Thus, whilst imports and exports of materialare practically zero, there is an extremely high level of biological activity within the lagoon and largemovements of nutrients between the ecosystem compartments. The low observed NEM valuesindicated good balance between production and respiration in the system which would agree with thehigh coupling between P-regeneration and primary production.
Table 4.12. Seasonal variation of ∆∆DINexp, (nfix-denit) and net ecosystem metabolism (p-r) in theValle Smarlacca in the 1997.
In these months, the net production of organic matter, which was dependent on internal nutrient sourcesand the primary producers’ internal nutrient reserves, if calculated using the LOICZ model was below+0.1 mmol C m-2 d-1. However, estimates based on DIP concentrations in the water column can hardlybe considered significant for budgeting, as these concentrations were below the detection limits of themethod for much of this period. This is due to the strong coupling between P-regeneration rates andprimary production, as sediment to water column fluxes of phosphate can be significant (Heijs et al.2000).
The ∆DINexp values indicated in Table 4.12 were calculated by multiplying the ∆DIP by the RedfieldN:P ratio and (nfix-denit) was calculated from the difference between observed and expected ∆DIN. Inthe Valle Smarlacca lagoon, losses via denitrification appear to be dominant since (nfix-denit) wasalways negative (Table 4.12). Nitrogen fixation was not a quantitatively important process in the N-budget of this lagoon since (nfix-denit) is in relatively good agreement with denitrification ratesmeasured in the same year at a single station in the lagoon, which ranged between 0.05 and 0.25 mmolm-2 d-1 (Bartoli et al. 2001). The latter result is somewhat unexpected since the rooted phanerogammeadows generally exhibit high nitrogen fixation rates and net N-inputs (Welsh 2000). However, thisresult should be considered with caution, particularly in spring and in summer, since it is based on lowDIP inputs, on a Redfield N:P ratio which can not be representative of the heterogeneous organic matterproduced and decomposed in the lagoon (phanerogams, epiphytes, macroalgae, plankton, fish food) andon denitrification rates measured at a single station and extrapolated to the whole lagoon. Moreover thepatchy distribution of rooted phanerogam meadows has to be considered.
55
Salento subregion (Apulia, southern Italy)
Apulia is a region of about 19,000 km2 in the south-east of Italy. The Salento Peninsula extends fromthe Otranto Channel (Adriatic Sea) to Taranto Gulf (Ionian Sea). The landscape consists mainly ofhorizontal lines and gentle contours, which sometime take on the appearance of hills (Murge Salentine).These forms are due to large expanses of limestone rocks in vast horizontal or sub-horizontal strata. Asa result there are few surficial runoffs, streams or rivers, and considerable karst phenomena. On theother hand many wetlands occur along the coast. The are covered by wetlands has greatly reduced inthe last 50 years; now, Lake Alimini is the largest coastal lake in the region. The Salento Penisula has aMediterranean climate, with mild wet winters and hot dry and windy summers. The precipitation,falling mainly in winter, is somewhat low, with a mean of only 620 mm year-1 over the last 30 years.Average annual temperatures range from 10 ºC in winter to 30 ºC in summer.
Salento is a heavily-populated region and tending to increase. Currently, the population density is about250 ind./km2. Agricultural production is remarkable, particularly for grapes and olives, which don'trequire very fertile land. The industrial sector is highly developed, mainly around the cities of Tarantoand Brindisi.
Alberto Basset
4.4 Lake Alimini Grande, Lecce
M.R. Vadrucci, A. Fiocca, O. Negro, F. Sangiorgio, A. Semeraro and A. Basset
SummaryLake Alimini Grande is a brackish lake located on the Adriatic coast of southern Italy, 40 km south of Lecce.Physical and chemical features of the lake studied from September 1998 to September 1999 were used to calculateseasonal and annual budgets using a single box, single layer LOICZ model. Rainfall data were recorded at a fieldstation on the lake shoreline and compared with the long-term time series data collected from two pluviometricstations close to Lake Alimini Grande. Freshwater inputs showed a strong seasonal variability, and the estimatedwater exchange time varied accordingly. Estimated water exchange time varied from approximately a month (i.e.,40 days) during autumn to more than a year during summer. Summer budgets were calculated applying non-steady state of salt between seasons because the data collected in the summer led to negative Vx values whensteady state was assumed. As regards to the nutrient balance, the lake was neither a net sink nor source fordissolved inorganic phosphorous (DIP); ∆DIP is effectively 0. The lake was slightly a sink of dissolved inorganicnitrogen (DIN). Net ecosystem metabolism [NEM or (p-r)] is 0, suggesting a good balance between productionand respiration of organic materials. Denitrification prevailed over nitrogen fixing [(nfix-denit)<0].
Study area description
Lake Alimini is located on the Adriatic coast of southern Italy (40.19°-40.22°N, 18.44°-18.46°E; Figure4.9). It consists of two basins, Lake Alimini Grande and Lake Alimini Piccolo (or “Fontanelle”),connected through a natural canal 1.5 km long, called the “Strittu”. The two lakes represent the lastresidual edges of a long system of wetlands of the Apulian region of Italy. Their importance isinternationally recognised because the lakes lie along a principal migratory route of many birds (Tursi1989).
The two lakes are divided by a dam and have different hydrological characteristics. Alimini Grande is abrackish lake, whereas Alimini Piccolo is a freshwater lake fed by groundwater through many springscalled “fonti” (in Italian), hence the nickname “Fontanelle” for the lake.
The objective of this paper was to determine the water, salt and nutrient budgets of Lake AliminiGrande by applying the LOICZ budget modelling approach (Gordon et al. 1996).
56
9°E 12 15 18
39°N
42
45
Italy
S
Lake A limini
Adr ia ticSea
Figure 4.9. Map of Lake Alimini Grande with the sampling stations marked.
The data used in the model were collected from September 1998 to September 1999 at 33 samplingsites distributed throughout the lake and at the connections between the lake and its input and outputenvironments (Strittu Canal, Zuddeo Canal, Traugnana Swamp and Adriatic Sea; Figure 4.9). In thisstudy, the freshwater Lake “Fontanelle” is considered one of the input environments of Lake AliminiGrande through the “Strittu” Canal. Lake Alimini Grande has a surface area of 1.4 km2, an averagedepth of 1.5 m and a volume of 2.1x10⁶ m3. The main freshwater inputs enter the lake from the“Strittu” Canal, from the Zuddeo Canal and from the Traugnano Swamp. On average, 64% of thefreshwater inputs come from the Zuddeo Canal, 30% from the Strittu and 5% from the TraugnanoSwamp. The freshwater fluxes vary seasonally since in the Apulian region is very hot and dry duringsummer. Consequently, water salinity also changes seasonally in Lake Alimini Grande (33.6 ± 1.1 psuduring summer and early fall and 22.0 ± 1.5 psu during winter).
Lake Alimini Grande is connected with the sea through its mouth (Figure 4.9), and is subject to levelvariations linked to the tidal exchanges. These exchanges are affected by the low tide excursionoccurring in the southern Adriatic Sea and by the efficiency of communication with the sea, which isfrequently low due to the formation of sand dams.
Primary producers in Lake Alimini Grande are restricted to phytoplankton and littoral macrophyteguilds (submerged macrophytes occur at a very low density and only locally). The littoral macrophyteguilds are dominated by the reed Phragmites australis. Data collected during this study suggested theoccurrence of a strong phosphorus limitation of primary production in Lake Alimini Grande.Phosphorus limitation was supported by the results from field manipulations (Basset et al. 2001) and bythe very high NTOT/PTOT ratios (NTOT/PTOT = 134; Basset, Fiocca and Negro, unpublished) both in thelake and in the catchment area (mean value of phosphorus 0.2 µM; mean value of nitrogen 71 µM).However, water and sediment chemistry, phytoplanktonic biomass and water transparency, which are
12
34
56
78
9
10
11
12
13
14
15
1617
1819
20
21
2223
24
25
26
27
28
29
30
31
32
33
Adriatic S
ea
Zuddeo Canal
The "Strittu"
Traugnano Swamp
57
commonly used as trophic state indicators, supplied contrasting evidence. The rate at which nutrientsare renewed in the water column (Basset et al. 2001) suggested eutrophic conditions for the lake.
From September 1998 to September 1999, water samples were collected from 29 stations within thelake and from 4 stations located in its input or output environments (Strittu, Zuddeo and Traugnanocanals and the adjacent sea). Water salinity, nitrate, nitrite, ammonium and phosphorus concentrationswere determined using standard procedures. Dissolved reactive phosphorus absorbance was measuredwith a 10 cm cell in order to increase standard method sensitivity, since phosphorus concentration wasvery low in the lake. Primary production and phytoplankton, macrophyte and seston biomass were alsoinvestigated. Air temperature and rainfall data were obtained from a meteorological station on the lakeshoreline. Evaporation data were calculated by the Hargreaves equation.
Water and salt balance
In Lake Alimini Grande, the major freshwater inputs are derived from the three canals (Strittu, Zuddeoand Traugnano, VQ) and from direct precipitation into the system (VP). Evaporation (VE) is the onlyfreshwater output from Lake Alimini Grande.
In the study year, direct rainfall to the lake was 542 mm. This value is within the 95% confidenceinterval of the annual average for the region computed for a 30-year time series (1960-1990). Rainfallshowed a strong seasonal pattern, with a very dry summer period. Evaporation largely exceededprecipitation during the dry season (spring and summer, Figure 4.10).
The water and salt budgets for seasonal and annual budgets are shown in Table 4.13. Net export ofwater from the lake to the sea, indicated by negative residual flow (VR), was observed in the autumn,winter and spring.
Table 4.13. Seasonal water flux, salinity and water exchange time for Lake Alimini Grande in1998-99. * indicates data calculation involved non-steady state of salt budget between seasons.
Season VQ VP VE VR Ssyst Ssea VX ττ(103 m3 d-1) (psu) (103 m3 d-1) (days)
In the summer, a net import from the sea to the lake was observed (VR was positive). The highestnegative residual flow values were observed in winter and autumn during the rainy period. The VX
values, which indicate the mixing volume between the lake and the sea also showed a maximum in theautumn season. During summer the total freshwater input into the lake was lower than evaporation,which requires a net inflow of seawater from the adjacent sea to conserve the water volume of thesystem. Despite the positive residual flow, the salinity of the system remained lower than the adjacentseawater salinity. In theory, it could depend both on the occurrence of groundwater inputs and on avery low efficiency of water exchange with the sea. The latter seems likely to be the case in LakeAlimini Grande. Groundwater inputs are very unlikely in Lake Alimini Grande, since in Lake AliminiPiccolo, which is certainly fed by groundwater, water levels decreased 30-cm during August; on theother hand, the efficiency of the lake mouth was greatly reduced during that month by artificial sanddams, related to tourist activity in the area. Since it was not possible to develop a steady state saltbudget in the summer because salinity remained lower in the system than in the adjacent sea despite thenet inflow of seawater from the adjacent sea, a non-steady state salt budget between seasons wasapplied to derive VX in the summer. Mixing volumes calculated from non-steady state and other dataderived using the non-steady state of salt are indicated in the tables with asterisk (*). VX* for the winterand spring were also calculated as non-steady state and compared with the Vx calculated as steady state.
58
Using the salt balance equation:
( )( )
syst systQ Q X ocn syst R R
V dSV S V S S V S
dt= + − +
At non-steady state, ( )
0syst systV dS
dt≠ which is the change of salt in the system between two seasons
(e.g., season1 and season2) and where the parameters with over-bar are the averages of parameters ofseason1 and season2.
XV is then calculated as:
( ) /( )
syst syst Q Q R RX
ocn syst
V dS dt V S V SV
S S
− −=−
Mixing volume of season2 (VX2*) is then calculated as
2 1* 2X X XV V V= −
where VX1 is the mixing volume of season1.
Mixing volume derived from non-steady state in winter and spring did not vary much with thatcalculated from steady state. VX* in the summer was relatively low compared to the other seasons.
Expected water exchange time was short in the autumn and winter seasons (40 days in autumn and 89days in the winter) with respect to spring (143 days). Water exchange time in the summer calculated asnon-steady state was more than a year. Annual water exchange time for Lake Alimini Grande was 232days as the average of the seasonal estimates.
Budgets of nonconservative materials
DIP balanceThe DIP content of the system and of its input and output environments are reported in Table 4.14 andannual and seasonal budgets for DIP are reported in Table 4.15.
Table 4.14. Seasonal and average annual nutrient concentrations for the river, Lake AliminiGrande lagoon and adjacent sea.
Mean values of DIP were not statistically higher in the system than in the sea (0.06 ± 0.03 µM - LakeAlimini Grande; 0.03 ± 0.03 µM – sea- Table 4.14). These values were very low, suggesting anoligotrophic state for both Lake Alimini Grande and the Southern Adriatic Sea, which is in agreementwith published data on the water chemistry and trophic state of the southern Adriatic Sea (e.g., Socal etal. 1999) but which is not supported by values of other trophic state descriptors observed in LakeAlimini Grande (Basset 2000).
59
Table 4.15. Seasonal DIP budgets for Lake Alimini Grande lagoon in 1998-99. * indicates datacalculation involved non-steady state of salt budget between seasons.
The input of DIP to Lake Alimini Grande came from the freshwater canals. The largest input wasobserved in autumn, in correspondence with the highest concentration and major freshwater input fromthe catchment basin. The contribution to the DIP input by three canals, Zuddeo, Strittu and Traugnanowas quite similar even though water discharges were very different.
From the DIP budget, ∆DIP of Lake Alimini Grande is effectively 0 for all seasons.
DIN balanceThe DIN annual and seasonal budgets are reported in Table 4.16. The overall DIN input into LakeAlimini Grande is three-orders of magnitude larger than the DIP input, resulting in a stronglyunbalanced NTOT/PTOT ratio. Nitrates are the dominant form of dissolved inorganic nitrogen in everyseason. The lake is a sink for DIN for the three seasons and a source for the summer. Overall, about 5%of the DIN entering the lake from the catchment basin is retained (i.e., ∆DIN is negative). While ∆DINis small, it is different from zero.
Table 4.16. Seasonal DIN budgets for Lake Alimini Grande in 1998-99. * means calculationinvolved non-steady state of salt budget between seasons.
Stoichiometric calculations of aspects of net system metabolismAccording to the assumption of the LOICZ biogeochemical model, the ∆DIP values allow a directestimate of the net energy budget of the system, determining whether the system is a net consumer[∆DIP>0 and (p-r)<0] or a net producer [∆DIP<0 and (p-r)>0] of organic matter. Lake Alimini Grandeseems to balance primary production and respiration [∆DIP=0 and (p-r)=0].
Since ∆DIP is 0, nitrogen fixation minus denitrification (nfix-denit) is equal to ∆DIN. For the all theseasons except summer in Lake Alimini Grande denitrification prevailed over nitrogen fixation [i.e.,(nfix-denit) was negative]. Nitrogen fixing minus denitrification (nfix-denit) was positive in thesummer. Annual (nfix-denit) for Lake Alimini Grande was negative, the system is net denitrifying.
Discussion and conclusion
Water and salt balance in Lake Alimini Grande indicated that the lake exports water to the adjacent seaduring the autumn, winter and spring and imports water during summer. In the summer, using non-
60
steady state equation for salt budget, water exchange time was very low which confirms the notion oflow efficiency of water exchange at the lake mouth, due to ecosystem management related to tourists.
The nutrient budgets indicated that Lake Alimini Grande was a neither a net sink nor source for DIPand a net sink for DIN. On average (nfix-denit) was negative suggesting that, denitrification processesprevailed over fixation processes. The NEM equal to 0 suggested a low accretion rate of lakesediments, which represents a positive element, in terms of ecosystem health, of the potentiallyeutrophic Lake Alimini Grande.
Acknowledgements
This study was funded by a MAMB grant and by the EEC contract ENV4-CT97-0584. We thank Vilma Dupra forher helpful comments, criticisms and suggestions on earlier drafts of this paper. We also thank GianmarcoGiordani and Pierluigi Viaroli for their helpful comments. Finally, we thank Romeo and Stefano Capraro for theirsupport during sampling and field manipulations.
Figure 4.10. Annual trend of VE and VP values in Lake Alimini Grande during the study period.
0
2
4
6
8
10
oct-9
8
nov dic
jen-
99 feb
mar apr
may jun jul
aug
VP (1
03 m
3da
y-1
)
0
1
2
3
4
VE(1
03 m
3 day
-1)
VP
VE
61
Oristano province, Sardinia (Italy)
Sardinia is the second largest island (23,813 km2) in the Mediterranean Sea.
The morphology of the island is the result of complex tectonic processes and volcanic activity in theCenozoic era on a mass of Paleozoic rock upthrust from the sea, later severely affected by latePaleozoic orogenesis. Sardinian waterways (creeks, streams and rivers) are fast-flowing, with arelatively high water discharge in winter, reduced to a trickle in summer.
Many freshwater and saltmarsh ecosystems occur in the area. The River Tirso, which flows into theGulf of Oristano, is the largest river of Sardinia; 159 km long with a catchment area of 3376 km2.Cabras, Santa Giusta and S’Ena Arrubbia are the major saltmarsh lakes and coastal basins occurring inthe area.
The climate is Mediterranean, with long hot dry breezy summers and short mild rainy winters, except athigh altitudes. Average annual temperatures range from 18ºC along the coastal belt to 14ºC inland.Precipitation is largely confined to the winter months and distribution is somewhat irregular, with asmuch as 1,300 mm year-1 in the highlands and 600mm year-1 in the lowlands. Population density is of59 ind. km-2. The primary sector is still of outstanding importance, especially goat and sheep rearing(good production of cheese). The tourist sector is highly developed in Oristano province and is linked toits extraordinarily beautiful coastline. The principal industry consists of sugar refineries.
4.5 S’Ena Arrubia Lagoon, Oristano, western coast of Sardinia
G. Giordani, G. De Falco, M. Baroli, S. Guerzoni and P. Viaroli
Summary
S'Ena Arrubia, an eutrophic lagoon situated on the west coast of Sardinia, Italy, was studied in 1994 and1995. Four seasonal budgets per year were calculated using the single box–single layer model. The1994 budgets are considered more representative of "normal" conditions for the lagoon since this periodwas characterized by water fluxes within the annual average values measured during the previous 10years. Whilst, the 1995 budgets, due to low precipitation and low water exchanges, can be consideredrepresentative of particularly dry conditions. Estimated water exchange times averaged at about amonth, but range from a few days during the rainy seasons to more than a year in dry periods. Thelagoon acts as a sink for both dissolved inorganic phosphorus (DIP) and dissolved inorganic nitrogen(DIN). Nitrogen metabolism appears to be highly nitrogen fixing, with an estimated net metabolismequivalent of +0.3-2.6 mmol m-2 d-1 (average of +1.1 mmol m-2 d-1). In both years the system can beconsidered net autotrophic, (p-r) = 3-42 mmol C m-2 d-1(average of +14 mmol m-2 d-1).
Study area description
S'Ena Arrubia Lagoon is a shallow water body located on the coast of central west Sardinia (39.83° N,8.67°E; Figure 4.11). The surface area is 2 km2, the mean depth 0.4 m and the corresponding totalvolume is 8x10⁵ m3. The lagoon is naturally affected by eutrophication, but in the last few years thetrophic status has deteriorated, mainly due to large nutrient inputs leading to massive macroalgal andphytoplankton blooms. Freshwater flows into the lagoon from a pumping station (Idrovora Sassu) andtwo minor canals, and is conveyed through an internal artificial channel that connects the lagoon withthe sea. Nutrient inputs are mainly due to domestic sewage and agriculture. The catchment area (90km2) coincides with a former wetland, which was reclaimed in the early 20th century. Nowadays, thisarea is exploited mostly for agriculture (maize and grasses) and dairy farming. This agricultural activitycauses two principal problems. Firstly, there is a conflict for water use as the Sardinian climate isgenerally very dry. This gives rise to excessive use of water for irrigation (both ground- and surfacewater) and a drastic cut in freshwater flow in the summer months. As a consequence of this and the
62
high summer temperatures there are frequent increases of salinity in the lagoon. Secondly, when thepumping station is working, the water flowing into the lagoon is very rich in nutrients, with peaks of100 mmol m-3 of total phosphorus and 350 mmol m-3 of total nitrogen. Seaweeds cover almost 100% ofthe lagoon surface area with a pronounced monotony and a clear dominance of chlorophyceans. Thelagoon is exploited for aquaculture, mostly mussels and European seabream.
Figure 4.11. Location and map of the S’Ena Arrubia lagoon. Sampling sites are indicated.
The climate is mediterranean, with an average rainfall of about 500 mm per year. The main tributariesof the lagoon are the Idrovora Sassu channel and two minor canals: Santa Anna and Acque Medie . Thefirst two drain a heavily exploited farming area (Piana di Arborea), the latter receives freshwater fromthe Tirso River during the flooding events.
From January 1994 to December 1995, water samples were collected in a grid of 10 stations within thelagoon, plus a station located just upstream of the pumping station and analysed for salinity, nitrate,nitrite, ammonium and dissolved reactive phosphorus, using standard procedures. Macrophytebiomasses, primary production, benthic fluxes of oxygen and nutrients were also investigated (Baroli etal. 1996; Bondavalli et al. 1996).
Air temperature, wet deposition and hydrological data were obtained from the Meteorological Station ofthe International Marine Centre (IMC, Torregrande, Oristano) and from Guerzoni et al. 1995. SeeGuerzoni et al. 1999 for a review of the depositions in Mediterranean area.
Water and salt balance
The water and salt budget of S'Ena Arrubia Lagoon was calculated using the single box–single layermodel since this lagoon is small and shallow. The two years investigated (1994 and 1995) differed
B la c k S e a
M e d it e rra n e a n S e a
SS'Ena Arrubia
39 .0 °N
39 .5
40 .0
40 .5
41 .0
8.0 ° E 8.5 9.0 9.5
63
from the meteorological point of view. Precipitation in 1994 was within the average values of theprevious 10 years (410 mm yr-1) while 1995 was very dry with scarce rainfall (215 mm yr-1). Asdescribed below, this difference heavily affected the water budget of the lagoon.
Using a particularly complete data set, budgets are calculated on annual and seasonal (3 months) basisfor both years.
The main water input to the lagoon is the discharge of the pumping station (VQ), which is the only inputfrom the catchment area. The discharge of Acque Medie and Santa Anna canals was considered zerobecause they are dry for most of the year and when they are in flood, their discharge is negligiblecompared to that of the pumping station. The water collected by the pumping station is brackish due toan input of marine water upstream of the pumping station. Precipitation data (VP) are obtained from theMeteorological Station and evaporation (VE) was calculated by the Hargreaves’ equation. Evaporationlargely exceeds precipitation in spring and summer while similar fluxes were calculated in autumn andwinter. No data are available for groundwater inputs which were therefore assumed to be zero.
The water seasonal budgets for 1994-95 are summarised in Table 4.17. Additionally, separate budgetswere calculated for October-November and for December 1995 periods due to the differenthydrological regimes: very dry during the first, followed by high rainfall in December.
Since inputs to the lagoon are of brackish rather than freshwater, SQ values for S’Ena Arrubia aregreater than zero (Table 4.17) and therefore salt budgets were calculated from the general equation:
assuming steady state conditions and that SP, SG, SO and SE were zero, the equation was reduced to:
0 = +VQSQ+VRSR+VX (Socn-Ssyst)
and
VX = -(VQSQ+VRSR)/(Socn-Ssyst)
Table 4.17. Seasonal water budgets, salinity and water exchange time of the S'Ena Arrubialagoon. Water flux in 103 m3 d-1, salinity in psu and water exchange time (τ) in days.
The year 1994 was characterised by a similar scenario during the first 3 seasons, while the autumn wascharacterised by higher water flows which reduced the estimated water exchange time from about amonth to about 5 days. A constant net export of water from the lagoon to the sea, indicated by negativeVR was observed throughout the year. In 1995, water inputs were rare in winter and very low from Julyto November. The consequences are evident from the lower net water exports from the lagoon and thenet import from the sea from July to November (VR positive). High salinity values, up to 50 psu, weremeasured in the lagoon from August to October and the theoretical water residence time increased tomore than a year. Normal conditions were recovered from December onwards, when rainfall startedand the estimated mean water exchange time was reduced to about 9 days.
64
Budgets of nonconservative materials
Table 4.18 summarizes the seasonal concentrations of dissolved inorganic phosphorus (DIP) anddissolved inorganic nitrogen in the river, S’Ena Arrubia lagoon and adjacent ocean. Nonconservativefluxes of DIP and DIN were derived from the water budget in Table 4.17 and nutrient concentrations inTable 4.18.
Table 4.18. Seasonal nutrient concentrations (in mmol m-3) for S’Ena Arrubia lagoon.
Season DIPQ DIPsyst DIPocn DINatm DINQ DINsyst DINocn
DIP balanceData for the seasonal DIP budgets for 1994-95 are reported in Table 4.19. Atmospheric DIP inputswere estimated by direct measurements conducted in the 1997 and estimated to be 0.7 mol per daywhich is negligible compared to the DIP input from the discharge (VQDIPQ).
In 1994, as for the water and salt budgets, similar scenarios were observed in the first three seasonswhile in autumn the maximal inputs of DIP were measured (more than 50% of the annual total). In1995, the lower water fluxes led to high concentrations of DIP in the lagoon even though DIP inputswere lower than in 1994. Maximal 1995 inputs were observed in December coupled with the maximalannual water discharges from tributaries.
For the whole of the investigated period, S'Ena Arrubia lagoon acted as a sink for DIP since ∆DIP wasalways negative. Maximal negative values were measured in autumn 1994 in concurrence with thehighest DIP inputs.
Table 4.19. Seasonal DIP budgets of the S'Ena Arrubia Lagoon.
DIN balanceThe data for the seasonal DIN budgets for 1994-95 are reported in Table 4.20. An average value of 46µM for DIN for the precipitation was considered.
65
High DIN inputs, dominated by ammonium (73% of total DIN), were measured in autumn 1994. In thelagoon, DIN concentrations were maximal in winter of both years, in these cases, the dominant formwas nitrate since ammonium concentrations were generally negligible. 1994 was characterised byhigher DIN inputs and DINsyst compared to 1995. Nonconservative flux of DIN (∆DIN) was negativefor the whole of the investigated period indicating a dominance of DIN removal processes (mainlyassimilation) and the lagoon act as a net sink for DIN. As for ∆DIP, the maximal negative ∆DIN valueswere observed in autumn 1994.
Table 4.20. Seasonal DIN budgets of the S'Ena Arrubia Lagoon.
Stoichiometric calculations of aspects of net system metabolismAccording to the assumption of the LOICZ Biogeochemical Model, the negative ∆DIP values candirectly estimate DIP assimilation for the organic matter production. In this lagoon, the gap betweenDIP input and output is probably really related to the primary producer's uptake since the silico-clasticnature of the sediment and its low iron content should not permit high inorganic P adsorption (Lapointeet al. 1992; Golterman 1995). In fact the negative peak of ∆DIP, as well as for ∆DIN, was measured inautumn 1994 when a large phytoplankton bloom occurred, as indicated by high chlorophyll-aconcentration (up to 100 µg l-1) (Baroli et al., 1996).
The lagoon was colonized by dense beds of floating macroalgae for most of the investigated period,with density peaks of up to 140 g DW m-2 (Baroli et al., 1996). The measured N:P ratio’s for the Ulvacurvata thalli ranged from 10 and 35, although the mean value was close to the Redfield ratio whichwas used for all the following stoichiometric calculations (no data are available for C content of themacroalgae so Redfield CNP ratio of 101:16:1 was used) .
Results of the seasonal budgets are summarised in Table 4.21. The net nitrogen fixation minus thedenitrification (nfix-denit) was calculated from the difference between the observed and expected∆DIN’s.
Table 4.21. Seasonal variation of (nfix-denit) and net ecosystem metabolism (p-r).
Expected ∆DIN was calculated by multiplying the ∆DIP by the N:P ratio of the organic matterproduced.
In the S’Ena Arrubia lagoon, nitrogen fixation inputs appears to dominate over losses viadenitrification, since (nfix-denit) was positive over the whole investigated period . In both years, (nfix-denit) was lower than 2 mmol m-2 d-1 except in autumn when values of up to 2.6 mmol m-2 d-1 werecalculated. These estimated maxims appear to be somewhat unexpected, since the high DINconcentrations would depress nitrogen fixation rates and suggests that other processes may effect thecalculations, for example luxury N-uptake by macroalgal would reduce their C:N ratio to below that ofthe Redfield ratio used in the calculations.
The net ecosystem metabolism NEM or (p-r) was positive for the whole investigated period, evenduring the dry season when salinity increased to very high values and water exchange was very low.Thus in this lagoon, the production of organic matter seems more efficient than its oxidation, thereforethe S’Ena Arrubia lagoon can be considered as an autotrophic system. In 1994, which was consideredas typical year with normal water fluxes, the first 3 seasons were quite similar ((p-r) about 12 mmol m-2
d-1) while in autumn when nutrients inputs were maximal, the net ecosystem metabolism was about 4times higher (42 mmol m-2 d-1). In the next year, the low precipitation and the consequently stressedconditions due to high salinity, affected (p-r) values which were reduced to 3 mmol m-2 d-1 in summer; apartial recovery was observed close to the end of the year.
67
4. COASTAL SYSTEMS OF FRANCE
The western Mediterranean SeaThe Mediterranean Sea is generally shallow, with an average depth of 1,501 m. Undersea ridges stretchfrom Tunisia to Sicily, dividing the Mediterranean into eastern and western basins, and between Spainand Morocco at the sea’s outlet to the Atlantic Ocean. The narrow Strait of Gibraltar is also extremelyshallow, restricting circulation and greatly reducing the tidal range of the sea. These factors, coupledwith the high rate of evaporation, make the Mediterranean considerably saltier than the Atlantic.
The Gulf of Lions, a continental margin in the north-west Mediterranean, extends along the coast ofsouthern France from the Spanish border on the west to Toulon on the east, and its coastline includesthe eastern Pyrenees, some lagoons, the Rhone delta and limestone hills. The cold air which sweepsfrom the Alps through the Rhone Valley becomes a cold, dry northerly wind, the mistral, in the Gulf.
5.1 Gulf of Lions
X. Durrieu de Madron, L. Denis, F. Diaz, N. Garcia, C. Guieu, C. Grenz, M.D. Loÿe -Pilot, W.Ludwig, T. Moutin and P. Raimbault
Study area description
The Gulf of Lions (42-44°N, 3-6°E) has a large crescent-shaped continental shelf (Figure 5.1). Morethan ten rivers with a total watershed area of about 125,000 km2 deliver significant water dischargesinto the gulf. The Rhône River on the north-eastern part of the gulf delivers about 80% of the totalriverine water inputs. The shoreline is largely urbanized (ca. 1.5 million inhabitants), with one of thelargest French cities, Marseilles (800,000 residents), at the north-eastern tip of the shelf.
Figure 5.1. Map of the Gulf of Lions with the stations used to develop the budgets. The shelfregion is delimited by the 200 m isobath.
Bla ck Se a
M e diterr ane an S ea
G ulf o fLi ons
68
The Gulf of Lions shelf has been the subject of intensive physical and biogeochemical oceanographicstudies over the last 8 years. Water, salt, and nutrient budgets for the Gulf of Lions' shelf system weredeveloped using data acquired in the French PNEC (Programme National Environnement Côtier) andEuropean METRO-MED programs. Three surveys of the gulf were carried out in March and June 1988and January 1999. Extensive data sets of dissolved inorganic and organic nutrients (NO3
-, NO2-, NH4
+
and PO4-3) were collected in combination with CTD data and studies of primary and new production
(Diaz 2000; Raimbault 2000).
This work complements the carbon budgets (Durrieu de Madron et al. 2000; Sempéré et al. 2000) aswell as the physical and biogeochemical modeling (Pinazo et al. 1996, Tusseau-Vuillemin et al. 1998;Diaz 2000) already performed for this area.
Freshwater and freshwater nutrient sourcesTerrestrial sources of nutrients from sewage treatment waters, runoff and rivers bring significant supplyof nutrients in the form of nitrate and phosphate to the gulf. Minas and Minas (1989) showed that theRhone River inputs significantly enhance the primary productivity on the shelf.
Extensive water flux data are available for the Gulf of Lions' rivers, through the Compagnie Nationaledu Rhône and the HYDRO data bank of the French ministry of environment. Dissolved inorganicnutrients (DIP, DIN) concentrations are available for all rivers through water agencies for the last 20years. Dissolved organic nutrients (DOP, DON) concentrations are available only for the Rhône River.These values are used to extrapolate the river inputs of organic nutrients from all rivers. Freshwaterinputs and DIN concentrations strongly decrease during the summer season (June-October) (Figure5.2). Compared to the long term monthly average, DIP concentrations during the year 1998 are 2 to 4times lower than the climatological average (Figure 5.2).
Significant discharges of treated sewage effluent occur at Marseilles. Although the water volume ofsewage is small relative to other freshwater inputs, total N and P are highly concentrated in the effluent(data from the Service d'Assainissement of city of Marseilles, personal communication). We use thefollowing stoichiometric ratios between the dissolved and total fractions: DIN:TN = 0.38 and DIP:TP =0.5 (San Diego-McGlone et al. 2000) to estimates the discharges coefficients (water : 0.3 m3 d-1 perperson, DIP : 19 mmole d-1 per person, DIN : 419 mmole d-1 per person). Sewage discharges to the seaby the total population living along the coast (1.5 million) are evaluated using these dischargecoefficients.
Evaporation and precipitation are estimated from a high-resolution re-analysis of the ECMWF modeloutputs made by the CERFACS in Toulouse (data from Siefridt et al., personal communication). Thenet balance of precipitation and evaporation remains negative all year long, with rainfall decreasingduring summer and evaporation decreasing during spring (Figure 5.3).
Aerosols transported to the Gulf of Lions consist of anthropogenic-rich "background" materialssupplied continuously from the nearby land, upon which sporadic pulses of Saharan terrigenous dust aresuperimposed. Inorganic nitrogen is almost entirely anthropogenic (industrial combustion, vehicletraffic and intensive livestock breeding) and contributes to new production. Crustal inorganicphosphorus may represent half of total deposition but its solubility and bioavailability are uncertain.The only dry and wet atmospheric deposition of inorganic nitrogen for the Gulf of Lions region weremeasured in 1988-89 (Alarcon and Cruzado 1990; Loÿe-Pilot et al. 1991; Guieu 1991; Loÿe-Pilot et al.1993). Likewise, the only recent atmospheric deposition of total phosphorus was measured at theatmospheric sampling station of Ostriconi in Corsica in 1999-2000. The DIP flux was estimated torepresent 20% of the total atmospheric deposition (Ridame, personal communication 2001); thispercentage is probably underestimated because a fraction of the dry deposition of anthropogenic originwill dissolve in seawater and so far, no data are available to quantify this dissolution.
69
Saltwater and marine nutrient sourcesA cyclonic current that composes the northern branch of the general circulation in the westernMediterranean essentially drives the movement of the water masses. Whereas the main outer branchpermanently flows south-westward along the slope (water flux about 1-2x10⁶ m3 sec-1), a shallowbranch of this current occasionally penetrates over the shelf under the effect of wind (Millot 1990;Estournel et al. submitted) and exchanges dissolved inorganic and organic nutrients between the oceanand the shelf. The hydrological structures present also a well-marked seasonality as a result of surfaceheat fluxes. In summer, the solar heating of the surface layer causes the formation of a seasonalthermocline around 20-40 m depth. In winter, cold and continental winds as well as air-sea temperaturedifferences induce evaporation and heat loss from the sea. The sustained cooling and mixing of thesurface layer lead to a relatively homogeneous water column and the formation of dense waters on theshelf that cascade down the slope. This latter process was not observed during the winter/springsurveys, but is considered as a major export mechanism (Tusseau-Vuillemin et al. 1998, Béthoux et al.submitted). The upward transport of nutrients by vertical mixing in winter explains the relativeimportance of primary productivity rates in the Gulf of Lions compared to those generally measured inthe Mediterranean Sea (Diaz et al. 2000).
Flux of nutrients at the sediment/water interface was measured at the shelf stations for the three surveys(Denis 1999; Denis et al. 2001). A significant release of inorganic nitrogen and phosphorus wasobserved over the whole shelf area.
System descriptionWe chose a single box system to describe the unstratified water column observed for the January andMarch cruises. This unstratified condition prevails from November to early May. As the system inJune changes to a stratified water column, we used a two-layer system to describe the summer waterand nutrient dynamics. This stratified situation lasts from June to October. The annual approximationof the budget has thus three periods corresponding to the different field surveys: a winter period fromNovember to February, a spring period from March to May and a summer period from June to October.
The system is delimited by the shelfbreak, which is delineated by the 200 m isobath (Figure 5.1) anddivides the shelf waters from the slope waters offshore. In survey data, gradients of salinity andnutrients are associated with this boundary, reflecting the dilution of the riverine freshwater and nutrientinputs on the shelf. The shelf system has a surface area of 12,000 km2 , and a total volume of 910x109
m3. While the shelf has a sloping bottom down to 200 m, the average depth for the one-layer model isabout 76 m. For the two-layer models the surface layer thickness was 30 m, and the deep layer averagedepth was 46 m.
Salinity and nutrient data were depth-averaged at each station for the different layers considered. Onlydata shallower than 150 m depth were used since exchanges between the shelf and the slope occurmainly within this layer. The data were then horizontally averaged separately for the shelf region andthe slope region.
The budgetary analysis was performed using the LOICZ Biogeochemical Modelling Guidelines(Gordon et al. 1996), and is presented in Figures 5.4 to 5.8.
Water and salt balance
Water and salt balance allowed the estimation of volume transports between the shelf and the slope, aswell as between the surface and deep shelf layers during the stratified period. The Gulf of Lions shelfhas a low residual export compared to the large mixing exchanges between the shelf and the slopewater. Shelf-slope exchanges represent less than 20% of the along-slope circulation water transport.
70
Balance of nonconservative materials
Nonconservative dissolved inorganic phosphorus (DIP) and nitrogen (DIN) fluxes and dissolvedorganic phosphorus (DOP) and nitrogen (DON) fluxes were calculated using the estimated volumetransports. The Gulf of Lions shelf apparently took up DIP, DIN and DOP during the three surveys.Minimum values were observed during the March survey (spring bloom period). The system also tookup DON during the spring survey, but liberated DON during the winter and summer surveys.
Stoichiometric calculations of aspects of net system metabolismThe parameter (nfix-denit) is estimated using all inorganic and organic imbalances (∆DIP, ∆DIN,∆DOP, ∆DON). With the assumption that the system is dominated by phytoplankton and using theRedfield ratio of N:P (16:1) (Redfield et al. 1963), the (nfix-denit) obtained is negative for the threesurveys and its annual average is about -1 mmol N m-2 d-1 (Table 5.1). The denitrification processslightly dominates the N2 fixation process and the Gulf of Lions appears to be a sink of fixed nitrogen.Furthermore, based on the C:P (106:1), the system is interpreted to be autotrophic (p-r) by about +16mmol C m-2 d-1 (Table 5.1) and appears to be a net producer of organic matter.
Table 5.1. Summary of water exchange time, nonconservative nutrient fluxes, apparent netmetabolism (p-r) and nitrogen fixation minus denitrification (nfix-denit) for the three surveys andthe annual approximation. Results for the June 98 survey correspond to the sum of surface and deeplayers.
Figure 5.2. Monthly-average riverine discharge of freshwater (A), DIN (B) and DIP (C)concentrations in 1998 and for the long term average.
72
Figure 5.3. Monthly average evaporation (upper) and precipitation (lower) on the Gulf of Lionsin 1998 and the long term average.
�PAGE � 73
Figure 5.4. Water and salt budgets of the Gulf of Lions for the three surveys. Water and saltfluxes in 106 m3 d-1. Salinity is dimensionless since it is computed from a conductivity ratio.
� EMBED ABCFlowCharter6.Document
� EMBED ABCFlowCharter6.Document
� EMBED ABCFlowCharter6.Document
�PAGE � 74
Abbreviated indexes have the following meanings : Q (river), O (urban sewage), G (groundwater), E (evaporation), P (precipitation), R (residual), X (horizontal mixing), Z (vertical mixing),syst (system), ocn (ocean), s (surface), d (deep).
�PAGE � 75
Figure 5.5. DIP budgets of the Gulf of Lions for the three surveys. Fluxes are in 103 mol P d-
1. Abbreviated indexes have the following meanings : Q (river), O (urban sewage), sed
� EMBED ABCFlowCharter6.Document
� EMBED ABCFlowCharter6.Document
� EMBED ABCFlowCharter6.Document
�PAGE � 76
(sediment), atm (atmosphere), R (residual), X (horizontal mixing), Z (vertical mixing), syst(system), ocn (ocean), s (surface), d (deep).
� EMBED ABCFlowCharter6.Document
� EMBED ABCFlowCharter6.Document
� EMBED ABCFlowCharter6.Document
�PAGE � 77
Figure 5.6. DIN budgets of the Gulf of Lions for the three surveys . Fluxes are in 103 mol Nd-1. Abbreviated indexes have the following meanings : Q (river), O (urban sewage), sed(sediment), atm (atmosphere), R (residual), X (horizontal mixing), Z (vertical mixing), syst(system), ocn (ocean), s (surface), d (deep).
�PAGE � 78
Figure 5.7. DOP budgets of the Gulf of Lions for the three surveys. Fluxes are in 103 mol Pd-1. Abbreviated indexes have the following meanings : Q (river), O (urban sewage), sed(sediment), atm (atmosphere), R (residual), R (horizontal mixing), Z (vertical mixing), syst(system), ocn (ocean), s (surface), d (deep).
� EMBED ABCFlowCharter6.Document
� EMBED ABCFlowCharter6.Document
� EMBED ABCFlowCharter6.Document
�PAGE � 79
�PAGE � 80
Figure 5.8. DON budgets of the Gulf of Lions for the three surveys. Fluxes are in 103 mol Nd-1. Abbreviated indexes have the following meanings : Q (river), O (urban sewage), sed(sediment), atm (atmosphere), R (residual), X (horizontal mixing), Z (vertical mixing), syst(system), ocn (ocean), s (surface), d (deep).
� EMBED ABCFlowCharter6.Document
� EMBED ABCFlowCharter6.Document
� EMBED ABCFlowCharter6.Document
�PAGE � 81
5. ESTUARINE SYSTEMS OF MOROCCO
Morocco, on the north-west corner of Africa (21-36oN), has nearly 3000 km of low-relief AtlanticOcean coast and 500 km of rocky shores along the Mediterranean Sea. Four mountain ranges runacross the country, including the Middle Atlas and High Atlas, the highest mountain chains innorthern Africa. From the Atlas Mountains, plains extend west to the Atlantic, while desert andsemi-desert plateaux spread south-east and east. The main rivers (Loukkos, Bouregreg, Sebou,Oum Rbia and Souss) rise in the mountains and flow to the Atlantic; only one major river, theMoulouya, flows to the Mediterranean.
Climatically, Morocco has maritime, mountain and desert influences. There are two distinctseasons, a hot, dry summer and a cool to cold winter. Rainfall is extremely variable in space andtime. Average rainfall varies from north (700 mm) to south (25 mm) and from west (600 mm) toeast (100 mm), with the most rain falling on the Rif and Atlas mountains (2000 mm). Most of therain (95% falls in October-May, with rare storms in summer in the mountains.
Water resources are scarce and 70% of the available water is used for irrigation. With apopulation of 28 million (1999), 55% of them in cities and towns, and an estimated populationgrowth of 1.35% per year, Morocco is already in a water-stress situation (<1,000 m3/person/year)and by 2020 this will be critical (<500 m3/person/year). The main towns and cities are along theAtlantic coast, as are industries, tourism and some agriculture. Fishing is good and diverse butthe coastal zone is under increasing pressure, particularly near the mouth of the Sebou River andoffshore of major urban agglomerations.
Source: Maria Snoussi
6.1 Moulay Bousselham Lagoon, Atlantic coast
M. Snoussi and L. Ouaknine
AbstractThe Moulay Bousselham coastal lagoon is a Biosphere reserve, Ramsar site and protected wetland on theAtlantic north coast of Morocco. However, the pressures of the increasing population and activities aroundthe lagoon are threatening the system. Available physico-chemical data was compiled to construct apreliminary nutrient budget applying the LOICZ biogeochemical approach. Based on water and saltbudgets, the water exchange time was estimated at about 14 days. The net nonconservative fluxes ofdissolved inorganic phosphorus and nitrogen (∆DIN and ∆DIP) show that the system is slightly net sourcefor DIP and a net sink for DIN. The system appears to be net denitrifying and net heterotrophic. Thesepreliminary budgets need to be completed with more DIP and DIN data for the whole year.
Study area description
The Moulay Bousselham Lagoon is situated on the Atlantic north coast of Morocco (34.83ºN,6.27ºW; Figure 6.1). The lagoon has an ellipsoidal shape in a north-south direction, is 9 km inlength and 5 km wide in its widest portion; its area is 35 km². The Drader River channel dividesthe lagoon into two sub-basins, Merja Kahla to the north with an average depth of 0.3-0.5 m andMerja Zerga to the south with 1-1.5 m depth. The outer channels are 4-5 m deep. The inletcommunicates with the ocean intermittently, as sediment accumulation after strong storms closesits mouth. Studies done since 1928 have reported that closure of the inlet occurs every 3-5 years(Beaubrun 1976). The mouth is now kept permanently open by artificial means.
�PAGE � 82
The lagoon has a semi-diurnal tidal cycle. Tide amplitudes at the entrance ranges from about 1.5m at neap tide to about 1 m at spring tide. Intertidal zones cover 96% of the area and representthe main vegetation types, with Spartina densiflora,, Salicornia, Sarcoconia, Juncus rigidus andseagrass (Benhoussa 2000).
Figure 6.1. Location and map of Moulay Bousselham Lagoon, Morocco.
Climatic data from 1983-1992 give an annual precipitation average of 600 mm with a strongseasonal and interannual variability and an annual average evaporation of 1,360 mm. Averagetemperature is about 18°C.
The lagoon system receives drainage mainly from the Drader River to the east and the NadorCanal to the south. The Drader River has a drainage area of 750 km2 and an annual runoffvolume of about 31x106 m3 yr-1 or 85x103 m3 d-1 (Beaubrun 1976). The Nador Canal was built in1953 to drain flooded depressions and cultivated areas of the Rharb coastal plain. Its meanannual discharge to the Moulay Bousselham lagoon has been estimated to be 150x106 m3 yr-1 or411x103 m3 d-1 (Carruesco 1989).
Moulay Bousselham Lagoon is one of the most important ornithological sites in Morocco. Manyspecies of migratory birds (110 species according to Benhoussa 2000) use the lagoon as astopover from Europe to the south. Despite its protected status under the Ramsar Convention as a
�PAGE � 83
coastal wetland of international importance, the abundance and diversity of flora and fauna arethreatened by human activities (El Agbani et al. 1998).
The population in Moulay Bousselham Lagoon and adjacent area is about 154,000. The mainactivities are land cultivation and cattle raising (practised by more than 90% of the population),artisanal fishing and shellfishing (15%) (Benhoussa 2000) and summer tourism, an importantincome source for the local people. Agro-chemicals are used in 78% of the cultivated areaaround the lagoon. These activities are increasing without enough consideration of theenvironmental impacts on biodiversity and other aspects of ecological change.
Construction of the Nador Canal, the damming of the Drader River in 1979 for irrigationpurposes, together with the agricultural activities and the closure/artificial opening of the inlet,put at risk the basic structural functions of the ecosystem and its resources.
For budgetary calculations, data for water and salinity were obtained from various sources(Beaubrun 1976; Zarzozo 1982; Carruesco 1989). The dissolved inorganic phosphorus (DIP) anddissolved inorganic nitrogen (DIN) data for the lagoon and the inshore ocean are from Badour(1987), based on 40 water surface samples collected between March and June 1987 at 5 stations.Data on groundwater are from the DRPE (1998). DIN represents NO3
- + NO2- + NH4
+. Thefluxes of water, salt, DIP and DIN were calculated using simple box models following Gordon etal. (1996).
Water and salt balance
The box model (Figure 6.2) represents the terms used for calculating the average annual waterand salt budgets. Freshwater flow (VQ) is estimated by adding the flows of the Drader and Nadorstreams (496x103 m3 d-1). Considering the inundated area of the system (23x106 m2), precipitation(VP) and evaporation (VE) are estimated as 38x103 m3 d-1and 85x103 m3 d-1, respectively.Groundwater input (VG) is estimated as 96x103 m3 d-1. Sewage inflow (VO) is assumed to be zero(but may be higher, especially in the summer period). Using equations from Gordon et al.(1996), the system shows substantial net residual outflow of water (VR), as freshwater inputs tothe system exceed evaporation. The water exchange time of water in Moulay Bousselham lagoonfor the summer period can be calculated from equation (1), where Vsyst is the total volume of thesystem, |VR| the absolute value of VR and VX the mixing volume.
τ = Vsyst /((VR(+ VX) (1)
Water exchange time was 14 days.
Budgets of nonconservative materials
Assuming steady state and considering runoff and groundwater as the important terrigenousinputs to the lagoon, the general equation for calculating nonconservative fluxes of dissolvedelement Y is :
∆Y = -VQYQ -VGYG -VRYR -VX (Y2- Y1) (2)
The nonconservative fluxes, ∆DIP and ∆DIN are calculated from data in Table 6.1 and illustratedin Figures 6.3 and 6.4. We have only data from March to June 1987. Nevertheless, we use thesedata as at least an approximation of the annual average fluxes.
�PAGE � 84
Table 6.1. Water inputs, salinity, DIP and DIN concentrations for Moulay Bousselhamlagoon. (*Badour, 1987; **DRPE, 1998).
Groundwater (VG)960 (assumed)0 (assumed; may not be correct)808**
DIP and DIN balanceThe system appears to be a net source for DIP; ∆DIP = +10 mol d-1. Extrapolating over the entirearea, the rate is close to zero; ∆DIP = +0.0004 mmol m-2 d-1.
�PAGE � 85
Dissolved inorganic nitrogen concentration and flux are very high in groundwater. It can be seenthat the system takes up most of the DIN delivered to the system, it is therefore a net sink forDIN. The observed flux per unit area is ∆DIN = -1.7 mmol m-2 d-1.
The rates of nonconservative DIP and DIN fluxes can be used to estimate the apparent rate ofnitrogen fixation minus denitrification (nfix-denit) as the difference between observed andexpected ∆DIN. Expected ∆DIN is ∆DIP multiplied by the N:P ratio of the reacting particulateorganic matter. We assume that this reaction is the Redfield N:P ratio of 16:1, for plankton.
(nfix-denit) = ∆DINobs - ∆DINexp = ∆DINobs - (N:P) part x ∆DIP (3)
Thus the system appears to be denitrifying at a substantial rate; (nfix-denit) = -1.7 mmol m-2 d-1.
The calculation of the net ecosystem metabolism, that is, the difference between organic carbonproduction (p) and respiration (r) within the system (p-r), is made through equation (4):
(p-r) = - ∆P x (C:P) part (4)
Assuming again that organic oxidation is the primary source of nonconservative DIP flux, thisrate is estimated as the Redfield ratio of the reacting organic matter (C:P = 106:1)
(p-r) = -0.04 mmol m-2 d-1
This result indicates that the Moulay Bousselham Lagoon is slightly net heterotrophic.
�PAGE � 86
Figure 6.2. Water and salt budgets for Moulay Bousselham Lagoon. Water fluxes in 103 m3
d-1and salt fluxes in 103 psu-m3 d-1.
Figure 6.3. DIP budget for Moulay Bousselham Lagoon. Fluxes in mol d-1.
Figure 6.4. DIN budget for Moulay Bousselham Lagoon. Fluxes in mol d-1.
� EMBED ABCFlowCharter6.Document
� EMBED ABCFlowCharter6.Document
� EMBED ABCFlowCharter6.Document
�PAGE � 87
7. REFERENCES
Alarcon, M. and Cruzado, A. 1990 Particulate aerosol nutrient inputs into the North westernMediterranean Sea. Pages 635-644 in Martin, J.M. and Barth, H. (eds.): EROS 2000(European River Ocean System) Project Second Workshop. Water Pollution ResearchReport 20, CEC, Brussels.
Alldredge, A.L. and Cohen, Y. 1987 Can microscale chemical patches persist in the sea? Micro-electrode study of marine snow, fecal pellets. Science 235:689-691.
Andreoli, C., Moro, I. and Tognetto, L. 1998 Il fitoplancton delle Valli di Comacchio da gennaioa dicembre 1997. Laguna suppl. 5/98:16-23.
ARPA-DAPHNE 1998 Eutrofizzazione delle acque costiere dell’Emilia Romagna-rapportoannuale 1997. Regione Emilia Romagna, Assessorato Ambiente, 219 pages.
Atkinson, M.J. and Smith, S.V. 1983 C:N:P ratios of benthic marine plants. Limnol. Oceanogr.28:568-574.
Azzoni, R., Giordani, G., Bartoli, M., Welsh, D.T. and Viaroli, P. 2001 Iron, sulphur andphosphorus cycling in the rhizosphere sediments of a eutrophic Ruppia cirrhosa meadow(Valle Smarlacca, Italy). Journal of Sea Research 45:15-26.
Badour, N. 1987 Contribution à l'étude physico-chimique de la lagune de Moulay Bousselham.Mémoire de fin d'Etudes, IAV Hassan II, Rabat, 58 pages.
Baroli, M., Piergallini, G., Guerzoni, S., Bombelli, V., Lenzi, M., Rossetti, G., Giordani, G. andViaroli, P., 1996 Eutrophication and macrophytes in the S'Ena Arrubia lagoon (westerncoast of Sardinia). EUMAC: Eutrophication and macrophytes, Synthesis Report. CEC EV95: 191-207.
Bartoli, M., Castaldelli, G., Nizzoli, D., Gatti, L.G. and Viaroli, P. 2001 Benthic fluxes ofoxygen, ammonium and nitrate and coupled-uncoupled denitrification rates withincommunities of three different primary producer growth forms. Chapter 29: 227-235 inFaranda, F.M., Guglielmo, L. and Spezie, G. (eds): Structure and processes in theMediterranean ecosystems. Springer Verlag Italia, Milano.
Bartoli, M., Nizzoli, D., Viaroli, P., Turolla, E., Castaldelli, G., Rossi, R., Castaldelli, G. andFano, A.E. Impact of a Tapes philippinarum culture on nutrient dynamics and benthicrespiration in the Sacca di Goro. Hydrobiologia , in press.
Basset, A. 2000 Studio dello stato attuale di salute dei Laghi Alimini e primi interventiconservativi diripristino ambientale. Relazione finale, Progetto Master Plan LaghiAlimini.
Basset, A., Carlucci, D., Fiocca, A. and Vignes, F. 2001 Water transparency and health of coastalsalt marshes: simple enclosure experiments on nutrients dynamics. Aquaticconservation:Marine and Freshwater Ecosystems (in press).
Bazov, V.I. 1983 Celebnii Klimat. Izdatelstvo”Tavriya”, Simferopol, 96 pages (in Russian).Beaubrun, P.Ch. 1976 La lagune de Moulay Bousselham: étude hydrologique et
sédimentologique. Bull. Inst. Sci. Rabat 1:5-37.Bencivelli, S. 1998 La Sacca di Goro: La situazzione di emergenza dell’estate 1997. Pages 61-
66 in: Lo stato dell’ambiente nella provincia di Ferrara. Anno 1997. AmministrazioneProvinciale di Ferrara. Servizio Ambiente..
Benhoussa, A. 2000 Caractérisation des habitats et microdistribution de l'avifaune de la zonehumide de Merja Zerga (Maroc). Thèse Doc. d'Etat. N° 1811, Univ. Mohamed V, Rabat,256 pages.
Béthoux, J.P., Durrieu de Madron, X., Nyffeler, F,. and Taillez, D. Deep water in the westernMediterranean: peculiar 1999 and 2000 characteristics and formation variability since1970. Journal of Marine Systems (submitted).
Bethoux, J.P., Morin, P., Madec, C. and Gentili, B., 1992 Phosphorus and nitrogen behaviour inthe Mediterranean Sea. Deep-Sea Res. 39(9):1641-1654.
�PAGE � 88
Bondavalli, C., Naldi M., Viaroli, P., Baroli, M. and De Falco, G. 1996 Oxygen and nutrientfluxes in relation to macrophyte and sediment activities in the S’Ena Arrubia lagoon.EUMAC: Eutrophication and macrophytes, Synthesis Report CEC EV 95: 209-220.
Braginskii, L.P (Chief Ed) 1992 Hydrobiological regime of the Dniester river and its lakes.Naukova Dumka, Kiev, 356 pages (in Russian).
Carruesco, Ch. 1989 Genèse et évolution de trois lagunes du littoral atlantique, depuisl'Holocène: Oualidia, Moulay Bousselham (Maroc) et Arcachon (France). Thèse Doctoratd'Etat, univ. Bordeaux I, 458 pages.
Christensen, J.P., 1994 Carbon export from continental shelves, denitrification and atmosphericcarbon dioxide. Continental Shelf Research 14 (5):547-576.
Ciavola, P. Gonella, M., Tessari, U. and Zamariolo, A. 2000 Contributo alla conoscenza delclima meteomarino della Sacca di Goro: misure correntometriche e mareografiche. StudiCostieri 2: 153-173.
Cociasu, A., Mihnea, P.E. and Petranu, A. 1999 Ecological indicators of the Romanian coastalwaters in the Black Sea. Pages 131-170 in Mee, L.D. and Topping, G. (eds): Black SeaPollution Assessment. Black Sea Environmental Series Vol.10. United NationsPublications, New York.
Colombo, G., Bisceglia, R., Zaccaria, V. and Gaiani, V. 1994 Variazioni spaziali e temporalidelle caratteristiche fisicochimiche delle acque e della biomassa fitoplantonica dellaSacca di Goro nel quadriennio 1988-1991. Pages 9-82 in Bencivelli, S, Castaldi, N andFinessi, D. (eds.): Sacca di Goro: Studio integrato sull’ecologia . Provincia di Ferrara,FrancoAngeli, Milano.
Consorzi di Bonifica Ferraresi 1991-1999 Riepilogo dei rilievi climatici e dei dati relativi alloscolo e alla derivazione irrigua. Rapporti Annuali: 1991-1999. 1° Circondario Polesinedi Ferrara.
Dallocchio, F., Ghion, F., Milan, C. and Viaroli, P. 1998 Variazioni temporali dellecaratteristiche chimio fisiche delle acque delle Valli di Comacchio. Laguna suppl. 5/98:4-15.
Dalsgaard, T., Nielsen, L.P., Brotas, V., Viaroli, P., Underwood, G.J.C., Nedwell, D.B.,Sundback, K., Rysgaard, S., Miles, A., Bartoli, M., Dong, L., Thornton, D.C.O., Ottosen,L.D.M., Castaldelli, G. and Risgaard-Peterseen, N. 2000 Protocol handbook for NICE-Nitrogen cycling in estuaries: a project under the EU research programme. MarineScience and Technology (MAST III). National Environmental Research Institute,Silkeborg, Denmark, 62 pages.
Denis, L. 1999 Dynamique des flux d'oxygène et de sels nutritifs à l'interface eau-sédiment sur lamarge continentale du Golfe du Lion (Méditerranée Nord-Occidentale). PhD thesis,University of Aix-Marseille II, France.
Denis, L., Grenz, C., Alliot, E. and Rodier, M. 2001 Temporal variability in dissolved inorganicnitrogen fluxes at the sediment-water interface and related annual budget on a continentalshelf (Gulf of Lions - NW Mediterranean Sea). Oceanologica Acta (in press).
Diaz, F. 2000 Evolution saisonnière de la production primaire et des processus d’assimilation –régénération de l’azote dans le Golfe du Lion. Estimation d’un bilan de carbone.Approches in situ et modélisation. PhD thesis, University of Aix-Marseille II, France.
Diaz, F., Raimbault, P. and Conan, P. 2000 Small-scale study of primary productivity duringspring in a Mediterranean coastal area (Gulf of Lions). Continental Shelf Research 20 (9):975-996.
Dimensione Ambiente 1991-1997 Indagine quali-quantitativa delle acque superficiali dei baciniBurana-Volano e Canal Bianco. Rapporti Annuali: 1991-1997. Provincia di Ferrara,Servizio Ambiente .
DRPE 1998 Etat de qualité des ressources en eau du Maroc (Année 1995-1996). Direction de laRecherche et de la Planification de l'eau. Rap. Avril 1998, Rabat, 59 pages.
�PAGE � 89
Durrieu de Madron, X., Abassi, A., Heussner, S., Monaco, A., Aloisi, J.C., Radakovitch, O.,Giresse, P., Buscail, R. and Kerherve, P. 2000 Particulate matter and organic carbonbudgets for the Gulf of Lions (NW Mediterranean). Oceanologica Acta 23 (6):717-730.
Dziganshin, G.F. and Yurkova, I.Y. 2001 Interannual variability of the river discharge into thenorth-western part of the Black Sea. Pages 267-272 in Eremeev V.N. (Chief Ed.):Systems of Environmental Control : Collected papers, MHI NAS, Sevastopol, 450 pages(in Russian).
EEA 1999 Discharges via rivers. In: State and pressures of the marine and coastalMediterranean environment. Environmental Assessment series, No. 5, 137 pages.
El Agbani, M.A., Dakki, M. et Bayed, A. 1998 Elaboration d'un programme de suivi écologiquede Merja Zerga. Rap. MedWet, 35 pages.
Estournel, C., Durrieu de Madron, X., Marsaleix, P., Auclair, F., Julliand, C. and Vehil, R.Observation and modelisation of the winter coastal oceanic circulation in the Gulf ofLions under wind conditions influenced by the continental orography (FETCHexperiment). Journal of Geophysical Research (submitted).
Gargett, A.E., 1984 Vertical eddy diffusivity in the ocean interior. Journal of Marine Research42, 359-393.
Garkavaya, G.P., Bogatova, Yu.I., Berlinskii, N.A. and Goncharov, A.Yu. 2000 Regionalsegmentation of Ukrainian sector of the north-western part of the Black Sea (onhydrophysical and hydrochemical parameters). Pages 9-24 in Ivanov, V.A. (Chief Ed.):Ecological safety of the coastal and shelf zones and complex use of the shelf resources:Collected papers. NASU, MHI, IBSS, Sevastopol, 461 pages. (in Russian).
Giordani, G., Azzoni, R., Bartoli, M. and Viaroli, P. 1997 Seasonal variations of sulphatereduction rates, sulphur pools and iron availability in the sediment of a dystrophic lagoon(Sacca di Goro, Italy). Water, Air and Soil Pollution 99:363-371.
Giordani, G., Bartoli, M., Cattadori, M. and Viaroli, P. 1996 Sulphide release from anoxicsediments in relation to iron availability and organic matter recalcitrance and its effectson inorganic phosphorus recycling. Hydrobiologia 329:211-222.
Golterman, HL. 1995 The labyrinth of nutrient cycles and buffers in wetlands: results based onresearch in the Camargue (southern France). Hydrobiologia 315: 39-58.
Gordon, D.C. Jr., Boudreau, P.R., Mann, K.H., Ong, J.E., Silvert, W.L., Smith, S.V.,Wattayakorn, G., Wulff, F. and Yanagi, T. 1996 LOICZ Biogeochemical ModellingGuidelines. Loicz Reports & Studies N° 5, Second Edition, Loicz, Texel, TheNetherlands, vi+96 pages.
Gubanov,V.I., Monina, T.L, Andryushchenko, B.F, Ryabinin, A.I, Sotnikova, A.G. and Shibaeva,S.A. 1995 Chemical condition and contamination of the Dnieper–Bug freshwater lagoonwater. Pages 55-64 in Eremeev V.N. (Chief Ed): Investigations of the Shelf Zone of theAzov-Black Sea Basin: Collected papers. NASU, MHI, Sevastopol, 185 pages (inRussian).
Guerzoni, S., Chester, R., Dulac, F., Herut, B., Loÿe-Pilot, M.D., Measures, C., Migon, C.,Molinaroli, E., Moulin C., Rossini, P., Saydam, C., Soudine A. and Ziveri P., 1999 Therole of atmospheric deposition in the biogeochemistry of the Mediterranean Sea.Progress in Oceanography 44:147-190.
Guerzoni, S., Cristini, A., Caboi, R., Le Bulloch, O., Marras, I. and Runeddu, L., 1995 Ioniccomposition of rainwater and atmospheric aereosol in Sardinia, Southern Mediterranean.Water, Air and Soil Pollution 85:2077-2082.
Guieu, C. 1991 Apports atmosphériques à la Méditerranée nord-occidentale. PhD thesis,University of Paris 6, France.
Heijs, S.K., Azzoni, R., Giordani, G., Jonkers, H.M., Nizzoli, D., Viaroli, P. and van Gemerden,H. 2000 Sulphide-induced release of phosphate from sediments of coastal lagoons and
�PAGE � 90
the possible relation to the disappearance of Ruppia sp. Aquatic Microbial Ecology23:85-95.
Herut, B. and Krom, M.D. 1996 Atmospheric input of nutrients and dust to the SEMediterranean. Pages 349-358 in S.Guerzoni and R.Chester (eds): Impact of desert dustacross the Mediterranean. Kluwer.
Herut, B., Krom, M.D., Pan, G. and Mortimer R. 1999 Atmospheric input of nitrogen andphosphorus to the southeast Mediterranean: Sources, fluxes and possible impact. Limnol.Oceanogr. 44(7):1683-1692.
Karageorgis, A., Anagnostou, Ch., Georgopoulos, D., Albuisson, M. 2000 Distribution ofsuspended particulate matter determined by in situ observations and satellite images inthe NW Aegean Sea (Greece). Geo-Marine Letters 20:93-100.
Karamanos, E. and Polyzonis, V. 2000 Thermaikos Gulf: the adjacent land area and itspotentiality for the fresh water sediment and pollutant supply. METRO-MED Project,Final Scientific Report, Part B: Specific Topics, pages 55-67.
Karamanos, E., Durrieu de Madron, X., Polyzonis, V., Ludwig, W. 2000 The adjacent land areaas fresh water and particulate matter contributor to the coastal zone of the Mediterraneansea: Gulf of Lions and Thermaikos Gulf. METRO-MED Project, Final Scientific Report,Part A: Synthesis, pages 10-19.
Kontoyiannis, C. and Papadopoulos, V. 2000 The seasonal characteristics of the hydrology andcirculation in the Thermaikos Gulf-Sporades Basin region of the Northwest Aegean Sea.METRO-MED Project, Final Scientific Report, Part B: Specific Topics, pages 68-83.
Kostianitsyn, M.N. 1964 Hydrology of the mouths of the Dnieper and Southern Bug rivers.Hydrometeouzdat, Moscow, 320 pages (in Russian).
Kovrigina, N.P and Kuftarkova, E.A 1997 Raspredelenie kisloroda i biogennix elementov vvodax ozera Donuzlav. Problemi oxrani truda i technogenno-ecologicheskoibezopasnosti: Trudi 5 Mezdunarodnoi nauchno-technicheskoi konferenzii Sevastopol, 6-12 Sentyabrya 1997. Sevastopol: 57-59 (in Russian).
Kovrigina, N.P. and Nemirovsky, M.S. 1999 Hydrochemical characteristic of the Lake Donuzlavwaters based on data of 1990-1997. Ecology of the Sea 48:10-14 (in Russian).
Lapointe, B., Littler, M.M. and Littler, D.S., 1992 Nutrient availability to marine macroalgae insiliciclastic versus carbonate- rich coastal waters. Estuaries 15:75-82.
Lefèvre, D., Minas, H.J., Minas, M., Robinson, C., LeB., Williams, P.J. and Woodward, E.M.S.1997 Review of gross community production, primary production, net communityproduction and dark community respiration in the Gulf of Lions. Deep-Sea Research 44(3-4):801-832.
Loÿe-Pilot, M.D., Klein, C. and Martin, J.M. 1993 Major inorganic elements in North WesternMediterranan aerosols. Concentrations and sources; estimation of dry deposition ofsoluble inorganic nitrogen. Pages 271-277 in Martin, J.M. and Barth, H. (eds.): EROS2000 (European River Ocean System) Project Fourth Workshop. Water PollutionResearch Report 30, CEC, Brussels.
Loÿe-Pilot, M.D., Martin, J.M. and Morelli, J. 1991 Atmospheric wet deposition of inorganicnitrogen to the North Western Mediterranean Basin. Pages 623-634 in: Martin, J.M. andBarth, H. (eds): EROS 2000 (European River Ocean System) Project Second Workshop.Water Pollution Research report 20, CEC, Brussels.
MEPNSU (Ministry for the Environmental Protection and Nuclear Safety of Ukraine) 1999 Stateof the Environment in Ukraine. Report. Website: www.freenet.kiev.ua .
Milan, C. 1999 Indagini in Sacca di Goro per valutare gli effetti prodotti dagli eventi alluvionaledel Novembre 1994. Relazione sull’attività di monitoragio chimico e microbiologico(1997-1998). ARPA.
�PAGE � 91
Millot, C. 1990 The Gulf of Lions’ hydrodynamics. Continental Shelf Research 10:885-894.Minas, M. and Minas, H.J. 1989 Primary production in the Gulf of Lions with considerations to
the Rhone River input. Water Pollution Research Reports 13:112-125.Okubo, A. 1971 Oceanic diffusion diagrams. Deep-Sea Res. 18:789-802.Padilla, J., Castro, L., Morales, A. and Naz, C. 1997 Evaluation of economy-environment
interactions in the Lingayen Gulf Basin: A partial area-based environmental accountingapproach. DENR and USAID, Philippines.
Pagou, K. and Gotsis-Skretas, O. 1989 Phytoplankton. In: A. Bousoulengas & A.V. Catsiki(eds): Pollution research and monitoring programme in the Aegean and Ionian Seas.National Centre for Marine Research, Athens, Hellas, Technical Report (1986-87), pages128-156.
Pagou, K., Assimakopoulou, G., Krasakopoulou, E., Pavlidou, A. and Giannakourou, A., 2000aBiological production variability in relation to nutrients input and dispersion in aMediterranean marine coastal environment (Thermaikos Gulf, NW Aegean Sea).METRO-MED Project, Final Scientific Report, Part B: Specific Topics, pages 127-131.
Pagou, K., Assimakopoulou, G., Krasakopoulou, E. and Pavlidou, A. 2000b Nutrient input,fluxes and cycling in relation to the biological production in Mediterranean ecosystemsinfluenced by river discharges: Thermaikos Gulf. METRO-MED Project, Final ScientificReport, Part A: Synthesis, pages 50-81.
Piccoli, F. 1998 Passato e presente della vegetazione delle Valli di Comacchio. Laguna suppl.5/98:24-27.
Pinazo, C., Marsaleix, P., Millet, B., Estournel, C. and Vehil, R. 1996 Coupled modelling ofphysical and biogeochemical proceses in the Gulf of Lions (northwestern Mediterranean):spatial and temporal variability. Journal of Marine Systems 7:161-191.
Polat, C. and Turgul, S. 1996 Chemical exchange between the Mediterranean and the Black Seavia the Turkish Straits. Bulletin de l’Institut oceanographique Monaco, no special 17,CIESM Science Series no 2:167-186.
Poulos, S.E., Drakopoulos, P.G. and Collins, M.B. 1997 Seasonal variability in sea surfaceoceanographic conditions in the Aegean Sea (eastern Mediterranean): an overview.Journal of Marine Systems 13:225-244.
Raimbault, P. (ed.) 2000 MOOGLI, MOdelisation et Observation du Golfe du LIon. Recueil dedonnées. Laboratoire d'Océanographie et de Biogéochimie, Université d'Aix-MarseilleII, 271 pages.
Redfield, A.C, Ketchum, B.H. and Richards, F.A. 1963 The influence of organisms on thecomposition of seawater. Pages 26-49 in Hill, M.N. (Ed): The Sea, ideas andobservations on progress in the study of the seas. Interscience Publ. New York.
Regione Emilia Romagna. Eutrofizzazione delle acque costiere dell'Emilia-Romagna. RapportiAnnuali 1984-1998. Assessorato Ambiente, Studi e documentazione. BattelloOceanografico Daphne, ARPA Cesenatico.
Ridame, C., and Guieu, C. Saharan input of phosphorus to the oligotrophic water of the openwestern Mediterranean. Limnology and Oceanography (submitted).
Ryabinin, A.I. (ed.) 1999 Ezegodnik kachestva morskix vod po gidrohimicheskim pokazatelyam1998g. Chernoe more, Sevastopol (in Russian).
Ryabinin, A.I. (ed.) 2000 Ezegodnik kachestva morskix vod po gidrohimicheskim pokazatelyam1999g. Chernoe more, Sevastopol (in Russian)
Ryasinceva, N.I, Savin, P.T., Sarkisova S.A., Bogatova Yu. I., Nikanorov, V.A., Docenko S.A.2000 Sovremennoye sostoyanie ecosistemi Adzalikskogo limana. Pages 114-126 inIvanov V.A. (Chief Ed): Ecological safety of the coastal and shelf zones and complex useof the shelf resources: Collected papers. NASU, MHI, IBSS., Sevastopol, 461 pages. (inRussian).
�PAGE � 92
San Diego-McGlone, M.L., Jacinto, G.S., Dupra, V.C., Narcise, I.S., Padayao, D.O. andVelasquez I.B. 1999 A comparison of nutrient characteristics and primary productivity inthe Sulu Sea and South China Sea. Acta Oceanographica Taiwanica 37(3):219-229.
San Diego-McGlone, M.L., Smith, S.V. and Nicolas, V. 2000 Stoichiometric interpretation ofC:N:P ratios in organic waste material. Marine Pollution Bulletin 40:325-330.
Sempéré, R., Charrière, B., Van Wambeke F. and Cauwet, G. 2000 Carbon inputs of the RhôneRiver to the Mediterranean Sea: Biogeochemical implications. Global BiogeochemicalCycles 14:669-681.
Shulgina, E.F. 1966 Izmeneniya v gidrochimicheskom regime ozera Donuzlav posle soedineniyaego s morem. Pages 11-19 in Sbornik rabot basseinovoi gidrometeorologicheskoiobservatorii Chernogo i Azovskogo morei. Leningrad (in Russian).
Simeoni, U., Fontolan, G. and Ciavola, P. 2000 Morfodinamica delle bocche lagunari della Saccadi Goro. Studi Costieri 2: 123-138.
Siokou-Frangou, I., Bianchi, M., Christaki, U., Christou, E., Giannakourou, A., Gotsis, O.,Ignatiades, I., Pagou, K., Pitta, P., Psarra, S., Souvermezoglou, E., Van Wambeke, F. andZervakis, V. 2001 Organic carbon partitioning and carbon flow along a gradient ofoligotrophy in the Aegean Sea (Mediterranean Sea). Journal of Marine Systems (inpress).
Siokou-Frangou, I., Pancucci-Papadopoulou, M.I. and Christou, E., 1994 Sur la repartition duplankton superficiel des mers entourant la Grece (Printemps 1987). Biologia Gallo-Hellenica 21:313-330.
Socal, G., Boldrin, A., Bianchi, F., Civitarese, G., De Lazzari, A., Rabitti, S., Totti, C. andTurchetto, M.M. 1999 Nutrient, particulate matter and phytoplankton variability in thephotic layer of the Otranto Strait. Journal of Marine Systems 20:381-398.
Sogreah 1974 Laguna de Bay Water Resources Development Study. Laguna Lake DevelopmentAuthority, Pasig City, Philippines.
Sorokin, Yu.I., Sorokin, P.Yu. and Gnes, A. 1996 Structure and functioning of theanthropogenically transformed Comacchio lagoonal ecosystem (Ferrara, Italy). Mar.Ecol. Prog. Ser. 133:57-71.
Souvermezoglou E. and Krasakopoulou, E. 1999 Evolution of oxygen and nutrientconcentrations in the deep basins of the northern Aegean Sea. 4th MTP Workshop, 28-30October 1999, Perpignan, France, pp. 150-151.
Tolmazin, D. 1985 Changing coastal oceanography of the Black Sea. I: The north-western shelf.Progress in Oceanography 15:217-276.
Tursi 1989 Caratteristiche ecologiche dei Laghi Alimini. Nova Thalassia 10:53-73.Tusseau-Vuillemin, M.H., Mortier, L., Herbaut, C. 1998 Modeling nitrate fluxes in an open
coastal environment (Gulf of Lions): transport versus biogeochemical processes. Journalof Geophysical Research 103 (C4):7693-7708.
�PAGE � 93
Unluata, U., Oguz, T., Latif, M.A. and Ozsoy, E. 1990 On the physical oceanography of theTurkish straits. Pages 25-60 in: L.J. Pratt (ed.): The Physical Oceanography of SeaStraits. Kluwer, Dordrecht.
Viaroli, P., Bartoli, M., Bondavalli, C., Christian, R.R., Giordani, G. and Naldi, M. 1996aMacrophyte communities and their impact on benthic fluxes of oxygen, sulphide andnutrients in shallow eutrophic environments. Hydrobiologia 329:105-119.
Viaroli, P., Naldi, M, Bondavalli, C. and Bencivelli, S. 1996b Growth of the seaweed Ulva rigidaC. Agardh in relation to biomass densities, internal nutrient pools and external nutrientsupply in the Sacca di Goro (Northern Italy). Hydrobiologia 329:93-103.
Viaroli, P., Azzoni, R., Bartoli, M., Giordani, G. and Taje’, L. 2001 Evolution of the trophicconditions and dystrophic outbreaks in the Sacca di Goro lagoon (Northern Adriatic Sea).Chapter 56, pages 443-451 in F.M. Faranda, L. Guglielmo, G. Spezie (eds): Structure andprocesses in the Mediterranean ecosystems. Springer Verlag Italia, Milano.
Vincenzi, D. 1995 Caratterizzazione idrologica ed idrogeologica dell’area delle Valli diComacchio, Bilancio Idrologico. Report ENEA.
Webster, I.T., Parslow, J.S. and Smith S.V. 2000 Implication of spatial and temporal variationfor LOICZ biogeochemical budgets. Appendix III in Smith S.V. and Crossland C.J. (eds):Australasian estuarine systems: carbon, nitrogen and phosphorus fluxes. LOICZ Reportsand Studies No. 12, LOICZ, Texel, The Netherlands, ii+182 pages.
Welsh, D.T. 2000 Nitrogen fixation in sea grass meadows: regulation, plant-bacteria interactionsand significance to primary productivity. Ecology Letters 3: 58-71.
World Bank. 1993 Environmental Sector Study. Towards Improved Management ofEnvironmental Impacts. Washington, D.C., USA.
Wulff, F. and Yanagi, T. 1996 LOICZ Biogeochemical Modelling Guidelines. LOICZ Reports &Studies No. 5, LOICZ, Texel, The Netherlands, 96 pages.
Yanagi, T. 2000 A simple method for estimating VX from mixing equations in a 1-dimensional,steady-state system for LOICZ biogeochemical modeling. In Dupra, V., Smith, S.V.,Marshall Crossland, J.I. and Crossland, C.J. (eds) Estuarine systems of the East Asiaregion: carbon, nitrogen and phosphorus fluxes. LOICZ Reports and Studies No. 16,LOICZ, Texel, The Netherlands, 127 pages.
Yanagi, T. 2000 Coastal Oceanography. Kluwer Publishers, Dordrecht.Zaitsev, Yu.P. 1993 Impact of eutrophication on the Black Sea fauna. Studies and Reviews,
General Fisheries Council for the Mediterranean 64, part 2, FAO, Rome, pages 59-86.Zarzozo, A. 1982 Hydrodynamique de la lagune de Moulay Bousselham (Merja Zerga), Maroc.
Bull. Inst. Pêches. Marit. 36, 22 pages.Zervakis, V., Georgopoulos, D. and Papadopoulos, V. 1998 Seasonal variations of physical
parameters in North Aegean Sea. In: INTERREG project, First scientific report (inGreek).
Zuev, G.V. and Boltachev, A.R. 1999 Influence of underwater quarrying of sand on theDonuzlav estuary ecosystem. Ecology of the Sea 48:5-9 (in Russian).
89
Appendix I Workshop Report
Welcome
Participants (Appendix II) were welcomed to the workshop venue at the National Centre for MarineResearch, Athens Greece by the Director of the Institute of Marine Biological Resources, Dr K.Papakonstantinou, and local coordinator, Dr Christos Anagnostou. Support arrangements and thepurpose of the workshop were outlined. The agenda (Appendix III) was introduced and workingdocuments, diskettes and CD-ROMs of support and tutorial materials were distributed to participants.
Introduction and Biogeochemical TutorialsAn introduction to the LOICZ Core Project of IGBP by Dr Chris Crossland provided a context of goalsand approaches being undertaken to describe global changes in materials fluxes in the coastal zone, anda framework for the workshop activities. The EU ELOISE program was reviewed in the context of theLOICZ project. A comprehensive description of the LOICZ biogeochemical budgeting approach byProf. Fred Wulff, and the planned interpolation of local scaled information to global scales withinLOICZ and to regional scales within ELOISE gave a foundation for the workshop enterprise. Adetailed tutorial addressed key elements and tools available to researchers for the derivation of C-N-Pbudget models and estimation of net metabolism of coastal systems. These included:
♦ Biogeochemical budget construction and calculations (Vilma Dupra). A short manual on budgetcalculations was distributed;
♦ LOICZ Biogeochemical Budgets and Models web-site contents and development (Dennis Swaney);♦ Introduction and description of a tool developed for use in site nutrient budget calculation –
CABARET software (Dr Laura David). Diskette copies of the software were provided to allworkshop participants; and
♦ Waste load estimation and relationships and river discharge calculation were described (Dr LauraDavid). Relevant software was distributed. It was noted that the tool for river discharge calculationfrom known rainfall in a watershed had been developed for tropical regions and the workshopprovided opportunity to consider modifications incorporating snow and ice melt parameters.Similarly, the spreadsheet for waste load calculations could be modified to include known retentioncoefficients for the system.
An overview of historical and recent programs of nutrient research and budget development for theBlack Sea was presented by Prof. Ilkay Salihoglu. The extensive data bases and the 5-year NATO-sponsored program were described, noting the availability of data in electronic form. The last whole-budget estimate for the Black Sea was developed in 1985, before the more recent field campaigns.
Presentation of Site Biogeochemical BudgetsThe preliminary biogeochemical budgets brought by the participants for regional sites were brieflypresented and discussed. Key points included system settings, box arrays needed to encompass thesites, data availability and quality, and key features about the socio-economic settings and changes.
System sites included:
SpainPalmones River estuaryRio Pontia (NW Spain, Atlantic coast)
FranceGulf of Lions
MoroccoSebou River estuary (Atlantic coast)Nador Lagoon (Mediterranean coast)
90
ItalySacca di Goro Lagoon, northern Adriatic coastValli di Comacchio Lagoon, northern Adriatic coastVenice Lagoon, Adriatic coastS’Ena Arrubbia, Sardinia
GreeceNE Aegean Sea (west of Dardanelles)NW Aegean Sea (Thermaikos Gulf and Sporades Basin)
Black Sea regionsDnieper Bay estuarySevastapol Bay systemVarna Bay (NW Black Sea)Bourgas Bay (NW Black Sea)
[Additional budgets were developed by Inna Yurkova, Ukraine, who was awarded the LOICZ UNEPRegional Workshop Scholarship at the University of Stockholm working with Prof. Fred Wulff.]
Biogeochemical Budgets DevelopmentBreak-out groups worked interactively on the development of the coastal and regional seas systems,supplemented with methodological and site/issue tutorials and discussions. Estimates for sites andevolution of assessment approaches were made and budget refinements emerged from resolution oftechniques, application of derivative data and assessment of estuarine mixing/exchange and watershedinformation.
A template for publication in the workshop report and for posting of site budgets to the LOICZ web-sitewere distributed and discussed.
Regional Scaling and ELOISE SynthesisDr Nicholas Murray provided an overview of the status of the EU ELOISE program, the role of theJoint Research Centre and a consideration of the ELOISE imperative for synthesis and integration of theELOISE project results.
The ELOISE program is a European coastal zone cluster of research projects (a cluster or programaddressing European Land Ocean Interactions), currently including active and completed projectsfunded by the European Community. The coastal zone cluster includes thematic issues:• Ecosystem processes• Physical coastal processes, and• Integrated river basin or coastal zone demonstration sites.
Strands of activities address:• Significant coastal seas in a global context,• Human impacts on coastal seas,• Socio-economic development associated with coastal seas, and• Methodologies and implementation of ELOISE in support of policy.
The 30 continuing/completed and 18 new projects in 2001 have been run in a collaborative butrelatively ad hoc family of activities, until the recent support provided to the Co-ordination Office.
91
A key policy area relevant to ELOISE is the European Watershed-Coastal Zone Integrated Study (EUWater Framework) aiming for clean water status in the EU by 2015, including inland waters and thecoastal zone. Member states are to have implementation plans within six years and will depend on asynthesis of scientific information to underpin these plans; the lack of common methodologies makescomparison of approaches difficult. Development of effective and common methods for measurementand assessment could provide a vital plank.
The LOICZ comparative approach (using common methods) can contribute to this wider initiative inscience. The first-order biogeochemical budget approach allows C-N-P comparisons between sites andcould assist bench-marking throughout the EU region. Simple, robust approaches provide value forpolicy relationships; higher-order models and budgets based on an array of variables are often non-transportable between sites and, while vital for local scale management and options for development, donot allow wider regional comparisons. Similarly, the LOICZ typology approach contains a frameworkfor data/process comparisons across scales, and could be applied along with other classificationapproaches.
The participants discussed various merits and concepts for regional comparison, particularly aimed atderiving scientific assessments linking science information (quality, quantity, visualisation) to thepolicy arena. A joint ELOISE-LOICZ Workshop was proposed, to develop very detailed CNP fluxbudgets for the whole of peninsular Italy, a data rich area, and to use the same format to develop aMediterranean basin-wide estimate. ELOISE projects can provide input and good high resolution datafor use to strengthen the link between CNP flux estimates and the LOICZ clustering methodology.
The workshop supported the suggestion that an expert working group should investigate the use of thecombined biogeochemical-typology approach with results and information from the key ELOISEprojects, and this would be most appropriately led and managed by the JRC Co-ordination Office.Further the workshop suggested that opportunity should be taken to further develop this action duringthe ELOISE Annual Meeting scheduled for September 2001; a topical workshop could be a useful wayto proceed following wider discussion at the Meeting. It was recognised that this action could not leadto benefit for the EU initiatives, but would be of benefit to LOICZ in its global assessment of coastalchanges in material fluxes, contributing from a rich data region to interpretation of net coastal systemmetabolism outcomes.
The LOICZ Typology and LOICZView tool was demonstrated by Dennis Swaney, and included:• An overview of the approach and its purpose,• Examples of initial applications and use of proxy variables, and• A hands-on demonstration of constructing a typology to meet a specific objective or set of
questions.
Outcomes and Wrap-upBudgets for most identified systems were developed to interim draft stage of completion during theworkshop; in some cases, partial budgets (e.g., salt and water) were prepared and additional data was tobe included in finalised site budgets following the workshop. Text additions and checks on data sourceswere required for completion of most budgets manuscripts. A schedule for contribution of finaldocuments, report and publication, along with the process for review and editing was agreed, notingthat hard-copy reports, web-posting and CD-ROM products are planned.
Members of the Project steering committee met informally during the workshop to plan content andprograms for further workshops, and to review and finalise arrangements for preparation andpublication of tutorial and archival materials.
The participants joined with LOICZ in expressing thanks to Dr Christos Anagnostou and his organisingteam at the National Centre for Marine Research for the excellent support and hosting of the workshopin Athens. The financial support of the European Union and the Global Environment Facility wasgratefully acknowledged.
92
Appendix II Participants and Contributing Authors
Workshop Participants
GREECEDr Christos Anagnostou – Local HostInstitute of OceanographyNational Centre for Marine Research16604 Aghios Kosmas, HellinikoGREECEtel.: +30-1-9653304fax: 30-1-9653522e-mail: [email protected]
Dr Kalliopi PagouNational Centre for Marine ResearchInstitute of OceanographyAghios Kosmas - EllinikonGR-16604, AthensGREECEPhone: +30 1 9653520Fax: +30 1 9653522Email: [email protected]
Evangelia KrasakopoulouInstitute of OceanographyNational Centre for Marine Research16604 Aghios Kosmas, HellinikoGREECEtel.: +30-1-9653520fax: +30-1-9653522e-mail: [email protected]
ITALYDr Pierluigi ViaroliUniversità degli Studi di ParmaDipartimento di Scienze AmbientaliParco Area della Scienze 33A43100 ParmaITALYPhone: +39 0521 905683Fax: +39 0521 90 54 02Email: [email protected]
Dr Gianmarco GiordaniDipartimento di Scienze Ambientali, Universitàdi ParmaParco Area delle Scienze 33/A43100 ParmaITALYPhone: +39 0521 905976Fax: +39 0521 905402
Dr Flaviano CollaviniNational Council of ResearchISDGM InstituteS. Polo, 1364-30125 VeniceITALYPhone: +39-041-5216880Fax: +39-041-5216815E-mail: [email protected]
FRANCEDr Xavier Durrieu de MadronCEFREMCNRS Universite de Perpignan52 Avenue de VilleneuveF-66860 Perpignan CedexFRANCEPhone: +33 468662091Fax: +33 468662096Email: [email protected]
MOROCCOProf. Maria SnoussiUniversité Mohamed VFaculté des SciencesDépartement des Science de la TerreB.P. 1014 RabatMOROCCOPhone: +212 3 7 77 19 57Fax: +212 3 7 77 19 57Email: [email protected]
93
SPAINDr F.X. NiellDepartamento de EcologiaUniversidad de Malaga29071 MalagaSPAINPhone: +34952/31852/44Fax: +34-5-2132000Email: [email protected]
TURKEYDr Suleyman TugrulInstitute of Marine SciencesMiddle East Technical University (IMS-METU)PO Box 28Erdemli 33731, IcelTURKEYPhone: +90 324 5212406/-5212150Fax: +90 324 521 2327Email: [email protected]
Dr Sukru BesiktepeInstitute of Marine SciencesMiddle East Technical University (IMS-METU)PO Box 28Erdemli 33731, IcelTURKEYPhone: +90 324 5212406/-5212150Fax: +90 324 521 2327Email: [email protected]
Prof. Ilkay SalihogluInstitute of Marine SciencesMiddle East Technical University (IMS-METU)PO Box 28Erdemli 33731Icel, TurkeyPhone: +90 324 521 2150 (w)Fax: +90 324 521 2327Email: [email protected]
UKRAINEInna YurkovaMarine Hydrophysical InstituteNational Academy of Sciences of UkraineKapitanskaya st 2Sevastopol 99011Tel.: +38 (0) 692 72 22 75Fax: +38 (0) 692 55 42 53Email: [email protected]
Resource PersonsProf. Fred V. WulffDepartment of Systems EcologyUniversity of StockholmS-106 91 StockholmSwedenPhone: +46 8 16 42 50Fax: +46 8 15 84 17E-mail: [email protected]
Dennis SwaneyBoyce Thompson Institute for Plant ResearchTower Rd, Cornell UniversityIthaca, New York 14853USAPhone: +1 607 254 1368E-mail: [email protected]
Dr Laura DavidMarine Science InstituteCollege of ScienceUniversity of the PhilippinesRoces Ave, Diliman, Quezon CityPhilippinesPhone: +63-2 922 3959; 63-2 922-3944Fax: +63-2 924 7678; 63-2 924-3735E-mail: [email protected]
Vilma DupraDepartment of OceanographyUniversity of Hawaii1000 Pope Rd.Honolulu, Hawaii 96822USAPhone: +1 808 956 2354Fax: +1 808 956 7112E-mail: [email protected]
Dr Chris CrosslandLOICZ Executive OfficerNetherlands Institute for Sea Research (NIOZ)P.O. Box 591790 AB Den Burg, TexelThe NetherlandsPhone: +31 222 369404Fax: +31-222 369430E-mail: ([email protected] or [email protected])
Dr Hartwig KremerLOICZ Deputy Executive OfficerNetherlands Institute for Sea Research (NIOZ)P. O. Box 591790 AB Den Burg, TexelThe NetherlandsPhone: +31 222 369404
ObserversDr. S. Colpan Polat-BekenMED POL Programme OfficerUNEP/MAPVassileos Konstantinou, 4811635 Athens, GreecePhone: +301 7273132Fax: +301 7253196/7E-mail: [email protected]
Dr Nicholas MurrayELOISE Project OfficeEnvironment InstituteJoint Research Centre21020 Ispra (VA), ItalyPhone: +39 0332 785591Fax: +39 0332 789793E-mail: [email protected]
Contributing authorsItalyMaria Rosaria VadrucciDipartimento di Scienze e TecnologieBiologiche ed Ambientali,Università degli Studi di Lecce73100 Lecce, ItalyPhone: +39-832-320604Fax: +39-832-320722Email: [email protected]
Annita FioccaDipartimento di Scienze e TecnologieBiologiche ed Ambientali,Università degli Studi di Lecce73100 Lecce, ItalyPhone: +39-832-320600Fax: +39-832-320722Email [email protected]
Ornella NegroDipartimento di Scienze e TecnologieBiologiche ed AmbientaliUniversità degli Studi di Lecce73100 Lecce, ItalyPhone: +39-832-320606Fax: +39-832-320722
Franca SangiorgioDipartimento di Scienze e TecnologieBiologiche ed Ambientali
Università degli Studi di Lecce73100 Lecce, ItalyPhone: +39-832-320604Fax: +39-832-320722Email: [email protected]
Angelica SemeraroDipartimento di Scienze e TecnologieBiologiche ed AmbientaliUniversità degli Studi di Lecce73100 Lecce, ItalyPhone: +39-832-320600Fax: +39-832-320722
Alberto BassetDipartimento di Scienze e TecnologieBiologiche ed AmbientaliUniversità degliStudi di Lecce –73100 Lecce, Italy –Phone/fax +39-832-320722Email: [email protected]
Giovanni De FalcoIstituto di Cibernetica e Biofisica, CNR,Sezione di Oristano, Località SaMardini, 09072,Torregrande Oristano, Italy.Phone +39 783 22027Fax +39 783 22002Email [email protected]
Maura BaroliInternational Marine Centre, Località SaMardini, 09072, TorregrandeOristano (Italy).Phone +39 783 22027Fax +39 783 22002Email [email protected]
Elena CattaneoEnvironment InstituteJoint Research Centre21020 Ispra (VA), ItalyPhone: +39 0332 789202Fax: +39 0332 789328Email: [email protected]
J. M. ZaldivarEnvironment InstituteJoint Research Centre21020 Ispra (VA), ItalyPhone: +39 0332 789202Fax: +39 0332 789328Email: [email protected]
95
Dr. Stefano GuerzoniMarine Geology Institute -CNRvia Gobetti,10140129 Bologna, Italytel +39 51 6398891fax.+39 51 [email protected]
FranceLionel DenisUniversité des Sciences et Technologies deLille 1Station Marine de Wimereux28, Avenue FochBP 8062930 Wimereux, Francephone: +33 3 21 99 29 04fax: +33 3 21 99 29 01
Frédérique DiazLaboratoire d'Océanographie et deBiogéochimieCentre d'Océanologie de MarseilleCampus de Luminy163 avenue de Luminy13288 Marseille cedex 09, Francephone: + 33 4 91 82 91 05fax: + 33 4 91 82 19 91email: [email protected]
Nicole GarciaLaboratoire d'Océanographie et deBiogéochimieCentre d'Océanologie de MarseilleCampus de Luminy163 avenue de Luminy13288 Marseille cedex 09, Francephone: + 33 4 91 82 95 60fax: + 33 4 91 82 19 91email: [email protected]
Cécile GuieuLaboratoire d'Océanographie de VillefrancheObservatoire OcéanologiqueQuai de la DarseBP 08 06238 Villefranche-sur-MerFrancetel. 0(4) 93 76 37 24fax. 0(4) 93 76 37 39email: [email protected]
Christian GrenzLaboratoire d'Océanographie et deBiogéochimie
Centre d'Océanologie de MarseilleStation Marine EndoumeRue de la Batterie des Lions13007 Marseille, Francephone: + 33 4 91 04 16 41fax: + 33 4 91 04 16 35email: [email protected]
Marie Dominique Loye-PilotInstitut de Biogéochimie MarineEcole Normale Supérieure1 rue Maurice Arnoux92120 Montrouge, FrancePhone: 33 (0)1 47 35 30 89fax: 33 (0)1 46 57 04 97email: [email protected]
Wolfgang LudwigCentre de Formation et de Recherche surL'Environnement MarinUniversité de Perpignan52 avenue de Villeneuve66860 Perpignan Cedex, Francephone: +33 4 68 66 20 93fax: +33 4 68 66 20 96email: [email protected]
Thierry MoutinLaboratoire d'Océanographie et deBiogéochimieCentre d'Océanologie de MarseilleCampus de Luminy163 avenue de Luminy13288 Marseille cedex 09, Francephone: + 33 4 91 82 95 60fax: + 33 4 91 82 19 91email: [email protected]
Patrick RaimbaultLaboratoire d'Océanographie et deBiogéochimieCentre d'Océanologie de MarseilleCampus de Luminy163 avenue de Luminy13288 Marseille cedex 09, Francephone: + 33 4 91 82 91 05fax: + 33 4 91 82 19 91email: [email protected]
96
GreeceVassilis ZervakisInstitute of OceanographyNational Centre for Marine Research16604 Aghios Kosmas, HellinikoGREECEtel.: +30-1-9946161fax: +30-1-9946162e-mail: [email protected]
Ekaterini SouvermezoglouInstitute of OceanographyNational Centre for Marine Research16604 - Aghios Kosmas, Helliniko - GREECEtel.: +30-1-9653520fax: +30-1-9653522e-mail: [email protected]
Dimitris GeorgopoulosInstitute of OceanographyNational Centre for Marine Research16604 - Aghios Kosmas, Helliniko - GREECEtel.: +30-1-9815703fax: +30-1-9833095e-mail: [email protected]
Alexandra PavlidouInstitute of OceanographyNational Centre for Marine Research16604 - Aghios Kosmas, Helliniko - GREECEtel.: +30-1-9653520fax: +30-1-9653522e-mail: [email protected]
Georgia AssimakopoulouInstitute of OceanographyNational Centre for Marine Research16604 - Aghios Kosmas, Helliniko - GREECEtel.: +30-1-9653520fax: +30-1-9653522e-mail: [email protected]
Harilaos KontoyiannisInstitute of OceanographyNational Centre for Marine Research16604 - Aghios Kosmas, Helliniko - GREECEtel.: +30-1-9815703fax: +30-1-9833095e-mail: [email protected]
MoroccoLacen OuaknineUniversity Mohamed V, Faculty of SciencesDepartment of Earth Sciences, B.P. 1014RabatMOROCCOPhone: +212-3-7771957Fax: +212-3-7771957Email: [email protected]
97
Appendix III Workshop Agenda
LOICZ/ELOISE/UNEP WORKSHOP ON ESTUARINE SYSTEMS OF THEMEDITERRANEAN AND BLACK SEA REGION
National Centre for Marine ResearchInstitute of Oceanography, Athens Greece
5-8 February 2001
Monday, 4 February0900 Welcome and announcements – Christos Anagnostou
Introduction of participants0930 Introduction to LOICZ and IGBP – Chris Crossland1000 Introduction to LOICZ budgeting approach and project overview – Fred Wulff1030 Biogeochemical budgets calculation and web information – Vilma Dupra1115 Typology and scaling in LOICZ – Dennis Swaney1145 Outline of the LOICZ biogeochemical budgets web-site – Dennis Swaney
Discussion1230 Lunch1330 Tools: Presentation of CABARET budgeting software – Laura David1400 Tools: Calculation of river discharge values – Laura David1415 Tools: Calculation of waste loads – Laura David1430 Participant presentation of sites and preliminary budgets1700 Session close
Tuesday, 6 February0900 Plenary discussion of continuing work plan and resource person collaborations.0930 Break-out groups working on site budget preparation.1230 Lunch1330 Plenary discussion of status of work and problems1345 Break-out groups resume work on budget derivation1700 Plenary review of status of work for evening continuation
Wednesday, 7 February0900 Break out groups continue1115 Budgets presentations by participants1230 Lunch1330 Budget presentations continued
Identification of additional sites for budget estimates1630 Synthesis and wrap-up session, and discussion of future activities of the group1700 Budgeting workshop close
Thursday, 8 February0900 Introduction to ELOISE – regional projects and needs for integration and regional
synthesis, Nick Murray0915 The LOICZ Typology and LOICZ – VIEW as tool for regional integration and
upscaling - demonstration and discussion, Dennis Swaney1100 Continued discussion: on integration of regional ELOISE biogeochemical project
results• ELOISE as a synthesising approach (comparability of results)• The role of LOICZ in regional synthesis• The role of typology
1200 Conclusions and final closure of the meeting
98
Appendix IV Terms of Reference
LOICZ/ELOISE/UNEP Workshop on Estuarine SystemsOf The Mediterranean and Black Sea Region
National Centre for Marine ResearchInstitute of Oceanography
Athens Greece5-8 February 2001
Primary Goal:To work with researchers dealing with estuarine systems of the Mediterranean and Black Sea region, inorder to extract C,N,P budgetary information from as many systems as feasible from existing data, inorder to build a comparative regional picture of material fluxes and processes. The Mediterranean andBlack Sea systems include one of the major coastal regions of the world oceans and are heavilyinfluenced by anthropogenic activity. The workshop provides an opportunity to characterizeterrigenous inputs to the estuaries of the region, and outputs from the estuaries - hence the net role ofthe estuarine zone of this region as a source or sink for carbon, nitrogen, and phosphorus.
This workshop will complement, by the analysis of data from another important coastal region, earliersuccessful workshops:
a) LOICZ in Ensenada, Mexico, in June 1997, a second Mexican workshop in January 1999(Merida, Mexico), and an Australasian workshop (Canberra, Australia) in October 1998; andb) LOICZ-UNEP workshops on the South China Sea (Manila, Philippines) in July 1999, aSouth American workshop in November 1999 (Bahia Blanca, Argentina), a South Asiaworkshop in February 2000 (Goa, India), an East Asia workshop in Hong Kong in June 2000,and a Sub-Saharan Africa workshop in September 2000 (Zanzibar, Tanzania).
Secondary GoalTo integrate and exploit ELOISE and related research results for initiation of work to develop a firstregional synthesis and upscaling of material flux and process information, with support from the LOICZtypology approach. This work will aim to provide an integrated regional picture of environmentalchange affecting coastal biogeochemical fluxes in southern Europe and place it into the broader contextof global change in coastal zones. Here, the workshop is seen as a first step in the regional assessmentprocess and it is expected that results and subsequent work will contribute to the pole-to-pole Europe-Africa typological assessment of material fluxes and their change, to be addressed at a thematic LOICZ-UNEP workshop in July 2001.
It is hoped that each workshop participant will be able to bring the available data for at least twoestuarine/coastal sea site budgets: One from a "pollution hot spot" region within their country orELOISE research focal point, and one for a physiographically fairly similar region which is apparentlysubjected to less pollution. By this strategy, we hope to compile a set of sites that will represent arelatively wide range of human pressures in the Mediterranean and Black Sea region.
Anticipated Products:1. Develop budgets for as many systems as feasible during the workshop.2. Examine other additional data, brought by the researchers, or provided in advance, to
scope out how may additional systems can be budgeted over an additional 2 months.3. Prepare a technical report and a CD-ROM summarizing this information, contributing
to LOICZ/ELOISE/UNEP enterprise.4. Contribution of these regional integrated site analyses to 1-2 papers to be published in
the refereed scientific literature.
Participation:The number of participants will be limited to fewer than 20 persons, to allow the active involvement ofall participants. Nominees include:
99
• Up to 16 researchers from the region;• Resource persons.
Workplan:Participants will be expected to come prepared to participate in discussions on coastal nutrient budgets.Preparation should include reading the LOICZ Biogeochemical Modelling Guidelines (Gordon et al.,1996), the Mexican Lagoons Workshop Report (Smith et al. 1997), examination of the budgets andtutorials presented on the LOICZ Modelling web page (http://data.ecology.su.se/MNODE/), andarriving with preliminary budgets, electronic maps, and preliminary 1-3 page write-ups from “theirsites.” In order to be included in the workshop report, the budgets should conform as best possible tothe budgeting protocol laid out in the above documentation. Guidelines for budget preparation andwrite-ups and a tutorial package entitled CABARET can (and should) be downloaded from the LOICZModelling web site.
Further Details:At an absolute minimum, each participant is expected to arrive at the workshop (or send us in advance)the following materials:
1. A 1-3 page description of the area (see materials posted on the Web and in the variousworkshop reports) and a map of the site. These should be in electronic format.
2. Within the context of needs for the overall project, some estimate of water exchange (mostcommonly via water and salt budgets) and budgets for the dissolved inorganic nutrients,nitrogen and phosphorus, constitute the minimum useful derivations from the biogeochemicalbudgeting. Budgets of other materials, while potentially interesting for other purposes, do notsatisfy this minimum requirement. The minimum data requirements are as follows:
a. The primary seasonal pattern of the region is at least one wet season and one dry seasonper annum. Ideally, a budget for each season would be developed. If a system isvertically stratified, then a 2-layer budget is preferred over a single-layer budget. If asystem has a strong land-to-sea salinity gradient, then it is preferable to break thesystem into several boxes along its length.
b. Data requirements to construct a satisfactory water and salt budget include: salinity ofthe system and the immediately adjacent ocean, runoff, rainfall, evaporation and (iflikely to be important) inputs of other freshwater sources such as groundwater orsewage. Preferably, the salinity and freshwater inflow data are for the same timeperiod (for example, freshwater inflow data for a month or so immediately prior to theperiod of salinity measurement). In the absence of direct runoff estimates for smallcatchments, estimations can be made from a knowledge of catchment area and monthlyrainfall and air temperature for the catchment. See materials on the LOICZbiogeochemical modeling web site.
c. Data requirements for the nutrient budgets are: concentrations of dissolved nutrients(phosphate, nitrate, ammonium and, if available, dissolved organic N and P) for thesystem and the adjacent ocean, concentrations of nutrients in in-flowing river water and(if important, in groundwater) some estimate of nutrient (or at least BOD) loading fromsewage or other waste discharges. If atmospheric deposition (particularly of N) islikely to be important, an estimate of this is also useful. If direct waste loadmeasurements are not available, estimations can be made from a knowledge of theactivities contributing to the waste loads and the magnitudes of those activities. See thematerials on the web-site.
Wulff, F. and Yanagi, T. 1996 LOICZ Biogeochemical Modelling Guidelines. LOICZ Reports andStudies 5, 96 pages.
100
2. Smith, S.V., Ibarra-Obando, S., Boudreau, P.R. and Camacho-Ibar, V.F. 1997 Comparison ofCarbon, Nitrogen and Phosphorus fluxes in Mexican coastal lagoons. LOICZ Reports and Studies10, 84 pages.
3. LOICZ Modelling web page, for everyone with www access: ( http://data.ecology.su.se/MNODE/ ).
• The LOICZ web pages, including the guidelines, are frequently updated. Recent additions to thesite include several PowerPoint presentations designed to familiarize participants further with thebudgeting procedures and with an overview of the LOICZ budgeting efforts.
• A CD-ROM with the current web page will be available during the workshop.• CABARET (Computer Assisted Budget Analysis, Research, Education, and Training). A version
of this software and a PowerPoint demonstration of its use are available on the web site and updateversion will be provided at the workshop.
101
Appendix V Glossary of Abbreviations
NH4 AmmoniumNO3 NitrateDIN Dissolved inorganic nitrogenDON Dissolved organic nitrogenDIP Dissolved inorganic phosphorusDOP Dissolved organic phosphorusPTN Particulate total nitrogenPTP Particulate total phosphorusPOP Particulate organic phosphorusPON Particulate organic nitrogenON Organic nitrogenOP Organic phosphorusTN Total nitrogenTP Total phosphorusDOC Dissolved organic carbonDIC Dissolved inorganic carbonPOC Particulate organic carbonOC Organic carbonSiO4 Silicatenfix Nitrogen fixationdenit Denitrificationp Primary productionr RespirationTDN Total dissolved nitrogenTDP Total dissolved phosphorusCTD Conductivity Temperature Depth