LAND REFORM, DECENTRALIZED GOVERNANCE AND RURAL DEVELOPMENT IN WEST BENGAL 1 Pranab Bardhan 2 and Dilip Mookherjee 3 This version: May 22, 2006 Abstract Since the late 1970s the West Bengal government has implemented a comprehensive set of reforms of agrarian institutions involving land reform (land redistribution, tenancy registration) and democratic decentralization (devolution of administration of agricultural development programs to elected local governments). We evaluate the effectiveness of these reforms in promoting rural development, utilizing data collected directly from individual farms, local governments and local communities. The evidence shows that programs administered by the local governments were reasonably well-targeted to the poor, with few exceptions. Targeting improved as local elections became more contested, and deteriorated with greater socio-economic inequality. The tenancy registration program, distribution of agricultural minikits, IRDP credit, local road and irrigation programs administered by local governments had significantly positive effects on subsequent growth in farm productivity and incomes. The benefits diffused widely among farms within the village, with a bias in favor of small and marginal farmers, but did not trickle down to landless agricultural workers. 1 Prepared for the Stanford Center for International Development Conference on Challenges of Economic Policy Reform in Asia, May 31–June 3 2006. For research support we are grateful to the MacArthur Foundation Inequality Network and the National Science Foundation (Grant No. SES-0418434). Monica Parra Torrado provided outstanding research assistance; others who also contributed include Poorti Marino, Nobuo Yoshida, Alfredo Cuecuecha, Amaresh Tiwari and Satadru Bhattacharya. We are grateful to various officials of the West Bengal government for giving us access to the data; to Sankar Bhaumik and Sukanta Bhattacharya of the Department of Economics, Calcutta University who led the village survey teams; to Bhaswar Moitra and Biswajeet Chatterjee of the Department of Economics, Jadavpur University who led the teams that collected the farm data; to Indrajit Mallick and Sandip Mitra who helped us us collect other relevant data. For useful discussions and suggestions we thank Debu Bandyopadhyay, Abhijit Banerjee, Partha Chatterjee, Esther Duflo, Andy Foster, Kevin Lang and Kaivan Munshi. 2 Department of Economics, University of California, Berkeley 3 Department of Economics, Boston University 1
Transcript
LAND REFORM, DECENTRALIZED GOVERNANCE AND RURAL
DEVELOPMENT IN WEST BENGAL1
Pranab Bardhan2 and Dilip Mookherjee3
This version: May 22, 2006
Abstract
Since the late 1970s the West Bengal government has implemented a comprehensive set of reforms of
agrarian institutions involving land reform (land redistribution, tenancy registration) and democratic
decentralization (devolution of administration of agricultural development programs to elected local
governments). We evaluate the effectiveness of these reforms in promoting rural development, utilizing
data collected directly from individual farms, local governments and local communities. The evidence
shows that programs administered by the local governments were reasonably well-targeted to the poor,
with few exceptions. Targeting improved as local elections became more contested, and deteriorated
with greater socio-economic inequality. The tenancy registration program, distribution of agricultural
minikits, IRDP credit, local road and irrigation programs administered by local governments had
significantly positive effects on subsequent growth in farm productivity and incomes. The benefits
diffused widely among farms within the village, with a bias in favor of small and marginal farmers, but
did not trickle down to landless agricultural workers.
1Prepared for the Stanford Center for International Development Conference on Challenges of Economic
Policy Reform in Asia, May 31–June 3 2006. For research support we are grateful to the MacArthur
Foundation Inequality Network and the National Science Foundation (Grant No. SES-0418434). Monica
Parra Torrado provided outstanding research assistance; others who also contributed include Poorti Marino,
Nobuo Yoshida, Alfredo Cuecuecha, Amaresh Tiwari and Satadru Bhattacharya. We are grateful to various
officials of the West Bengal government for giving us access to the data; to Sankar Bhaumik and Sukanta
Bhattacharya of the Department of Economics, Calcutta University who led the village survey teams; to
Bhaswar Moitra and Biswajeet Chatterjee of the Department of Economics, Jadavpur University who led
the teams that collected the farm data; to Indrajit Mallick and Sandip Mitra who helped us us collect other
relevant data. For useful discussions and suggestions we thank Debu Bandyopadhyay, Abhijit Banerjee,
Partha Chatterjee, Esther Duflo, Andy Foster, Kevin Lang and Kaivan Munshi.2Department of Economics, University of California, Berkeley3Department of Economics, Boston University
1
1 Introduction
1.1 Background and Motivation
Two-thirds of India’s population resides in rural areas, a significant proportion in abject
poverty. An important component of Indian economic development therefore involves its
villages, embracing growth of agricultural productivity and reduction of rural poverty. While
the Green Revolution in the late 1960s and 1970s brought about impressive improvements
in productivity, its scope was limited to a few areas of the country, to a few crops, with
benefits (at least initially) limited to medium and large farmers. To a large extent, these
outcomes owed to the fact that the Green Revolution at its outset involved an intervention
that was mainly technological, rather than a reform of agrarian institutions.
Since the late 1970s, West Bengal has pursued an alternative approach to rural devel-
opment based squarely on institutional reforms, involving land reform and decentralized
governance. A Left Front government has been in power continuously since 1977 embarked
on a comprehensive program of agrarian reform. A functioning three tier system of local
governments (panchayats) elected every five years was instituted since 1978, well in ad-
vance of the 73rd and 74th Constitutional Amendments in the early 1990s which mandated
such a system throughout India. In contrast to most other states (Karnataka and Ker-
ala being notable exceptions), significant responsibilities have been devolved to the West
Bengal panchayats, including implementation of land reforms, selection of beneficiaries of
various development schemes funded by upper level governments, and administration of lo-
cal infrastructure building programs. A significant land reform program was administered
by panchayats at the block and village levels, involving implementation of land ceilings,
distribution of surplus land to the landless, registration of tenants to protect them from
eviction and enforce minimum crop shares. The magnitude of the land reform effort ex-
ceeded other Indian states by a considerable margin: e.g., Appu (1996) estimates over 6.7%
land had been redistributed in West Bengal by the early 1990s, in contrast to less than 1%
2
in most other states.4 By most accounts, these institutional reforms have transformed the
balance of economic and political power away from big landowners and state bureaucrats,
towards local governments more responsive to middle farmers and poorer sections of rural
society, owing to a combination of political ideology of the Left and compulsions of electoral
democracy.
These reforms were soon accompanied by accelerated growth in agricultural productivity,
and diffusion of high-yielding rice varieties which transformed agricultural growth rates
from one of lowest in the country in the 1970s to the highest during the 1980s (Saha and
Swaminathan (1994)). It is commonly believed that these were the result of the agrarian
reform program instituted by the Left Front (see, e.g., Lieten (1992), Sengupta and Gazdar
(1996)). Most such assessments are, however, based on post hoc ergo propter hoc reasoning,
the fact that the productivity changes closely followed the reform program.
It is important to subject such claims to detailed scrutiny, particularly since the West
Bengal experience represents an explicitly egalitarian and democratic approach to rural de-
velopment, in stark contrast to ‘Washington Consensus’ or ‘neoliberal’ policy approaches.
The common belief among economists trained in the neoclassical tradition is that redis-
tributive state policies tend to be growth-retarding, a view now increasingly challenged
among academic economists (see e.g., Aghion, Caroli and Garcia-Penalosa (1999), Baner-
jee, Benabou and Mookherjee (2006), Bardhan, Bowles and Gintis (2000) or Franko (2003)).
The ‘new institutional economics’ stresses the role of problems of incentives, information
and governance ignored in traditional neoclassical economics. According to this approach
realignment of property rights in favor of factors or agents with the most acute incentive
problems can be growth facilitating. In the context of small-scale agriculture, this sug-
gests that land reforms represent a form of redistributive state policy that can enhance
rather than retard growth. Moreover, inequality can exacerbate problems of incentives
and accountability of government officials, resulting in poor implementation of develop-
ment programs. These problems may be reduced if elected local governments rather than
state government-appointed bureaucrats administer these programs, provided institutions
4Only one other state, Jammu and Kashmir had redistributed more land than West Bengal; no other
state has embarked on a tenancy regulation program on a similar scale.
3
of local democracy function well.
This paper critically evaluates the role of the agrarian institutional reforms in West
Bengal since the late 1970s, on trends in delivery of state provided agricultural services,
and ultimately on agricultural productivity and rural poverty.
We first review the political economy of local governance in West Bengal: i.e., how
well did local democracy function; how accountable were local governments; what were the
major determinants of their effort to promote local development? The over-riding concern
commonly expressed about a strategy of rural development based on local democracy is
the prospect of capture of local governments by rural elites, or their proneness to corrup-
tion. In our earlier theoretical work (Bardhan and Mookherjee (2000, 2005, 2006a)) we
have emphasized that local governments may be more or less prone to corruption than bu-
reaucrats appointed by central or state governments, depending on how well institutions of
local democracy function. Hence the relative effectiveness of a strategy of rural development
centered on local democracy can be context-specific and for any given setting can only be
settled empirically. Elsewhere we have provided detailed empirical analyses of the political
economy of the West Bengal panchayats (Bardhan and Mookherjee (2004a,b, 2006b); we
summarize those results here in the first part of the paper. Since direct evidence about
capture and corruption is difficult to obtain, we infer these by studying how land reform
implementation and other developmental efforts of panchayats in different West Bengal
villages varied with socio-economic inequality and political competition.
The second part of the paper provides estimates of the effects of land reforms and pro-
grams administered by local governments on growth of agricultural productivity, diffusion of
HYV rice varieties and the distribution of resulting benefits across different sections of the
rural population. A summary of the principal results is provided later in this Introduction.
1.2 Methodology, Data and Relation to Previous Literature
Some previous studies have estimated the effects of land reforms in the Indian context but
at a high level of aggregation and relying on official state government figures concerning
agricultural performance. Besley and Burgess (2000) for instance examine the effects of
4
varying land reform legislations across different Indian states, while Banerjee, Gertler and
Ghatak (2002) study the effect of one component of land reforms (Operation Barga, the
tenancy registration program) across different West Bengal districts. These studies could
be subject to a number of possible concerns: legislations do not necessarily correspond to
actual implementation; data on agricultural performance or land reforms at the district or
state levels could be subject to considerable error, intentional or otherwise.5
Moreover, the effects of the land reforms could be confounded with many other changes
occurring in local governance or market contexts at the same time, that were not con-
trolled for in previous analyses. It is possible that villages in which land reforms were
vigorously implemented were also those in which the local panchayats played an active role
in providing other essential agricultural inputs to farmers, and the measured effects of the
former actually reflect those of the latter. The extent of cultivable land directly affected by
the land reforms in West Bengal appears too small to explain the magnitude of observed
changes: e.g., in our sample approximately 10% of cultivable land was involved in the re-
forms, whereas HYV adoption rates rose from 10% of acreage in the early 1980s to 66%
by the late 1990s. The direct effects of the land reform can explain only a small fraction
of this. Alternative hypotheses could possibly account for the same sequence of observed
events: e.g., productivity changes arose initially in response to a combination of market
and social factors (changes in prices, market arrangements, and diffusion of HYV rice via
social learning) unrelated to state action. These productivity gains may have been biased
in favor of small farmers (owing to the inherent nature of rice cultivation); the resulting
change in income distribution within villages could have led to improved local governance,
resulting in greater land reform and targeting by panchayats. In this scenario the direction
of causation would be reversed: from market-led development to land reform.
Our study assesses the extent to which results of earlier studies are prone to these sources
5For instance, considerable doubt has been raised about the reliability of agricultural output data of the
West Bengal state government during the 1980s and 1990s, see e.g., Boyce (1987) and subsequent debates
in the Economic and Political Weekly. The status of published statistics concerning aggregate agricultural
performance by the state government continues to be mired in controversy; in private communication James
Boyce indicated to us his belief that while the data for the 1980s is reliable, for the 1990s it was generated
by flawed statistical procedures.
5
of bias. First, we do not rely on figures for aggregate agricultural production published by
the state government at either district or state levels and used in public reviews of its past
achievements. Instead we use data from cost of cultivation surveys of a stratified random
sample of farms drawn from the major agricultural districts of the state. These surveys were
carried out for the sole purpose of estimating agricultural costs by the state agriculture
department; these were aggregated and sent subsequently to Central government bodies
responsible for setting agricultural prices on a cost-plus basis. We utilize the disaggregated
data collected at the level of individual farms. The sampling design chose eight farms
randomly in each village stratifying by farm size; detailed data concerning inputs and
outputs were collected in weekly visits by field investigators, relying on direct measurement
rather than farmer responses to quetionnaires. Each farm was followed for a period of five
years each, with new selection of farms and villages once every five years, allowing us to
construct a farm panel spanning fifteen years from 1981–1996.
We combine this farm dataset with direct collection of data from (a) village governments
(gram panchayats (GPs)) concerning agricultural inputs supplied and infrastructure projects
implemented; (b) local land reforms offices for records of land titles distributed, tenants
registered in the concerned villages on a yearly basis since 1971; and (c) local communities
concerning the local distribution of land, occupation, literacy and caste status in either 1978
or 1983 and 1998.6 Lacking identifiers of household names in the farm survey, we were unable
to match the farms with the beneficiaries of land reforms and panchayat programs. Hence
our results concern the impact of the latter not on the direct beneficiaries of the programs,
but rather their broader impact on a sample of representative farms in the village.
Second, the village (GP and household) datasets permit us to assess the political econ-
omy of the land reforms and panchayat programs, and disentangle their respective contribu-
tions. We jointly estimate the separate effects of Operation Barga, the land redistribution
6Voter lists for these election years were used as the basis of creating a list of households in consultation
with significant members of each village community; the land, literacy, occupational and caste status of each
household for the corresponding year was subsequently identified by these community members based on
their knowledge and recall. The land distribution constructed in this way match closely with the distribution
of operational land holdings published by the National Sample Survey and the state Agricultural Censuses
when aggregated upto the district level: see Bardhan and Mookherjee (2006b, Table 3) for further details.
6
(patta) program, GP expenditures on irrigation, road-building, distribution of agricultural
minikits and IRDP credit to local residents. We additionally control for changes in local
rainfall, price of rice, state-government provided canals and roads, besides farm-specific
and year-specific effects. We use our political economy analysis of the land reform and
GP programs to identify exogenous sources of variation in these (instruments, consisting
of political and economic events at the national and state level, interacted with historical
institutional variables at the local level) in order to control for possible reverse causality or
omitted variable biases.
1.3 Summary of Results
Concerning political will of local governments to implement land reforms and target de-
velopment programs to the poor, our empirical results lead us to reject polar hypotheses
that local government officials were motivated by ideology or electoral opportunism alone.
The ideology hypothesis predicts Left dominated panchayats will implement anti-poverty
programs more intensively, while the opportunism hypothesis predicts that the latter will
be independent of the political composition of panchayats. Both theories predict there will
be greater anti-poverty effort when there is greater inequality and poverty to start with.
In contrast to these predictions, we find evidence that political composition of panchay-
ats mattered in a number of instances, but not in the way that the ideology hypothesis
predicts. Anti-poverty efforts often slackened when the Left became more entrenched, and
there was greater local poverty and socio-economic inequality. These results are consistent
with the notion that there was some capture of the panchayats by local elites (e.g., medium
landowners) or abuse of power among elected officials. Local election outcomes were ex-
plained better by swings in voter loyalty based on events at the national and state levels,
rather than changes in the local distribution of land, literacy and caste.
Nevertheless, the extent of political distortions owing to capture varied across different
contexts. For instance, within villages, ‘private good’ programs such as the IRDP credit
program or agricultural minikits were well-targeted: more than 95% of these were allocated
to small, marginal and landless households. On the other hand, employment generating
7
programs (such as JRY) were administered in a way that less employment was generated
out of allotted funds when poverty within the village grew. Higher level panchayats were
subject to noticeably greater distortions, with inter-GP allocation of minikits, employment
grants and fiscal grants shrinking as poverty and SC/ST proportion within a given GP
jurisdiction grew.
Turning to the effects of the land reforms and panchayat programs on agricultural per-
formance:
(a) The proportion of cultivable land registered under Operation Barga in a village upto
any given year had a surprisingly strong positive effect on rice yields and farm value
added per acre in subsequent years. This is true particularly when we control for other
agricultural inputs (IRDP credit, minikits, medium irrigation, local roads) supplied
by GPs, besides rice prices, rainfall and state-government provided roads and canals.
(b) Minikits supplied, IRDP credit disbursed and roads both local and state also had
similar strong positive effects on rice yields and farm incomes per acre.
(c) The land distribution (patta) program had a smaller positive and statistically insignif-
icant effect on farm yields, and a positive significant effect on HYV adoption rates.
(d) HYV adoption rates did not significantly increase in response to higher incidence
of Operation Barga, minikits distributed, or road program expenditures. Hence the
positive productivity effects of these programs were not mediated through increased
HYV adoption.
(e) The distribution of productivity and income gains were biased in favor of small farms
(between 2.5 and 5 acres). Marginal farms (less than 2.5 acres) gained at a rate more
or less similar to the average farm in the village, though somewhat less than small
farms (except with regard to GP road programs which disproportionately benefited
marginal farms). Hence small and marginal farmers obtained a significant share of
the gains.
(f) Neither the land reforms nor GP-administered programs had a significant effect on
wage rates for agricultural workers. Rates of employment were raised significantly by
8
GP irrigation spending, and lowered significantly by the patta distribution program.
So there is no evidence of any significant positive impact on incomes of agricultural
workers, the poorest section of the rural population.
Overall, the results indicate that the land reforms and panchayat administered programs
had a favorable impact on agricultural productivity and farm incomes. Unlike the initial
impact of the Green Revolution, the benefits were spread widely among small and marginal
landowning farms. However, these favorable effects were limited to cultivating households,
and did not trickle down to agricultural workers hired on these farms.
The effects of the tenancy registration program are especially surprising. Our results
are consistent with the earlier findings of Banerjee et al (2002) based on state government
figures for rice yields and tenancy registration rates at the district level. Note, however,
that the proportion of land directly affected by the Barga reform was of the order of 5%,
whereas the farm sample was chosen randomly from the population of all farms within these
villages. Hence these measured effects mostly represent spillover effects of the program to
productivity on farms not directly impacted by the program; they cannot be explained
simply by incentive effects of the tenancy reform on efforts by registered tenants to raise
productivity. We can only speculate regarding the channels by which the spillovers oper-
ated. One possibility is social learning: neighbors, kinship groups and friends may have
learnt from new production experiments of tenant farmers. Registered sharecroppers may
have initiated collective action within the village to secure better access to water and mar-
keting arrangements. They may have lobbied the panchayat to provide better production
facilities to small farmers. Faced with the threat of registration, large farms may have been
subdivided into smaller plots and sold off; these new smaller farms may have been more
productive. The precise channels through which these productivity improvements occurred
are not well understood: our evidence does not show any effects on the diffusion of HYV
rice varieties. Further research on the process by which these productivity improvements
arose and spread are needed.
The paper is structured as follows. Section 2 explains different political economy theories
of functioning of local governments that structures our analysis. Section 3 describes the
9
empirical results concerning political economy of the West Bengal panchayats, based on two
prior papers (Bardhan-Mookherjee (2004b, 2006b)). Sections 4 and 5 presents results of the
effects of panchayat actions on farm outcomes: Section 4 summarizes underlying theories
and Section 5 our empirical results. Finally, Section 6 concludes.
2 Accountability of Local Governments: Political Economy
Hypotheses
The first hypothesis of the behavior of local governments is that elected officials are primarily
motivated by ideology, a term used broadly to represent policy preferences of the party or
group they represent. Based on Lipset (1960) and Wittman (1973) recent ‘citizen candidate’
versions of this theory (Osborne and Slivinski (1996), Besley and Coate (1998)) are based
on the assumption that candidates cannot commit to their policy platforms before elections,
and ignore effect of current policy choices on future electoral prospects. Political parties
and groups have particular policy preferences, on the basis of an ideology or self-interest
of constituencies they represent. For example, those from a Left party are expected to
prefer more redistributive policies; women are expected to espouse policies that advance
the interests of women generally, and so on. Once elected, officials implement their own
preferred policies, so observed policies reflect the preferences of those elected. Policy choices
can then be explained by the composition of elected governments: e.g., the more Left party
candidates get elected, the more likely that redistributive policies will be chosen. It is also
natural to suppose that ideological preferences for redistribution of the Left increase when
there is greater inequality to start with. The ideology hypothesis thus predicts that local
governments will be more accountable to the poor when the share of Left party candidates
in the panchayat is higher, when there is more inequality and poverty, and the interaction of
these two sets of factors is also likely to be positive. From the perspective of this hypothesis,
local governments are likely to be more accountable to the poor in West Bengal relative to
other states because of the predominance of the Left parties in the state.
The polar opposite hypothesis is that parties and candidates are motivated primarily
10
by electoral opportunism, i.e., office-seeking motives, rather than ideological policy prefer-
ences. Based on Downs (1957), this approach assumes that candidates can commit to policy
platforms before elections, to which voters react. Alternatively, elected officials make policy
choices based on their likely impact on chances for re-election (with retrospective voting).
In a two party context, this hypothesis predicts that competing candidates will select the
same policy that maximizes vote share, i.e. those preferred by the average voter. This
implies that observed policy choices will bear no relation to the party, gender or caste com-
position of elected candidates. Instead they will be predicted by the distribution of voter
preferences, which in turn will depend on the distribution of voter characteristics. Similar
to the ideology hypothesis, greater inequality will tend to generate greater redistribution.
This approach predicts greater accountability of local governments to the poor when there is
greater local inequality, but independent of political competition or composition of elected
governments.
A third approach modifies the Downsian approach to incorporate lobbies, special interest
groups, and varying patterns of political awareness and participation of different voter
groups. Based on the work of Grossman and Helpman (1996) and some of our own earlier
work (Bardhan and Mookherjee (2000)), this approach introduces various frictions in the
functioning of democracies in which selected policies can diverge from those that serve the
preferences of the average voter (while continuing to hold the same assumptions concerning
motivation of political candidates as in the Downsian theory). In these quasi-Downsian
theories, policy choices of elected candidates can be influenced by special interest groups by
campaign contributions or other forms of corruption, as well as asymmetries in awareness
or turnout of different classes of voters. Interest groups tend to contribute more to parties
that voters are more loyal to and so are in a stronger competitive position: such parties are
therefore more vulnerable to special interests. Increased political competition tends to limit
the scope for influence by special interest groups, as well as for corruption or administrative
slack among elected officials. Hence accountability of elected governments to the poor is
greater when there is greater political competition. This approach predicts an inverted-U
relation between Left party share of the elected governments and its accountability. In
contrast to both the ideology and Downsian hypotheses, the effect of local inequality on
11
accountability is ambiguous. On the one hand, it intensifies preference for redistribution
for the average voter. On the other hand, inequality raises the scope for influence of local
elites, and limits political awareness and participation of the poor. The effects of inequality
are likely to depend on the extent of political competition: if an incumbent party is well
entrenched and faces little competitive threat from rival parties, it is more likely to be prone
to elite capture.
3 Empirical Evidence Concerning Accountability of West Ben-
gal Panchayats
3.1 Background
Summary statistics concerning the villages in our sample are provided in Tables 1 and 2.
The 89 villages are located in 57 village government (Gram panchayat (GP)) jurisdictions.
Each GP consists of ten to twenty elected members of a council governing administration
of the jurisdiction of the GP, which usually consists of eight to fifteen villages or mouzas.
On average each district comprises 20 blocks and 200 GPs. Each district has a single Zilla
Parishad (ZP), the top tier of the panchayat system, and each block has a Panchayat Samiti
(PS), the middle tier. The top official at each level is an ex-officio member of the next higher
level; other officials at each tier are elected directly by voters. For most part, we focus on
the composition of seats in GPs as they are the main implementing agencies at the ground
level (e.g., with respect to selection of beneficiaries of various developmental schemes and
infrastructure projects within villages). Moreover, party composition of GPs and higher
tiers were highly correlated with one another.
The twenty year period witnessed four successive elected bodies in each GP, each with
a five year term (which we sometimes refer to as a timeblock). The Left Front coalition
won an absolute majority in approximately three-fourths of the elected GPs, with a mean
seat proportion of 69% (and a slightly higher median). The main opposition party was
the Indian National Congress and its various off-shoots (such as the Trinamool Congress
which broke away for the 1998 elections). Most electoral constituencies witnessed a contest
12
between the Left and either the Congress (or the Trinamool Congress): there were hardly
any three-way contests. In most cases, these two parties collectively garnered more than
90% of all elected positions. The dominance of the Left Front at higher levels was greater
at higher tiers; e.g., the mean Left share in ZP positions during the period was 86%.
Table 2 shows the principal demographic and asset distribution changes in the sample
villages between 1978 and 1998. The number of households almost doubled, the result
of household subdivision and in-migration (especially from Bangladesh). Illiteracy rates
fell, especially among the poor (landless or marginal landowners). The incidence of non-
agricultural occupations rose from one-third to one-half.
The distribution of cultivable non-patta land (i.e., excluding land distributed through
the land reforms) changed in interesting ways: landlessness increased, while the distribution
of land among landowners became more equal. The proportion of households without any
such land or with marginal holdings below 2.5 acres increased by almost 10%. In this sense
poverty increased. On the other hand, the proportion of land in small holdings (below
5 acres) rose by 17%, i.e., signifiying a reduction of land inequality among those holding
land. These occurred as a result of market sales of land and fragmentation of landholdings
accompanying household sub-division.
Table 3 indicates the extent of land reform implemented. Approximately 5.4% of cul-
tivable land was distributed to 15% of the population in the form of registered land ti-
tles (pattas). Another 6% of cultivable land involved leased lands on which tenants (bar-
gadars) were recorded (Operation Barga), who were subsequently protected from eviction by
landowners and guaranteed a minimum share. The proportion of households registered was
4.4%. Aggregating the two programs, about 10% of cultivable land area was affected, and
30% of all households benefited. Undoubtedly this was a large program, one of the largest
land reform initiatives in India in recent memory. Also distinctive was the involvement of
panchayats in this process, who were instrumental in mobilizing mass participation in vil-
lage meetings to identify the ownership of land among households in each village, selecting
suitable beneficiaries, and pursuing contested cases through the courts.
Other important responsibilities entrusted to the panchayats included implementation of
13
the two principal poverty alleviation schemes (the IRDP credit program, and employment
programs such as Food for Work (FFW), National Rural Employment Program (NREP),
Rural Labour Employment Guarantee Program (RLEGP) in the 1980s which were merged
into the Jawahar Rozgar Yojana (JRY) from 1989 onwards), distribution of subsidized
agricultural inputs (in the form of minikits containing seeds, fertilizers and pesticides),
local infrastructure projects (including roads and irrigation), and miscellaneous welfare
schemes (old-age assistance, disaster relief, housing programs for the poor etc.). The bulk
of the funds were devolved to the GPs under various schemes sponsored by the central and
state government, amounting to 78% in our sample. The role played by the GPs therefore
consisted mainly in selection of beneficiaries of various development programs handed down
from the central or state government.
Table 4 depicts trends in subsidized state inputs provided between 1982–95 . The
1980s witnessed larger supplies of IRDP credit and minikits compared with the 1990s.
One out of every four or five households received minikits in the 1980s, containing seeds,
fertlizers and pesticides. The bulk of employment funds were spent by GPs on building and
maintenance of local roads; these employment programs created 3-4 mandays of employment
per household every year. There was also expansion of areas irrigated by state canals, though
even greater expansions were witnessed in medium and small irrigation projects many of
which were managed by panchayat officials.
Table 5 shows corresponding trends in agricultural outcomes. The most spectacular
change was in rice yields which increased by more than 150%. Part of this is explained by
widespread diffusion of HYV rice, with acreage devoted to such varieties expanding from
less than 10% in 1982 to 39% by 1990, and 66% in 1995. In real terms, farm value added per
acre more than doubled. Wage rates for agricultural workers rose by 66%, and employment
more than doubled. Since the poorest sections of the rural population are landless and rely
mainly on agricultural labor, incomes of the poor rose significantly during this period.
14
3.2 Explaining GP Election Outcomes
Table 6 provides panel regression results for the fraction of seats won by the Left Front
in GPs, in terms of a variety of state and national factors likely to affect relative voter
loyalties to the Left vis-a-vis the Congress, after controlling for distribution of land, literacy
and caste within the villages. Among the state and national factors are the presence of
the Congress party in the national Parliament, the rate of inflation of the price index for
agricultural workers in the nearest of four centers of the state where this is computed by
the state government (Asansol, Ranigunj, Japaiguri and Kolkata).
The first and last columns of Table 6 show that election outcomes in GP elections closely
mirrored average vote share differences between the Left Front and Congress averaged at
the district level in preceding state assembly elections. Other columns show the role of the
inflation rate for agricultural workers in one of four regions of the state as an important de-
terminant. Hence wider issues at the state level influencing voter loyalties to the competing
parties had a strong impact on local elections. The panel regressions show that nation-wide
factors affecting the popularity of the Congress, as measured by the proportion of seats
in the national Parliament, also had a strong impact on local government elections. The
effects of these state and national factors differed according to historical incumbency: in
traditionally Congress dominated areas, a rise in Congress presence in national Parliament
or a fall in the inflation rate caused the Congress to become more entrenched, with the
opposite effect in traditionally Left Front areas. In contrast to the effect of these broader
factors influencing voter loyalties, changes in local land, literacy or gender distributions had
no effect on panchayat election outcomes.
These results form the basis of our identification strategy for the effect of varying political
competition on GP policy. Fluctuations in political events at the state or national level
(interacted with local incumbency patterns) provide exogenous sources of variation in Left
share. Outcomes of GP elections correlate closely with outcomes of elections to the state
legislative assembly held one or two years apart, indicating the role of voter loyalties to
the Left vis-a-vis the Congress rather than specific local issues. Most of the fluctuations
in Left share can be explained by fluctuations in general voter loyalties, which are unlikely
15
to be uncorrelated with time-varying village-specific fluctuations in voter preferences for
redistribution. Moreover, examining the reaction of GP policies to changes in Left share
predicted by these sources of variation (rather than actual fluctuations in Left share) provide
instrumental variable (IV) estimates of the effect of varying political competition.
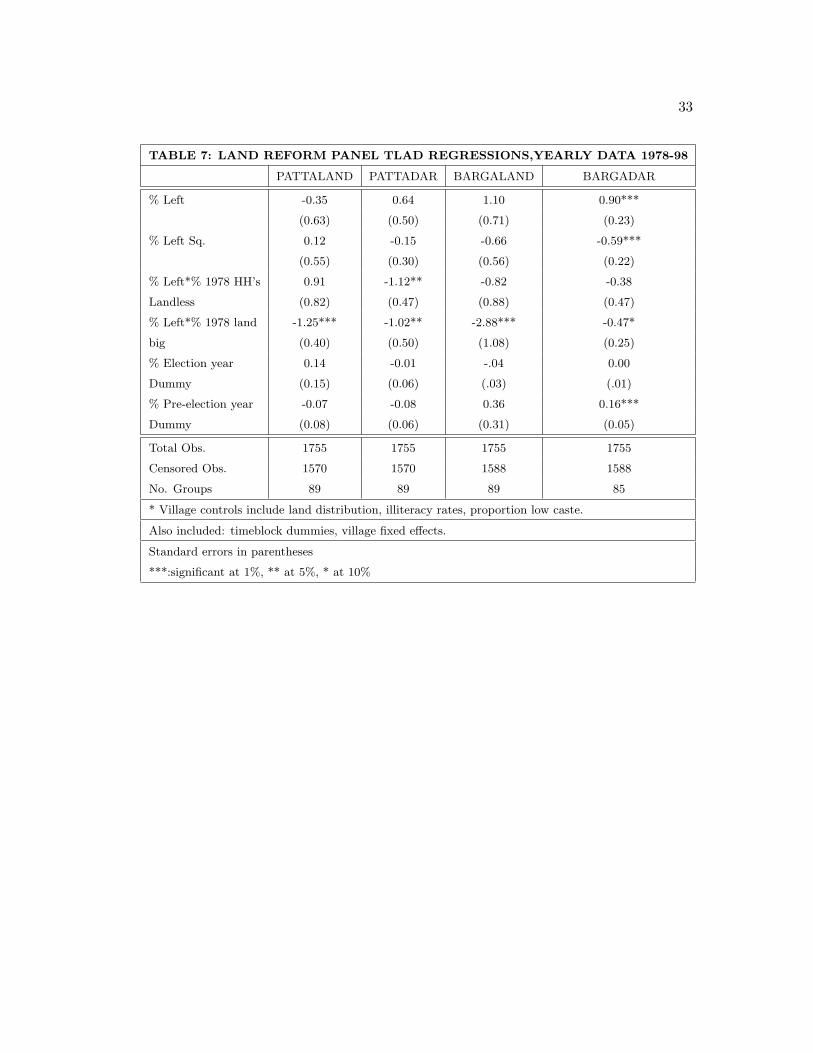
3.3 Land Reform
Table 7 provides regression estimates for different measures of land reform implemented
(pattaland, bargaland refer to proportion of cultivable land distributed or registered, while
pattadar, bargadar refer to proportion of households receiving land titles or registered as a
sharecropper). Since in many years there were no land reforms implemented at all in any
given village, the regression has to incorporate endogenous censoring; accordingly we use a
TLAD (trimmed least absolute deviation) estimator with village fixed effects (see Honore
(1992)).
Table 7 shows no evidence of any tendency for land reforms to increase monotonically
with the Left share. With the exception of the pattaland regression, there was an inverted-U
relation instead, statistically significant in the bargadar regression. The top turning point
of the U appeared at or below 50% Left share, indicating that for most of the sample where
the Left had an absolute majority, an increase in Left control of the local GP resulted in
less rather than more land reform. This directly contradicts the predictions of the ideol-
ogy hypothesis, and confirms the prediction of the quasi-Downsian hypothesis. Additional
confirming evidence against either polar ideology or Downsian hypotheses is the significant
negative interaction between Left share and (either of two measures of) 1978 land inequality.
This is consistent with the quasi-Downsian hypothesis wherein capture is positively corre-
lated with inequality: given the general dominance of the Left, an increase in Left share
represents reduced political competition between the two parties, which permits greater
capture of elected officials, resulting ultimately in less land reform. The role of electoral
competition is further indicated by pre-election year spikes in Barga activity, and election
year spikes in patta activity.
16
3.4 Targeting of Other Development Programs
Tables 8, 9 and 10 display implications of panel regression estimates for targeting of subsi-
dized credit under the IRDP program, agricultural minikits and fiscal grants respectively.
The first three columns of Table 8 show intravillage shares of intended beneficiaries of
IRDP loans: landless, small landowning households (owning less than 5 acres of cultivable
land), and scheduled castes and tribes (SC/ST). The mean shares of these groups were close
to their demographic weights, indicating that on average these schemes were targeted well.
The leakage of IRDP credit to medium and large landowners was small, though roughly
in proportion to their demographic weights as well. Examining the effect of varying land
inequality, significant effects are observed for the share of the ‘upto small’ group with a rise
in share of land in big holdings, and a particularly strong effect of a rise in proportion of
marginal landowning households on the share of the SC/ST group (which fell by a third).
Effects on the inter-GP allocation of credit were not statistically significant. An increase
in Left share at the district level (by 10% starting from the mean) tended to reduce credit
allocations both within and across villages. These results are broadly consistent with the
quasi-Downsian theory. However, effects of altered political competition at the GP level
appeared to be insignificant, and the quantitative magnitudes of the ‘capture’ effects seemed
limited overall (with the possible exception of the share of SC/ST groups).
Table 9 shows corresponding implications for targeting of minikits. The first column
shows they were almost exclusively delivered within villages to small and marginal landown-
ing households, rather than medium or big landowners. Moreover, there was almost no ef-
fect of changing land inequality, caste composition or political competition on intra-village
targeting. On the other hand, the inter-village allocation responded significantly to land
inequality and caste composition, favoring small non-SC/ST households relative to big
landowners and SC/ST households.
Table 10 shows results for targeting of grants received by GPs from higher levels of
government. The first column shows that increased landlessness and land share of big
landowners lowered employment generated out of allotted funds by about a third, pro-
viding another indication of local elite capture. The inter-GP allocation of these grants
17
discriminated against the SC/ST households and big landowners, just as in the case of
the minikits. The same is true for all fiscal grants, where an additional negative effect is
observed with respect to the extent of landlessness. The quantitative magnitudes of these
biases are much stronger than in the case of kits or credit allocation. Moreover, political
competition at the GP level also mattered: entrenchment of the Left (i.e., increases in the
Left share beyond the mean) lowered employment grants significantly.
In general, the results are broadly consistent with the quasi-Downsian model, and run
counter to the ideology hypothesis. This indicates that electoral competition promoted ac-
countability of local governments (with respect to sharecropper registration and employment
programs). The effects of land inequality were more complex, in line with the theoretical
ambiguity predicted by the quasi-Downsian theory. Within villages, pro-poor efforts were
adversely affected by greater land inequality in the case of employment programs, favorably
affected in the case of the patta program, and not significantly affected in all other cases
(barga program, credit or minikits). By and large ‘private’ goods such as IRDP credit and
minikits were well-targeted within villages by GPs. The inter-village allocation seemed to
discriminate against big landowners, and in favor of medium and small landowners. Both
intra- and inter-village allocations exhibited considerable discrimination against SC/ST
groups, which paradoxically constituted one of the main bases of political support for the
Left Front. These results are consistent with views expressed by many political commenta-
tors and critics that the Left Front has pursued the ‘politics of middleness’, more responsive
to the needs of middle farmers rather than the poor.7
7the Left parties have been subject to internal debate concerning the need to strike a balance between
its traditional ideology and opportunism. See, e.g., Franda (1971), Nossiter (1988), Lieten (1992, pp.128-
133) and Bhattacharya (1999). The transition of the CPI(M) from a revolutionary party in the 1940s to
subsequent capture and consolidation of the state government is generally attributed to the pragmatism
of its leaders Jyoti Basu and Promode Dasgupta who consciously chose an approach that would secure
widespread political support with voters, at the cost of disenchantment of some of the party’s ideologues.
Lieten summarizes some of the internal critiques of the Left Front government’s performance from those
disillusioned with its compromise with traditional ideology. Bhattacharya describes the political transition
of the CPI(M) in West Bengal as pursuing the ‘politics of middleness’.
18
4 Effects of Panchayat Actions on Farm Outcomes
4.1 Effect of Land Reforms: Theoretical Hypotheses
The effect of land reforms on farm productivity have been the topic of a large literature
in development economics. The classic arguments concern Marshallian inefficiencies arising
from sharecropping, where the share paid to the landlord acts as a tax on the tenant’s
effort. Sharecropper registration can raise farmer incentives by capping this implicit tax
rate. Other incentive effects arise from removing the right of landlords to evict tenants:
the direction of these are ambiguous, owing to conflicts between different effects. Eviction
threats can be used by landlords as an incentive device, the removal of which could dull
tenant incentives. On the other hand, security of tenure may promote longer time horizons
for the tenant and thereby increase investment incentives. These issues are discussed in
Bardhan (1984), Dutta, Ray and Sengupta (1989) and Banerjee, Gertler and Ghatak (2002).
In sum, effects of sharecropper registration are theoretically ambiguous.
The incentive effects of redistributing land ownership, in contrast, are expected to be
positive (see e.g., Bardhan (1973) Berry and Cline (1979), Binswanger et al (1993)). Note
that the West Bengal patta program concerned mainly distribution of titles to land that had
already been vested (from those holding surplus land above legislated land ceilings). Most
of the land had been vested prior to 1978 (e.g., for a subsample of 40 villages for which this
data was available, we found that over 70% had been vested prior to 1978). It is likely that
the land parcels transferred enabled them to be actively cultivated, compared to lying fallow
since being vested. Freshly vested lands belonged previously to large landowning families,
which would probably have cultivated them using hired labor. Given the advantages of
family labor cultivation over hired labor, and the relative lack of important sources of scale
economies (such as mechanization) in rice cultivation, one would expect small farms to be
more productive than large farms. If so, one would expect the effect of the patta program
to raise rice yields and farm incomes.
Table 11 provides estimates of variations in farm productivity with farm size and ten-
ancy, after controlling for choice of HYV and cashcrops, inputs applied, district and year
19
fixed effects. Smaller farms were significantly more productive, both in cross-sectional and
first difference regressions. Yields and farm incomes were also substantially higher following
greater HYV and cash crop adoption. Table 12 shows that small farms tended to adopt HYV
rice to a greater extent than large farms, further reinforcing the negative size-productivity
relation.
Cross-sectional estimates (OLS level regressions in the first and third columns) show
that productivity was increasing in the fraction of area leased. However the first-difference
estimates (second and fourth columns) show that this effect was not statistically significant,
with a substantially smaller regression coefficient. This suggesting that the positive cross-
sectional correlation reflects a tendency for more skilled farmers to lease in more land, rather
than a causal impact of tenancy on productivity. Indeed, Table 11 should be interpreted
as observed correlations rather than firm estimates of productivity, as no attempt has been
made to control for omitted variable bias. In particular, the inverse size-productivity rela-
tionship could be entirely spurious, reflecting possible heterogeneity of soil quality between
small and large farms. Hence these relationships cannot be taken as firm evidence that land
redistribution will raise farm productivity.
Moreover, we have seen above that the proportion of land directly affected by the land
reforms constituted a relatively small fraction of all cultivable land in these villages, of the
order of 10%. The direct incentive effects of the patta and barge programs could not possible
account for a rise in the acreage devoted to HYV rice varieties from 10 to 66%. On the other
hand, the land reforms could generate a range of spillover effects to other farms not directly
connected with the land reforms, through patterns of social learning, changes in local prices
or wage rates, or induced changes in patterns of land sales or household subdivision. For
instance, the threat of land reforms may cause subdivision of large landowning households
and of large farms. These may have productivity effects on lands transferred via the market
or household divisions.
Even broader effects could operate through effects on local governance. Land reforms
could reduce the scope for capture of local governments by landed elites: we have seen
evidence in favor of this view in the previous section. This may have implications for the
20
targeting of subsidized credit, minikits or local infrastructure programs to the poor. Direct
evidence of these spillover effects is rarely available. We shall therefore estimate reduced
form regressions of farm outcomes with respect to the cumulative land reforms implemented
in the village, apart from panchayat delivery of agricultural minikits, expenditure on local
irrigation and road projects.
4.2 Empirical Estimates
Table 13 provides the first set of estimates of the effects of the Barga program on rice yields,
showing the effects of using the regression specification of Banerjee, Gertler and Ghatak
(2002) in our context, with a few variations. Since HYV adoption decisions are endogenous,
we do not include them among the regressors (though the results do not change when they
are included). Since the productivity effects of the program are likely to vary more directly
with the proportion of cultivable land area covered by the program rather than proportion
of sharecroppers registered, we use the (lagged) cumulative proportion of land area as the
regressor.8 Controls include state roads and canals at the district level, and annual rainfall.
Since our data pertains to farm level yields, we use farm (rather than district) fixed effects.
Interactions of year dummies with South Bengal districts, initial sharecropping and 1978
Left majority dummies are included in the third and fourth columns. OLS estimates are
shown in the second and fourth columns, with corresponding IV estimates in the first and
third columns. In the latter, cumulative Barga activity is instrumented by corresponding
cumulatives of state and national factors that affected the extent of political competition
at the GP level, interacted with historical incumbency factors.9
Table 13 shows the effects of Operation Barga on rice yields at the farm level were positive
8An additional reason is that any estimate of the registration rate relies on an estimate of the actual
number of tenants (registered or otherwise), reliable data regarding which is typically difficult to obtain.9Specifically, (cumulative) bargaland and pattaland were instrumented by cumulatives of the following
variables and corresponding squares and interactions: Left share lagged, Congress seats in Parliament, small
factory employment at the district level, inflation, average vote share difference at the preceding Assembly
election at the district level. The within-R2 of the prediction equation for cumulative bargaland is .95, while
that for cumulative pattaland is .56, so the instruments do predict land reforms implemented quite well.
21
but statistically insignificant, irrespective of whether we use the OLS or IV estimates. The
IV estimates tend to be more than twice as big as the OLS estimates, i.e., a significant
understatement by the latter of the true causal impact owing to omitted variable bias
or reverse causality. The direction and magnitude of the bias are surprising, since one
might have expected the OLS estimate to include the effect of other omitted variables (e.g.,
reflecting local governance) moving in the same direction as land reform implementation.
Table 14 provides the first full set of joint estimates of respective effects of both categories
of land reforms, and other key inputs supplied by the GPs. Supplies of kits and IRDP
credit are instrumented by the scale of these programs at the state level, the population-
bank ratio, interacted with instruments for local political competition. The coefficient of
cumulative lagged bargaland turns out to be strongly positive and significant in both OLS
and IV versions, with the IV estimates continuing to be considerably higher than the OLS
estimates. The effect of cumulative pattaland is positive, somewhat lower in magnitude, and
generally statistically insignificant (with the exception of two OLS estimates).
Other inputs supplied by GPs, especially minikits, road programs and IRDP credit,
also had a significantly positive effect, with the IV estimates larger than the OLS estimates.
There was considerable multicollinearity between credit and kit supplies, as indicated by
the last two columns of Table 14 where their respective effects lose significance when jointly
included. Owing to this, we hereafter present separate regressions which include these one
at a time. State roads had a strong positive effect throughout, while state canal irrigation
exhibited a negative, significant effect. This result is quite puzzling, possible explanations of
which need to be investigated in future research. One possibility is that state canal provision
responded to the political and economic power of large landowners, which was negatively
correlated with local productivity of the average small or marginal farm. Another is that
the state government directed canal expansion into slow-growing areas for redistributive
reasons.
Table 15 examines the corresponding effects on HYV adoption rates. Three different
specifications are included, corresponding to a linear, logarithmic and logistic functions of
the adoption rate. The effects of bargaland, kits and GP road programs are fluctuating
22
in sign and significance, while only pattaland has a positive, significant effect on (log and
logistic forms) of the adoption rate. Hence the productivity enhancing effects identified in
Table 14 cannot be explained by corresponding effects on HYV adoption incentives.
Table 16 examines effects on farm value added per acre, and finds these to be similar
to those on rice yields (with the exception of rice price and state canal irrigation, which
have positive and zero effects here, in contrast to a significant negative effect on rice yields).
The elasticity of farm incomes with regard to price changes is about .4. The fact that this
is less than one is consistent with the negative effect of rice price on rice yields shown in
Table 14, possible reflecting a tendency for farmers to slacken effort when rice prices are
rising. It is also conceivable that the rice price reflects mainly prices of traditional rather
than high-yielding varieties, so a higher rice price is associated with a shift away from HYV
to traditional varieties. However, Table 15 shows no such tendency for farmers to switch
out of HYV rice as rice prices rose.
Table 17 examines differential effects on productivity and incomes of small (less than 5
acre) and marginal (less than 2.5 acre) farms. The positive effects of the Barga program,
GP road and irrigation spending were intensified for small farms. Marginal farms obtained
roughly the same or more benefits as the average farm (with the exception of kits, where
their productivity increase was about 5% lower). In the case of GP road programs, their
benefits were significantly higher. Hence the productivity and income gains from GP actions
were spread evenly, with a bias in favor of small and marginal farms.
Finally, Table 18 examines the impact on wage and employment rates of agricultural
workers hired by farms. Wage rates are not significantly affected by any of the GP admin-
istered programs. Employment rates are negatively affected by the patta program, possibly
owing to a combination of supply-side and demand-side effects. On the one hand the dis-
tribution of land titles to the landless would tend to reduce the supply of agricultural labor
(and raise wage rates, as was the case, though this effect was not statistically significant).
On the other hand, the patta program accelerated HYV adoption rates, which tended to
substitute hired labor with family labor. The net effect of these changes on the fortunes
of landless workers is difficult to decipher. GP irrigation investments tended to raise em-
23
ployment rates, as did state investments in canals and roads. The latter result is equally
consistent with the hypotheses that state canals responded to large landowners (since they
employ more hired labor than small family farms) or to regional redistributive motives of the
state government. In this respect there was a key difference between irrigation investments
administered by local and state governments: the former tended to raise productivity and
incomes of farmers but had no effect on agricultural workers, while the opposite appeared
to be the case with state irrigation programs.
5 Concluding Comments
To summarize our main results, we found evidence in favor of the quasi-Downsian theory
stressing the proneness of electoral competition to elite capture, with respect to the pro-poor
accountability of West Bengal local governments. Local inequality and political competition
mattered in the way that this theory predicts. These were especially pronounced in the
case of the barga program, in the treatment of SC/ST groups with respect to IRDP credit,
the administration of employment programs by GPs, the inter-village allocation of minikits,
employment grants and fiscal grants by higher levels of government. There was relatively less
indication of elite capture in intra-village allocation of private goods (except with respect to
treatment of SC/ST groups) and in the implementation of land reform, so local democracy
seemed to have functioned well in regard to these programs.
We also found evidence of the importance of the actions of GPs for growth in farm
productivity: the barga program, supplies of IRDP credit and agricultural kits, local invest-
ments in irrigation and roads contributed to the rise in rice yields and farm productivity
during the 1980s and 90s. Unlike the initial impact of the Green Revolution in earlier
decades elsewhere in the country, these benefits were biased in favor of small and marginal
farmers. With the exception of local infrastructural investments, however, these benefits
did not trickle down to landless agricultural workers.
The results raise a number of puzzles concerning the channels by which the reforms
affected productivity. Considering the small fraction of land distributed, it is surprising
24
that the barga program had large effects on farm productivity on farms in general, not
just the tenants who were registered. Conventional theories of effects of tenancy regulation
on effort incentives of tenants can only explain the effect on the farms directly affected,
not other farms in the village. A better understanding is needed of the process by which
productivity improvements diffused — perhaps through social learning, collective action
within the village with respect to minor irrigation, induced effects on land fragmentation
through the land market, or on the accountability of local governments. Our currently
ongoing research seeks to explore this question in more detail. The contrasting effects of
irrigation provided by panchayats and the state government poses another puzzle.
The main policy implications of our findings are to affirm the benign productivity and
distributive benefits of agrarian institutional reforms in the West Bengal context. How rel-
evant these are to other Indian states with contrasting historical traditions and agricultural
settings is not evident. In terms of the design of local democracy, our analysis suggests
greater attention needs to be placed on the process of disbursement of grants at higher
levels of the panchayat system across GPs. In addition, policy-makers should be sensitive
to instances of perverse intra-village targeting with regard to employment generating pro-
grams adminsitered by GPs, and treatment of SC/ST groups. Measures to enhance electoral
competition — e.g., institutional reforms that reduce incumbency advantages, such as the
scope for manipulation of electoral outcomes by current governments — are also warranted.
25
References
Aghion P., Caroli E and Garcia-Penalosa C. (1999), “Inequality and Economic Growth:
The Perspective of the New Growth Theories,” Journal of Economic Literature.
Appu P.S. (1996), Land Reforms in India, Delhi: Vikas Publishing House.
Banerjee A., P. Gertler, and M. Ghatak (2002), Empowerment and Efficiency: Tenancy
Reform in West Bengal, Journal of Political Economy, 110(2), 239-280.
Banerjee A., R. Benabou and D. Mookherjee (2006), Understanding Poverty, New York:
Oxford University Press.
Bardhan P. (1973), “Size, Productivity and Returns to Scale: An Analysis of Farm-Level
Data in Indian Agriculture,” Journal of Political Economy, 81(6), 1370–86.
Bardhan P., S. Bowles and H. Gintis (2000), “Wealth Inequality, Wealth Constraints and
Economic Performance,” in A. Atkinson and F. Borguignon (ed.) Handbook of Income
Distribution, Elsevier, Amsterdam.
—————- (1984), Land, Labor and Rural Poverty (Delhi: Oxford University Press; New
York: Columbia University Press).
Bardhan P. and D. Mookherjee (2000), “Capture and Governance at Local and National
Levels,” American Economic Review, Papers and Proceedings, May 2000, 135-139.
—————– (2004a), “Poverty Alleviation Effort of West Bengal Panchayats,” Economic
and Political Weekly, February 28 2004.
—————– (2004b), “Ideology versus Electoral Competition in Redistributive Politics:
Land Reform in West Bengal,” working paper, Boston University.
—————- (2005), ‘Decentralizing Anti-Poverty Program Delivery in Developing Coun-
tries,’ Journal of Public Economics, 89, 2005, 675–704.
—————- (2006a), “‘Corruption and Decentralization of Infrastructure Delivery in De-