Land Subsidence along the Delta-Mendota Canal in the Northern Part of the San Joaquin Valley, California Michelle Sneed, Justin Brandt, and Mike Solt California Water Science Center U.S. Geological Survey February 27, 2014 http://ca.water.usgs.gov/projects/central-valley/delta-mendota-canal.html Agenda Item 11 - Presentation Meeting Date: February 27, 2014 Page 1
Transcript
Land Subsidence along the Delta-Mendota Canal
in the Northern Part of the San Joaquin Valley, California
Michelle Sneed, Justin Brandt, and Mike Solt California Water Science Center
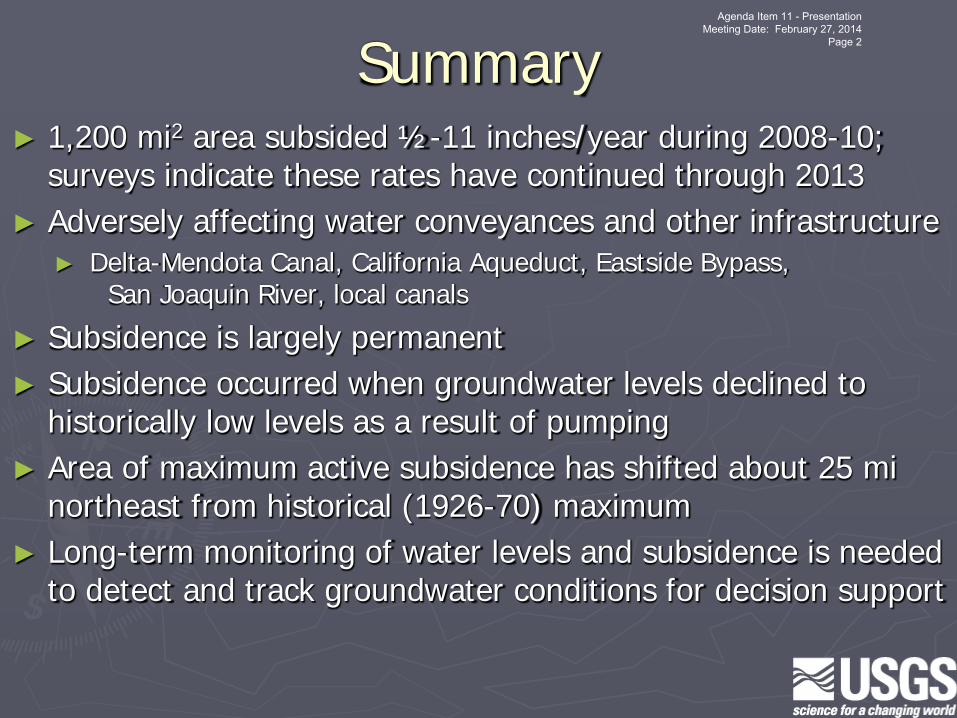
Summary ► 1,200 mi2 area subsided ½-11 inches/year during 2008-10;
surveys indicate these rates have continued through 2013 ► Adversely affecting water conveyances and other infrastructure
► Delta-Mendota Canal, California Aqueduct, Eastside Bypass, San Joaquin River, local canals
► Subsidence is largely permanent ► Subsidence occurred when groundwater levels declined to
historically low levels as a result of pumping ► Area of maximum active subsidence has shifted about 25 mi
northeast from historical (1926-70) maximum ► Long-term monitoring of water levels and subsidence is needed
to detect and track groundwater conditions for decision support
Agenda Item 11 - Presentation Meeting Date: February 27, 2014
Page 2
Subsidence Damages Natural Resources and Infrastructure
► Flood Protection and Infrastructure Damage to water conveyance systems
and other infrastructure ►Reduced conveyance capacity and freeboard,
panel damage; water surface and liner misalignment; erosion/deposition in unlined channels
►Roads, rails, bridges, pipelines, wells, etc.
►Natural resources Reduces aquifer-system storage capacity Impacts to wetland, riparian, and aquatic
ecosystems Restricted land uses
Agenda Item 11 - Presentation Meeting Date: February 27, 2014
Page 3
Extensive withdrawal of groundwater caused widespread subsidence (1920s-1970)
Subsidence History
Galloway and others, 1999; USGS Circular 1182
Surface-water deliveries caused widespread recovery and slowing or cessation of subsidence, except when deliveries were curtailed and groundwater pumping increased to meet demand
Agenda Item 11 - Presentation Meeting Date: February 27, 2014
Page 4
Recent Subsidence ►Renewed subsidence concern during 2007-09
drought, and now, the current drought Reduced surface water importation More reliance on the groundwater resources As it turns out…this is not just a problem during droughts
for some areas without surface-water access
P304 data from UNAVCO; 2004-10 water-level data from Luhdorff and Scalmanini Consulting Engineers
Drought Drought
Groundwater Level
Subsidence
Agenda Item 11 - Presentation Meeting Date: February 27, 2014
Page 5
Federal, State, and Local Water Infrastructure in the Impacted Area
Modified from Faunt, 2009
Agenda Item 11 - Presentation Meeting Date: February 27, 2014
Page 6
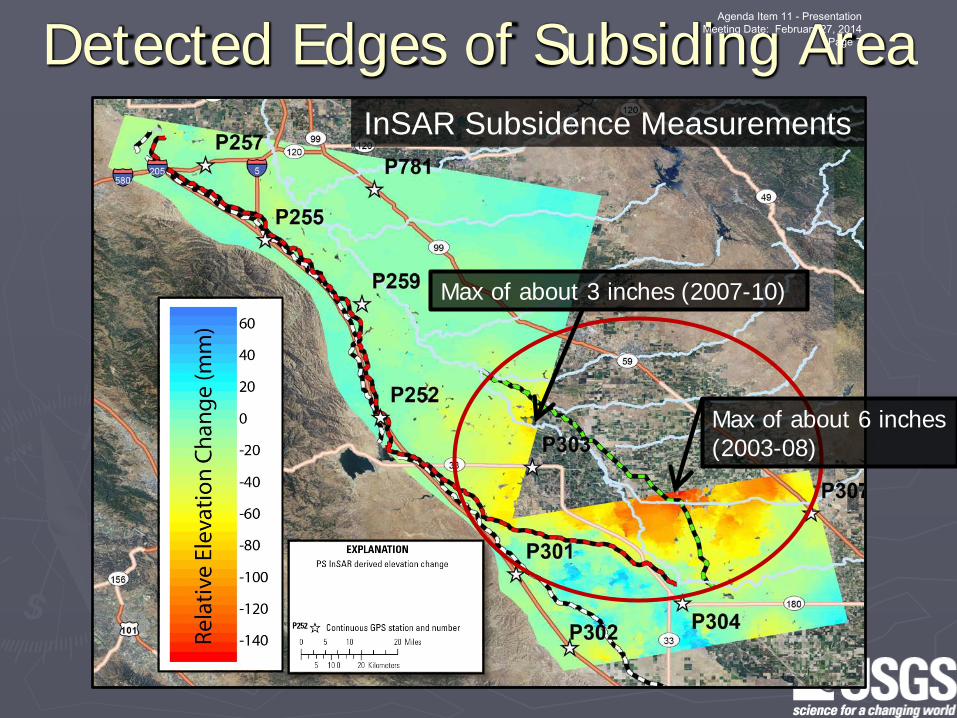
Detected Edges of Subsiding Area
Max of about 3 inches (2007-10)
Max of about 6 inches (2003-08)
InSAR Subsidence Measurements
Agenda Item 11 - Presentation Meeting Date: February 27, 2014
Page 7
Max of at least 21 inches (2008-10)
InSAR Subsidence Measurements: Maximum Subsidence Area near El Nido,
between Eastside Bypass and San Joaquin River
Agenda Item 11 - Presentation Meeting Date: February 27, 2014
Page 8
Highest Impact: Adjacent to San Joaquin River and Eastside Bypass
Agenda Item 11 - Presentation Meeting Date: February 27, 2014
Page 9
A
A’
Highest Impact: Adjacent to San Joaquin River and Eastside Bypass
Agenda Item 11 - Presentation Meeting Date: February 27, 2014
Page 10
Highest Impact: Adjacent to San Joaquin River and Eastside Bypass
Agenda Item 11 - Presentation Meeting Date: February 27, 2014
Page 11
Water levels in the Shallow and Deep Systems Declined 2007-10
Agenda Item 11 - Presentation Meeting Date: February 27, 2014
Page 12
Water levels in the Shallow and Deep Systems Declined 2007-10
Deep System Exceeded Historical Low Levels
Shallow System Above Historical Low Levels
Agenda Item 11 - Presentation Meeting Date: February 27, 2014
Page 13
GPS Subsidence Measurements
P304
P307
P303
Rate increases during drought
Subsidence only during drought
Rate constant during droughts and non-droughts
Agenda Item 11 - Presentation Meeting Date: February 27, 2014
Page 14
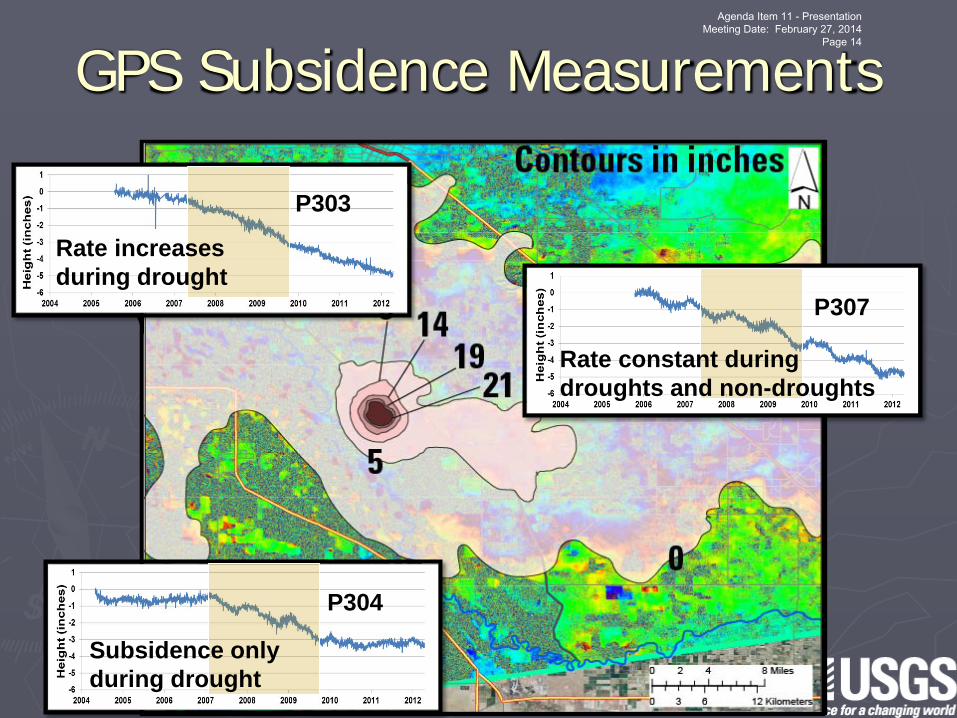
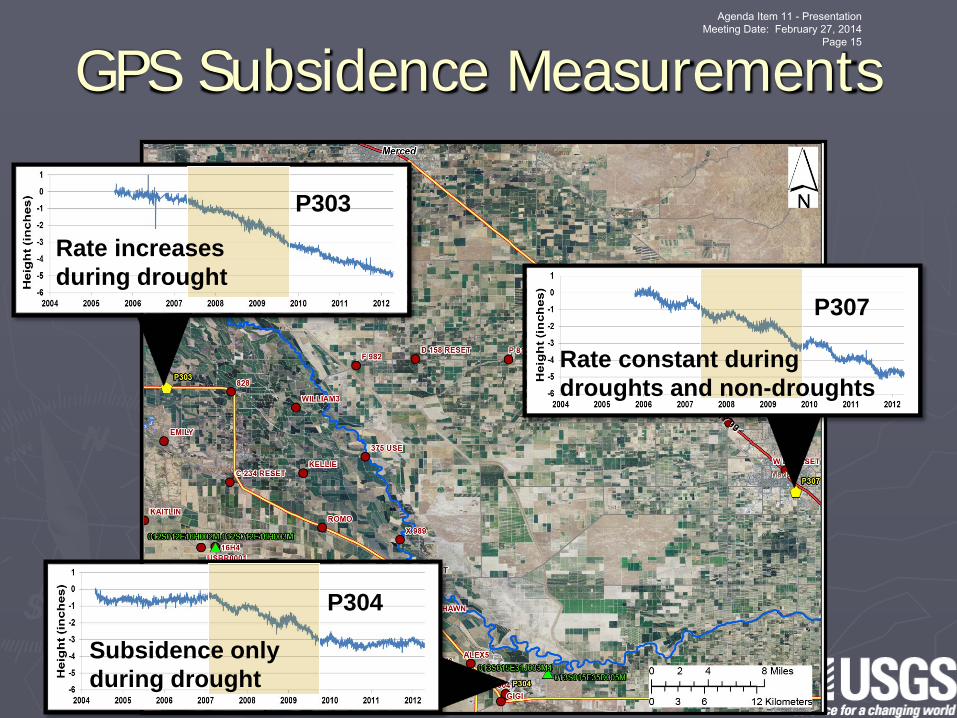
GPS Subsidence Measurements
P304
P307
P303
Rate increases during drought
Subsidence only during drought
Rate constant during droughts and non-droughts
Agenda Item 11 - Presentation Meeting Date: February 27, 2014
Page 15
Historical Subsidence
Agenda Item 11 - Presentation Meeting Date: February 27, 2014
Page 16
Recent Subsidence Agenda Item 11 - Presentation
Meeting Date: February 27, 2014 Page 17
What Can Be Done About It? ► Focus on maintaining groundwater levels above
historical low levels Reduction of groundwater withdrawal
►Decreasing groundwater demand ►Limiting/redistributing groundwater use ►Increasing supplemental water supply
Enhanced groundwater recharge ►Artificial recharge: direct well injection or surface infiltration ►Natural recharge: source protection
► Long-term monitoring of water levels and subsidence is needed to detect and track groundwater conditions for decision support
Agenda Item 11 - Presentation Meeting Date: February 27, 2014