LAND SUITABILITY AND DYNAMIC SYSTEM MODEL FOR LANDUSE PLANNING OF PADDY FIELD IN INDRAMAYU REGENCY, WEST JAVA, INDONESIA Wiwin Ambarwulan, Widiatmaka, Titik Suparwati, Irman Firmansyah, Niendyawati FIG 2017 BOGOR AGRICULTURAL UNIVERSITY GEOSPATIAL INFORMATION AGENCY
Transcript
LAND SUITABILITY AND DYNAMIC SYSTEM MODEL FOR LANDUSE PLANNING OF PADDY FIELD IN
INDRAMAYU REGENCY, WEST JAVA, INDONESIA
Wiwin Ambarwulan, Widiatmaka, Titik Suparwati,
Irman Firmansyah, Niendyawati
FIG 2017
BOGOR AGRICULTURAL UNIVERSITY GEOSPATIAL INFORMATION AGENCY
Presented at th
e FIG W
orking Week 2017,
May 29 - June 2, 2
017 in Helsinki, F
inland
I. INTRODUCTION
• Serious problem of food supply in Indonesia:
– High amount of population : 250 million (No. 4 in the world)
– High rice consumption: 113 kg.capita-1.year-1
– Most of rice (50%) was produced by agricultural land in Java Island
– Java island: only 7% of Indonesian territory
– 50% of Indonesian population in Java Island
• Pressure on Java island to produce food as well as conversion to residence, industry, etc.
1.1. Background
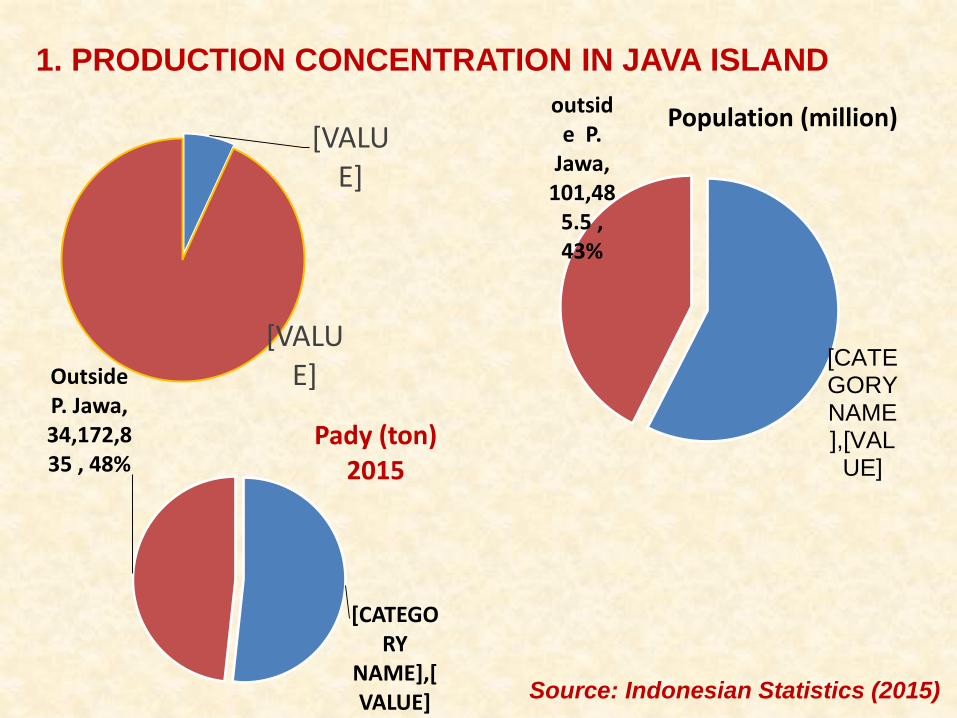
[CATEGORY NAME],[VALUE]
outside P.
Jawa, 101,48
5.5 , 43%
Population (million)
1. PRODUCTION CONCENTRATION IN JAVA ISLAND
Source: Indonesian Statistics (2015)
[VALUE]
[VALUE]
[CATEGORY
NAME],[VALUE]
Outside P. Jawa, 34,172,835 , 48%
Pady (ton) 2015
Implication
• High dependence on food production in Java Island • High pressure for agricultural land in Java island • High rate of paddy field conversion into other land
utilization
How to solve the problem? FOOD INSECURITY
1. Spatially location with HIGH LAND SUITABILITY should be conserve
2. Each region should maintain its self sufficiency in order to maintaining country’s food security
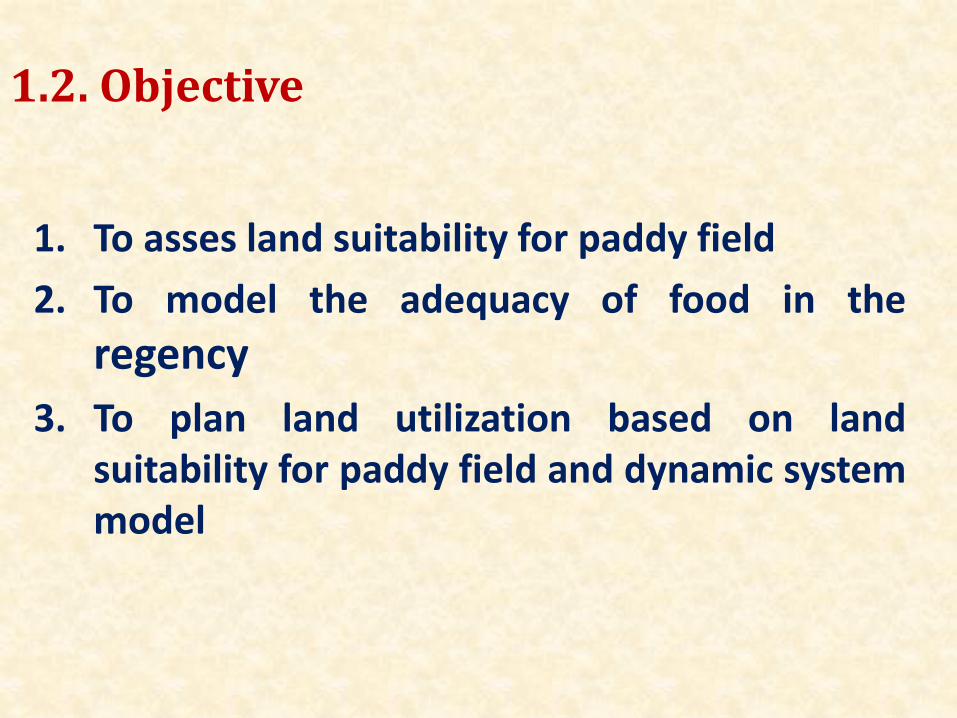
1.2. Objective
1. To asses land suitability for paddy field
2. To model the adequacy of food in the
regency
3. To plan land utilization based on land suitability for paddy field and dynamic system model
Indramayu Regency, West Java Province, Indonesia (one of rice production
center in West Java Province)
• Size of Indramayu = 209,942 ha • Paddy field = 144,429 ha (69%)
2.1. RESEARCH LOCATION
2.2. Analysis Methods
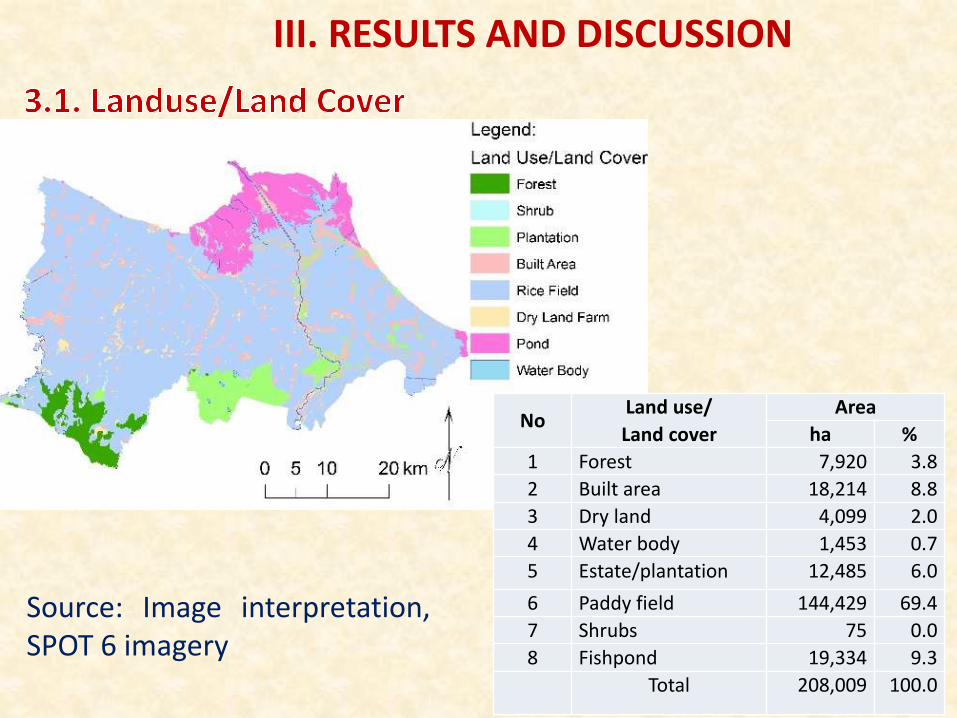
1. Land use and land cover.
The analysis is focused on paddy fields.
Existing paddy field delineation was conducted using SPOT-6 imagery (2014).
2. Land Suitability Analysis.
Use the Automated Land Evaluation System (ALES) (Rossiter, 2001).
Land Mapping Unit (LMU): 35 LMU
3. System Dynamic Modelling.
Powersim Studio 8
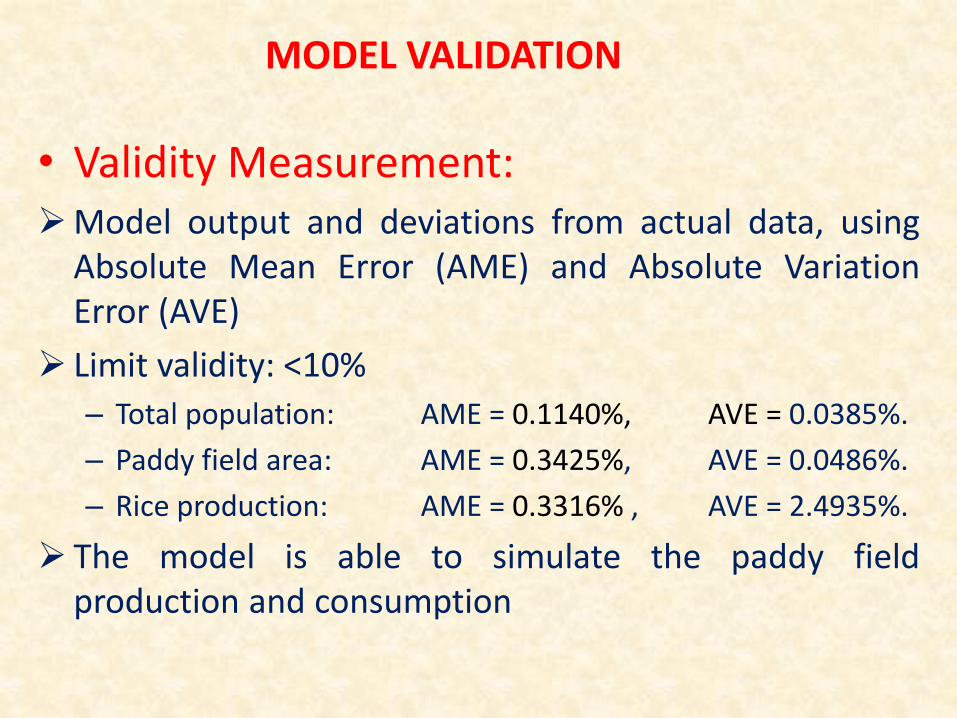
Land Quality/ Land Characteristics Sim-bol Land Suitability
Performance surplus of rice according to the scenario compared
to actual condition (modeled)
3.7. SPATIAL PRIORITY FOR PADDY FIELD, based on dynamic model and land suitability
The priority area of paddy field to be protected in 2030. The availability of rice in the longer term required higher area to be protected. Priority was based on land suitability (level of land suitability and the ease to manage according to limiting factor)
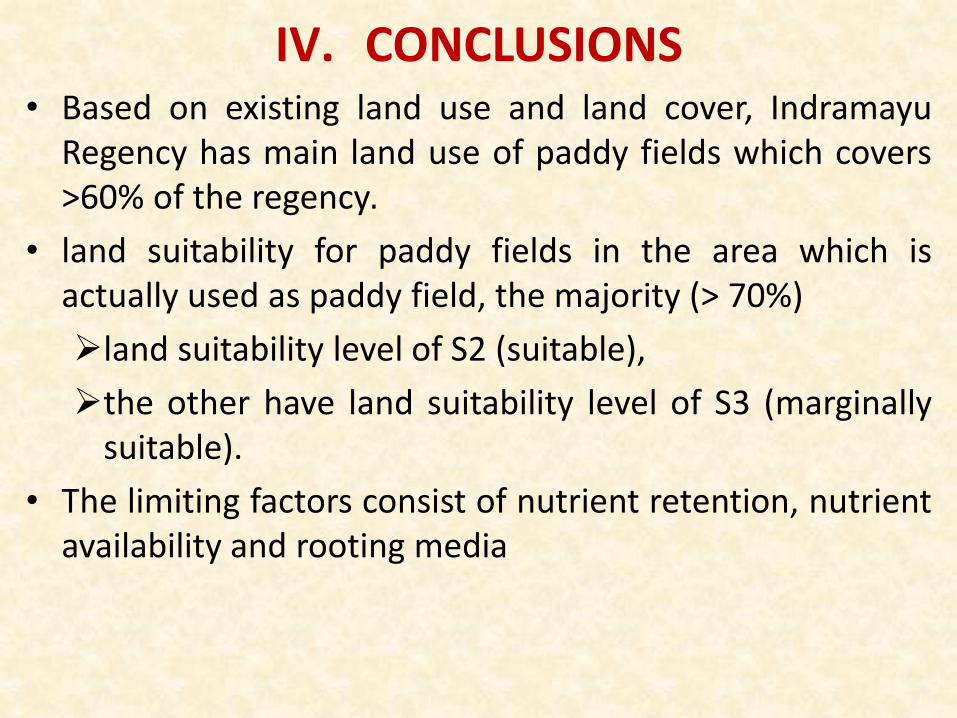
IV. CONCLUSIONS • Based on existing land use and land cover, Indramayu
Regency has main land use of paddy fields which covers >60% of the regency.
• land suitability for paddy fields in the area which is actually used as paddy field, the majority (> 70%)
land suitability level of S2 (suitable),
the other have land suitability level of S3 (marginally suitable).
• The limiting factors consist of nutrient retention, nutrient availability and rooting media
• System dynamic modeling results show that in the current conditions,
– Indramayu regency still have sufficient food for its population, the regency can even contribute to national food sovereignty by exporting 81% of rice out of the territory.
– Along with the increasing food needs due to population growth and decreasing paddy field area due to land conversion, the ability to export out of the regency was reduced with 14% from in 2030 compared to the export of 2014.
• With the moderate scenario by improvement of cropping index:
– Indramayu regency in 2030 will still able to export rice 79% out of the territory.
• In the optimistic scenario:
– the ability to export out of the territory is even higher, surpassing even export in the existing (2014) condition.
• Based on the analysis of land suitability and equilibrium of production and consumption according to the model, the priority of paddy field to be protected can be then arranged within five (5) priority levels, which can be presented spatially.