at current prices) ............................................................................................................................ 9
Survey information ........................................................................................................................................... 10
General information.......................................................................................................................................... 13
STATISTICS SOUTH AFRICA 2 P7162
Land transport, October 2018
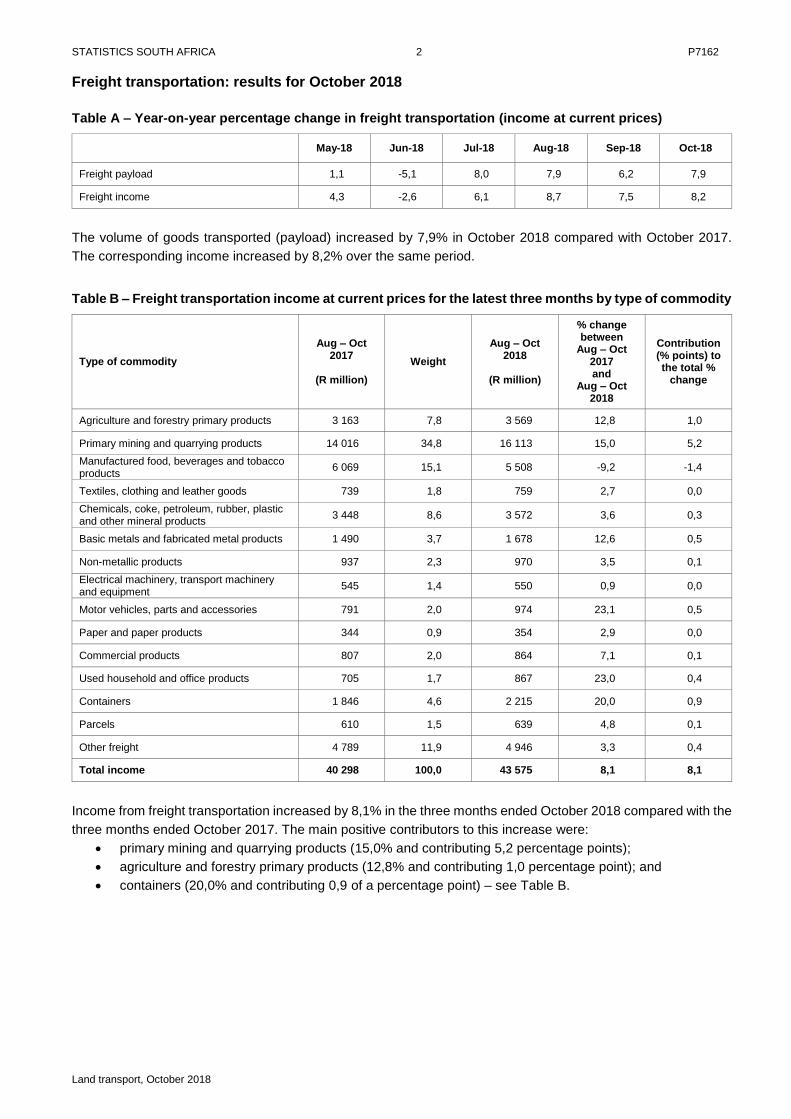
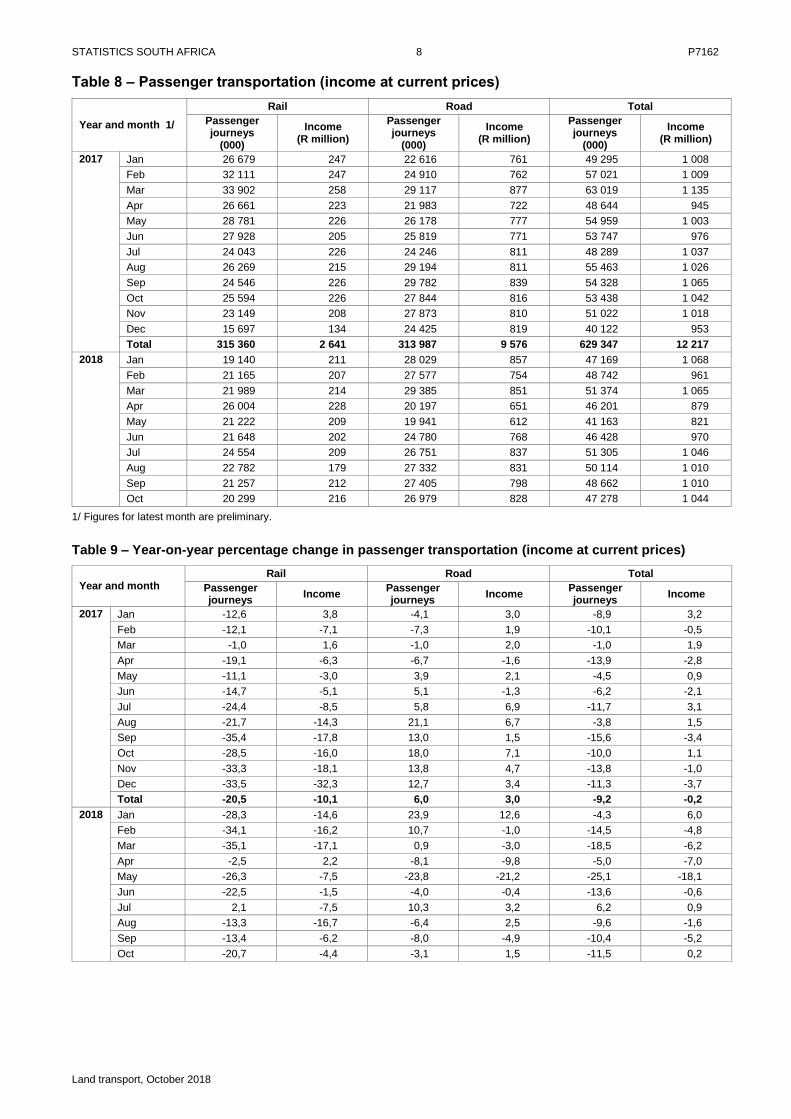
Freight transportation: results for October 2018
Table A – Year-on-year percentage change in freight transportation (income at current prices)
May-18 Jun-18 Jul-18 Aug-18 Sep-18 Oct-18
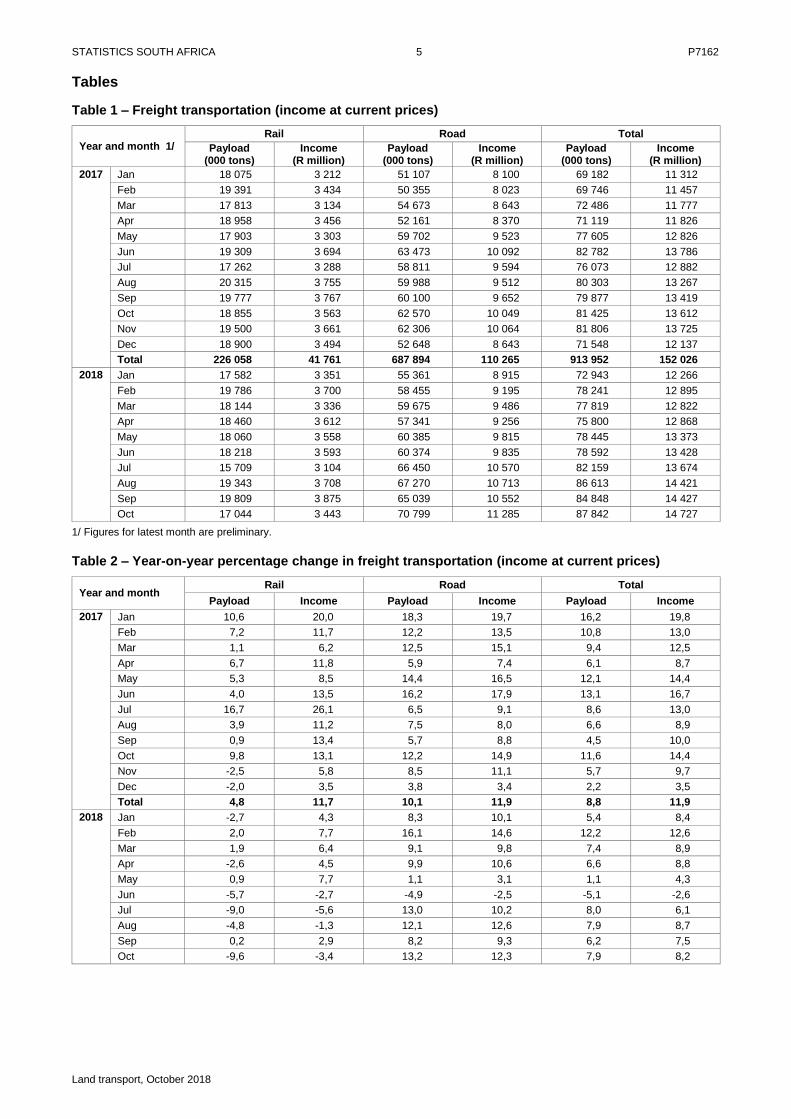
Freight payload 1,1 -5,1 8,0 7,9 6,2 7,9
Freight income 4,3 -2,6 6,1 8,7 7,5 8,2
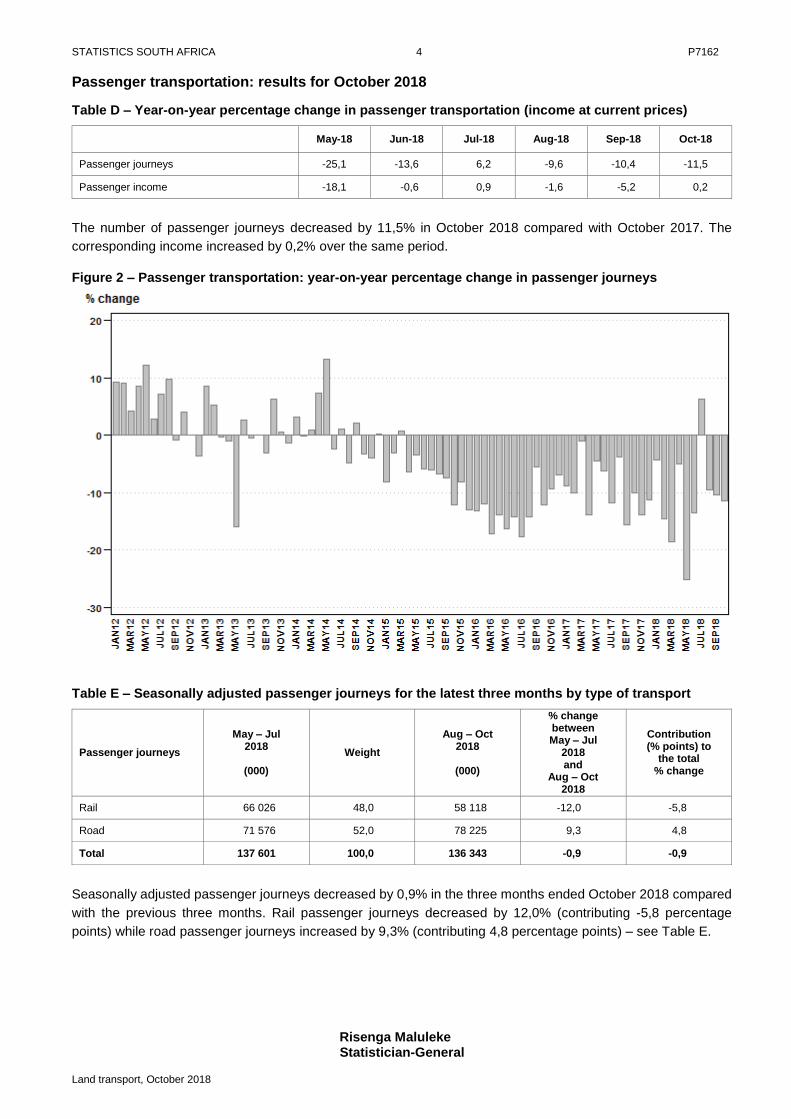
The volume of goods transported (payload) increased by 7,9% in October 2018 compared with October 2017.
The corresponding income increased by 8,2% over the same period.
Table B – Freight transportation income at current prices for the latest three months by type of commodity
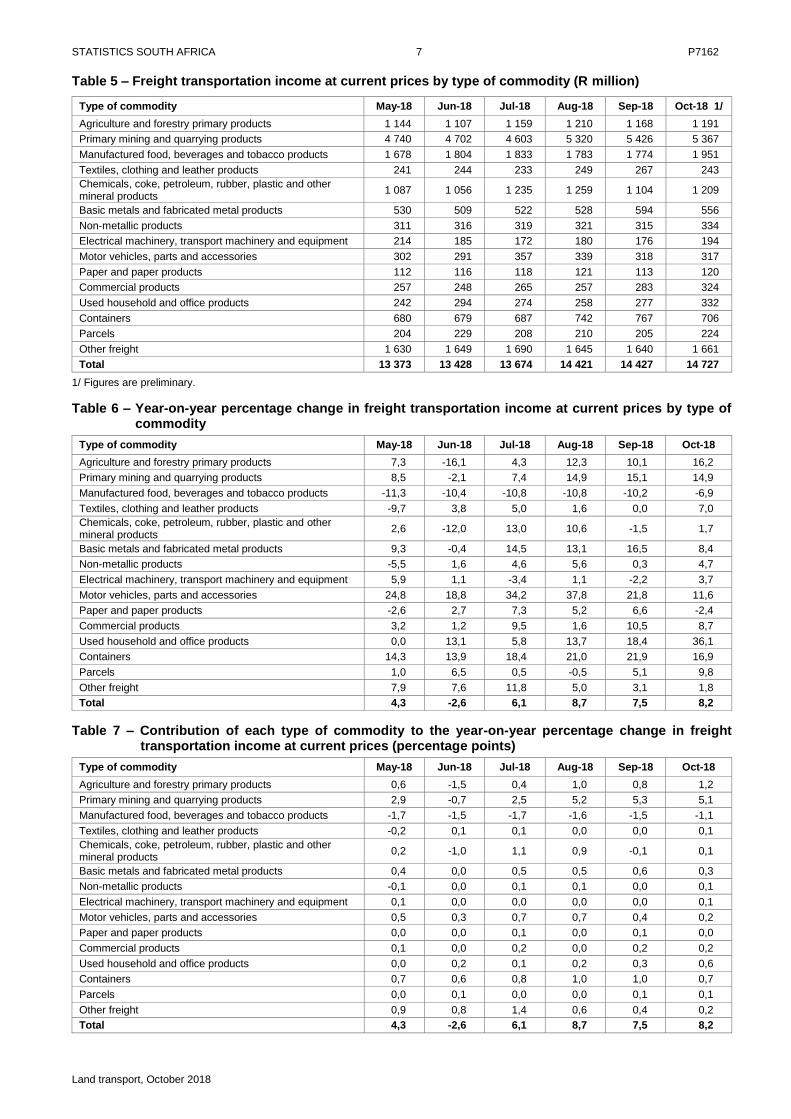
Chemicals, coke, petroleum, rubber, plastic and other mineral products
2,6 -12,0 13,0 10,6 -1,5 1,7
Basic metals and fabricated metal products 9,3 -0,4 14,5 13,1 16,5 8,4
Non-metallic products -5,5 1,6 4,6 5,6 0,3 4,7
Electrical machinery, transport machinery and equipment 5,9 1,1 -3,4 1,1 -2,2 3,7
Motor vehicles, parts and accessories 24,8 18,8 34,2 37,8 21,8 11,6
Paper and paper products -2,6 2,7 7,3 5,2 6,6 -2,4
Commercial products 3,2 1,2 9,5 1,6 10,5 8,7
Used household and office products 0,0 13,1 5,8 13,7 18,4 36,1
Containers 14,3 13,9 18,4 21,0 21,9 16,9
Parcels 1,0 6,5 0,5 -0,5 5,1 9,8
Other freight 7,9 7,6 11,8 5,0 3,1 1,8
Total 4,3 -2,6 6,1 8,7 7,5 8,2
Table 7 – Contribution of each type of commodity to the year-on-year percentage change in freight transportation income at current prices (percentage points)
Type of commodity May-18 Jun-18 Jul-18 Aug-18 Sep-18 Oct-18
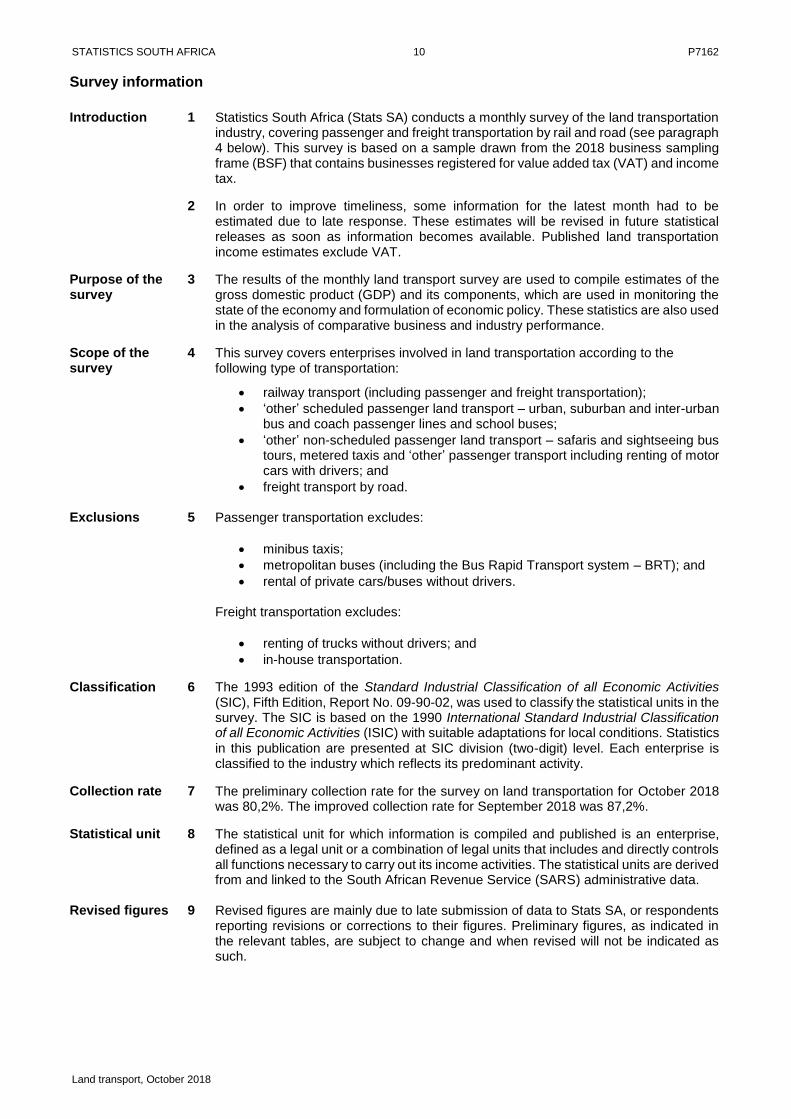
Introduction 1 Statistics South Africa (Stats SA) conducts a monthly survey of the land transportation industry, covering passenger and freight transportation by rail and road (see paragraph 4 below). This survey is based on a sample drawn from the 2018 business sampling frame (BSF) that contains businesses registered for value added tax (VAT) and income tax.
2 In order to improve timeliness, some information for the latest month had to be estimated due to late response. These estimates will be revised in future statistical releases as soon as information becomes available. Published land transportation income estimates exclude VAT.
Purpose of the survey
3 The results of the monthly land transport survey are used to compile estimates of the gross domestic product (GDP) and its components, which are used in monitoring the state of the economy and formulation of economic policy. These statistics are also used in the analysis of comparative business and industry performance.
Scope of the survey
4 This survey covers enterprises involved in land transportation according to the following type of transportation:
railway transport (including passenger and freight transportation);
‘other’ scheduled passenger land transport – urban, suburban and inter-urban bus and coach passenger lines and school buses;
‘other’ non-scheduled passenger land transport – safaris and sightseeing bus tours, metered taxis and ‘other’ passenger transport including renting of motor cars with drivers; and
freight transport by road.
Exclusions 5 Passenger transportation excludes:
minibus taxis;
metropolitan buses (including the Bus Rapid Transport system – BRT); and
rental of private cars/buses without drivers.
Freight transportation excludes:
renting of trucks without drivers; and
in-house transportation.
Classification 6 The 1993 edition of the Standard Industrial Classification of all Economic Activities (SIC), Fifth Edition, Report No. 09-90-02, was used to classify the statistical units in the survey. The SIC is based on the 1990 International Standard Industrial Classification of all Economic Activities (ISIC) with suitable adaptations for local conditions. Statistics in this publication are presented at SIC division (two-digit) level. Each enterprise is classified to the industry which reflects its predominant activity.
Collection rate 7 The preliminary collection rate for the survey on land transportation for October 2018 was 80,2%. The improved collection rate for September 2018 was 87,2%.
Statistical unit 8 The statistical unit for which information is compiled and published is an enterprise, defined as a legal unit or a combination of legal units that includes and directly controls all functions necessary to carry out its income activities. The statistical units are derived from and linked to the South African Revenue Service (SARS) administrative data.
Revised figures 9 Revised figures are mainly due to late submission of data to Stats SA, or respondents reporting revisions or corrections to their figures. Preliminary figures, as indicated in the relevant tables, are subject to change and when revised will not be indicated as such.
STATISTICS SOUTH AFRICA 11 P7162
Land transport, October 2018
Related publications
10 Users may also wish to refer to the following publication available from Stats SA –
Stats in Brief issued annually. Rounding-off of figures
11 Where figures have been rounded off, discrepancies may occur between sums of the component items and the totals.
Historical data 12 Historical land transport data are available on the Stats SA website. To access the data electronically, use the following link: Click to download historical data
Past publications 13 Past land transport releases are available on the Stats SA website. To access the
releases electronically, use the following link: Click to download past releases
Technical notes
Survey methodology and design
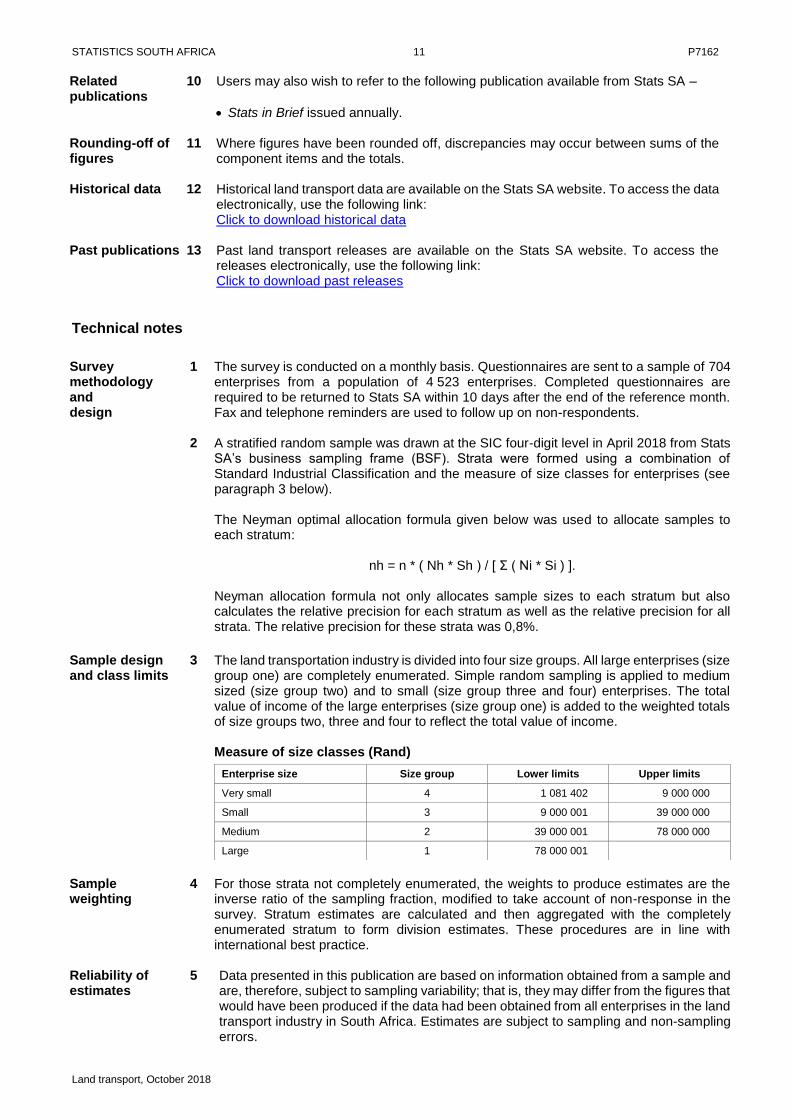
1 The survey is conducted on a monthly basis. Questionnaires are sent to a sample of 704 enterprises from a population of 4 523 enterprises. Completed questionnaires are required to be returned to Stats SA within 10 days after the end of the reference month. Fax and telephone reminders are used to follow up on non-respondents.
2 A stratified random sample was drawn at the SIC four-digit level in April 2018 from Stats SA’s business sampling frame (BSF). Strata were formed using a combination of Standard Industrial Classification and the measure of size classes for enterprises (see paragraph 3 below). The Neyman optimal allocation formula given below was used to allocate samples to each stratum:
nh = n * ( Nh * Sh ) / [ Σ ( Ni * Si ) ]. Neyman allocation formula not only allocates sample sizes to each stratum but also calculates the relative precision for each stratum as well as the relative precision for all strata. The relative precision for these strata was 0,8%.
Sample design and class limits
3 The land transportation industry is divided into four size groups. All large enterprises (size group one) are completely enumerated. Simple random sampling is applied to medium sized (size group two) and to small (size group three and four) enterprises. The total value of income of the large enterprises (size group one) is added to the weighted totals of size groups two, three and four to reflect the total value of income. Measure of size classes (Rand)
Enterprise size Size group Lower limits Upper limits
Very small 4 1 081 402 9 000 000
Small 3 9 000 001 39 000 000
Medium 2 39 000 001 78 000 000
Large 1 78 000 001
Sample weighting
4 For those strata not completely enumerated, the weights to produce estimates are the inverse ratio of the sampling fraction, modified to take account of non-response in the survey. Stratum estimates are calculated and then aggregated with the completely enumerated stratum to form division estimates. These procedures are in line with international best practice.
Reliability of estimates
5
Data presented in this publication are based on information obtained from a sample and are, therefore, subject to sampling variability; that is, they may differ from the figures that would have been produced if the data had been obtained from all enterprises in the land transport industry in South Africa. Estimates are subject to sampling and non-sampling errors.
Inaccuracies may occur because of imperfections in reporting by enterprises and errors made in the collection and processing of the data. Inaccuracies of this kind are referred to as non-sampling errors. Every effort is made to minimise non-sampling errors by careful design of questionnaires, testing them in pilot studies, editing reported data and implementing efficient operating procedures. Fluctuations may occur in consecutive months as a result of seasonal and economic factors.
Year-on-year percentage change
7 The year-on-year percentage change in a variable for any given period is the change between that period and the corresponding period of the previous year, expressed as a percentage of the latter.
Contribution (percentage points)
8 The contribution (percentage points) to the annual percentage change for any given period is calculated by multiplying the percentage change of each type of commodity/service by its corresponding weight, divided by 100. The weight is the percentage contribution of each type of commodity/service to total income in the corresponding period of the previous year.
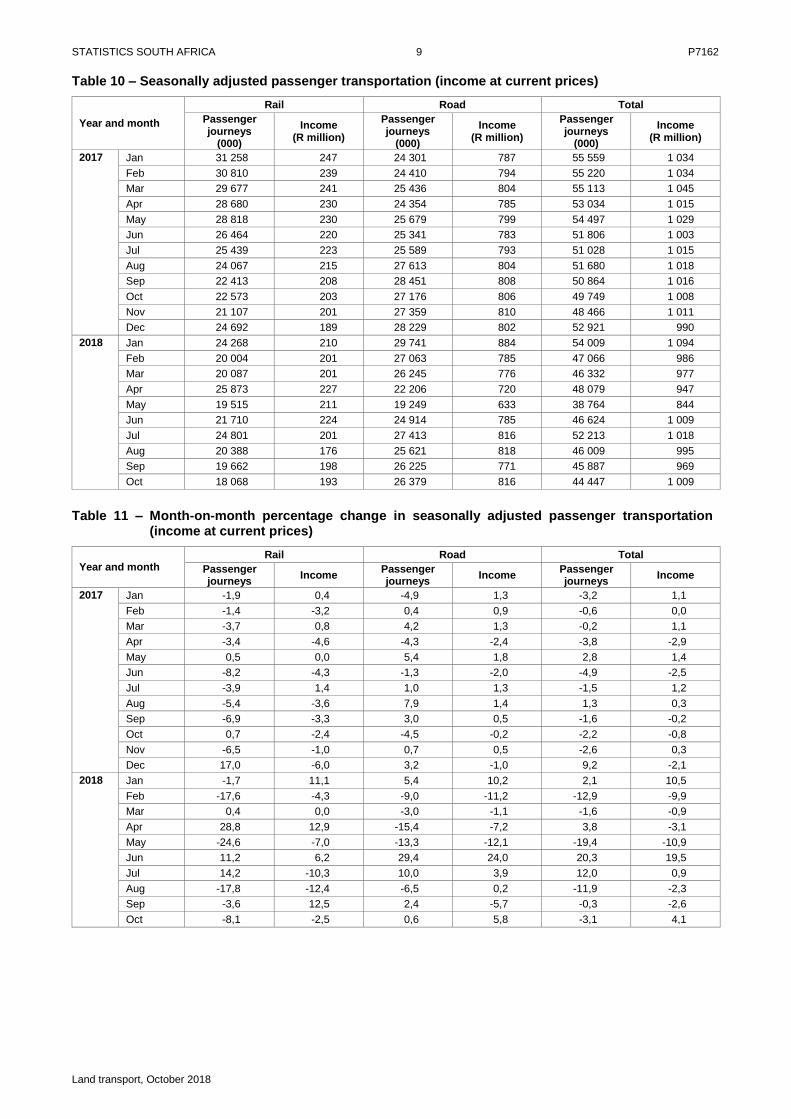
Seasonal adjustment
9 Seasonally adjusted estimates are generated each month using the X-12-ARIMA Seasonal Adjustment Program developed by the US Bureau of the Census. Seasonal adjustment is a means of removing the estimated effects of normal seasonal variation from the series so that the effects of other influences on the series can be recognised more clearly. Seasonal adjustment does not aim to remove irregular or non-seasonal influences which may be present in any particular month. Influences that are volatile or unsystematic can still make it difficult to interpret the movement of the series even after adjustment for seasonal variations. Therefore the month-to-month movements of seasonally adjusted estimates may not be reliable indicators of trend behaviour. The X-12-ARIMA procedure for land transportation is described in more detail on the Stats SA website at: Click to download seasonal adjustment land transport August 2017
Trend cycle 10 The trend is the long-term pattern or movement of a time series. The X-12-ARIMA
Seasonal Adjustment Program is used for smoothing seasonally adjusted estimates to estimates of the underlying trend cycle.
Glossary Enterprise An enterprise is a legal entity or a combination of legal units that includes and directly
controls all functions necessary to carry out its activities.
Industry An industry is made up of enterprises engaged in the same or similar kinds of economic activity. Industries are defined in the System of National Accounts (SNA) in the same way as in the Standard Industrial Classification of all Economic Activities (SIC), Fifth Edition, Report No. 09-90-02 of January 1993.
Symbols and abbreviations
BSF Business sampling frame GDP Gross domestic product ISIC International Standard Industrial Classification SIC Standard Industrial Classification of all Economic Activities SARS South African Revenue Service Stats SA Statistics South Africa VAT Value added tax
Stats SA publishes approximately 300 different statistical releases each year. It is not economically viable to produce them in more than one of South Africa's eleven official languages. Since the releases are used extensively, not only locally but also by international economic and social-scientific communities, Stats SA releases are published in English only. Stats SA has copyright on this publication. Users may apply the information as they wish, provided that they acknowledge Stats SA as the source of the basic data wherever they process, apply, utilise, publish or distribute the data: and also that they specify that the relevant application and analysis (where applicable) result from their own processing of the data.
Advance release calendar A release calendar is disseminated on www.statssa.gov.za Stats SA products A complete set of Stats SA publications is available at the Stats SA Library and the following libraries: National Library of South Africa, Pretoria Division National Library of South Africa, Cape Town Division Natal Society Library, Pietermaritzburg Library of Parliament, Cape Town Bloemfontein Public Library Johannesburg Public Library Eastern Cape Library Services, King William’s Town Central Regional Library, Polokwane Central Reference Library, Mbombela Central Reference Collection, Kimberley Central Reference Library, Mmabatho Stats SA also provides a subscription service. Electronic services A large range of data is available via online services. For more detail about our electronic services, contact Stats SA’s user information service at (012) 310 8600.
You can visit us on the internet at: www.statssa.gov.za General enquiries User information services Telephone number: (012) 310 8600 Email address: [email protected] Postal address Private Bag X44, Pretoria, 0001