IPCC NGGIP Technical Support Unit Inventory Internship Land-Use Changes and Greenhouse Gas Fluxes: Scientific Understanding and Contribution to Improving Methodologies for Greenhouse Gas Inventory in BENIN G.H. Sabin Guendehou Under the Supervision of Dr. Harold Simon Eggleston, Head Technical Support Unit IPCC National Greenhouse Gas Inventories Programme This document should be referenced as: Guendehou, G.H.S. (2006) Land-Use Changes and Greenhouse Gas Fluxes: Scientific Understanding and Contribution to Improving Methodologies for Greenhouse Gas Inventory in BENIN IGES, Hayama, Japan, 112 pp Japan, 2005-2006 Institute for Global Environmental Strategies 財団法人 地球環境戦略研究機関
Transcript
IPCC NGGIP Technical Support Unit Inventory Internship
Land-Use Changes and Greenhouse Gas Fluxes: Scientific Understanding and Contribution to Improving Methodologies
for Greenhouse Gas Inventory in BENIN
G.H. Sabin Guendehou
Under the Supervision of
Dr. Harold Simon Eggleston, Head Technical Support Unit IPCC National Greenhouse Gas Inventories Programme
This document should be referenced as: Guendehou, G.H.S. (2006)
Land-Use Changes and Greenhouse Gas Fluxes: Scientific Understanding and Contribution to Improving Methodologies for Greenhouse Gas Inventory in BENIN
IGES, Hayama, Japan, 112 pp
Japan, 2005-2006
Institute for Global Environmental Strategies 財団法人 地球環境戦略研究機関
Land-Use Changes and Greenhouse Gas Fluxes: Scientific Understanding and Contribution to Improving Methodologies for Greenhouse Gas Inventory in BENIN
Land-Use Changes and Greenhouse Gas Fluxes: Scientific Understanding and Contribution to Improving Methodologies for Greenhouse Gas Inventory in BENIN
IPCC NGGIP TSU Inventory Internship 3
Preface The Institute for Global Environmental Strategies (IGES), through the funding of the Government of Japan, has launched, since 2003, an internship programme entitled “TSU Inventory Internship” towards mainly young experts/researchers/scientists from developing countries and countries with economy in transition (EIT) in the view of providing them with opportunities to deepen their knowledge/experience or to familiarise themselves with the IPCC methodologies for national greenhouse gas inventories, through applied studies, for a period of six months to one year. The current report is the product of the research I conducted during my internship period from 28 January 2005 to 27 January 2006 in the Technical Support Unit for the National Greenhouse Gas Inventories Programme of the Intergovernmental Panel of Climate Change (IPCC NGGIP TSU) based in the IGES. The report presents the results/findings of the development of the theme “Land Use Changes and Greenhouse Gas Fluxes: Scientific Understanding and Contribution to Improving Methodologies for Greenhouse Gas Inventory in BENIN”.
Land-Use Changes and Greenhouse Gas Fluxes: Scientific Understanding and Contribution to Improving Methodologies for Greenhouse Gas Inventory in BENIN
IPCC NGGIP TSU Inventory Internship 4
Land-Use Changes and Greenhouse Gas Fluxes: Scientific Understanding and Contribution to Improving Methodologies for Greenhouse Gas Inventory in BENIN
IPCC NGGIP TSU Inventory Internship 5
Contents
Page PREFACE ……………………………………………………………………………………………………... 3 ACKNOWLEDGEMENT ……………………………………………………………………………………. 7 ABBREVIATIONS AND ACRONYMS …………………………………………………………………….. 9 TABLES ……………………………………………………………………………………………………….. 11 BOXES, EQUATIONS, MAPS, FIGURES…………………………………………………………………... 15 SUMMARY ……………………………………………………………………………………………………. 17 Chapter 1 INTRODUCTION …………………………………………………………………………………………….. 19 1.1 Some general information on Benin ………………………………………………………………………... 19 1.2 Background of the study ……………………………………………………………………………………. 20 1.3 Objectives of the study ……………………………………………………………………………………... 22 1.4 Scope and coverage ……………………………………………………………………………………….... 22 1.5 Approach to the study ………………………………………………………………………………………. 22 1.6 Structure of the report ………………………………………………………………………………………. 23 Chapter 2 LAND USE, LAND-USE CHANGE AND FORESTRY SECTOR IN BENIN …………………………… 24 2.1 Overview of Land Use Categories in Benin ……………………………………………………………....... 24 2.2 Factors responsible for land-use changes in Benin…………………………………………………………. 26 2.3 Overall information status and needs……………………………………………………………………….. 28 Chapter 3 REVISED 1996 GUIDELINES AND GPG LULUCF APPLIED TO BENIN ……………………………. 29 3.1 Estimate of land area for each relevant land-use category …………………………………………………. 29 3.2 Estimate of greenhouse gas emissions and removals from different land-use categories ………………….. 34 3.2.1 Forest land ………………………………………………………………………………………. 34 3.2.1.1 Forest land remaining forest land ……………………………………………………. 34 3.2.1.2 Land converted to forest land ………………………………………………………... 52 3.2.2 Cropland ………………………………………………………………………………………… 55 3.2.2.1 Cropland remaining cropland ………………………………………………………... 56 3.2.2.2 Land converted to cropland ………………………………………………………….. 66 3.2.3 Grassland ………………………………………………………………………………………... 70 3.2.3.1 Grassland remaining grassland ………………………………………………………. 70 3.2.3.2 Land converted to grassland …………………………………………………………. 77 3.2.4 Other lands ……………………………………………………………………………………… 80 3.2.5 Compilation of estimates ………………………………………………………………………... 81 3.3 Cross-cutting Issues ………………………………………………………………………………………… 81 3.3.1 Uncertainty estimate... ………………………………………………………………………… 81 3.3.2 Other cross-cutting issues ……………………………………………………………………….. 82 3.4 Use of decision trees to identify appropriate tiers for subcategories ……………………………………….. 88 3.5 Reporting of estimates of greenhouse gas emissions and removals….……………………………………... 88 Chapter 4 CONCLUSIONS AND RECOMMENDATIONS …………………………………………………………... 89 4.1 Key findings ………………………………………………………………………………………………... 89 4.2 Follow-up …………………………………………………………………………………………………… 89
ANNEX I: TSU Inventory Internship Research Proposal…………………………………………………... 93 ANNEX II: Some information generated by the desk-data collection……………………………………... 95 ANNEX III: Overview of statistical parameters for PDF…………………………………………………... 101 ANNEX IV: Spreadsheet for @RISK: example for forest land remaining forest land…………………… 109 ANNEX V: Simulation results: example for CO2 emissions from forest land remaining forest land……. 111
Land-Use Changes and Greenhouse Gas Fluxes: Scientific Understanding and Contribution to Improving Methodologies for Greenhouse Gas Inventory in BENIN
IPCC NGGIP TSU Inventory Internship 6
Land-Use Changes and Greenhouse Gas Fluxes: Scientific Understanding and Contribution to Improving Methodologies for Greenhouse Gas Inventory in BENIN
IPCC NGGIP TSU Inventory Internship 7
Acknowledgements The internship would not be possible without the launch of the “TSU Inventory Internship” programme by the Institute for Global Environmental Strategies and the funding from the Japanese Government. My first and sincere thanks are addressed to the Japanese Government and this important Institute “IGES” through the Chair of IGES Board of Directors Professor Akio Morishima, the Co-Chair of IPCC Inventories Task Force Bureau Taka Hiraishi, also Member of Board of Directors of IGES. The success of the internship and the achieving of the outcomes of my research have been made possible thanks to fruitful assistance, guidance and technical support as well as excellent work environment provided by the Technical Support Unit for the IPCC NGGIP. In this regard, I wish to sincerely thank the TSU Head Simon Eggleston, Programme Officers Todd Ngara, Kyoko Miwa, Leandro Buendia and Kiyoto Tanabe, Project Secretary Masako Abe, Administrative Assistant Ayako Hongo and IT Officer Toru Matsumoto. Thanks to the authorities of my country, specially the Ministry of Higher Education and Scientific Research and the Director General of Benin Centre for Scientific and Technical Research to which I belong, for giving me the permission to come to Japan in order to implement my research project. I wish to thank my wife Evelyne Tchiakpe for her moral support and for taking care of, among other things, our two daughters. Finally, I would like to thank all my colleagues of IGES for having friendly feelings towards me.
Land-Use Changes and Greenhouse Gas Fluxes: Scientific Understanding and Contribution to Improving Methodologies for Greenhouse Gas Inventory in BENIN
IPCC NGGIP TSU Inventory Internship 8
Land-Use Changes and Greenhouse Gas Fluxes: Scientific Understanding and Contribution to Improving Methodologies for Greenhouse Gas Inventory in BENIN
IPCC NGGIP TSU Inventory Internship 9
Abbreviations and acronyms a+bgr. above and below ground EIT Economy in Transition CENATEL Centre National de Teledetection et de Surveillance du Couvert Forestier / National Centre for
Remote Sensing and Forest Cover Monitoring COP Conference of Parties DDA Djidja-Dan-Atcherigbe dm dry matter DOM Dead Organic Matter EFDB Emission Factors Data Base FAO Food and Agriculture Organisation of the United Nations FRA Forest Resources Assessment GDP Gross Domestic Product GHG Greenhouse Gas GNI Gross National Income GPG Good Practice Guidance ha hectare IGBP International Geosphere Biosphere Programme IGES Institute for Global Environmental Strategies IPCC Intergovernmental Panel on Climate Change JICA Japan International Cooperation Agency LUC Land-Use Category LULUCF Land Use, Land-Use Change and Forestry NGGIP National Greenhouse Gas Inventories Programme OS Oueme Superieur PAGE Pilot Analysis of Global Ecosystems PDF Probability Distribution Function PGFTR Programme de Gestion des Forets et Terroirs Riverains / Programme of Management of Forests
and Riparian Land QA/QC Quality Assurance/Quality Control SOC Soil Organic Carbon SPOT Système Probatoire d’Observation de la Terre tC tonne carbon tdm tonne dry matter TSU Technical Support Unit TTK Tchaourou-Toui-Kilibo UK United Kingdom UNDP United Nations Development Programme UNEP United Nations Environment Programme UNFCCC United Nations Framework Convention on Climate Change WRI World Resources Institute WRB World Reference Base for Soil Resources yr Year
Land-Use Changes and Greenhouse Gas Fluxes: Scientific Understanding and Contribution to Improving Methodologies for Greenhouse Gas Inventory in BENIN
IPCC NGGIP TSU Inventory Internship 10
Land-Use Changes and Greenhouse Gas Fluxes: Scientific Understanding and Contribution to Improving Methodologies for Greenhouse Gas Inventory in BENIN
IPCC NGGIP TSU Inventory Internship 11
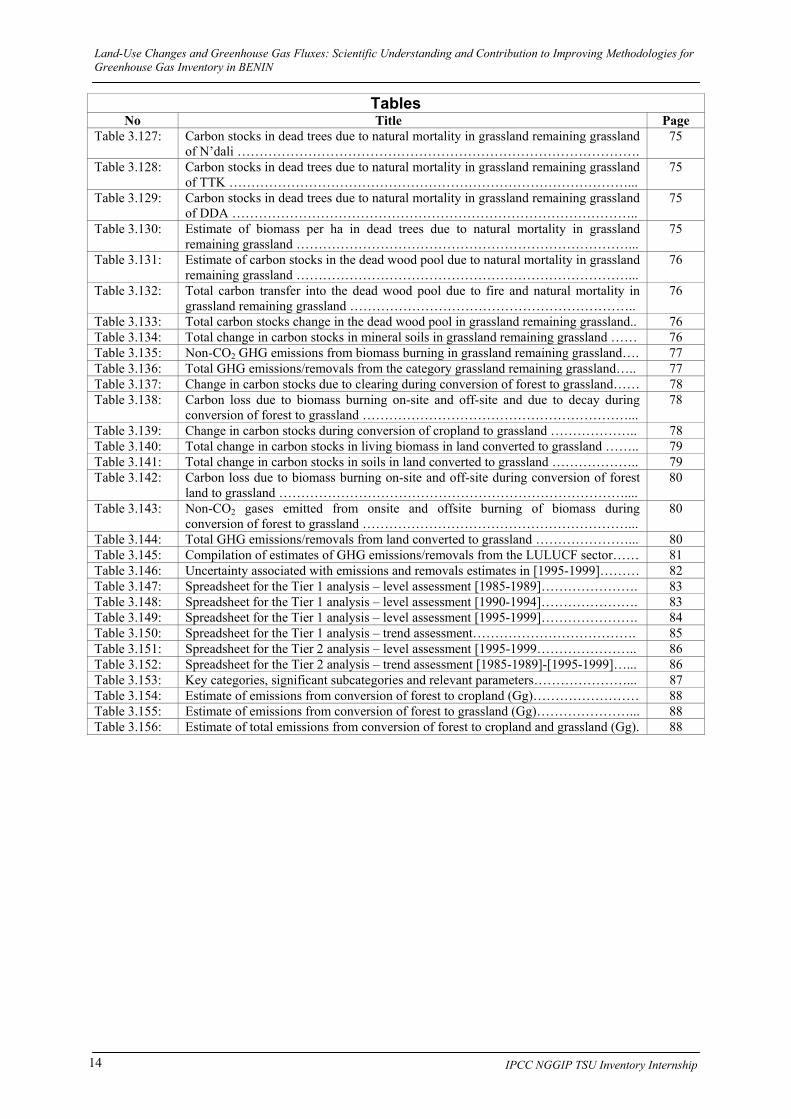
Tables No Title Page
Table 2.1: National classification of land-use categories ………………………………………... 24 Table 2.2: Definitions of national classes of land-use categories ………………………………... 25 Table 2.3: Definition of land-use categories according to FAO ………………………………..... 26 Table 2.4: Forest and other wooded lands cover in West Africa in 2000 ………………………... 27 Table 2.5: Consumption of wood for energy in Benin …………………………………………... 27 Table 2.6: Production of industrial roundwood in Benin ………………………………………... 28 Table 3.1: Area of land-use categories in Benin in 1995 ………………………………………… 29 Table 3.2: Comparison of LUC areas between 1978 and 1998 ………………………………….. 29 Table 3.3: Annual change in land area …………………………………………………………... 30 Table 3.4: Estimate of land areas for different years …………………………………………….. 30 Table 3.5: Area of forest land converted to cropland ……………………………………………. 31 Table 3.6: Conversion of grassland …………………………………………………………….... 32 Table 3.7: Land-Use Change Matrix for [1985-1989] …………………………………………… 32 Table 3.8: Land-Use Change Matrix for [1990-1994] …………………………………………… 33 Table 3.9: Land-Use Change Matrix for [1995-1999] ………………………………………….... 33 Table 3.10: Deviations in figures in land-use matrices …………………………………………... 33 Table 3.11: Estimate of biomass per hectare in land-use categories of Sota and Goungoun in
1994 …………………………………………………………………………………... 35
Table 3.12: Estimate of total biomass stocks in land-use categories of Sota and Goungoun in 1994 …………………………………………………………………………………...
35
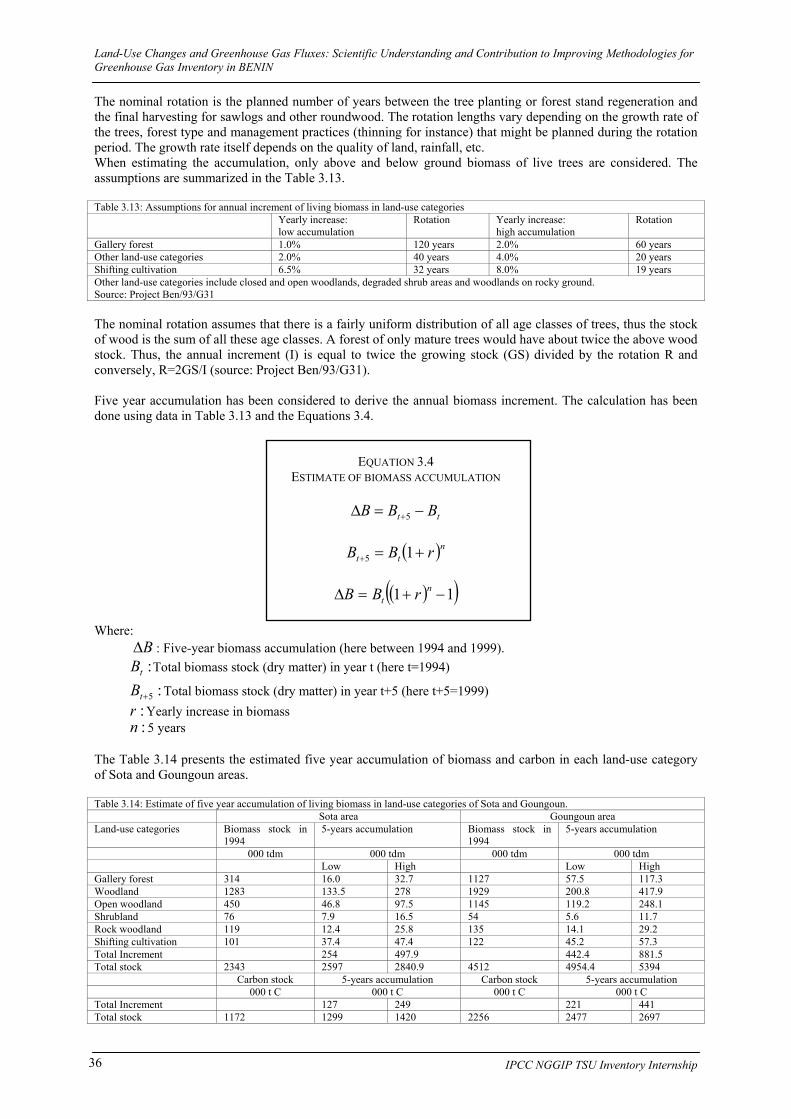
Table 3.13: Assumptions for annual increment in living biomass in land-use categories ………… 36 Table 3.14: Estimate of five year accumulation of living biomass in land-use categories of Sota
and Goungoun ………………………………………………………………………… 36
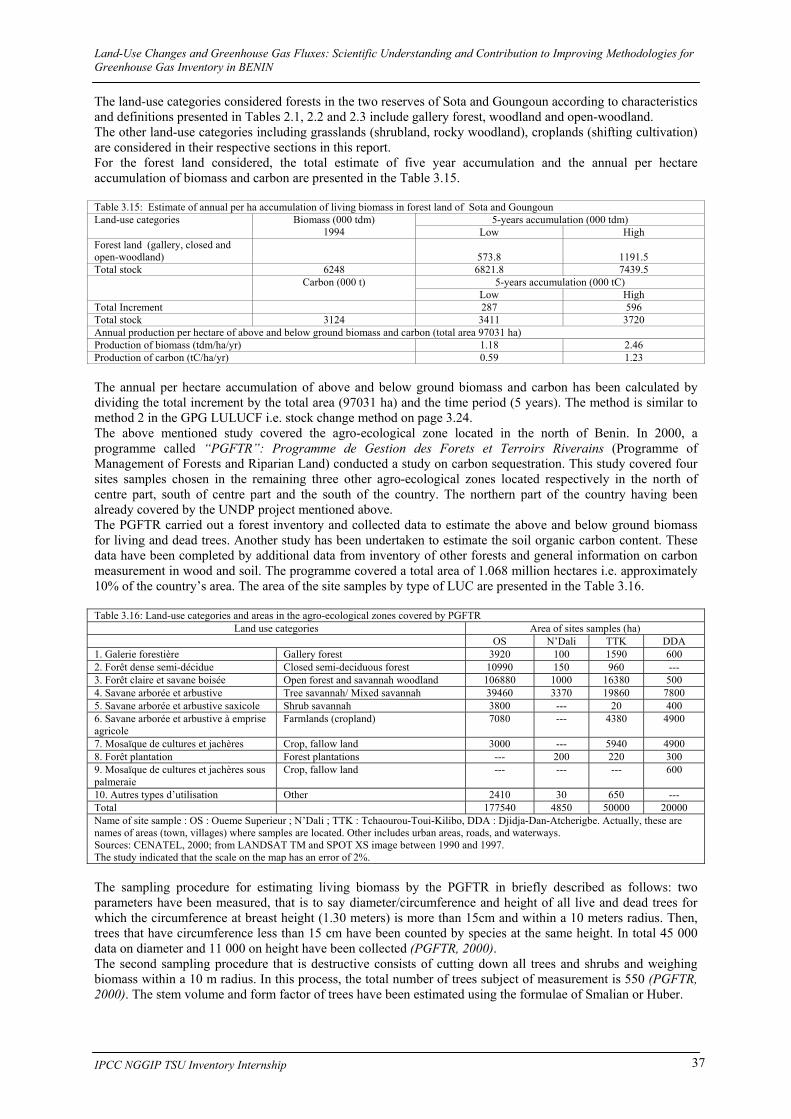
Table 3.15: Estimate of annual per ha accumulation of living biomass in forest land of Sota and Goungoun ……………………………………………………………………………..
37
Table 3.16: Land-use categories and areas in the agro-ecological zones covered by PGFTR…….. 37 Table 3.17: Estimate of living biomass in forest land of Oueme Superieur……………………….. 38 Table 3.18: Estimate of living biomass in forest land of N’dali…………………………………… 38 Table 3.19: Estimate of living biomass in forest land of TTK…………………………………….. 39 Table 3.20: Estimate of living biomass in forest land of DDA……………………………………. 39 Table 3.21: Summary of estimate of living biomass in forest land of OS, N’dali, TTK, DDA….... 39 Table 3.22: Summary of estimate of living biomass in forest land of Sota and Goungoun……….. 40 Table 3.23: Estimate of five years and annual per ha accumulation of living biomass in forest
land of OS, N’dali, TTK, and DDA together ……………………………………….... 40
Table 3.24: Summary of annual per ha accumulation of above and below ground biomass in forest land ……………………………………………………………………………..
40
Table 3.25: Estimate of total increase in carbon stocks due to biomass increment in forest land.... 40 Table 3.26: Estimate of production of industrial round wood for different time period…………... 41 Table 3.27: Loss of carbon due to commercial fellings …………………………………………… 41 Table 3.28: Estimate of fuelwood gathered for different time period …………………………….. 41 Table 3.29: Total loss of carbon due to fuelwood gathering for all land-use categories…………... 41 Table 3.30: Distribution of fuelwood gathered between the different land-use categories………... 41 Table 3.31: Loss of carbon due to fuelwood gathering from forest land remaining forest land…... 42 Table 3.32: Land area burned per month in 2000 in Benin………………………………………... 42 Table 3.33: Land area burned for broad land-use category………………………………………... 42 Table 3.34: Carbon loss due to fire in forest land remaining forest land …………………………. 43 Table 3.35: Total decrease in carbon stocks due to biomass loss in forest land remaining forest
land ………………………………………………………………………………….... 43
Table 3.36: Total change in carbon stocks in living biomass in forest land remaining forest land... 43 Table 3.37: Carbon transfer into dead wood pool from commercial fellings in forest land
remaining forest land …………………………………………………………………. 44
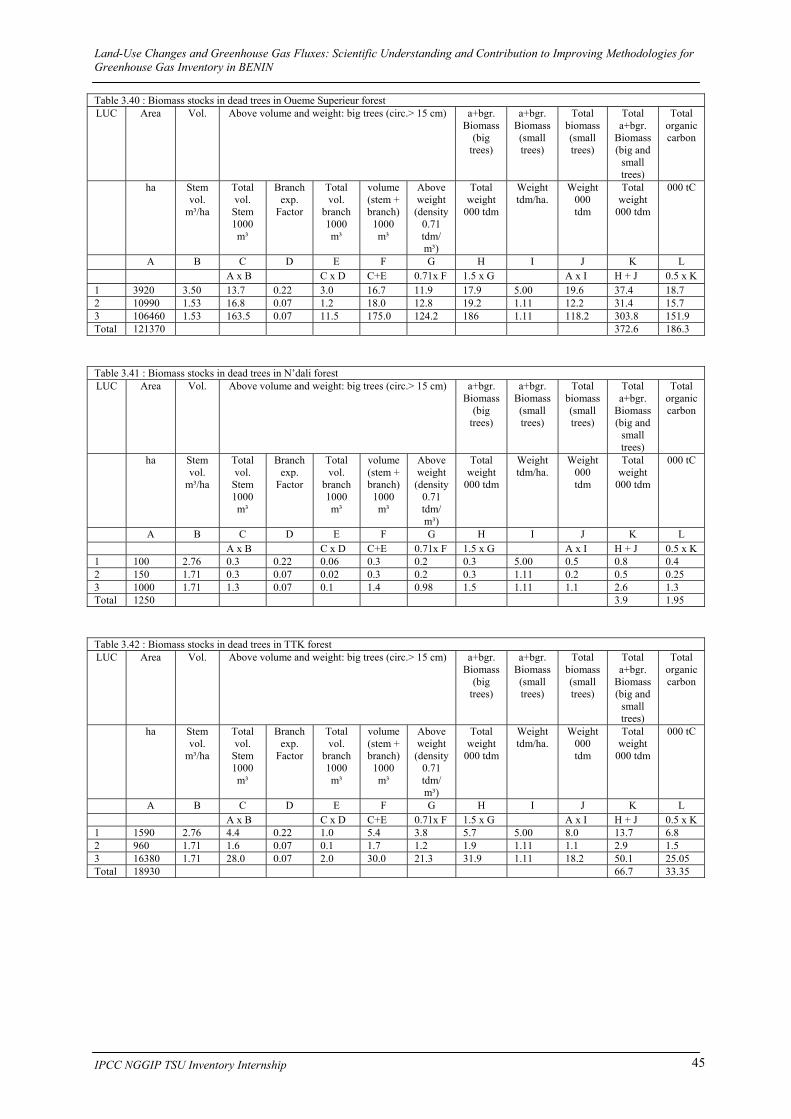
Table 3.38: Carbon transfer into dead wood pool from fires in forest land remaining forest land... 44 Table 3.39: Biomass stocks in dead trees in Sota and Goungoun forests…………………………. 44 Table 3.40 : Biomass stocks in dead trees in Oueme Superieur forest……………………………... 45 Table 3.41 : Biomass stocks in dead trees in N’dali forest……………………………………….... 45 Table 3.42 : Biomass stocks in dead trees in TTK forest…………………………………………... 45 Table 3.43: Biomass stocks in dead trees in DDA forest………………………………………….. 46
Land-Use Changes and Greenhouse Gas Fluxes: Scientific Understanding and Contribution to Improving Methodologies for Greenhouse Gas Inventory in BENIN
IPCC NGGIP TSU Inventory Internship 12
Tables No Title Page
Table 3.44: Table 3.44: Summary of biomass stocks in dead trees due to natural mortality in forest land considered ………………………………………………………………...
46
Table 3.45: Estimate of carbon stocks in dead trees due to natural mortality in forest land remaining forest land ………………………………………………………………….
46
Table 3.46: Total carbon transfer into the dead wood pool in forest land remaining forest land….. 46 Table 3.47: Change in carbon stocks in dead wood in forest land remaining forest land…………. 47 Table 3.48: Change in carbon stocks in litter ……………………………………………………... 47 Table 3.49: Total change in carbon stocks in dead organic matter in forest land remaining forest
land ………………………………………………………………………………….... 47
Table 3.50: Estimate of SOC stocks in land-use categories of Sota and Goungoun forests………. 48 Table 3.51: Estimate of SOC stocks in land-use categories of OS forest…………………………. 48 Table 3.52: Estimate of SOC stocks in land-use categories of N’dali…………………………….. 49 Table 3.53: Estimate of SOC stocks in land-use categories of TTK………………………………. 49 Table 3.54: Estimate of SOC stocks in land-use categories of DDA…………………………….... 49 Table 3.55: Summary of SOC stocks per ha in land-use categories in different agro-ecological
zones…………………………………………………………………………………... 49
Table 3.56: Estimate of annual per ha accumulation of SOC in forest land remaining forest land in Sota and Goungoun ………………………………………………………………...
50
Table 3.57: Estimate of annual per ha accumulation of SOC in forest land remaining forest land in OS, N’dali, TTK, DDA …………………………………………………………….
50
Table 3.58: Change in carbon stocks in mineral soils in forest land remaining forest land……….. 50 Table 3.59: Estimate of total change in carbon stocks in forest land remaining forest land and
emissions/removals of CO2 ………………………………………………………….... 50
Table 3.60: Consumption of fertilizer in Benin …………………………………………………... 51 Table 3.61: Non-CO2 GHG emissions from biomass burning in forest land remaining forest land. 51 Table 3.62: Total emissions/removals of GHG from forest land remaining forest land ………….. 51 Table 3.63: Distribution of land converted to forest land between plantation and natural
regeneration …………………………………………………………………………... 52
Table 3.64: Increase in carbon stocks in living biomass in land converted to forest land ………... 52 Table 3.65: Loss of carbon due to fuelwood gathering in land converted to forest land………….. 53 Table 3.66: Loss of carbon due to fire in land converted to forest land………………………….... 53 Table 3.67: Total change in carbon stocks in living biomass in land converted to forest land……. 53 Table 3.68: Accumulation of biomass in dead trees in plantation ………………………………… 53 Table 3.69: Transfer of carbon into the dead wood pool due to natural mortality in land
converted to forest land ………………………………………………………………. 54
Table 3.70: Change in carbon stocks in the dead wood pool in land converted to forest land ….... 54 Table 3.71: SOC stocks in plantation ……………………………………………………………... 54 Table 3.72: Total change in carbon stocks in mineral soils in land converted to forest land…….... 55 Table 3.73: Non-CO2 GHG emissions from biomass burning in land converted to forest land…... 55 Table 3.74: Total emissions/removals of GHG for land converted to forest land……………….... 55 Table 3.75: Estimate of annual per ha accumulation of living biomass in cropland of Sota and
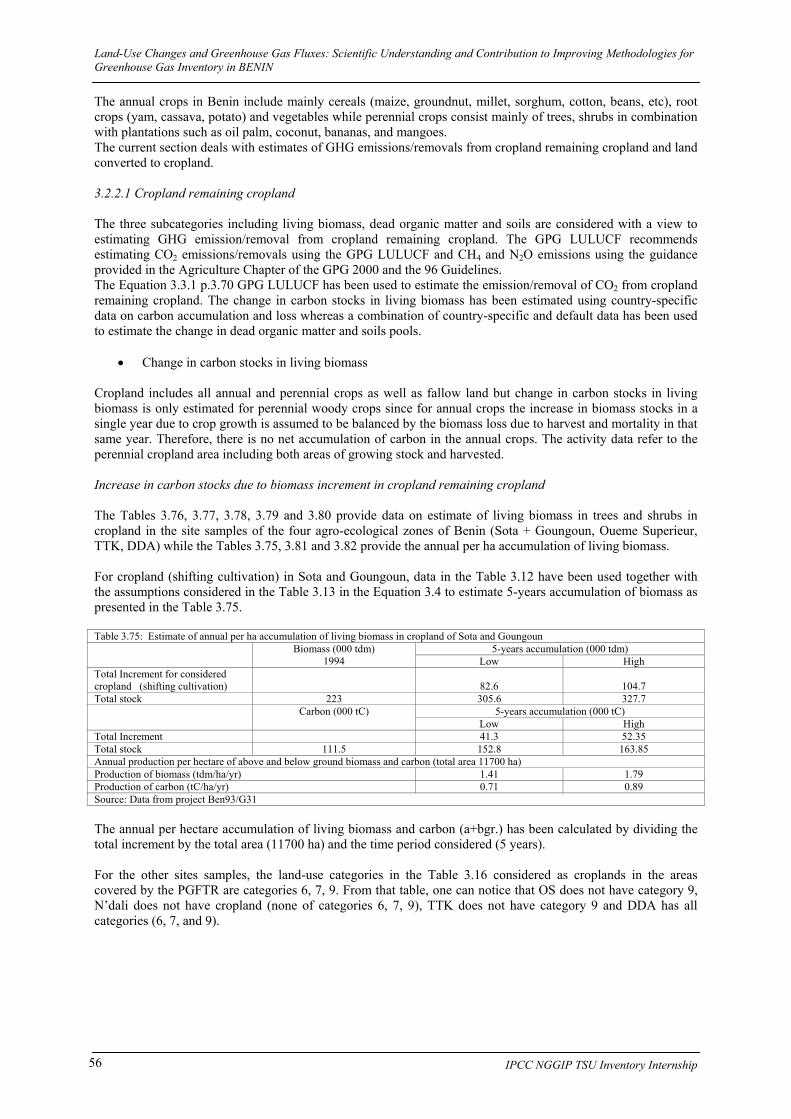
Goungoun …………………………………………………………………………….. 56
Table 3.76 : Estimate of living biomass in cropland of Oueme Superieur ……………………….... 57 Table 3.77 : Estimate of living biomass in cropland of TTK …………………………………….... 57 Table 3.78 : Estimate of living biomass in cropland of DDA ……………………………………... 57 Table 3.79: Summary of estimates of living biomass in cropland of areas covered by PGFTR…... 58 Table 3.80: Summary of estimates of living biomass in cropland of areas covered by the project
Ben93/G31 ………………………………………………………………………….... 58
Table 3.81: Estimate of annual per ha accumulation of living biomass in cropland of OS, TTK, DDA …………………………………………………………………………………..
58
Table 3.82: Summary of annual per ha accumulation of living biomass in cropland of considered areas …………………………………………………………………….......................
58
Table 3.83: Areas of the main annual croplands in Benin ………………………………………… 59 Table 3.84: Distribution of land area between annual and perennial crops ……………………….. 59 Table 3.85: Total increase in carbon stocks due to biomass increment in perennial crops in
Table 3.86: Loss of carbon due to fuelwood gathering from cropland remaining cropland …… 59
Land-Use Changes and Greenhouse Gas Fluxes: Scientific Understanding and Contribution to Improving Methodologies for Greenhouse Gas Inventory in BENIN
IPCC NGGIP TSU Inventory Internship 13
Tables No Title Page
Table 3.87: Loss of carbon due to fire in cropland remaining cropland …………………………... 60 Table 3.88: Total decrease in carbon stocks in living biomass in cropland remaining cropland….. 60 Table 3.89: Total change in carbon stocks in living biomass in cropland remaining cropland….... 60 Table 3.90: Carbon transfer into dead wood pool due to fire in cropland remaining cropland…... 61 Table 3.91: Estimate of carbon stocks in dead trees due to natural mortality in cropland
remaining cropland of Sota and Goungoun …………………………………………... 61
Table 3.92 : Estimate of carbon stocks in dead trees due to natural mortality in cropland remaining cropland of Oueme Superieur ……………………………………………..
61
Table 3.93: Estimate of carbon stocks in dead trees due to natural mortality in cropland remaining cropland of TTK …………………………………………………………...
61
Table 3.94: Estimate of carbon stocks in dead trees due to natural mortality in cropland remaining cropland of DDA …………………………………………………………..
62
Table 3.95: Summary of estimate of carbon stocks in dead trees due to natural mortality in cropland remaining cropland ………………………………………………………….
62
Table 3.96: Carbon transfer into the dead wood pool from natural mortality of trees in cropland remaining cropland …………………………………………………………………....
62
Table 3.97: Total carbon transfer into the dead wood pool from fire and natural mortality………. 62 Table 3.98: Change in carbon stocks in the dead wood pool in cropland remaining cropland…… 62 Table 3.99: Classification and characteristics of soils in Benin …………………………………... 63 Table 3.100: Distribution of land area between annual crops …………………………………….... 65 Table 3.101: Changes in carbon stocks in soils in cropland remaining cropland ………………….. 66 Table 3.102: Total emissions/removals of GHG from cropland remaining cropland …………….... 66 Table 3.103: Change in carbon stocks due to clearing during conversion of forest to cropland …… 67 Table 3.104: Carbon loss due to biomass burning on-site and off-site and from decay during
conversion of forest to cropland …………………………………………………….... 67
Table 3.105: Change in carbon stocks due to clearing during conversion of grassland to cropland... 67 Table 3.106: Carbon loss due to biomass burning on-site and off-site and from decay during
conversion of grassland to cropland ……………………………………….................. 68
Table 3.107: Total change in carbon stocks in soils in land converted to cropland ………………... 68 Table 3.108: Total N2O emissions from mineral soils in land converted to cropland ……………… 69 Table 3.109: Total carbon loss due to biomass burned on-site and off-site during conversion of
forest and grassland to cropland …………………………………………………….... 69
Table 3.110: Non-CO2 gas emissions from onsite and offsite burning of biomass during conversion of forest and grassland to cropland ……………………………………….
69
Table 3.111: Total GHG emissions from land converted to cropland……....................................... 70 Table 3.112: Estimate of annual per ha accumulation of living biomass in grassland of Sota and
Goungoun …………………………………………………………………………….. 70
Table 3.113: Estimate of living biomass in grassland of Oueme Superieur ……………………….. 71 Table 3.114: Estimate of living biomass in grassland of N’dali ………………………………….... 71 Table 3.115: Estimate of living biomass in grassland of TTK ……………………………………... 71 Table 3.116: Estimate of living biomass in grassland of DDA …………………………………….. 72 Table 3.117: Summary of estimate of living biomass per ha in grassland in areas covered by the
Table 3.118: Summary of estimate of living biomass per ha in grassland in areas covered by the PGFTR ………………………………………………………………………………..
72
Table 3.119: Estimate of annual per ha accumulation of living biomass in grassland remaining grassland of OS, N’dali, TTK, DDA ………………………………………………….
72
Table 3.120: Summary of annual per ha accumulation of living biomass in grassland remaining grassland of all areas considered ……………………………………………………...
73
Table 3.121: Total increase in carbon stocks in living biomass in grassland remaining grassland.... 73 Table 3.122: Loss of carbon due to fuelwood gathering from grassland remaining grassland …….. 73 Table 3.123: Total decrease in carbon stocks in living biomass of grassland remaining grassland… 73 Table 3.124: Total change in carbon stocks in living biomass in grassland remaining grassland …. 74 Table 3.125: Carbon stocks in dead trees due to natural mortality in grassland remaining grassland
of Sota and Goungoun ………………………………………………………………... 74
Table 3.126: Carbon stocks in dead trees due to natural mortality in grassland remaining grassland of Oueme Superieur …………………………………………………………………...
74
Land-Use Changes and Greenhouse Gas Fluxes: Scientific Understanding and Contribution to Improving Methodologies for Greenhouse Gas Inventory in BENIN
IPCC NGGIP TSU Inventory Internship 14
Tables No Title Page
Table 3.127: Carbon stocks in dead trees due to natural mortality in grassland remaining grassland of N’dali ……………………………………………………………………………….
75
Table 3.128: Carbon stocks in dead trees due to natural mortality in grassland remaining grassland of TTK ………………………………………………………………………………...
75
Table 3.129: Carbon stocks in dead trees due to natural mortality in grassland remaining grassland of DDA ………………………………………………………………………………..
75
Table 3.130: Estimate of biomass per ha in dead trees due to natural mortality in grassland remaining grassland …………………………………………………………………...
75
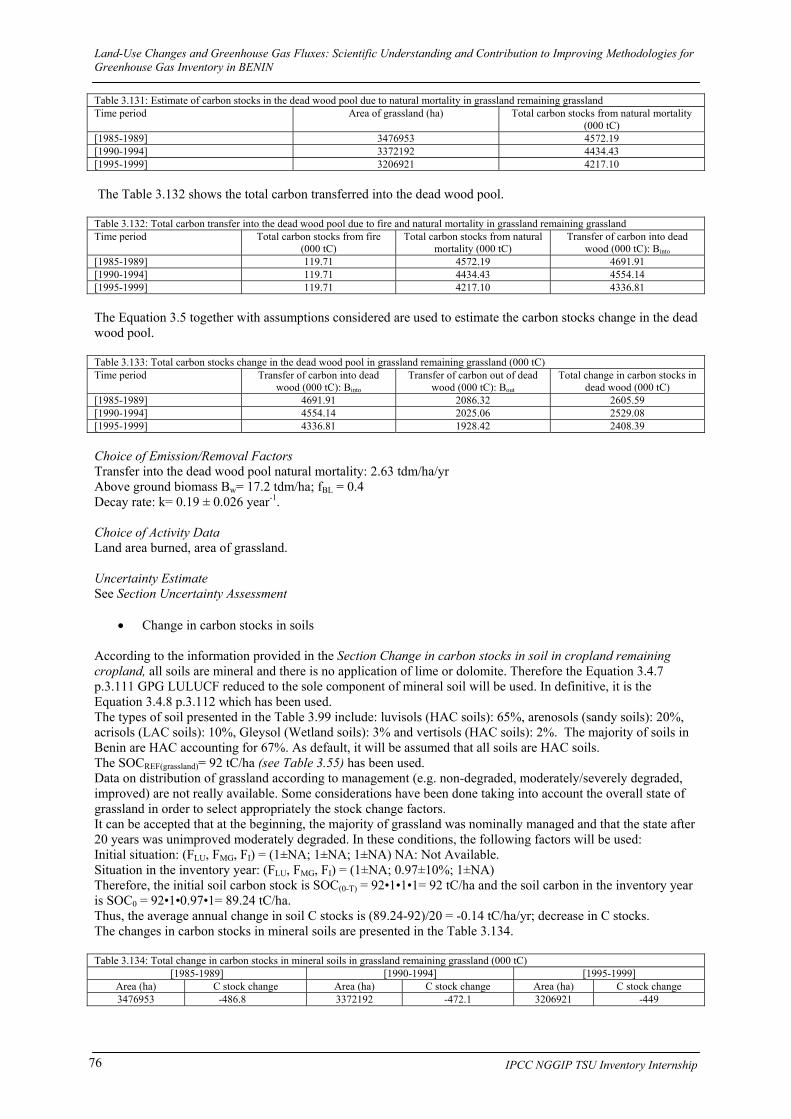
Table 3.131: Estimate of carbon stocks in the dead wood pool due to natural mortality in grassland remaining grassland …………………………………………………………………...
76
Table 3.132: Total carbon transfer into the dead wood pool due to fire and natural mortality in grassland remaining grassland ………………………………………………………..
76
Table 3.133: Total carbon stocks change in the dead wood pool in grassland remaining grassland.. 76 Table 3.134: Total change in carbon stocks in mineral soils in grassland remaining grassland …… 76 Table 3.135: Non-CO2 GHG emissions from biomass burning in grassland remaining grassland…. 77 Table 3.136: Total GHG emissions/removals from the category grassland remaining grassland….. 77 Table 3.137: Change in carbon stocks due to clearing during conversion of forest to grassland…… 78 Table 3.138: Carbon loss due to biomass burning on-site and off-site and due to decay during
conversion of forest to grassland ……………………………………………………... 78
Table 3.139: Change in carbon stocks during conversion of cropland to grassland ……………….. 78 Table 3.140: Total change in carbon stocks in living biomass in land converted to grassland …….. 79 Table 3.141: Total change in carbon stocks in soils in land converted to grassland ……………….. 79 Table 3.142: Carbon loss due to biomass burning on-site and off-site during conversion of forest
land to grassland …………………………………………………………………….... 80
Table 3.143: Non-CO2 gases emitted from onsite and offsite burning of biomass during conversion of forest to grassland ……………………………………………………...
80
Table 3.144: Total GHG emissions/removals from land converted to grassland …………………... 80 Table 3.145: Compilation of estimates of GHG emissions/removals from the LULUCF sector…… 81 Table 3.146: Uncertainty associated with emissions and removals estimates in [1995-1999]……… 82 Table 3.147: Spreadsheet for the Tier 1 analysis – level assessment [1985-1989]…………………. 83 Table 3.148: Spreadsheet for the Tier 1 analysis – level assessment [1990-1994]…………………. 83 Table 3.149: Spreadsheet for the Tier 1 analysis – level assessment [1995-1999]…………………. 84 Table 3.150: Spreadsheet for the Tier 1 analysis – trend assessment………………………………. 85 Table 3.151: Spreadsheet for the Tier 2 analysis – level assessment [1995-1999………………….. 86 Table 3.152: Spreadsheet for the Tier 2 analysis – trend assessment [1985-1989]-[1995-1999]…... 86 Table 3.153: Key categories, significant subcategories and relevant parameters…………………... 87 Table 3.154: Estimate of emissions from conversion of forest to cropland (Gg)…………………… 88 Table 3.155: Estimate of emissions from conversion of forest to grassland (Gg)…………………... 88 Table 3.156: Estimate of total emissions from conversion of forest to cropland and grassland (Gg). 88
Land-Use Changes and Greenhouse Gas Fluxes: Scientific Understanding and Contribution to Improving Methodologies for Greenhouse Gas Inventory in BENIN
IPCC NGGIP TSU Inventory Internship 15
Boxes No Title Page
Box 1.1: TSU Inventory Internship objectives ………………………………………………..... 20 Box 1.2: Objectives and Outcomes of the research proposal …………………………………... 22
Equations No Title Page
Equation 3.1 Estimation of land area ……………………………………………………………….. 30 Equation 3.2 Forest area converted to cropland …………………………………………………..... 31 Equation 3.3 Estimate of biomass stock ……………………………………………………………. 34 Equation 3.4 Estimate of biomass accumulation ………………………………………………….... 36 Equation 3.5: Estimate of carbon stocks change in the dead wood pool…………………………….. 47
Maps No Title Page
Map 1.1: Benin in West Africa and its main agro-ecological zones …………………………..... 20
Figures No Title Page
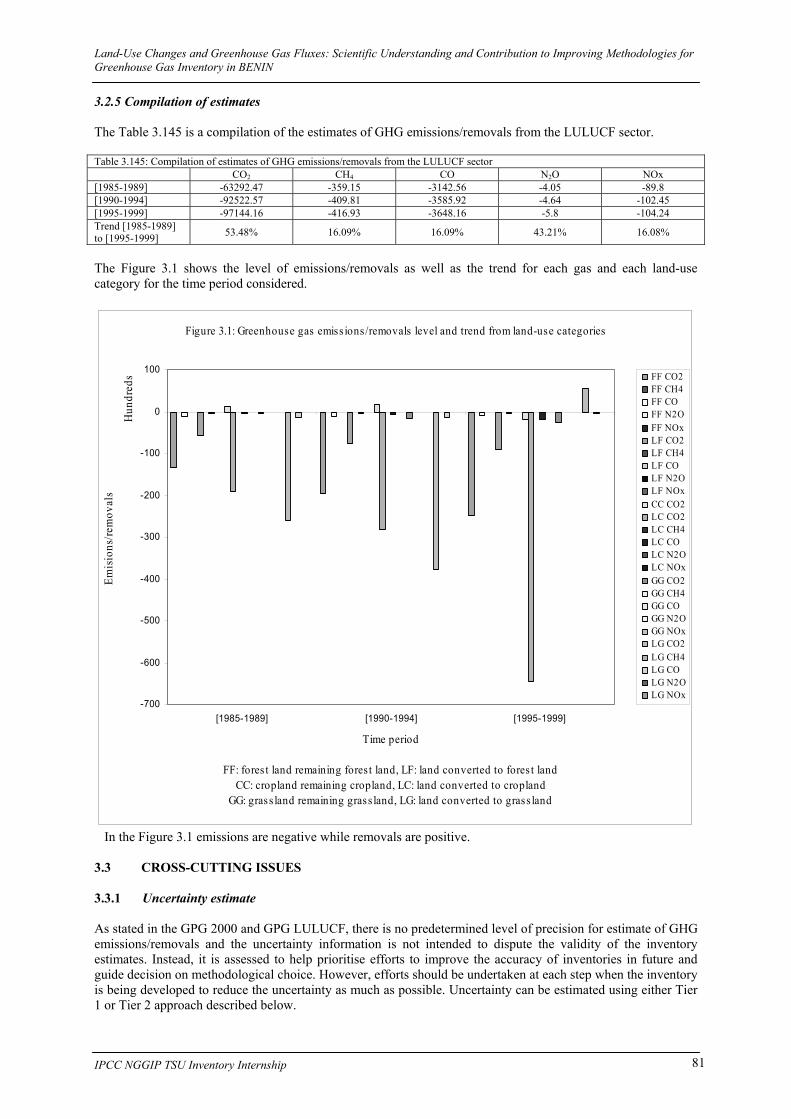
Figure 3.1: Greenhouse gas emissions/removals level and trend from land-use categories …….... 81
Land-Use Changes and Greenhouse Gas Fluxes: Scientific Understanding and Contribution to Improving Methodologies for Greenhouse Gas Inventory in BENIN
IPCC NGGIP TSU Inventory Internship 16
Land-Use Changes and Greenhouse Gas Fluxes: Scientific Understanding and Contribution to Improving Methodologies for Greenhouse Gas Inventory in BENIN
IPCC NGGIP TSU Inventory Internship 17
Summary The emissions and/or removals of three direct greenhouse gases (GHG) CO2, CH4, N2O and two indirect greenhouse gases CO and NOx have been estimated for the Land Use, Land-Use Change and Forestry (LULUCF) sector in Benin. To do this, the IPCC methodological guidance given mainly in the Good Practice Guidance for LULUCF (GPG LULUCF) and also the Revised 1996 IPCC Guidelines for National Greenhouse Gas Inventories (96 GLs) and the Good Practice Guidance and Uncertainty Management in National Greenhouse Gas Inventories (GPG 2000) has been used. The LULUCF sector has been identified as key in the inventory system of Benin since it emitted 95% of the total CO2 emissions according to the GHG inventory developed for 1995 by Benin and included in its initial national communication. The improvement of the inventory in that sector will then contribute to significantly improve the quality of the country’s overall inventory. The current study demonstrates the application of the GPG LULUCF in a context characterised by little data and few resources and constitutes a model for similar countries. A desk-collection of needed data has been performed both from documents brought from Benin and other documents found on the internet from relevant websites and has generated data and information from the latest available and appropriate approved reports. Several reports have been combined with the view of obtaining a full geographical coverage of the country in terms of agro-ecological zones. The main country-specific data used were obtained from ground-based measurement plots, aerial photography and satellite images. In some cases, data have been estimated by expert judgment or assumptions when there is no country-specific data and the use of default data suggested by the GPG LULUCF or the 96 GLs seems inappropriate. The broad land-use categories considered in this study include forest land, cropland and grassland. The study distinguishes between the land remaining in the same state of use and the different conversions between lands. It provides estimates of GHG emissions or removals regardless of whether the category is key or not and subcategory significant or not. In this process, country-specific emission/removal factors and other parameters have been developed or provided. These include among other things the annual per hectare increment in total biomass, the above and below ground biomass, the basic wood density, the biomass expansion factors, the reference soil carbon stocks. The emissions/removals estimates have been made for the periods [1985-1989], [1990-1994] and [1995-1999]. The LULUCF sector emitted 97144.16 Gg CO2, 417 Gg CH4, 5.8 Gg N2O, 3648 Gg CO and 104 Gg NOx during [1995-1999]. During that period, the categories land converted to cropland and forest land remaining forest land have been responsible for 66% and 26% respectively, together 92% of CO2 emissions from the LULUCF sector. Not only is LULUCF a major source of GHG but also its emissions are growing, with increases of 53.5% for CO2, 43.2% for N2O and 16% for CH4, CO and NOx between [1985-1989] and [1995-1999]. In order to estimate uncertainty, a Monte Carlo simulation has been performed using @RISK Professional v4.5 to estimate the overall uncertainty for each time period and the uncertainty in the trend. The uncertainty estimated as the 95% confidence interval gave for CO2 emissions uncertainties of 21% for forest land remaining forest, 14% for land converted to forest, 40% for cropland remaining cropland, 13% for land converted to cropland, 81% for grassland remaining grassland, and 64% for land converted to grassland. While the uncertainty associated with the estimates of non-CO2 gases emissions ranges from 21% to 37%. For the uncertainty related to the trend, the lowest value is 9% and is associated with the non-CO2 emissions from land converted to grassland whereas the highest value 93% is for CO2 emissions from forest land remaining forest land. A Tier 1 and Tier 2 key category assessment has enabled the identification of seven key categories including CO2 emissions from forest land remaining forest, land converted to forest, cropland remaining cropland, land converted to cropland, grassland remaining grassland, land converted to grassland and CH4 emissions from land converted to cropland. The corresponding significant subcategories that need to be prioritised in terms of methodological choice have been identified. Moreover, the sensitivity analysis as part of the uncertainty assessment provided information on relevant parameters on which attention has to be focused.
Land-Use Changes and Greenhouse Gas Fluxes: Scientific Understanding and Contribution to Improving Methodologies for Greenhouse Gas Inventory in BENIN
IPCC NGGIP TSU Inventory Internship 18
Résumé Les émissions et/ou les séquestrations de trois gaz à effet de serre (GES) direct CO2, CH4, N2O et deux GES indirect CO et NOx ont été estimées pour le secteur “Utilisation des Terres, Changement d’Utilisation des Terres et Foresterie” (UTCUTF) au Bénin. Pour ce faire, le guide méthodologique de IPCC contenu dans le Guide de Bonnes Pratiques pour l’UTCUTF et aussi les Directives Revisées de 1996 pour les Inventaires Nationaux de GES et le Guide de Bonnes Pratiques et Gestion des Incertitudes dans les Inventaires Nationaux de GES a été utilisé. Le secteur UTCUTF a été identifié comme clé dans le système d’inventaire du Bénin puisqu’il a émis 95% des émissions totales de CO2 selon l’inventaire de GES élaboré pour 1995 et présenté dans la communication nationale initiale du Bénin sur les changements climatiques. La présente étude démontre l’application du guide de bonnes pratiques de IPCC relatif à l’UTCUTF dans un contexte caractérisé par des données et ressources limitées et constitue un exemple pour les pays ayant des conditions similaires. La collecte de données nécessaires a été effectuée à partir des documents apportés du Benin et d’autres recherchés sur des sites internet appropriés et a fourni des données et information contenues dans des documents récents et approuvés. Plusieurs documents ont été combinés en vue d’obtenir une couverture géographique complète des différentes zones agro-écologiques du pays. Les principales données utilisées ont été obtenues à partir des mesures de terrain, des photographies aériennes et des images de satellites. Dans certains cas, les données ont été estimées à partir de jugement d’expert ou d’hypothèses, principalement lorsqu’il n’y a pas de données spécifiques au pays et l’utilisation de données par défaut suggérées dans les guides méthodologiques de IPCC apparait inappropriée. Les catégories d’utilisation des terres considérées dans cette étude comprennent les forêts, les terres de culture et les prairies. Il a été distingué la catégorie de terre restant dans le même état d’utilisation et les différentes conversions entre les catégories. Les estimations des émissions ou séquestrations de GES ont été effectuées sans tenir compte du fait que la catégorie est clé ou non et la sous-catégorie significative ou non. Des facteurs d’émission/séquestration ont été élaborés ou fournis. Ces facteurs comprennent entre autres l’accroissement annuel par hectare de la biomasse totale, le stock de biomasse aérienne et souterraine, la densité de la biomasse, les facteurs d’expansion de la biomasse, les stocks de carbone du sol. Les émissions/séquestrations de GES ont été estimées pour les périodes [1985-1989], [1990-1994] et [1995-1999]. Le secteur UTCUTF a émis 97144,16 Gg de CO2, 417 Gg de CH4, 5,8 Gg de N2O, 3648 Gg de CO et 104 Gg de NOx durant la période [1995-1999]. Pendant cette période, les catégories terre convertie en terre de culture et forêt restant forêt ont contribué à 66% et 26% respectivement, soit ensemble 92% aux émissions de CO2 issues de ce secteur. Non seulement, UTCUTF est une importante source de GES mais aussi les émissions augmentent avec des taux de 53.5% pour CO2, 43.2% pour N2O et 16% pour CH4, CO et NOx entre [1985-1989] et [1995-1999]. En vue d’estimer les incertitudes, une simulation de Monte Carlo utilisant le logiciel @RISK Professional v4.5 a été effectuée puis l’incertitude relative à chaque période considérée et aux tendances a été estimée. L’incertitude estimée comme 95% d’intervalle de confiance a donné pour les émissions de CO2 les incertitudes de 21% pour la catégorie forêt restant forêt, 14% pour terre convertie en forêt, 40% pour terre de culture restant terre de culture, 13% pour terre convertie en terre de culture, 81% pour prairie restant prairie, et 64% pour terre convertie en prairie. Alors que l’incertitude associée aux estimations des émissions des GES autres que le CO2 varie entre 21% et 37%. Pour l’incertitude relative aux tendances, la plus faible valeur est 9% et est associée aux émissions de GES autres que le CO2 provenant de terre convertie en prairie pendant que la valeur la plus élevée 93% est liée aux émissions de CO2 issues de forêt restant forêt. Une évaluation de catégorie clé utilisant les approches de Niveau 1 et de Niveau 2 a permis d’identifier sept catégories clé à savoir les émissions de CO2 provenant de forêt restant forêt, terre convertie en forêt, terre de culture restant terre de culture, terre convertie en terre de culture, prairie restant prairie, terre convertie en prairie et les émissions de CH4 issues de terre convertie en terre de culture. Les sous-catégories significatives associées et prioritaires en termes de choix méthodologique ont été identifiées. De plus, l’analyse de sensibilité conduite lors de l’évaluation d’incertitude a fourni des informations sur les paramètres importants qui méritent une attention particulière.
Land-Use Changes and Greenhouse Gas Fluxes: Scientific Understanding and Contribution to Improving Methodologies for Greenhouse Gas Inventory in BENIN
IPCC NGGIP TSU Inventory Internship 19
Chapter 1
Introduction
1.1 SOME GENERAL INFORMATION ON BENIN Geographic description The Republic of Benin is located in West Africa between the Equator and the Tropic
of Cancer, between latitudes 6º15’ and 12º25’ N and longitudes 0º40’ and 3º45’ E. It constitutes a long stretch of land perpendicular to the Coast of the Gulf of Guinea. With a coastline of 124 kilometres long, Benin is bordered on the North by Burkina Faso and the Republic of Niger, on the East by the Federal Republic of Nigeria and on the West by the Republic of Togo. The country is about 672 km from south to north, while its width ranges from 110 km in the south to 324 km in the north. The location of Benin in West Africa is presented on the map 1.1.
Area
114 842.7 km2 i.e. 30% of the area of Japan.
Population 4.9 millions inhabitants in 1992; 5.5 millions inhabitants in 1996. 6 millions inhabitants in 1998. According to projections: 9 757 000 inhabitants in 2012 and more than 17 millions in 2027.
Economic changes GDP at 1995 prices: 1 632 million US$ in 1990 and 2 598 million US$ in 2000. Per capita gross national income (GNI): 360 US$ in 1990 and 380 US$ in 2000.
Languages French is the official language. Beside French, English is one of the two foreign languages taught in secondary schools. More than 50% of the population speak Fon. Yoruba, Mina, Bariba and Dendi are the other important local languages.
Capital Administrative capital: Porto-Novo Economic capital: Cotonou
Climate The climatic features of Benin reflect those of West Africa in general, with a humid coastal zone along the Atlantic coast, then a transitional continental zone further inland and finally a dry continental zone. Rainfall ranges from about 1400 mm along the coast to 1150 mm or less in the northern part. There are generally two wet seasons in the south, from March to July and from October to November, while in the northern part of the country a single wet season lasts from March to November. Temperatures are tropical, ranging from 20° to 34° C over the course of a year. The best time to visit the Southern part of the Country is from December to March and July/August while the visiting period for the Northern part is between December and April.
Vegetation, land use, fauna, environmental issues.
Fifteen years ago, it was estimated that about 7.8 millions ha i.e. 70% of the national territory was covered by different types of vegetation: closed forests, open forests, shrublands, savannas, grasslands, and plantations. In addition, national parks covered 843 000 ha, fauna reserves 420 000 ha and classified forests 1 436 500 ha. Unfortunately, important areas are being destroyed every year for agricultural, pasture, hunting purposes and for harvest of wood for fuel or other uses, even in protected areas. Arable land: 15.28%; permanent crops: 1.36%; other: 83.36% (1998 estimation). The fauna is diversified: elephants, buffalo, lions, panther, leopard in national parks, reptiles, rodents, birds, insects, etc. Relevant current issues: deforestation, desertification, coastal erosion, urban air pollution.
Topography Benin does not have a hilly landscape. The coast is flat, low-lying and sandy with inland lagoons and marshes. In the far north, the land rises to a plateau, with the highest elevation in the country ranging from 500 to 800 m in the rugged Atacora Mountains in the north-west.
Land-Use Changes and Greenhouse Gas Fluxes: Scientific Understanding and Contribution to Improving Methodologies for Greenhouse Gas Inventory in BENIN
IPCC NGGIP TSU Inventory Internship 20
Main agro-ecological zones of Benin
The Map 1.1 shows the location of Benin in West Africa and its agro-ecological zones, it is derived from the FAO global map of ecological zones produced as part of the FRA 2000.
Map 1.1: Benin in West Africa and its main agro-ecological zones.
Source: FAO, 2003.
Some important dates
Signature of the UNFCCC: 13 June 1992 in Rio de Janeiro Ratification of the UNFCCC: 30 June 1994 Ratification of the Kyoto Protocol: 16 November 2001 Submission of the initial national communication: 22 October 2002.
1.2 BACKGROUND OF THE STUDY The objectives of the internship in the IPCC NGGIP TSU are presented in the Box 1.1.
The implementation of the study whose theme is worded as Land Use Changes and Greenhouse Gas fluxes: Scientific Understanding and Contribution to Improving Methodologies for Greenhouse Gas Inventory in BENIN consists mainly in the application of both the Revised 1996 IPCC Guidelines for National Greenhouse Gas Inventories and the IPCC Good Practice Guidance for Land Use, Land-Use Change and Forestry (GPG LULUCF) to Benin as case study for West Africa, in the view of contributing to improve the quality of GHG inventories in the region. Nevertheless, it is important to notice that the GPG 2000 was also used in the cases where the GPG LULUCF makes reference to the guidance provided for instance for the Agriculture sector or the cross-cutting issues in the GPG 2000.
BOX 1.1: TSU INVENTORY INTERNSHIP OBJECTIVES (…) provide opportunities to young researchers/scientists to familiarise themselves with the IPCC methodologies for national GHG inventories through applied scientific studies relevant to specific sector(s). Further objectives are:
• To disseminate the IPCC methodologies for GHG Inventories through interns mainly from developing and EIT countries;
• To identify and fill gaps in the science/data/information with a view towards contributing to the future revisions of the IPCC Guidelines;
• To promote the evolution of a network of greenhouse gas inventory experts.
Land-Use Changes and Greenhouse Gas Fluxes: Scientific Understanding and Contribution to Improving Methodologies for Greenhouse Gas Inventory in BENIN
IPCC NGGIP TSU Inventory Internship 21
The relevance of the study for Benin and West Africa is highlighted in the research proposal presented in the Annex I, TSU Inventory Internship Research Proposal. Furthermore, according to Article 4.1 of the UNFCCC “All Parties, taking into account their common but differentiated responsibilities and their specific national and regional development priorities, objectives and circumstances, shall … develop, periodically update, publish and make available to the Conference of the Parties, in accordance with Article 12, national inventories of anthropogenic emissions by sources and removals by sinks of all greenhouse gases not controlled by the Montreal Protocol, using comparable methodologies to be agreed upon by the Conference of the Parties;”. Article 12 adds: “A national inventory of anthropogenic emissions by sources and removals by sinks of all greenhouse gases not controlled by the Montreal Protocol, to the extent its capacities permit, using comparable methodologies to be promoted and agreed upon by the Conference of the Parties”. Benin and countries in West Africa have ratified the UNFCCC and submitted their initial national communication. Several issues related to the quality of GHG inventories in the region include, amongst other things, lack of technical capacity, and lack of use of IPCC GPG, use of default data including activity data, emission/removal factors and other parameters that usually do not correspond to the national circumstances of countries. The UNFCCC decided that Non-Annex I Parties [Decision 17/CP.8] (FCCC/CP/2002/7/Add.2) should provide “A national inventory of anthropogenic emissions by sources and removal by sinks of all greenhouse gases not controlled by the Montreal Protocol, to the extent its capacities permit, using comparable methodologies to be promoted and agreed upon by the Conference of the Parties”. Non-Annex I Parties shall estimate national GHG inventories: - For the initial national communication: for the year 1994 (or alternatively for the year 1990) - For the second national communication: for the year 2000 The least developed country Parties could estimate their national GHG inventories for years at their discretion. Each Non-Annex I Party shall, as appropriate and to the extent possible, provide in its national inventory, on a gas-by-gas basis and in units of mass, estimates of anthropogenic emissions by sources and removals by sinks of the following GHGs: - Carbon dioxide (CO2) - Methane (CH4) - Nitrous oxide (N2O) Non-Annex I Parties should use the Revised 1996 IPCC Guidelines for National Greenhouse Gas Inventories. Non-Annex I Parties are encouraged to apply the IPCC Good Practice Guidance and Uncertainty Management in National Greenhouse Gas Inventories …, taking into account the need to improve transparency, consistency, comparability, completeness and accuracy in inventories. In addition [Decision 13/CP.9] (FCCC/CP/2003/6/Add.1) added that Non-Annex I Parties are encouraged to apply the IPCC Good Practice Guidance for Land Use, Land-Use Change and Forestry, as appropriate and to the extent possible, in the preparation of greenhouse gas inventories to be included in national communications. All things considered, the use of GPG LULUCF by developing countries is encouraged by the Conference of Parties (COP) and the theme of this study was developed for the purpose of gaining experience in the use of the guidance.
Land-Use Changes and Greenhouse Gas Fluxes: Scientific Understanding and Contribution to Improving Methodologies for Greenhouse Gas Inventory in BENIN
IPCC NGGIP TSU Inventory Internship 22
1.3 OBJECTIVES OF THE STUDY The objectives and outcomes of the research proposal as mentioned in the application are presented in Box 1.2. 1.4 SCOPE AND COVERAGE The study covers the Land Use, Land-Use Change and Forestry sector in Benin and makes available in the current report, activity data and other relevant information necessary for the establishment of GHG inventories, such as emission/removal factors that could be used at regional level in West Africa and included in the IPCC Emission Factor Data Base (IPCC EFDB). Since no country in West Africa has experience in the use of the GPG LULUCF, the research aims at improving the technical capacity in the use of that guidance and constitutes an example of its application to a developing country in the region. 1.5 APPROACH TO THE STUDY The collection of required activity data and other relevant information has been performed through literature search, search on relevant websites of land cover databases with the view of having a general idea on available Benin-specific data and information. The datasets presenting quantitative indicators and qualitative information on the status and dynamic of the LULUCF sector in Benin have been analysed primarily at national level and then global level. In addition, some scientific and methodological reports of the IPCC have been used. These include:
- Good Practice Guidance for Land Use, Land-Use Change and Forestry; - Revised 1996 IPCC Guidelines for National Greenhouse Gas Inventories; - Definitions and Methodological Options to Inventory Emissions from Direct Human-induced
Degradation of Forests and Devegetation of Other Vegetation Types; - IPCC special report on LULUCF; - Good Practice Guidance and Uncertainty Management in National Greenhouse Gas Inventories.
Beside the data collection activity, additional documents and websites have been consulted in order to improve the scientific understanding of the relationships that exist between the land use, land-use changes and greenhouse gas fluxes and then facilitate the application of the methodological guidance provided in the above mentioned documents. The Annex II, Some information generated by the desk-data collection, shows the main results of the activity of collection of data/information. The References section of this report provides information on different websites consulted.
BOX 1.2: OBJECTIVES AND OUTCOMES OF THE RESEARCH PROPOSAL Objectives:
• Enhance understanding of C and GHG fluxes for land use categories and conversions; • On the basis of the enhanced understanding, improve and deepen the use of the IPCC
methodologies for the establishment of GHG inventories; • Contribute to improve the quality of GHG inventories in West Africa through studies on
Benin. Issues such as cost-effective sampling, data collection, site investigations, QA/QC, uncertainties assessment, calculation of emission and removal factors will be developed.
Outcomes:
• Knowledge on interactions between land use, land-use changes and GHG fluxes has improved;
• Methodologies for inventorying GHG from land use and land-use changes have improved and are mastered as well as cross-cutting issues;
• Emissions and removals of GHG can accurately be calculated; • A report that presents the results of the research conducted for the LULUCF sector in Benin
is prepared and available.
Land-Use Changes and Greenhouse Gas Fluxes: Scientific Understanding and Contribution to Improving Methodologies for Greenhouse Gas Inventory in BENIN
IPCC NGGIP TSU Inventory Internship 23
What Scientific Understanding? One objective of this study is to understand how carbon and GHG flow between different carbon pools within land-use categories and during land-use conversions and between the atmosphere and the different terrestrial carbon pools as results of human activities. In developing the research theme and for a good understanding of the latter, it sounds very wise to have in mind the definitions of some technical terms that are being used. In the context of this study, some definitions are presented through the following lines. Land use: type of activity being carried out on a unit of land. Land use change: transition from a type of activity that was being carried out on a unit of land to another. Carbon pool: also designated as reservoir, is a system which has the capacity to accumulate or release carbon. Some examples of carbon pools are forest biomass, wood products, soils and atmosphere. Carbon flux: transfer of carbon from one carbon pool to another. Greenhouse gas flux: the definition of carbon flux can be extended to GHG flux to define the latter as a transfer of GHG from one pool to another as a direct result of human activity or natural process modified/disturbed by man. When fluxes are between terrestrial pools and atmosphere it can be emission or removal. Carbon stocks: absolute quantity of carbon held within a pool at a specified time. Sequestration/Uptake: addition of carbon to a pool other than the atmosphere. (Sources: IPCC Special Report on LULUCF, IPCC GPG LULUCF, 96 Guidelines). In terms of scientific and technical knowledge, the implementation of the study has enabled to notice amongst other things the following improvements: - the knowledge of the different land-use categories, sub-categories and associated pools of carbon as defined by the IPCC and the possible conversions between categories has been improved; - the different transfers of carbon and nitrogen that could occur, as result of human activity, within the land-use categories and during conversions are known as well as the form under which carbon (e.g. CH4, CO2, CO) and nitrogen (e.g. N2O, NOx) could be released to the atmosphere under different conditions and disturbances; - the processes by which emissions/removals i.e. flux of GHG between the atmosphere and the terrestrial pools occur have also been known and the use of provided methodologies to estimate those emissions/removals has improved; - it has been noted that two main types of methods are often used to measure the loss or the accumulation of carbon in terrestrial pools. These include first the measurement of carbon stocks considering the vegetation inventory, wood products, soil, dead organic matter, litter and second the measurement of GHG fluxes using techniques and models such as local scales, landscape and regional scales, continental scales, horizontal fluxes of carbon. However, one important issue identified is the one of the carbon stored in products made from biomass (e.g. paper, furniture). These products have been traded among countries and to describe properly the fate of the stored carbon, a life cycle analysis is needed. The development and improvement of that life cycle assessment and its application are very important to assess the carbon flux within a country and among nations. 1.6 STRUCTURE OF THE REPORT The structure of the report is outlined as follows: The Chapter 1, Introduction, presents some general information on Benin as well as the framework of the study. An overview of the land use, land-use change and forestry sector in Benin, focusing on the land-use categories, the factors responsible for land use changes and the status of available information is presented in chapter 2. The Chapter 3 discusses the application of the 96 Guidelines and the GPG LULUCF using mainly Benin-specific data while the key findings and conclusions arising from this study are summarized in Chapter 4.
Land-Use Changes and Greenhouse Gas Fluxes: Scientific Understanding and Contribution to Improving Methodologies for Greenhouse Gas Inventory in BENIN
IPCC NGGIP TSU Inventory Internship 24
Chapter 2
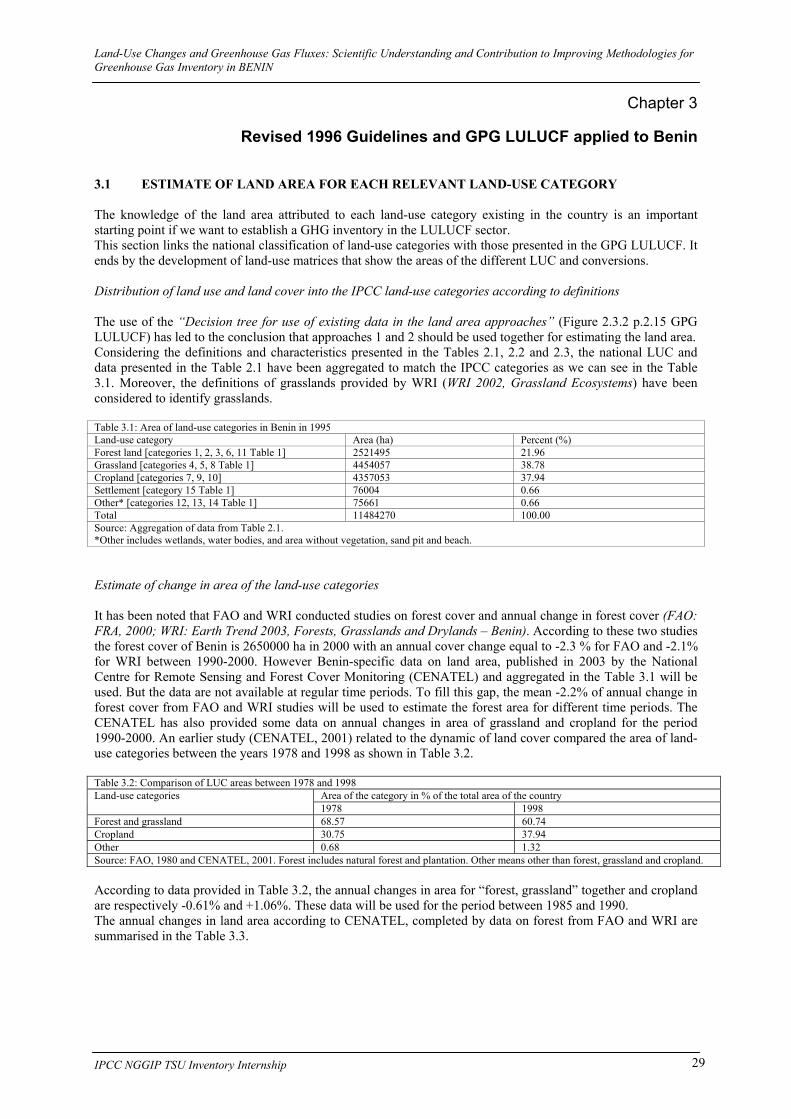
Land Use, Land-Use Change and Forestry sector in Benin 2.1 OVERVIEW OF LAND-USE CATEGORIES IN BENIN Situation in 1995 Data and information on land cover and land use as well as on land-use change are important prerequisite for estimating GHG emissions and removals in the LULUCF sector. These data have been obtained from the vegetation map of Benin developed by the National Centre for Remote Sensing and Forest Cover Monitoring using satellite images Landsat and SPOT XS recorded between 1990 and 1997 and aerial photography carried out in 1995 by the National Geographic Institute. The development of the map considered three main criteria, that is to say: density of trees, number of storeys and the grassy layer (grass cover). The nomenclature of vegetation classes has been done on the basis of FAO’s classification (Howard and Shade, 1982). The Table 2.1 shows the national classification of land-use categories and the characteristics of the different classes as well as the land areas. This situation will be considered for the year 1995.
Table 2.1: National classification of land-use categories Land-use category Area (ha) Some characteristics
1. Galerie forestière Gallery forest
272 804 Forest containing high trees and distributed in narrow belts along rivers (JICA, 2000)
2. Forêt dense semi-décidue et décidue
Closed semi-deciduous or deciduous forest / High forest
120 335 Tree height more than 5 meters, crown density 60-80% and little vegetation on the forest floor. (JICA, 2000)
3. Forêt Claire et savane boisée
Open forest and savannah woodland
1 931 968 Tree height more than 5 meters and tree crown density 40-60%. Shrub height less than 5 meters and shrub crown density of under 40%. (JICA, 2000)
4. Savane arborée et arbustive et herbeuse
Tree savannah/ Mixed savannah
4 150 488 Tree height more than 5 meters and tree crown density 40-60%. Shrub height less than 5 meters and shrub crown density of more than 40%. (JICA, 2000)
5. Savane arborée et arbustive saxicole
Shrub savannah 220 770 Tree height more than 5 meters and tree crown density less than 40%. Shrub height less than 5 meters and shrub crown density more than 40%. (JICA, 2000)
6. Relique de forêt et savane en zones saisonnièrement inondées
12. Surface sans végétation Area without vegetation 2 352 13. Carrière et plage Sand pit and beach 1 124 14. Plan d’eau Waterways 72 185 Including river banks 15. Agglomération settlements 76 004 Total 11 484 270 Sources: CENATEL 2003, JICA 2000. Definitions of some national classes of land-use categories The development of definitions of the different land-use categories at national level specifying, among other things, thresholds such as canopy crown cover, tree height, and area is not exhaustive. A study conducted in the northern part of Benin in the framework of Japan International Cooperation Agency (JICA), classified the land-use categories in this part of the country considering the parameters specified above (see characteristics in Table 2.1). Additional definitions and characteristics are presented in the Table 2.2.
Land-Use Changes and Greenhouse Gas Fluxes: Scientific Understanding and Contribution to Improving Methodologies for Greenhouse Gas Inventory in BENIN
IPCC NGGIP TSU Inventory Internship 25
Table 2.2: Definitions of national classes of land-use categories National class Definition/characteristics Gallery forests Gallery forests are found throughout the country right up to the northern border and are fairly regularly spread along
permanent watercourses. Their composition is very similar to that of the semi-deciduous forests, and they are also three-storeyed forests in which species with large diameters such as Ceiba pentandra, Chlorophora excelsa, Khaya senegalensis, Diospyros mespiliformis, Vitex domiana and the Elaeis guineensis palm are predominant (FAO; 1979, 1980).
Closed semi-deciduous or deciduous forest
In the coastal zone of Benin, this type of vegetation is represented by the Lama forest, one of the few intact forests surviving in the south of the country and the only still of any significant size. It lies in the depression of the same name, which is flat and poorly drained, flooding during the rainy season and cracking in the dry season (FAO, 1980). It is a multi-storeyed forest of average height. The upper storey is very open (>30 m high) and dominates an intermediate storey (15 to 25 m high) with a closed canopy. Triplochiton scleroxylon, Antiaris africana, Chlorophora excelsa, Afzelia africana, Ceiba pentandra, Diospyros mespiliformis and Dialium guineense are found here. The understorey is 7 to 10 m high, and the same species occur here, plus large numbers of Drypetes floribunda. The undergrowth is very thick and varied (FAO; 1978, 1980). This forest suffers considerable pressure from the population of surrounding areas. Between Savalou and Djougou areas in central-western Benin, a region receiving an average annual rainfall of over 1300 mm, there are many small stands, usually on slightly higher ridges and often sheltering a village. These are closed multi-storeyed stands with a closed cover and are often degraded as a result of encroaching cultivation and the fires that penetrate them a little further each year. Large numbers of Antiaris africana, Celtis zenkeri, Holoptelea grandis, Chlorophora excelsa and Cola gigantean are found here, and sometimes Triplochiton scleroxylon and Ceiba pentandra. These forest islands have areas of between 50 and 150 ha, and their composition is generally similar to that of the Lama forest, although Afzelia africana is fairly rare in the dominant storey (FAO, 1980).
Open forest and savannah woodland
Generally small in area, islands of open forest (in which the crowns provide a 50% to 80% cover) are more often found in savannah woodland on secondary ridges, a location that provides them with some protection from bush fires. Such fires are indeed the origin of open forest, which is a degraded form of the original dry closed forest. These open forests average 7 to 20 m in height with a dominant storey very similar to that of the closed forest. They are found in the central zone, where the average annual rainfall is between 1000 and 1400 mm. They contain several species that occur in varying densities throughout the region Anogeissus leiocarpus, Butyrospermum paradoxum, Daniellia oliveri, Isoberlinia doka and Parkia biglobosa and have an understorey of tangled shrubs and grassy vegetation (FAO; 1979, 1980). The term “savannah woodland” is used for formations that are more open than the open forest found throughout the country but which have the same physical appearance, even though their composition, which varies depending chiefly on climate, is somewhat different. Crown cover ranges from 20% to 50% (FAO, 1980). Some of the species found in open forests are also present, although they are more scattered here. Ceiba pentandra and Chlorophora excelsa also occur. The grassy layer, which is more or less unbroken, burns frequently, but not necessarily every year.
Tree savannah
Tree savannah consists of an unbroken grassy layer at least 80 cm high that burns each year. It is dotted with trees and shrubs rarely over 7 m in height, forming a broken cover of fewer than 20% (FAO, 1979). Savannah is found scattered throughout the country, though it is less frequent in the coastal zone. Anogeissus leiocarpus, Butyrospermum paradoxum, Daniellia oliveri and Combretum spp. are typical of such vegetation.
Periodically flooded open forests
Located in bottomlands, in depressions along watercourses and on the edges of ponds and lakes, these formations are flooded for part of the year. They very often cover small areas. In the coastal zone, riparian forests are found mainly along the lower reaches of the Oueme, Zou, Kouffo and Mono Rivers as is the case of the vestiges of degraded semi-deciduous forest in the Mono and Oueme valleys. Certain species such as Pterocarpus santaloides and Dialium guineense are common. Small areas of shrub savannah featuring Mitragyna inermis belong to this group, as well as swamp vegetation and occasional mangroves in salty environments (Avicennia africana). Low floodplains covered with woodland and tree savannah lie along certain watercourses, for example the Pendjari and Niger Rivers, in the dry and central zones. Acacia sieberiana in its arborescent form (12 m tall) and Acacia seyal (with a height of 3 to 9 m) are found here, often in groups that form almost pure islands. Terminalia spp., Mitragyna inermis, Tamerindus indica, Balanites aegyptiaca and Borassus aethiopum are also found (FAO, 1980).
Stands altered by humans (FAO, 1980)
The crop-and-fallow complexes in the coastal zone contain large numbers of oil palms (Elaeis guineensis) under which farmers grow their food crops. The palms are often mixed with other trees such as Chlorophora excelsa and Lophira lanceolata, dominating a thick low grassy shrub layer. Further north, there are fewer palm groves and farmland is scattered with isolated species or small thickets, the remains of the original forests. The most frequent species are Ceiba pentandra and Chlorophora excelsa. Tree and shrub savannah with large inroads by agriculture is typical of most of the central zone. Crops and fallow areas are dotted with trees from the surrounding savannah left by the farmers, especially those supplying edible fruit such as Parkia biglobosa and Butyrospermum paradoxum, which have given rise to a flourishing trade.
Shrubs
Shrub savannah is formed of an unbroken grassy carpet with shrubs usually in large numbers and some scattered trees. Fire affects these areas most years. Lophira lanceolata and Acacia spp. are the most common shrub species here (FAO, 1979).
Sources : FAO. 1978. Inventaire d’aménagement de la foret de Lama. Document de terrain no. 3, FO :DP/BEN/73/014. Rome. FAO. 1979. Inventaire de reconnaissance du centre-nord. Document de terrain no. 4, FO :DP/BEN/73/014. Rome. FAO. 1980. Cartographie du couvert vegetal et étude de ses modifications. Systeme mondial de surveillance continue de l’environnement. Projet pilote sur la surveillance continue de la couverture forestiere tropicale basé sur les travaux de Baltaxe, R., Guellec, J., Oko, L. Rapport technique No. 1 UN 32/6 (1102-75-005). Rome. In 1980, the FAO conducted a study on land cover and land use in Benin. However, according to several national studies, FAO’s results give an inaccurate idea of the state of land-use categories in Benin, regarding land area. For this reason, the data presented in the table 2.1 will be considered.
Land-Use Changes and Greenhouse Gas Fluxes: Scientific Understanding and Contribution to Improving Methodologies for Greenhouse Gas Inventory in BENIN
IPCC NGGIP TSU Inventory Internship 26
The definitions of some land-use categories according to the FAO are presented in the Table 2.3. Table 2.3: Definition of land-use categories according to FAO
Plantation Forest stands established by planting or/and seeding in the process of afforestation or reforestation. Reforestation does not include regeneration of old tree crops through natural regeneration or forest management.
1. Undisturbed by man 2. Disturbed by man 3. Semi natural
Closed forest Formations where trees in the various storeys and the undergrowth cover a high proportion (> 40 %) of the ground and do not have a continuous dense grass layer.
1. Broadleaved: with a predominance (>75% of tree crown cover) of trees of broadleaved species. 2. Coniferous: with a predominance (>75% of tree crown cover) of trees of coniferous species. 3. Bamboos/Palms: forest on which >75% of the crown cover consists of tree species other than coniferous or broadleaved species. 4. Mixed: forest in which neither coniferous, nor broadleaved, nor palms, bamboos, account for >75% of the tree crown cover. 1. Undisturbed by man 2. Disturbed by man 3. Semi natural
Forest Land with tree crown cover of more than 10 percent and area of more than 0.5 ha. Trees should be able to reach a minimum height of 5m at maturity in situ
Natural forest Forests composed of indigenous trees, not planted by man. Or in other words forests excluding plantations.
Open forest Formations with discontinuous tree layer but with coverage of at least 10% and less than 40%. Generally there is a continuous grass layer allowing grazing and spreading of fires.
Shrubs Refer to vegetation types where the dominant woody elements are shrubs i.e. woody perennial plants, generally of more than 0.5m and less than 5m in height in maturity and without a definite crown. The height limits for trees and shrubs should be interpreted with flexibility, particularly the minimum tree and maximum shrub height, which may vary between 5 and 7 meters approximately.
Other wooded land Land either with a crown cover of 5-10 percent of trees able to reach a height of 5m at maturity in situ; or a crown cover of more than 10 percent of trees not able to reach a height of 5m at maturity in situ; or with shrub or bush cover of more than 10 percent.
Forest fallow system Refers to all complexes of woody vegetation deriving from the clearing of natural forest for shifting agriculture. It is an intermediate class between forest and non-forest land uses. Part of the area may have the appearance of a secondary forest. Even the part currently under cultivation sometimes has appearance of forest, due to presence of tree cover. Accurate separation between forest and forest fallow may not always be possible.
Other land
Land not classified as forest or other wooded land as defined above. Includes agricultural land, meadows and pastures, built-on areas, barren land, etc.
Inland water Area occupied by major rivers, lakes and reservoirs. Sources: FAO 2001. Global Forest Resources Assessment 2000 2.2 FACTORS RESPONSIBLE FOR LAND-USE CHANGES IN BENIN The Table 2.1 shows that the area of land covered by the vegetation without fallow lands and farmlands is about 6 975 552 ha in 1995. Although Benin is not a forest country compared to some countries in West Africa, the potential of wood is still important. The natural resources appear globally sufficient to meet immediate needs in wood. However, one notices an increase in deforestation and lands conversion processes which are reflected in many factors such as conversion of forest and other wooded lands into agricultural land, cash crops as well as subsistence crops, commercial fellings, pasture, fires. The Table 2.4 compares the state and change in areas of forest and other wooded lands in Benin with its neighbours in the region.
Land-Use Changes and Greenhouse Gas Fluxes: Scientific Understanding and Contribution to Improving Methodologies for Greenhouse Gas Inventory in BENIN
IPCC NGGIP TSU Inventory Internship 27
Table 2.4: Forest and other wooded lands cover in West Africa in 2000 Country Total forest
area
Natural forests
Forest plantation
Other wooded lands
Annual forest cover loss, 1990-2000
Rate of change
(000 ha) (000 ha) (000 ha) (000 ha) (000 ha) (%) Benin 2 650 2 538 112 3 731 -70 -2.3 Burkina Faso 7 089 7 023 67 7 668 -15 -0.2 Cape Verde 85 0 85 5 9.3 Cote d’Ivoire 7 117 6 933 184 6 620 -265 -3.1 Gambia 481 479 2 161 4 1.0 Ghana 6 335 6 259 76 -120 -1.7 Guinea 6 929 6 904 25 5 850 -35 -0.5 Guinea-Bissau 2 187 2 186 2 -22 -0.9 Liberia 3 481 3 363 119 -76 -2.0 Mali 13 186 13 172 15 17 020 -99 -0.7 Niger 1 328 1 256 73 334 -62 -3.7 Nigeria 13 517 12 824 693 9 645 -398 -2.6 Senegal 6 205 5 942 263 12 043 -45 -0.7 Sierra Leone 1 055 1 049 6 4 378 -36 -2.9 Togo 510 472 38 348 -21 -3.4 Total West Africa 72 155 70 395 1 760 43 768 -1 255 -1.7 Source: FAO, 2001a. It is not intended to use these data in the current study. The purpose of providing this information is to make a comparison between countries in West Africa on an identical basis. The main factors that are responsible for land-use change in Benin are briefly presented below. Agriculture The strategy of farmers, to satisfy their need for food and financial resources, is to extend cultivated areas. In absence of new agricultural methods, the farmers abandon land in fallow when yields become low, in favour of arable lands often located in forests which then exert increasingly important pressure on vegetation and soils. However, the area of forest and native vegetation that is converted yearly into agricultural land is not well known for the entire country. Some projects/studies provided useful information mainly in the northern part where agriculture is widely practised and which also has an important area of forest and other land cover. The south in contrary is mainly subject to market gardening and the main farm products are imported from the northern and centre parts of the country. Because of that, these two parts are usually called “larder” of Benin. Pasture The livestock farming and international transhumance from neighbouring countries such as Niger, Burkina Faso, Mali, and Nigeria, affected by drought and desertification, reduce considerably the potential of native vegetation resources. In the southern part of Benin, livestock is more sedentary while in the north, farmers practise mainly migration of livestock. In the north, where livestock farming is concentrated, the pasture area is very large. To provide feed stuffs, farmers usually burn vegetation to enable new sprouts to emerge for livestock feed. This is one of the main causes of fires observed each year in the country. Another practice consists of cutting down trees. Moreover, the presence of increasing number of livestock in forest area and grassland also leads to the compaction of soil and reduce the growth of trees. Furthermore, the cattle crossing through croplands are at the origin of conflicts between farmers and cattle breeders. Supply of wood for energy and other purposes The most important product derived from forests and woodlands is biomass used as the main source of energy by households in Benin for food cooking. The forms of biomass used are wood and wood charcoal accounting for about 90% of the total energy consumption and providing most household with energy needs. The trend in consumption of wood for energy in Benin is shown in Table 2.5. Table 2.5: Consumption of wood for energy in Benin
1980 1990 2000 (000 m3) (000 m3) (000 m3)
5 261 5 977 6 453 Source: Broadhead et al., 2001. Forests and woodlands are also subject to commercial fellings. The Table 2.6 shows the production of industrial roundwood in Benin.
Land-Use Changes and Greenhouse Gas Fluxes: Scientific Understanding and Contribution to Improving Methodologies for Greenhouse Gas Inventory in BENIN
IPCC NGGIP TSU Inventory Internship 28
Table 2.6: Production of industrial roundwood in Benin 1980 1990 2000
(000 m3) (000 m3) (000 m3) 197 274 332
Source: FAO, 2002. It is important to mention that most of the industrial roundwood are gathered from native vegetation (e.g. natural forests) and the result of this is that forests area have decreased gradually notably in the southern and centre parts of the country. Settlements The development of cities through the population growth, the expansion of housing, the building of road infrastructure is the main cause of conversion of land into settlement around the urban areas in Benin. The migration and settlement of rural population, mainly farmers, even in classified forests are also causes of deforestation. Fire The following have been identified as the main causes of vegetation fire in Benin:
- insufficiency of fire control during shifting cultivation; - burning to flush out wild animals during hunting; - burning in the dry season for new sprouts to emerge for livestock feed.
Field fires occur each year and are one of the main causes of vegetation destruction in many areas. It also destroys organic material as well as micro organisms in soils. The major components of biomass burning are forest, savannas, agricultural land after harvest, and wood for cooking, heating, and charcoal production. No information is available about occurrence of natural fires, but the latter seems very rare in Benin. The burning of tropical savannas “is estimated to destroy three times as much dry matter per year as the burning of tropical forest”. The UNEP report notes that most of the biomass burned today is from savannas. Because two-thirds of the world’s savannas are in Africa, that continent would be recognized as the “burn centre” of the planet (Levine et al. 1999). The associated emissions should be estimated considering whether the burning recurs or not and if the emissions should be considered net emissions or not. 2.3 OVERALL INFORMATION STATUS AND NEEDS This part addresses the issue of availability and quality of data. The data on area of land-use categories are available, but not for a time-series. The information on the conversions from one land-use category to another does not cover all types of transition between the categories. For example, the area of grassland turned to agriculture is not well documented. Some rates of change have been used to estimate the change in land areas and the conversions for the time-series considered for this study. In addition to that, information on uncertainties associated with available data is very limited or even nonexistent. It has been noted that some figures provided in this report for e.g. data in Table 2.6 are those reported by the country on the basis of officially recorded figures. Obviously these could diverge from the actual figures, depending on the extent of the informal sector (for instance illegal logging) that is beyond any control. The forest inventory was partial and the results have been extended to cover the whole country. Exact figures for recent changes in the extent of grassland are not readily available. In general, native grasslands have decreased. In some areas, total area classified as grassland may have increased due to the clearing of forests. In addition the data that are published for different countries or regions are often difficult to compare because the definitions of grassland are so variable. The FAO does not provide estimates of the extent of grassland in each country. Furthermore, there is lack of information on the occurrence and the extent of some disturbances like fires, pest outbreaks, windstorms as well as on land area subject to such disturbances although the UNEP has developed a database on burned area. Also, data on natural mortality of trees in forest and mortality rate are not exhaustive. With regard to the preceding, efforts have been made to use, to a high extent, available country-specific data and estimate uncertainties associated with them. There is a need to develop relevant research programmes for the implementation of scientific studies in the LULUCF sector in order to gather additional information and get rid of some uncertainties.
Land-Use Changes and Greenhouse Gas Fluxes: Scientific Understanding and Contribution to Improving Methodologies for Greenhouse Gas Inventory in BENIN
IPCC NGGIP TSU Inventory Internship 29
Chapter 3
Revised 1996 Guidelines and GPG LULUCF applied to Benin 3.1 ESTIMATE OF LAND AREA FOR EACH RELEVANT LAND-USE CATEGORY The knowledge of the land area attributed to each land-use category existing in the country is an important starting point if we want to establish a GHG inventory in the LULUCF sector. This section links the national classification of land-use categories with those presented in the GPG LULUCF. It ends by the development of land-use matrices that show the areas of the different LUC and conversions. Distribution of land use and land cover into the IPCC land-use categories according to definitions The use of the “Decision tree for use of existing data in the land area approaches” (Figure 2.3.2 p.2.15 GPG LULUCF) has led to the conclusion that approaches 1 and 2 should be used together for estimating the land area. Considering the definitions and characteristics presented in the Tables 2.1, 2.2 and 2.3, the national LUC and data presented in the Table 2.1 have been aggregated to match the IPCC categories as we can see in the Table 3.1. Moreover, the definitions of grasslands provided by WRI (WRI 2002, Grassland Ecosystems) have been considered to identify grasslands. Table 3.1: Area of land-use categories in Benin in 1995 Land-use category Area (ha) Percent (%) Forest land [categories 1, 2, 3, 6, 11 Table 1] 2521495 21.96 Grassland [categories 4, 5, 8 Table 1] 4454057 38.78 Cropland [categories 7, 9, 10] 4357053 37.94 Settlement [category 15 Table 1] 76004 0.66 Other* [categories 12, 13, 14 Table 1] 75661 0.66 Total 11484270 100.00 Source: Aggregation of data from Table 2.1. *Other includes wetlands, water bodies, and area without vegetation, sand pit and beach. Estimate of change in area of the land-use categories It has been noted that FAO and WRI conducted studies on forest cover and annual change in forest cover (FAO: FRA, 2000; WRI: Earth Trend 2003, Forests, Grasslands and Drylands – Benin). According to these two studies the forest cover of Benin is 2650000 ha in 2000 with an annual cover change equal to -2.3 % for FAO and -2.1% for WRI between 1990-2000. However Benin-specific data on land area, published in 2003 by the National Centre for Remote Sensing and Forest Cover Monitoring (CENATEL) and aggregated in the Table 3.1 will be used. But the data are not available at regular time periods. To fill this gap, the mean -2.2% of annual change in forest cover from FAO and WRI studies will be used to estimate the forest area for different time periods. The CENATEL has also provided some data on annual changes in area of grassland and cropland for the period 1990-2000. An earlier study (CENATEL, 2001) related to the dynamic of land cover compared the area of land-use categories between the years 1978 and 1998 as shown in Table 3.2. Table 3.2: Comparison of LUC areas between 1978 and 1998
Area of the category in % of the total area of the country Land-use categories 1978 1998
Forest and grassland 68.57 60.74 Cropland 30.75 37.94 Other 0.68 1.32 Source: FAO, 1980 and CENATEL, 2001. Forest includes natural forest and plantation. Other means other than forest, grassland and cropland. According to data provided in Table 3.2, the annual changes in area for “forest, grassland” together and cropland are respectively -0.61% and +1.06%. These data will be used for the period between 1985 and 1990. The annual changes in land area according to CENATEL, completed by data on forest from FAO and WRI are summarised in the Table 3.3.
Land-Use Changes and Greenhouse Gas Fluxes: Scientific Understanding and Contribution to Improving Methodologies for Greenhouse Gas Inventory in BENIN
IPCC NGGIP TSU Inventory Internship 30
Table 3.3: Annual change in land area Land use category Annual change (%) between 1985-1990 Annual change (%) between 1990-2000 Forest land -0.61 -2.2 Grassland -0.61 -1 Cropland +1.1 +2 Settlement NA NA Other* NA NA Source: FAO, 1980. CENATEL, 2001. FAO, 2001. WRI, 2003. CENATEL 2003. *Other here does not have the same meaning as Category Other Land in the GPG LULUCF. Instead it includes wetland, water bodies, and area without vegetation, sand pit and beach. NA: Not Available. Estimate of land area for different time periods The areas of the LUC presented in the Table 3.1 have been used together with the annual change rates from the Table 3.3 to estimate the areas of the LUC for different time periods. The estimates have been made for forest land, grassland and cropland for which data are provided both in Tables 3.1 and 3.3. Settlement has been included from now on into the category “Other” since data on change in area is not really available. Five years time period has been considered based on the recommendations provided in the Revised 1996 IPCC Guidelines for National Greenhouse Gas Inventories: Reporting Instructions: “In the Land-Use Change/Forestry categories, it may be desirable to estimate average emissions/removals over a several year period”. The estimate of land area has been made using the Equation 3.1: Where:
2tA : Area of land at time t2
1t
A : Area of land at time t1
r: annual change rate in land area n = t2 – t1 in absolute value (n>0)
The Table 3.4 shows the results of estimate of land area for different years. Table 3.4: Estimate of land areas for different years (ha) Year LUC
1985 1990 1995 2000
Forest land 2905697 2818148 2521495 2256069 Grassland 4829102 4683600 4454057 4235764 Cropland 3736252 3946317 4357053 4810539 Other lands* 13219 36205 151665 181898 Other here does not have the same meaning as Category Other Land in the GPG LULUCF. It includes settlement, wetland, water bodies, and area without vegetation, sand pit and beach. The area of “Other lands” has been estimated by difference between the total area of the country and the sum of the area of forest, grassland and cropland in order to be consistent with the total area of the country. From the Table 3.4, one can notice that the category “Other lands” increases rapidly mainly from 1990 to1995. This could be attributed to the growth in settlements. Actually, it is very important to mention that after the holding in February 1990 of what we have called the “National Conference” that gathered together the lifeblood (people) of the country and set up a Democratic System, many Benineses leaving abroad started to come back to their country as well as many investors. The estimate of land areas for the intermediate years can be made using the same Equation 3.1 and the annual change rate corresponding to the concerned period. The comparison with international datasets for forest land and for the year 2000 shows that the difference between data from FAO, WRI and the one from the national statistics is 2650000 ha – 2256069 ha = 393931 ha
EQUATION 3.1 ESTIMATION OF LAND AREA
ntt r)(1A A 12
+=
Land-Use Changes and Greenhouse Gas Fluxes: Scientific Understanding and Contribution to Improving Methodologies for Greenhouse Gas Inventory in BENIN
IPCC NGGIP TSU Inventory Internship 31
(i.e. 15% compared to FAO, WRI data). This comparison indicates a slight discrepancy regarding data on forest cover and the difference would be a measure of the uncertainties since the original reports do not give comprehensive information about the accuracy of data. The overall uncertainty would consider 1) the uncertainties associated with the development of vegetation map: combination of uncertainties associated with a) satellite image (Landsat and SPOT XS), b) aerial photography as well as to their c) analysis/interpretation (data are affected by subjective interpretation by different operators) and 2) uncertainties related to the record of data. The uncertainty issues are addressed in Section Uncertainty Assessment of the current report. Conversion of land-use categories An exhaustive study on conversions between all LUC is not available. It has been mentioned below some studies carried out in some parts of the country. These studies have been considered together with some information available at global scale, mainly for grassland, in order to provide complete information on the main land conversions taking place in Benin. - Conversion of forest land Study conducted in 2000 by JICA: The land area of the three classified forests in the study area is 265 595 ha for Trois Rivieres, 33 977 ha for Ouenou Benou and 251 592 ha for Alibori Superieur, totalling 551 164 ha. These classified forests constitute 44.1% of the 31 classified forests of the country, among which Trois Rivieres and Alibori Superieur are the largest from the view point of land area. However, the results of photo interpretation of aerial photographs taken for this study show that in the classified forests there are farmlands which occupy about 10.4% of Trois Rivieres, 15.6% of Ouenou Benou and 9.3% of Alibori Superieur. Thus, 56 320 ha of land in the study area i.e. 10.22% would be converted into agricultural land. An UNDP project worked in another three areas, all also in the northern part of Benin (1994-1999). Two of the project sites were in Borgou region. The principal site was based round the two reserved forests of Sota and Goungoun. The second site was a small area in the far north of the country, close to Niger River, near Karimama, in the vicinity of a remnant Rhun palm forest. The third project site was in Atacora region in the northwest of the country. The total land area covered by the project is approximately 176 000 ha. According to the project, the main driving force for forest clearing in the project area is the demand for more agricultural land. The two principal causes behind this demand are population expansion with the concomitant need for food to satisfy this population and the desire to grow cash crops to improve the quality of life. The area of forest cleared for agricultural expansion was estimated at 10 000 ha (i.e. 5.68%) in 1998 and 21 500 ha (i.e. 12.22%) in 2003. The two regions mentioned above are located in the northern part which has a large part of forest cover of the country and where agriculture is more practised. They could be considered representative samples units of conversion of forest to agricultural land. The data provided above will be used to derive the proportion of forest converted to cropland. The time period considered for this study is 1985-1999 as we can see in the matrices (Tables 3.7, 3.8 and 3.9). In this context, considering the above data for 1998 and 2000, i.e. 5.68% and 10.22% respectively, the increase in the rate of forest area converted to agricultural land has been estimated to 34.14% using an equation similar to the Equation 3.1. The percent of forest area converted each year to cropland is presented in the Table 3.5. Table 3.5: Area of forest land converted to cropland Year 1985 1990 1995 2000 Percent (%) 0.13 0.54 2.35 10.22 Estimates for the intermediate years can be made using an equation similar to the Equation 3.1. For the time period considered, areas converted from forest land to cropland have been calculated using the Equation 3.2. Where: :iA Forest area in year i
:ip Percent of forest area converted to cropland (see Table 3.5)
EQUATION 3.2
FOREST AREA CONVERTED TO CROPLAND = ∑ •i ii pA
Land-Use Changes and Greenhouse Gas Fluxes: Scientific Understanding and Contribution to Improving Methodologies for Greenhouse Gas Inventory in BENIN
IPCC NGGIP TSU Inventory Internship 32
For instance for the period [1985-1989], iA has been calculated for each year and ip applied, then the results have been added up. These are reflected in the land-use matrices presented in Tables 3.7, 3.8 and 3.9. - Conversion of grassland While most studies have been concentrated on forest, overall information on grassland as well as its dynamic is very limited. For instance, very limited useful information on grassland is provided by FAO. However, a report of a pilot study of global ecosystems conducted by WRI and focused on grassland ecosystems (http://www.wri.org/wr2000) has compared the area of grassland major habitat types to current land cover. From the above mentioned study, it is apparent that conversion of grassland to agricultural land has occurred among others in tropical and subtropical grassland and about 15% of tropical and subtropical grassland are classified as agricultural land. This data is not specific to Benin but to tropical grassland and will be used for conversion of grassland since the country is part of the tropical region. The Table 3.6 shows the conversions of tropical and subtropical grasslands into cropland, settlement and forest. From the table one can deduce that the area of grassland remaining grassland is about 72%. Table 3.6: Conversion of grassland (%) From To Agriculture (cropland) Urban Other Tropical and Subtropical grasslands, savannas, and shrublands
15.4
0.8
11.8
Source: WRI, 2000. Other represents other IGBP/PAGE land cover classification such as deciduous forests or mixed forests.
- Land-use matrices (Approaches 1 and 2 of GPG LULUCF) The data collected and estimates made until now regarding the land areas and the conversions of land-use categories have been used to develop the land-use matrices. In addition, the following assumptions have been considered: 1) Conversions from other lands (including settlement, wetland, water bodies, and area without vegetation, sand pit and beach) into forest land, grassland, and cropland are negligible; 2) Conversions from forest land, cropland, and grassland into other lands are negligible; 3) There is no conversion from cropland into forest land. The matrices are completed automatically for the other conversions for which there is no data, by differences between figures. The Tables 3.7, 3.8 and 3.9 present the land-use change matrices respectively for [1985-1989], [1990-1994] and [1995-1999]. For countries in West Africa, data mainly from satellite and ground-based surveys are limited. For this reason, in many cases data would not exactly match the sums in matrices. In practice this is also true in general. In most cases, small adjustments would be needed but should be very limited. These adjustments could be used as part of uncertainty assessment. The deviations between figures are mentioned in the Table 3.10 as referenced in the matrices. Table 3.7: Land-Use Change Matrix for [1985-1989] Initial Final
F G C O Final sum
F 2248314 d 569834 c 2818148 G 620969 d 3476953 c 585678 d 4683600 C 36414 c 743682 c 3150574 d 3946317(1) O 38633 c 13219 36205(1)
Initial sum 2905697 4829102 3736252 13219 11484270 F= Forest land; G= Grassland; C= Cropland; O= Other land (here includes settlements, wetland, water bodies, area without vegetation, sand pit and beach and does not have the same meaning as the Category Other Land in the GPG LULUCF). Blank entry indicates no/negligible land use change. c= calculated value, d= value obtained by difference between figures. (1) See Table 3.10.
Land-Use Changes and Greenhouse Gas Fluxes: Scientific Understanding and Contribution to Improving Methodologies for Greenhouse Gas Inventory in BENIN
IPCC NGGIP TSU Inventory Internship 33
Table 3.8: Land-Use Change Matrix for [1990-1994] Initial Final
F G C O Final sum
F 1968830 d 552665 c 2521495 G 708509 d 3372192 c 373356 d 4454057 C 140809 c 721274 c 3572961 d 4357053(1) O 37469 c 36205 151665(1)
Initial sum 2818148 4683600 3946317 36205 11484270 F= Forest land; G= Grassland; C= Cropland; O= Other land (here includes settlements, wetland, water bodies, area without vegetation, sand pit and beach and does not have the same meaning as the Category Other Land in the GPG LULUCF). Blank entry indicates no/negligible land use change. c= calculated value, d= value obtained by difference between figures. (1) See Table 3.10. Table 3.9: Land-Use Change Matrix for [1995-1999] Initial Final
F G C O Final sum
F 1730490 d 525579 c 2256069 G 242729 d 3206921 c 786114 d 4235764 C 548276 c 685925 c 3570939 d 4810539(1) O 35632 c 151665 181898(1)
Initial sum 2521495 4454057 4357053 151665 11484270 F= Forest land; G= Grassland; C= Cropland; O= Other land (here includes settlements, wetland, water bodies, area without vegetation, sand pit and beach and does not have the same meaning as the Category Other Land in the GPG LULUCF). Blank entry indicates no/negligible land-use change. c= calculated value, d= value obtained by difference between figures. (1) See Table 3.10. From the matrices, one can notice that the difference between forest land converted to grassland and grassland converted to forest land is not so big. This could be understood as a turnover but that is not the case. Grassland converted to forest is in the process of conversion to forest. It is important to recall that a land-use category can already be considered as forest if it is able to reach at maturity the parameters specified in the definition of forest such as minimum tree crown cover, minimum trees height. After 20 years the category is classified as forest remaining forest (IPCC default) otherwise it is still in the process of conversion to forest. Furthermore, some projects on natural regeneration have been implemented in consultation with riparian population in some areas in Benin for the conversion of grassland to forest land. But at the same time anthropogenic pressure is increasing on other forests leading to losses of different types like fuelwood gathering, commercial fellings, fires, etc. converting then forest to categories comparable to grassland. The pressure on grassland comes mainly from agriculture expansion. When cropland is abandoned it could converted into grassland. The Table 3.10 shows the differences in figures presented in the matrices for cropland and other land. Table 3.10: Deviations in figures in land-use matrices
Comparison of results Time period Cropland Other land
[1985-1989] The total sum should be: 3946317 The total sum obtained is: 3930670 Deviation compared to true value: 15647 (0.39%)
The total sum should be: 36205 The total sum obtained is: 51852 Deviation compared to true value: 15647 (43.22%)
[1990-1994] The total sum should be: 4357053 The total sum obtained is: 4435044 Deviation compared to true value: 77991 (1.79%)
The total sum should be: 151665 The total sum obtained is: 73674 Deviation compared to true value: 77991 (51.42%)
[1995-1999] The total sum should be: 4810539 The total sum obtained is: 4805140 Deviation compared to true value: 5399 (0.11%)
The total sum should be: 181898 The total sum obtained is: 187297 Deviation compared to true value: 5399 (2.97%)
For cropland differences between figures are not significant while for other land it is the opposite mainly for the periods [1985-1989] and [1990-1994]. The comments provided on Table 3.4, just after that table, can also be considered here. One conclusion could be that the uncertainty associated with the area of the “other land” is relatively high. But this category is not considered in this study. Also, comprehensive methodological guidance to estimate emissions/removals from the categories wetland and settlement included in “other land” in this study is considered in the GPG LULUCF as future work to be done due to limited scientific knowledge on these categories.
Land-Use Changes and Greenhouse Gas Fluxes: Scientific Understanding and Contribution to Improving Methodologies for Greenhouse Gas Inventory in BENIN
IPCC NGGIP TSU Inventory Internship 34
3.2 ESTIMATE OF GREENHOUSE GAS EMISSIONS AND REMOVALS FROM DIFFERENT LAND-USE CATEGORIES 3.2.1 Forest Land As mentioned in Section 2.2 Factors responsible for land-use changes in Benin, forests are subject to pressure from human activities such as agriculture expansion, pasture, wood gathering for different uses, settlement, and fire. All these activities would influence somehow the change in carbon stocks in forest and lead mostly to emissions of GHG. This section shows how estimates of GHG emissions/removals arising from human intervention on forests have been developed. It distinguishes forest land remaining forest land and land converted to forest land. In these two subcategories, the following pools have been considered: living biomass, dead organic matter, soils as well non-CO2 GHG. 3.2.1.1 Forest land remaining forest land The Equation 3.2.1 page 3.23 in the GPG LULUCF has been used to estimate the emissions/removals of CO2 from forest land remaining forest land.
• Change in carbon stocks in living biomass: aboveground and belowground biomass Increase in carbon stocks due to biomass increment in forest land remaining forest land The UNDP project mentioned in Section 3.1 undertook a carbon accounting in the two reserved areas of Sota and Goungoun called “reserved forests”. To do this an inventory of land-use categories was carried out in 1994. This stratified the forests into six land-use categories and assessed the basal area and girth (diameter) class for encountered tree species. In the sample plots, all trees above a minimum diameter of 5cm at breast height were measured. Basal area for each land-use categories (and species) was then converted into stem volume. Expansion factors have been used to estimate the total above and below ground growing stock volume and weight. The latter has been converted to carbon stock by multiplying by a standard conversion factor. All these calculations together with the assumptions and formulae are given below. The Equation 3.3 has been used to estimate the biomass stock.
The total biomass has been estimated by multiplying the basal area [B.A] by the height [Ht] and the form factor [Ff] (taper reduction factor of the stem). This gives an estimate of stem volume [S.V]. The [S.V] has been increased by a factor to account for above ground volume [A.V] and by a second factor to account for below ground volume [B.V]. The total has been then multiplied by the density factor [D] to obtain the weight of woody biomass per hectare (in terms of dry matter). The various factors used are presented as follows: Live trees: Ff=0.42; A.V=2.3; B.V=1.5; D=0.69; Ff*A.V*B.V*D=1.00 The total above ground volume took into consideration a) trees and shrubs below the minimum measured girth of 15cm. These were estimated to be more than the total number of trees above the minimum girth. This added an additional 30% to the total volume; b) branch wood and twigs: these forest types have trees with multiple branches, hence the reason for increasing the stem volume by 100% to account for this volume. Thus the total multiplying factor is 2.3 (an additional 130% of the stem volume). The belowground roots and rootlets support and secure the stem, branches, leaves and fruits of the trees as well as absorb water and nutrients. According to the inventory, about 33% of trees are in the ground. This is 50% of the above ground volume, thus a multiplying factor of 1.5 is used to account for the belowground biomass. The density of woodland species took into consideration all the different age classes. Dead trees: Ff=0.45; A.V=1.3; B.V=1.2; D=0.714; Ff*A.V*B.V*D=0.50 The form factor was estimated from the shape of the dead trees taking into consideration that the tops of the trees were gone. Much of the branches and twigs had fallen from the dead trees, hence the fact that only about 30% of the above ground volume was on these branches. Similarly, much of the belowground roots and rootlets had
Land-Use Changes and Greenhouse Gas Fluxes: Scientific Understanding and Contribution to Improving Methodologies for Greenhouse Gas Inventory in BENIN
IPCC NGGIP TSU Inventory Internship 35
decayed. Thus, the remaining roots comprise about 20% of the aboveground volume. Moreover, the density of the remaining dead wood is somewhat greater than that of the live trees because it is relatively old. The Table 3.11 presents estimate of woody biomass and carbon content per hectare for the different land-use categories in Sota and Goungoun. Table 3.11: Estimate of biomass per hectare in land-use categories of Sota and Goungoun in 1994 Sota Goungoun Land-use categories
Trees/ha Basal area
Average height
Biomass Carbon Trees/ha Basal area
Average height
Biomass Carbon
Number (live/dead)
m2/ha meters tdm/ha tC/ha Number (live/dead)
m2/ha m tdm/ha tC/ha
Gallery forest
L D
282 10
10.8 0.4
15 15
162.0 3.0
82.5
L D
451 19
13.9 0.5
16 15
222.4 3.8
113.1
Woodland L D
288 20
5.5 0.4
9 10
49.5 2.0
25.8
L D
191 50
6.2 1.8
10 10
62.0 9.0
35.5
Open woodland
L D
258 21
5.3 0.4
9 10
47.7 2.0
24.8
L D
280 36
5.4 0.8
9 10
48.6 4.0
24.3
Shrubland L D
232 14
3.8 0.4
4 8
15.2 1.6
8.4
L D
222 37
3.0 1.0
5 8
15.0 4.0
9.5
Rocky woodland
L D
401 23
5.6 0.3
6.5 7
36.4 1.0
18.7
L D
384 24
5.0 0.5
6 7
30.0 1.8
19.4
Shifting cultivation
L D
87 22
2.5 0.6
6 7
15.6 2.1
8.8
L D
59 16
3.9 0.7
6 7
23.4 2.4
12.9
The number of live (L) and dead (D) trees per hectare and basal area are taken from the forest inventory. The top height of trees is estimated in the field. The carbon content of biomass is 0.495 of the weight of the biomass assuming a 1% ash content. This was rounded to 0.50 or 50% of the biomass weight. Source: Brown S. 1995. Forest Inventory, Project Ben/93/G31. Openshaw. K. 1986. Concepts and Methods for Collecting and Compiling Statistics on Biomass used for Energy. UNSO New York 1986. U.K. Forestry Commission 1971. Forest Management Tables. HMSO, England, U.K. The total woody biomass and carbon stocks have been estimated considering the area of the different land-use categories. The estimates are presented in the Table 3.12. Table 3.12: Estimate of total biomass stocks in land-use categories of Sota and Goungoun in 1994. Sota Goungoun Land-use categories
Total area (ha)
Tree type Biomass (000 tdm)
Carbon (000 t)
Total area (ha)
Tree type
Biomass (000 tdm)
Carbon (000 t)
Gallery forest
1 940 Live Dead
314 6
160
5 068 Live Dead
1127 19
573
Woodland 25 926 Live Dead
1283 52
668
31 108 Live Dead
1929 280
1104
Open woodland
9 438 Live Dead
450 19
234
23 551 Live Dead
1145 94
620
Shrubland 5 012 Live Dead
76 8
42
3 592 Live Dead
54 14
34
Rocky woodland
3 261 Live Dead
119 3
61
4 501 Live Dead
135 8
72
Shifting cultivation
6 500 Live Dead
101 14
57
5 200 Live Dead
122 12
67
Total 52 077 Live Dead
2343 102
1223
73 020 Live Dead
4512 427
2470
The per-hectare figures presented in Table 3.11 have been multiplied by the area to obtain an estimate of stock of biomass and carbon. Source: Forest Inventory, (1995) Project Ben/93/G31. No measurements on annual increments (annual removals) of above and below ground woody biomass in the various LUC are available. These measurements should be based on biomass growth of trees in permanent sample plots established for this purpose. From the information available, some sample plots have been established, but measurements have been limited to girth of specific trees, rather than undertaking girth and height measurement of all species as well as measurement of changes in biomass stocks in different carbon pools including living biomass, dead organic matter and soils. The results from the sample plots indicate that there has been no measurable change in the girth of the targeted trees for the trees were measured by girth class with 10 cm intervals. On average, it would take up to 10 years for a tree to move from a lower to a higher girth class. Therefore, in order to estimate the annual increment and the net accumulation of biomass, the project made some specific assumptions regarding the growth of trees. In an area with an annual rainfall ranging between 900 and 1000 mm, the net primary production (NPP) of total above ground biomass including herbs, leaves and wood should be between 7 and 8 tonnes (dry) per year (Lieth H. 1975), of which about half should be woody biomass production. The assumptions are then based on the rainfall, the nominal rotations and the original growing stock of living trees. The first set of assumptions is designated “low assumptions” where the nominal rotations are long while in the second set of assumptions termed “high assumptions”, the nominal rotations are shorter.
Land-Use Changes and Greenhouse Gas Fluxes: Scientific Understanding and Contribution to Improving Methodologies for Greenhouse Gas Inventory in BENIN
IPCC NGGIP TSU Inventory Internship 36
The nominal rotation is the planned number of years between the tree planting or forest stand regeneration and the final harvesting for sawlogs and other roundwood. The rotation lengths vary depending on the growth rate of the trees, forest type and management practices (thinning for instance) that might be planned during the rotation period. The growth rate itself depends on the quality of land, rainfall, etc. When estimating the accumulation, only above and below ground biomass of live trees are considered. The assumptions are summarized in the Table 3.13. Table 3.13: Assumptions for annual increment of living biomass in land-use categories Yearly increase:
low accumulation Rotation Yearly increase:
high accumulation Rotation
Gallery forest 1.0% 120 years 2.0% 60 years Other land-use categories 2.0% 40 years 4.0% 20 years Shifting cultivation 6.5% 32 years 8.0% 19 years Other land-use categories include closed and open woodlands, degraded shrub areas and woodlands on rocky ground. Source: Project Ben/93/G31 The nominal rotation assumes that there is a fairly uniform distribution of all age classes of trees, thus the stock of wood is the sum of all these age classes. A forest of only mature trees would have about twice the above wood stock. Thus, the annual increment (I) is equal to twice the growing stock (GS) divided by the rotation R and conversely, R=2GS/I (source: Project Ben/93/G31). Five year accumulation has been considered to derive the annual biomass increment. The calculation has been done using data in Table 3.13 and the Equations 3.4.
EQUATION 3.4 ESTIMATE OF BIOMASS ACCUMULATION
tt BBB −=Δ +5
( )ntt rBB +=+ 15 ( )( )11 −+=Δ n
t rBB Where: BΔ : Five-year biomass accumulation (here between 1994 and 1999). :tB Total biomass stock (dry matter) in year t (here t=1994)
:5+tB Total biomass stock (dry matter) in year t+5 (here t+5=1999) :r Yearly increase in biomass :n 5 years The Table 3.14 presents the estimated five year accumulation of biomass and carbon in each land-use category of Sota and Goungoun areas. Table 3.14: Estimate of five year accumulation of living biomass in land-use categories of Sota and Goungoun. Sota area Goungoun area Land-use categories Biomass stock in
1994 5-years accumulation Biomass stock in
1994 5-years accumulation
000 tdm 000 tdm 000 tdm 000 tdm Low High Low High Gallery forest 314 16.0 32.7 1127 57.5 117.3 Woodland 1283 133.5 278 1929 200.8 417.9 Open woodland 450 46.8 97.5 1145 119.2 248.1 Shrubland 76 7.9 16.5 54 5.6 11.7 Rock woodland 119 12.4 25.8 135 14.1 29.2 Shifting cultivation 101 37.4 47.4 122 45.2 57.3 Total Increment 254 497.9 442.4 881.5 Total stock 2343 2597 2840.9 4512 4954.4 5394 Carbon stock 5-years accumulation Carbon stock 5-years accumulation 000 t C 000 t C 000 t C 000 t C Total Increment 127 249 221 441 Total stock 1172 1299 1420 2256 2477 2697
Land-Use Changes and Greenhouse Gas Fluxes: Scientific Understanding and Contribution to Improving Methodologies for Greenhouse Gas Inventory in BENIN
IPCC NGGIP TSU Inventory Internship 37
The land-use categories considered forests in the two reserves of Sota and Goungoun according to characteristics and definitions presented in Tables 2.1, 2.2 and 2.3 include gallery forest, woodland and open-woodland. The other land-use categories including grasslands (shrubland, rocky woodland), croplands (shifting cultivation) are considered in their respective sections in this report. For the forest land considered, the total estimate of five year accumulation and the annual per hectare accumulation of biomass and carbon are presented in the Table 3.15. Table 3.15: Estimate of annual per ha accumulation of living biomass in forest land of Sota and Goungoun
Low High Total Increment 287 596 Total stock 3124 3411 3720 Annual production per hectare of above and below ground biomass and carbon (total area 97031 ha) Production of biomass (tdm/ha/yr) 1.18 2.46 Production of carbon (tC/ha/yr) 0.59 1.23 The annual per hectare accumulation of above and below ground biomass and carbon has been calculated by dividing the total increment by the total area (97031 ha) and the time period (5 years). The method is similar to method 2 in the GPG LULUCF i.e. stock change method on page 3.24. The above mentioned study covered the agro-ecological zone located in the north of Benin. In 2000, a programme called “PGFTR”: Programme de Gestion des Forets et Terroirs Riverains (Programme of Management of Forests and Riparian Land) conducted a study on carbon sequestration. This study covered four sites samples chosen in the remaining three other agro-ecological zones located respectively in the north of centre part, south of centre part and the south of the country. The northern part of the country having been already covered by the UNDP project mentioned above. The PGFTR carried out a forest inventory and collected data to estimate the above and below ground biomass for living and dead trees. Another study has been undertaken to estimate the soil organic carbon content. These data have been completed by additional data from inventory of other forests and general information on carbon measurement in wood and soil. The programme covered a total area of 1.068 million hectares i.e. approximately 10% of the country’s area. The area of the site samples by type of LUC are presented in the Table 3.16. Table 3.16: Land-use categories and areas in the agro-ecological zones covered by PGFTR
Land use categories Area of sites samples (ha) OS N’Dali TTK DDA 1. Galerie forestière Gallery forest 3920 100 1590 600 2. Forêt dense semi-décidue Closed semi-deciduous forest 10990 150 960 --- 3. Forêt claire et savane boisée Open forest and savannah woodland 106880 1000 16380 500 4. Savane arborée et arbustive Tree savannah/ Mixed savannah 39460 3370 19860 7800 5. Savane arborée et arbustive saxicole Shrub savannah 3800 --- 20 400 6. Savane arborée et arbustive à emprise agricole
Farmlands (cropland) 7080 --- 4380 4900
7. Mosaïque de cultures et jachères Crop, fallow land 3000 --- 5940 4900 8. Forêt plantation Forest plantations --- 200 220 300 9. Mosaïque de cultures et jachères sous palmeraie
Crop, fallow land --- --- --- 600
10. Autres types d’utilisation Other 2410 30 650 --- Total 177540 4850 50000 20000 Name of site sample : OS : Oueme Superieur ; N’Dali ; TTK : Tchaourou-Toui-Kilibo, DDA : Djidja-Dan-Atcherigbe. Actually, these are names of areas (town, villages) where samples are located. Other includes urban areas, roads, and waterways. Sources: CENATEL, 2000; from LANDSAT TM and SPOT XS image between 1990 and 1997. The study indicated that the scale on the map has an error of 2%. The sampling procedure for estimating living biomass by the PGFTR in briefly described as follows: two parameters have been measured, that is to say diameter/circumference and height of all live and dead trees for which the circumference at breast height (1.30 meters) is more than 15cm and within a 10 meters radius. Then, trees that have circumference less than 15 cm have been counted by species at the same height. In total 45 000 data on diameter and 11 000 on height have been collected (PGFTR, 2000). The second sampling procedure that is destructive consists of cutting down all trees and shrubs and weighing biomass within a 10 m radius. In this process, the total number of trees subject of measurement is 550 (PGFTR, 2000). The stem volume and form factor of trees have been estimated using the formulae of Smalian or Huber.
Land-Use Changes and Greenhouse Gas Fluxes: Scientific Understanding and Contribution to Improving Methodologies for Greenhouse Gas Inventory in BENIN
IPCC NGGIP TSU Inventory Internship 38
Moreover, samples of wood of each tree species have been collected in order to determine the humidity content and the density. The latter have been determined jointly by the “Laboratory of Applied Ecology” and the “Faculty of Agronomic Sciences” of the National University of Benin. The number of samples here is 80 including live tree, dead tree, and leave (PGFTR, 2000). The original data, collected by sampling or determined in laboratories, that could be useful for the assessment of uncertainty have not been obtained. However, given the great number of data, the estimated parameters would be relatively accurate. The uncertainty issues are addressed in the Section Uncertainty Assessment of this report. An estimate of the total above and below ground biomass has been done for each sample investigated and all land-use categories. For the estimate of change in carbon stocks, only forest land and living biomass have been considered in the current section. The land-use categories that meet the definition of forest presented in Tables 2.1, 2.2 and 2.3 include gallery forest, closed semi-deciduous forest, open forest and savannah woodland i.e. categories 1, 2 and 3 in the Table 3.16. The Tables 3.17 to 3.20 show the calculation method and parameters used to estimate the volume of trees and the above and below ground biomass in different site samples and land-use categories (here forest land). The calculation is similar to calculation of total carbon in biomass using the Equation 3.2.3 p.3.24 (stock change method) in the GPG LULUCF and considering the following country-specific parameters: basic density = 0.71tdm/m3, BEF2=1.75; 1.48; 1.48 respectively for gallery forest, closed semi-deciduous forest, open forest and savannah woodland, R= 0.5 and CF= 0.5, as presented in the Tables 3.17 to 3.20. BEF2 is the biomass expansion factor for conversion of merchantable volume to above ground tree biomass. Table 3.17: Estimate of living biomass in forest land of Oueme Superieur. LUC Area Vol. Above volume and weight: big trees (circ.> 15 cm) a+bgr.
Biomass (big
trees)
a+bgr. Biomass (small trees)
Total biomass (small trees)
Total a+bgr.
Biomass (big and
small trees)
Total organic carbon
ha Stem vol.
m³/ha
Total vol.
Stem 1000 m³
Branch exp.
Factor
Total vol.
branch 1000 m³
volume (stem + branch)
1000 m³
Above weight (density
0.71 tdm/ m³)
Total weight
000 tdm.
Weight tdm/ha.
Weight 000tdm.
Total weight
000 tdm
000 tC
A B C D E F G H I J K L A x B C x D C+E 0.71x F 1.5 x G A x I H + J 0.5 x K 1 3920 99.30 389.3 0.75 291.9 681.2 483.7 725.6 0.52 2.0 727.6 363.8 2 10990 21.80 239.6 0.48 115.0 354.6 251.8 377.6 1.16 12.8 390.4 195.2 3 106880 21.80 2330.0 0.48 1118.4 3448.4 2448.3 3672.5 1.16 124.0 3796.5 1898.2 Table 3.18: Estimate of living biomass in forest land of N’dali LUC Area Vol. Above volume and weight: big trees (circ.> 15 cm) a+bgr.
Biomass (big
trees)
a+bgr. Biomass (small trees)
Total biomass (small trees)
Total a+bgr.
Biomass (big and
small trees)
Total organic carbon
ha Stem vol.
m³/ha
Total vol.
Stem 1000 m³
Branch exp.
Factor
Total vol.
branch 1000 m³
volume (stem + branch)
1000 m³
Above weight (density
0.71 tdm/ m³)
Total weight
000 tdm.
Weight tdm/ha.
Weight 000tdm.
Total weight
000 tdm
000 tC
A B C D E F G H I J K L A x B C x D C+E 0.71x F 1.5 x G A x I H + J 0.5 x K 1 100 74.52 7.5 0.75 5.6 13.0 9.3 13.9 0.52 0.1 13.9 7.0 2 150 17.79 2.7 0.48 1.3 4.0 2.8 4.2 1.16 0.2 4.4 2.2 3 1000 17.79 17.8 0.48 8.5 26.3 18.7 28.0 1.16 1.1 29.1 14.6
Land-Use Changes and Greenhouse Gas Fluxes: Scientific Understanding and Contribution to Improving Methodologies for Greenhouse Gas Inventory in BENIN
IPCC NGGIP TSU Inventory Internship 39
Table 3.19: Estimate of living biomass in forest land of TTK LUC Area Vol. Above volume and weight: big trees (circ.> 15 cm) a+bgr.
Biomass (big
trees)
a+bgr. Biomass (small trees)
Total biomass (small trees)
Total a+bgr.
Biomass (big and
small trees)
Total organic carbon
ha Stem vol.
m³/ha
Total vol.
Stem 1000 m³
Branch exp.
Factor
Total vol.
branch 1000 m³
volume (stem + branch)
1000 m³
Above weight (density
0.71 tdm/ m³)
Total weight
000 tdm
Weight tdm/ha
Weight 000 tdm
Total weight
000 tdm
000 tC
A B C D E F G H I J K L A x B C x D C+E 0.71x F 1.5 x G A x I H + J 0.5 x K 1 1590 74.52 118.5 0.75 88.9 207.4 147.2 220.8 0.52 1.1 222 111 2 960 24.40 23.4 0.48 11.2 34.6 24.6 36.9 1.16 1.1 38.0 19.0 3 16380 24.40 399.7 0.48 191.8 591.5 420.0 630.0 1.16 19.0 649.0 324.5 Table 3.20: Estimate of living biomass in forest land of DDA LUC Area Vol. Above volume and weight: big trees (circ.> 15 cm) a+bgr.
Biomass (big
trees)
a+bgr. Biomass (small trees)
Total biomass (small trees)
Total a+bgr.
Biomass (big and
small trees)
Total organic carbon
ha Stem vol.
m³/ha
Total vol.
Stem 1000 m³
Branch exp.
Factor
Total vol.
branch 1000 m³
volume (stem + branch)
1000 m³
Above weight (density
0.71 tdm/ m³)
Total weight
000 tdm
Weight tdm/ha.
Weight 000 tdm
Total weight
000 tdm
000 tC
A B C D E F G H I J K L A x B C x D C+E 0.71x F 1.5 x G A x I H + J 0.5 x K 1 600 74.52 44.7 0.75 33.5 78.2 55.6 83.3 0.52 0.3 83.6 41.8 2 3 500 14.40 7.2 0.48 3.5 10.7 7.6 11.3 1.16 0.6 11.9 6.0 a+bgr.: above and below ground According to forest inventory, approximately 33% of live tree is in soil, i.e. 50% of aboveground volume of tree is in the roots. Thus, G is multiplied by 1.5 to account for belowground biomass. The Table 3.21 summarizes the estimate of living biomass in the sites samples considered. Table 3.21: Summary of estimate of living biomass in forest land of OS, N’dali, TTK, DDA Oueme superieur N’Dali TTK DDA LUC Area Total
tdm/ha tC/ha tdm/ha tC/ha tdm/ha tC/ha tdm/ha tC/ha Biomass and C stocks/ha
40.35 20.18 37.92 18.96 48.02 24.01 86.82 43.41
For the forest lands in Sota and Goungoun, the total stock of biomass (a+bgr.) and carbon are presented in the Table 3.22, considering only living biomass; the data are basically from the Table 3.12.
Land-Use Changes and Greenhouse Gas Fluxes: Scientific Understanding and Contribution to Improving Methodologies for Greenhouse Gas Inventory in BENIN
IPCC NGGIP TSU Inventory Internship 40
Table 3.22: Summary of estimate of living biomass in forest land of Sota and Goungoun Sota Goungoun LUC Area Total a+bgr.
The Tables 3.21 and 3.22 show that the range of living biomass stocks in forests is 38 – 87 tdm/ha. The same assumptions presented in the Table 3.13, as for Sota and Goungoun for biomass accumulation, have been used together with the Equation 3.4 to estimate 5-years biomass accumulation in forest land of OS, N’dali, TTK, and DDA. The estimates are presented in the Table 3.23. Table 3.23: Estimate of five years and annual per ha accumulation of living biomass in forest land of OS, N’dali, TTK, and DDA together. Land-use categories Biomass stock in 2000 5-years accumulation 000 tdm 000 tdm Low High 1 1047.1 53.4 109 2 432.8 45 93.8 3 4486.5 467 972 Total Increment 565.4 1174.8 Total stock 5966.4 6531.8 7141.2 Carbon stock 5-years accumulation 000 t C 000 t C Total Increment 282.7 587.4 Total stock 2983.2 3265.9 3570.6 Annual per ha production of above and below ground biomass and carbon (total area 143070 ha) Production of biomass (tdm/ha/yr) 0.79 1.64 Production of carbon (tC/ha/yr) 0.40 0.82 The annual biomass productions of forests considered are summarized in the Table 3.24. Table 3.24: Summary of annual per ha accumulation of above and below ground biomass in forest land Sota + Goungoun OS + N’dali + TTK + DDA Low High Low High Production of biomass (tdm/ha/yr) 1.18 2.46 0.79 1.64 Production of carbon (tC/ha/yr) 0.59 1.23 0.40 0.82 The sites samples considered (Sota + Goungoun, OS, N’dali, TTK, DDA) covered all agro-ecological zones of Benin and are assumed to be representative for the whole country. On the basis of this assumption and considering the range of data for biomass production that is [0.79-2.46], the mean 1.63 tdm/ha/yr will be used. The uncertainty associated with this is addressed under the section Uncertainty Assessment. The above data have been used with the Equation 3.2.4 p.3.25 GPG LULUCF to estimate the increase in carbon stocks due to biomass increment. Table 3.25: Estimate of total increase in carbon stocks due to biomass increment in forest land Time Period Forest land area (ha) Increase in carbon stocks (000 tC) [1985-1989] 2248314 1832.4 [1990-1994] 1968830 1604.6 [1995-1999] 1730490 1410.4 Decrease in carbon stocks due to biomass loss in forest land remaining forest land The major disturbances that affect forests in Benin come from commercial roundwood fellings, fuelwood gathering and fires. The total loss of biomass in forests is then the sum of all losses from these disturbances. Carbon loss due to commercial fellings: Although no comprehensive disaggregated data are available to indicate the share of plantations in the industrial roundwood production, most industrial roundwood are harvested from natural forests and woodlands and the proportion from plantations is still low. The total supply of commercial roundwood can be divided into two components: local production and importation.
Land-Use Changes and Greenhouse Gas Fluxes: Scientific Understanding and Contribution to Improving Methodologies for Greenhouse Gas Inventory in BENIN
IPCC NGGIP TSU Inventory Internship 41
Considering the figures in the Table 2.6, the annual increase in the industrial roundwood production (consumption) between 1980-1990 and 1990-2000 has been estimated, respectively, at 3.4% and 1.9%. These rates have been used to estimate the total industrial roundwood production for the times period considered i.e. [1985-1989], [1990-1994], [1995-1999]. The estimates are presented in the Table 3.26. Table 3.26: Estimate of production of industrial roundwood for different time period (000 m3)
Time period [1985-1989] [1990-1994] [1995-1999]
1246.2 1423.1 1563.5 The Equation 3.2.7 p.3.27 GPG LULUCF has been used to estimate the carbon loss due to commercial fellings. The use of chain saw in many cases, although prohibited in Benin, to harvest wood (cut down trees) leads to a significant loss of biomass. It is important to notice that, the population in Benin has heavily relied on biomass used as energy source and thus it is expected that little amount of biomass is left to decay on the ground in forest and other land use categories. In these conditions the use of the default value 0.4 as fraction of biomass transferred into the dead wood pool seems inappropriate since it appears to be high for the country. A value between [0.09-0.11] with a mean of 0.10 would be acceptable. The basic wood density D = 0.71tdm/m3 and the biomass expansion factor BEF2= 1.75; 1.48; 1.48 respectively for gallery forest, closed semi-deciduous forest, open forest and savannah woodland (Source: Forest inventory, PGFTR 2000). For BEF2, the mean 1.62 taken from the range [1.48-1.75] has been used since the proportion of fellings from different forests is unknown. The carbon loss due to commercial fellings is presented in the Table 3.27. Table 3.27: Loss of carbon due to commercial fellings. Time period (5 years) Extracted volume of roundwood (000 m3) Lfelling (Carbon loss due to commercial fellings)
(000 tC) [1985-1989] 1246.2 430.0 [1990-1994] 1423.1 491.1 [1995-1999] 1563.5 539.5 A part of those losses certainly comes from the category land converted to forest land. But information on this is not available. As default, all these losses are allocated to forest land remaining forest land. Carbon loss due to fuelwood gathering: Supply of wood for energy: As mentioned in Section 2.2, woody biomass is an important source of energy for population in Benin. Data in the Table 2.5 and method similar to that mentioned above have been used to estimate the fuelwood consumption. The annual increase rates between 1980-1990 and 1990-2000 are respectively 1.3% and 0.8%. The estimates of fuelwood gathered for the time period considered are presented in the Table 3.28. Table 3.28: Estimate of fuelwood gathered for different time period (000 m3)
Time period [1985-1989] [1990-1994] [1995-1999]
28799.1 30367.0 31601.3 The Equation 3.2.8 p.3.27 GPG LULUCF together with the same parameters as above i.e. D, BEF2 and CF has been used to estimate the loss of carbon due to fuelwood gathering as presented in the Table 3.29. Table 3.29: Total loss of carbon due to fuelwood gathering for all land-use categories (000 tC) Time period (5 years) Total volume of fuelwood gathering
(000 m3) Lfuelwood
Total carbon loss due to fuelwood gathering (000 tC) [1985-1989] 28799.1 16562.36 [1990-1994] 30367.0 17464.06 [1995-1999] 31601.3 18173.91 Data in the Table 2.5 are total fuelwood gathered from all land-use categories, not only from forests. But the fuelwood would be gathered mainly from forests and to lesser extent from cropland. On this basis, the following distribution between the different land-use categories, based on expert judgment, has been done. Table 3.30: Distribution of fuelwood gathered between the different land-use categories. Land-use categories Percent of fuelwood from each land-use category (%) Forest land remaining forest land 50 Land converted to forest land 20 Grassland remaining grassland 20 Cropland remaining cropland 10
Land-Use Changes and Greenhouse Gas Fluxes: Scientific Understanding and Contribution to Improving Methodologies for Greenhouse Gas Inventory in BENIN
IPCC NGGIP TSU Inventory Internship 42
These percents have been applied to the total carbon loss due to fuelwood gathering in Table 3.29 to allocate the share that comes from each land-use category. The Table 3.31 shows the loss of carbon due to fuelwood gathering from forest land remaining forest land. Table 3.31: Loss of carbon due to fuelwood gathering from forest land remaining forest land. Time period (5 years) Lfuelwood forest remaining forest
Carbon loss due to fuelwood gathering (000 tC) [1985-1989] 8281.18 [1990-1994] 8732.03 [1995-1999] 9086.95 The losses from the other land use categories are presented in their respective sections of this report. Carbon loss due to other losses: - Fires: Vegetation fires are known to contribute significantly to the injection of gases and aerosols into the atmosphere, and to be a major disturbance to the vegetation cover. Comprehensive studies on forest fires do not exist at national level. According to fire situation in Benin presented by FAO in its report Global Forest Fire Assessment: 1990-2000, about 75000 km2 of forest land are exposed to fires each year during 1990s. The total area of the country being 114 842.7 km2 and since an average of 61% is covered by vegetation during that period (all vegetation cover included), the figure 75000 km2 (i.e. 65% of country area even more than vegetation cover) seems too high. The UNEP has developed a database on global burned area in 2000 through the Global Burned Area 2000 Project (http://www.grid.unep.ch/activities/earlywarning/preview/ims/gba/). Medium resolution (1km) satellite imagery provided by the SPOT-Vegetation System has been used to derive statistics of area burned per type of vegetation cover. From this database, the following information has been obtained. Table 3.32: Land area burned per month in 2000 in Benin (km2) January February March April May June July August September. October November December Year
2000 1581 282 4 54 15 1 0 0 3 0 1769 9943 13652
Source: UNEP, Global Burned Area 2000 The Table 3.32 shows that fires occur mainly between November and February and that the total area burned by fire in 2000 is 13652 km2. The UNEP database also provides the land area burned for each land-use category as shown in the Table 3.33. Table 3.33: Land area burned for broad land-use category. Land-use category Burned area (km2) Percent of category burned (%) Broadleaf forests 2 18.1 Woodlands and Shrublands 10614 14.4 Grasslands and Croplands 2400 5.8 Source: UNEP, Global Burned Area 2000 But these data are for 2000; to estimate the carbon loss, we assume that the interannual variability regarding the areas burned is not large and the data will be kept constant for each time period considered. The Equation 3.2.9 p.3.28 GPG LULUCF has been applied to estimate the loss of carbon due to fires. The forest area affected by fire is Adisturbance=1061600 ha/yr. It has been assumed that only aboveground biomass, which is 67% of the total biomass (Source: Forest inventory, PGFTR 2000) burns when fires occur. According to the data presented in the Tables 3.21 and 3.22, the range of aboveground biomass per ha is [25.41-58.17]. This gives a mean Bw= 41.79 tdm/ha which will be applied. Default fBL= 0.4. In these conditions, for a period of five year [1985-1989], [1990-1994] and [1995-1999] the estimate is as follows: Lfire= [(200x18.1/100+1061400x14.4/100) x 5 x 41.79 x (1-0.4) x 0.5 = 9583145 tC. This loss of carbon burned onsite in case of fire includes loss from forest land remaining forest land and land converted to forest land. But the distribution between these two categories is not known. As default, the distribution of land areas has been used. The area of forest land remaining forest land is respectively 80%, 78% and 77% of the total area of forest for [1985-1989], [1990-1994] and [1995-1999]. This has been applied to derive the carbon loss due to fires (onsite burning). Furthermore under the Section Carbon loss due to commercial fellings, it has been mentioned that a large proportion of biomass left on the ground is used by population as energy source, thus burned offsite. This fraction is 0.3 since 0.1 is assumed left to decay on the ground.
Land-Use Changes and Greenhouse Gas Fluxes: Scientific Understanding and Contribution to Improving Methodologies for Greenhouse Gas Inventory in BENIN
IPCC NGGIP TSU Inventory Internship 43
The Table 3.34 shows the estimate of total carbon loss due to biomass burning. Table 3.34: Carbon loss due to fire in forest land remaining forest land (000 tC) Time-period [1985-1989] [1990-1994] [1995-1999] Carbon loss due to fire 7881.52 7720.38 7648.77 Also a part of dead organic matter and soil organic carbon burns in case of fires. But this is not estimated because of lack of information. For the estimate of the non-CO2 emissions, all C losses due to fires in all pools should be considered. In the context of this study, the carbon released presented in the Table 3.34 will be used further to estimate the non-CO2 GHG emissions from fires. - Pest outbreaks: Insects and diseases are integral components of forest dynamics. However, under certain conditions they have adverse effects on many aspects of forests such as tree growth and survival, yield and quality of wood and non-wood products. The importance of pests and their negative impacts on forests have been for the most part understated. Insects and diseases influence the health of natural and planted forests, trees outside forests and other wooded lands. These disturbances and also windstorms are not well known in Benin and then have not been considered in this study. The total decrease in carbon stocks due to biomass loss has been estimated using the Equation 3.2.6. p.3.26 GPG LULUCF and the results are presented in the Table 3.35. Table 3.35: Total decrease in carbon stocks due to biomass loss in forest land remaining forest land. Time-period Lfelling (Carbon loss due
to commercial felling) (000 tC)
Lfuelwood (Carbon loss due to fuelwood gathering )
(000 tC)
Lother losses (Carbon loss due to other losses (fire here)
(000 tC)
Total loss (000 tC)
[1985-1989] 430.0 8281.18 7881.52 16592.7 [1990-1994] 491.1 8732.03 7720.38 16943.51 [1995-1999] 539.5 9086.95 7648.77 17275.22 The Equation 3.2.2 p.3.24 GPG LULUCF has enabled to estimate the total change in carbon stocks in living biomass. Table 3.36: Total change in carbon stocks in living biomass in forest land remaining forest land. Time-period Total increase in carbon stocks due
to biomass increment (000 tC) Total decrease in carbon stocks due
to biomass loss (000 tC) Total change in carbon stocks in
living biomass (000 tC) [1985-1989] 1832.4 16592.7 -14760.3 [1990-1994] 1604.6 16943.51 -15338.9 [1995-1999] 1410.4 17275.22 -15864.8 Choice of Emission/Removals Factors - Annual increase in living biomass (a+bgr.): country-specific data have been used to estimate Gtotal which is the average annual increment in total biomass (Gtotal= 1.63 tdm/ha/yr). Root-to-shoot R: according to forest inventory, 33% of live tree is in soil, i.e. nearly 50% of above ground volume of tree is in roots. Then R= 0.5. Therefore Gw (annual aboveground biomass increment) is calculated using the Equation 3.2.5 (A) p.3.26 GPG LULUCF. Gw= Gtotal/(1+R) = 1.63/(1+0.5) = 1.1 tdm/ha/yr. The GPG LULUCF suggests a default value of 1.3 tdm/ha/yr for Africa. The basic wood density estimate from forest inventory is D= 0.71tdm/m3 BEF2=1.75; 1.48; 1.48 respectively for gallery forest, closed semi-deciduous forest, open forest and savannah woodland, CF= 0.5. BEF2 is the biomass expansion factor for conversion of merchantable volume to above ground tree biomass. - Annual biomass loss: Commercial fellings: The following country-specific parameters have been used: Basic wood density D= 0.71tdm/m3, BEF2= 1.62 which is the mean of [1.48-1.75]. The default fBL= 0.4 has been used as well as CF= 0.5. Fuelwood gathering: Basic wood density D= 0.71tdm/m3, BEF2= 1.62, CF=0.5. Other losses: Fires: country-specific per ha biomass stocks Bw= 41.79 tdm/ha has been used.
Land-Use Changes and Greenhouse Gas Fluxes: Scientific Understanding and Contribution to Improving Methodologies for Greenhouse Gas Inventory in BENIN
IPCC NGGIP TSU Inventory Internship 44
It has also been applied the fraction 0.3 to estimate the amount of biomass burned offsite from commercial fellings (see also Annex IV). Choice of Activity Data: Country-specific data on land area have been used. Uncertainty estimates: Uncertainty associated with emission/removal factors and activity data are presented in the Section Uncertainty Assessment.
• Change in Carbon Stocks in Dead organic matter This carbon pool is mainly composed of dead wood and litter.
Dead wood The Equation 3.2.11 p.3.33 in the GPG LULUCF has been used to estimate the change in carbon stocks in dead wood. Binto defined as the transfer into the dead wood pool includes biomass left on the site from harvest (deduced from commercial fellings), biomass from natural mortality, and biomass from trees killed by fire (deduced from biomass loss due to fire). But all emissions do not necessarily occur at the time of disturbance. Other disturbances such as pest outbreaks, windstorms have not been considered. The estimate of transfer of carbon from each component of Binto has been done separately as presented below. - Biomass left on site from commercial fellings i.e. biomass cut. According to the Equation 3.2.7 p.3.27 GPG LULUCF, this can be estimated by the following expression. Biomass cut = H*D*BEF2*fBL*CF where fBL= 0.1 The parameters used to estimate the carbon loss due to commercial fellings in living biomass of forest land remaining forest land are also used here. The estimates are presented in the Table 3.37. Table 3.37: Carbon transfer into dead wood pool from commercial fellings in forest land remaining forest land Time-period Carbon transfer into DOM from commercial fellings
(000 tC) [1985-1989] 71.67 [1990-1994] 81.84 [1995-1999] 89.92 - Carbon transferred into the dead wood pool due to fire Considering the Equation 3.2.9 p.3.28 GPG LULUCF, the carbon transfer to DOM due to fire in forest land remaining forest land is: C transfer from fire to DOM= Afire*Bw*fBL*CF. The parameters used to estimate the carbon loss due to fire in living biomass of forest land remaining forest land have been used. The Table 3.38 presents the estimates.
- Carbon transferred into the dead wood pool due to natural mortality The partial forest inventories undertaken by the Project Ben/93/G31 and the PGFTR in the four agro-ecological zones of Benin considered also dead trees. The Tables 3.39 to 3.43 show estimates of carbon stocks in dead trees in the forest samples considered: Sota, Goungoun, OS, N’dali, TTK, and DDA. Table 3.39: Biomass stocks in dead trees in Sota and Goungoun forests Sota Forest Reserve Goungoun Forest Reserve Land-use categories Total area (ha) Biomass
Land-Use Changes and Greenhouse Gas Fluxes: Scientific Understanding and Contribution to Improving Methodologies for Greenhouse Gas Inventory in BENIN
IPCC NGGIP TSU Inventory Internship 45
Table 3.40 : Biomass stocks in dead trees in Oueme Superieur forest LUC Area Vol. Above volume and weight: big trees (circ.> 15 cm) a+bgr.
Biomass (big
trees)
a+bgr. Biomass (small trees)
Total biomass (small trees)
Total a+bgr.
Biomass (big and
small trees)
Total organic carbon
ha Stem vol.
m³/ha
Total vol.
Stem 1000 m³
Branch exp.
Factor
Total vol.
branch 1000 m³
volume (stem + branch)
1000 m³
Above weight (density
0.71 tdm/ m³)
Total weight
000 tdm
Weight tdm/ha.
Weight 000 tdm
Total weight
000 tdm
000 tC
A B C D E F G H I J K L A x B C x D C+E 0.71x F 1.5 x G A x I H + J 0.5 x K 1 3920 3.50 13.7 0.22 3.0 16.7 11.9 17.9 5.00 19.6 37.4 18.7 2 10990 1.53 16.8 0.07 1.2 18.0 12.8 19.2 1.11 12.2 31.4 15.7 3 106460 1.53 163.5 0.07 11.5 175.0 124.2 186 1.11 118.2 303.8 151.9 Total 121370 372.6 186.3 Table 3.41 : Biomass stocks in dead trees in N’dali forest LUC Area Vol. Above volume and weight: big trees (circ.> 15 cm) a+bgr.
Biomass (big
trees)
a+bgr. Biomass (small trees)
Total biomass (small trees)
Total a+bgr.
Biomass (big and
small trees)
Total organic carbon
ha Stem vol.
m³/ha
Total vol.
Stem 1000 m³
Branch exp.
Factor
Total vol.
branch 1000 m³
volume (stem + branch)
1000 m³
Above weight (density
0.71 tdm/ m³)
Total weight
000 tdm
Weight tdm/ha.
Weight 000 tdm
Total weight
000 tdm
000 tC
A B C D E F G H I J K L A x B C x D C+E 0.71x F 1.5 x G A x I H + J 0.5 x K 1 100 2.76 0.3 0.22 0.06 0.3 0.2 0.3 5.00 0.5 0.8 0.4 2 150 1.71 0.3 0.07 0.02 0.3 0.2 0.3 1.11 0.2 0.5 0.25 3 1000 1.71 1.3 0.07 0.1 1.4 0.98 1.5 1.11 1.1 2.6 1.3 Total 1250 3.9 1.95 Table 3.42 : Biomass stocks in dead trees in TTK forest LUC Area Vol. Above volume and weight: big trees (circ.> 15 cm) a+bgr.
Biomass (big
trees)
a+bgr. Biomass (small trees)
Total biomass (small trees)
Total a+bgr.
Biomass (big and
small trees)
Total organic carbon
ha Stem vol.
m³/ha
Total vol.
Stem 1000 m³
Branch exp.
Factor
Total vol.
branch 1000 m³
volume (stem + branch)
1000 m³
Above weight (density
0.71 tdm/ m³)
Total weight
000 tdm
Weight tdm/ha.
Weight 000 tdm
Total weight
000 tdm
000 tC
A B C D E F G H I J K L A x B C x D C+E 0.71x F 1.5 x G A x I H + J 0.5 x K 1 1590 2.76 4.4 0.22 1.0 5.4 3.8 5.7 5.00 8.0 13.7 6.8 2 960 1.71 1.6 0.07 0.1 1.7 1.2 1.9 1.11 1.1 2.9 1.5 3 16380 1.71 28.0 0.07 2.0 30.0 21.3 31.9 1.11 18.2 50.1 25.05 Total 18930 66.7 33.35
Land-Use Changes and Greenhouse Gas Fluxes: Scientific Understanding and Contribution to Improving Methodologies for Greenhouse Gas Inventory in BENIN
IPCC NGGIP TSU Inventory Internship 46
Table 3.43: Biomass stocks in dead trees in DDA forest LUC Area Vol. Above volume and weight: big trees (circ.> 15 cm) a+bgr.
Biomass (big
trees)
a+bgr. Biomass (small trees)
Total biomass (small trees)
Total a+bgr.
Biomass (big and
small trees)
Total organic carbon
ha Stem vol.
m³/ha
Total vol.
Stem 1000 m³
Branch exp.
Factor
Total vol.
branch 1000 m³
volume (stem + branch)
1000 m³
Above weight (density
0.71 tdm/ m³)
Total weight
000 tdm
Weight tdm/ha.
Weight 000 tdm
Total weight
000 tdm
000 tC
A B C D E F G H I J K L A x B C x D C+E 0.71x F 1.5 x G A x I H + J 0.5 x K 1 600 2.76 1.7 0.22 0.3 2.0 1.4 1.8 5.00 3.0 4.8 2.4 2 3 500 1.01 0.5 0.07 0.0 0.5 0.4 0.5 1.11 0.6 1.0 0.5 Total 1100 5.8 2.9 The Table 3.44 summarizes the estimate of the biomass in dead trees due to natural mortality. Table 3.44: Summary of biomass stocks in dead trees due to natural mortality in forest land considered Sota Goungoun OS N’dali TTK DDA Area (ha) 37304 59727 121370 1250 18930 1100 Total biomass (000 tdm) 77 393 372.6 3.9 66.7 5.8 Biomass (tdm/ha) 2.1 6.6 3.1 3.1 3.5 5.3 The range of values for biomass stocks in dead wood from natural mortality is 2.1-6.6 tdm/ha with an estimated mean of 4.35. This value will be used to estimate the transfer into the dead wood due to natural mortality of trees. For the time period and forest areas considered, the estimates are given in the Table 3.45. Table 3.45: Estimate of carbon stocks in dead trees due to natural mortality in forest land remaining forest land Time-period Forest land area (ha) Total carbon (000 tC) [1985-1989] 2248314 4890.08 [1990-1994] 1968830 4282.21 [1995-1999] 1730490 3763.82 The total transfer of carbon into the dead wood pool (i.e. Binto) is presented in the Table 3.46. Table 3.46: Total carbon transfer into the dead wood pool in forest land remaining forest land. Time-period Forest land area (ha) Binto: total carbon (000 tC) [1985-1989] 2248314 10072.76 [1990-1994] 1968830 9347.29 [1995-1999] 1730490 8773.09 Bout defined as the transfer out of the dead wood pool is mainly the carbon emissions from that pool due to decay. These emissions are calculated basically by multiplying the dead wood carbon stock by the decay rate. Specific studies on the decay rates have not been conducted in Benin. Those studies should include for example the estimation of rate of respiration from dead wood by collecting pieces of dead wood at various stages of decay and measuring the rate of CO2 production using for instance infrared gas analyzer. The decay rate could also be estimated using radiocarbon measurements to quantify the date of mortality and then combine that with measurements of wood density to quantify changes in density over time. A study conducted by J.Q. Chambers. Et al., February 2000 (Decomposition and carbon cycling of dead trees in tropical forest of the central Amazon) measured decomposition rate constants for boles of 155 large dead trees (>10 cm diameter) in central Amazon forests. Mortality data from 21 ha of permanent plots, monitored for 10-15 years, were use to select dead trees for sampling. Measured rate constants varied by over 1.5 orders of magnitude (0.015-0.67 year-1), averaging 0.19 year-1 with predicted error of 0.026 year. This data will be used as default for decay rate (tropical region) to estimate the carbon stocks change in the dead wood pool (Binto – Bout). Since a period of five years is considered, some carbon stocks in the dead wood pool would have more time to decay than others. For instance, the biomass entering the dead wood pool in 1985 has more time to decay than the biomass entering during the subsequent years, assuming that the pool has not been subject to major disturbances. Therefore the carbon stocks change in the dead wood pool between [t; t+4] can be estimated using the Equation 3.5.
Land-Use Changes and Greenhouse Gas Fluxes: Scientific Understanding and Contribution to Improving Methodologies for Greenhouse Gas Inventory in BENIN
IPCC NGGIP TSU Inventory Internship 47
EQUATION 3.5: ESTIMATE OF CARBON STOCKS CHANGE IN THE DEAD WOOD POOL
5 Where: gestockschanC : Total carbon stocks change in the dead wood pool
tC : Carbon stocks entering the dead wood pool in year t
k : Decay rate constant It has been assumed that the interannual variability of the carbon flux that enters the dead wood pool is negligible throughout the time period considered and then the carbon flux entering annually the dead wood is equal to 1/5 of Binto. In these conditions, Ct=Ct+1=Ct+2=Ct+3=Ct+4 and estimates of change in carbon stocks in the dead wood pool are presented in the Table 3.47. Table 3.47: Change in carbon stocks in dead wood in forest land remaining forest land (000 tC) Time period Forest land area (ha) Binto Bout Total change in carbon
stocks in dead wood [1985-1989] 2248314 10072.76 4478.98 5593.78 [1990-1994] 1968830 9347.29 4156.39 5190.90 [1995-1999] 1730490 8773.09 3901.07 4872.02 Litter: The default data provided in the Table 3.2.1 p.3.36 GPG LULUCF for tropical broadleaf forest and 20 years transition period have been used i.e. 2.1 tC/ha to estimate change in carbon stocks in litter. Table 3.48: Change in carbon stocks in litter (000 tC) Time Period Forest land area (ha) Total change in carbon stocks in litter [1985-1989] 2248314 4721.5 [1990-1994] 1968830 4134.5 [1995-1999] 1730490 3634.0 The Equation 3.2.10 p.3.32 GPG LULUCF is used to estimate the change in carbon stocks in dead organic matter in forest land remaining forest land. Table 3.49: Total change in carbon stocks in dead organic matter in forest land remaining forest land (DOM) Period (5 years) Total change in carbon stocks in
dead wood Total change in carbon stocks in
litter Total change in carbon stocks in
dead organic matter (000 tC) [1985-1989] 5593.78 4721.5 10315.28 [1990-1994] 5190.90 4134.5 9325.4 [1995-1999] 4872.02 3634.0 8506.02 Choice of Emission/Removal factors - Dead wood Transfer into the dead wood pool due to commercial fellings: the parameters used to estimate the carbon loss due to commercial fellings in living biomass of forest land remaining forest land have been used. D=0.71tdm/m3, BEF2= 1.62, fBL = 0.1, CF = 0.5. Transfer into the dead wood pool due to fire: the parameters used to estimate the carbon loss due to fire in living biomass of forest land remaining forest land have been used. Bw= 41.79 tdm/ha, fBL = 0.4, CF = 0.5. Transfer into the dead wood pool due to natural mortality: the value 4.35 tdm/ha has been estimated based on the data gathered from the partial forest inventory. Transfer out of dead wood pool: the decay rate has been derived from a study conducted in the tropical forest in Amazon, k=0.19 ±0.026 year-1 - Litter The default value of 2.1 tC/ha has been used.
Land-Use Changes and Greenhouse Gas Fluxes: Scientific Understanding and Contribution to Improving Methodologies for Greenhouse Gas Inventory in BENIN
IPCC NGGIP TSU Inventory Internship 48
Choice of Activity Data Areas of forest land remaining forest land, areas of burned land. Uncertainty estimates Uncertainty associated with emission/removal factors and activity data are presented in the Section Uncertainty Assessment.
• Changes in Carbon Stocks in Soils Considering the definition of organic soil presented in the glossary of IPCC GPG LULUCF and the characteristics of soils developed in “Les Sols Béninois: Classification dans la Base de Référence Mondiale” (Soils in Benin: Classification in the World Reference Base for Soil Resources), Youssouf., I. and Lawani., M. 2000, one can notice that the majority of soils in Benin are mineral soils. Details on characteristics on soils in Benin are given in Section 3.2.2 Cropland. Besides carbon being stored in woody biomass, organic carbon is also stored in many types of soils under different land-use categories. However there is a general build-up of soil organic carbon (SOC) stocks from arable soils to dense forest soils on the same or similar soil types (Bouwmann A. F., 1990). The estimates of the SOC content have been made by the UNDP project (Project Ben93/G31) in the north of Benin and by the programme PGFTR in the other agro-ecological zones of the country. The estimates made by the Project Ben93/G31 are based on the generalized SOC profiles of the major units of the world and the differing carbon contents between land-use categories (Bouwmann A. F., 1990. Soils and the Greenhouse Effect. John Wiley & Sons, New York. 575 pages). For example, it has been estimated that the gallery forests have on average 120 tonnes of carbon per hectare stored in soil down to five meters in depth and that the soils under shifting cultivation have 70 tonnes per hectare down to 5m in depth. Excluded from the SOC estimates are inorganic carbon of calcium carbonate and other mineral carbonates found in some soils. The estimates are presented in the Table 3.50. Table 3.50: Estimate of SOC stocks down to 5 metres in land-use categories of Sota and Goungoun forests Sota Goungoun Sota & Goungoun
Total 52077 4831 73020 6954 125097 11785 Source: Project Ben/93/G31 As far as the estimates of SOC content in the other agro-ecological zones are concerned, a soil prospecting study has been conducted by the National Centre of Agro-pedology in the classified forest of Tchaourou-Toui-Kilibo (TTK). This prospecting concerned eight types of land-use categories and consisted of collecting samples in twenty (20) pedological profiles which depth ranging between 0.8 and 1.6 cm. These samples have been analyzed in laboratory for the determination of soil organic carbon content. This information has been used to estimate the soil organic carbon content in all zones covered by the programme PGFTR. Considering other existing studies such as Cerri and Volkoff, (1987); FAO/UNESCO (1981), the organic carbon content in soils has been estimated up to 5m depth. The results of estimates are presented in the Tables 3.51 to 3.54. Table 3.51: Estimate of SOC stocks down to 5 metres in land-use categories of OS forest
Soil organic carbon LUC Area (ha) tC/ha 000 tC
1 3920 170 666 2 & 3 117870 106 12494 4 & 5 43260 100 4326 6, 7 & 9 10080 88 887 Total 175130 18373 Source: PGFTR, 2000. LUC 1 to 9 are those reported in Table 3.16.
Land-Use Changes and Greenhouse Gas Fluxes: Scientific Understanding and Contribution to Improving Methodologies for Greenhouse Gas Inventory in BENIN
IPCC NGGIP TSU Inventory Internship 49
Table 3.52: Estimate of SOC stocks down to 5 metres in land-use categories of N’dali Soil organic carbon LUC Area (ha)
tC/ha 000 tC 1 100 155 16 2 & 3 1150 101 116 4 & 5 3370 94 317 6, 7 & 9 - - - Total 4620 449 Source: PGFTR, 2000. LUC 1 to 9 are those reported in Table 3.16. Table 3.53: Estimate of SOC stocks down to 5 metres in land-use categories of TTK
Soil organic carbon LUC Area (ha) tC/ha 000 tC
1 1590 155 246 2 & 3 17340 110 1907 4 & 5 19880 105 2087 6, 7 & 9 10320 84 867 Total 49130 5108 Source: PGFTR, 2000. LUC 1 to 9 are those reported in Table 3.16. Table 3.54: Estimate of SOC stocks down to 5 metres in land-use categories of DDA
Soil organic carbon LUC Area (ha) tC/ha 000 tC
1 600 155 93 2 & 3 500 98 49 4 & 5 8200 96 787 6, 7 & 9 10400 93 967 Total 19700 1896 Source: PGFTR, 2000. LUC 1 to 9 are those reported in Table 3.16. The Table 3.55 presents a summary of the estimates of SOC in the different agro-ecological zones of Benin and different land-use categories. Table 3.55: Summary of SOC stocks per ha in land-use categories in different agro-ecological zones (tC/ha)
Land-use categories Sota + Goungoun OS N’dali TTK DDA 1 120 170 155 155 155 Forest land 2 & 3 99 106 101 110 98
Grassland 4 & 5 79 100 94 105 96 Cropland 6, 7 & 9 70 88 - 84 93 Considering data in the Table 3.55 as range of data points, the mean has been estimated as presented below. Forest land: range [98-170], mean: 134 tC/ha; Grassland: range [79-105], mean: 92 tC/ha and Cropland: range [70-93], mean: 81.5 tC/ha. The mean will be used as reference carbon stocks (SOCREF) for the different land-use categories, considering the assumption that the soils have been affected by low disturbances. Since it has been assumed that there is accumulation of biomass in living trees in various LUC (over 5 years to estimate biomass accumulated/ha/yr, considering nominal rotation and original growing stocks of living trees), there should also be accumulation of organic carbon in soils under different LUC. This is because root and rootlet growth will increase and then with the mortality of their tissues. Small roots and rootlets are being constantly replaced as are leaves/grass and soil fauna and flora, contributing to accumulation of SOC. The increase in SOC is principally a function of roots and rootlets death, and decay of other belowground moribund flora and fauna. In addition, some SOC is added by the decomposition of dead flora and fauna on the soil surface such as leaves, grass, small animals and micro-organisms and the incorporation of carbon formed when vegetation fires occur. But, decaying roots and rootlets is the principal source of SOC, thus it has been assumed that SOC will accumulate at the same rate as the increase in roots growth i.e. accumulation of carbon in woody biomass in roots. This is one-third of the total accumulation of carbon in living biomass since according to forest inventory approximately 33% of live tree is in soil i.e. about 50% of above ground volume of tree is in roots. To be in line with the GPG LULUCF, 20-years accumulation is considered to derive the change in carbon stocks in soils in forest land remaining forest land. An Equation similar to the Equation 3.4 is used, considering 20-years period. The results of the estimates are presented in Table 3.56 and Table 3.57.
Land-Use Changes and Greenhouse Gas Fluxes: Scientific Understanding and Contribution to Improving Methodologies for Greenhouse Gas Inventory in BENIN
IPCC NGGIP TSU Inventory Internship 50
Table 3.56: Estimate of annual per ha accumulation of SOC in forest land remaining forest land in Sota and Goungoun (total area: 97031 ha) 20-years biomass accumulation (000 tdm) LUC Biomass stock in 1994
000 tdm Low High Gallery forest 1441 317.3 700.3 Closed and open woodland 4807 2336 5725.7 Total biomass accumulation 2653.3 6426 Biomass (tdm/ha/yr) 1.37 3.31 Carbon (tC/ha/yr) 0.68 1.66 SOC (tC/ha/yr) 0.23 0.55 Source: Data from Table 3.14 Table 3.57: Estimate of annual per ha accumulation of SOC in forest land remaining forest land in OS, N’dali, TTK, DDA (total area: 143070 ha)
20-years biomass accumulation (000 tdm) LUC Biomass stock in 2000 000 tdm Low High
1 1047.1 230.6 508.8 2 & 3 4919.3 2390.5 5859.5 Total accumulation 2621.1 6368.3 Biomass (tdm/ha/yr) 0.92 2.23 Carbon (tC/ha/yr) 0.46 1.12 SOC accumulation (tC/ha/yr) 0.15 0.37 Source: Data from Table 3.23 The method is similar to that described by the Equation 3.2.14 p.3.40 GPG LULUCF related to the estimate of change in carbon stocks in mineral soils in forest land remaining forest land. SOCi has been derived directly without using reference carbon stocks and adjustment factors. This is based on the assumption that there is no major disturbance on forest soils for forest land remaining forest land. According to data presented in Tables 3.56 and 3.57, the values of SOC accumulation in forest land remaining forest land range from 0.15 to 0.55 tC/ha/yr; the estimated mean is 0.35 tC/ha/yr. This value will be used to estimate the change in carbon stocks in mineral soils in forest land remaining forest land. The Table 3.58 presents the estimates. Table 3.58: Change in carbon stocks in mineral soils in forest land remaining forest land. Time period Forest land area (ha) Total change in carbon stocks (000 tC) [1985-1989] 2248314 786.91 [1990-1994] 1968830 689.09 [1995-1999] 1730490 605.67 Choice of Emission/Removal Factors The emission/removal factors used to estimate the change in carbon stocks in soils are linked to those used to estimate change in living biomass. The estimated accumulation rate of carbon in soil is 0.35 tC/ha/yr. Choice of Activity Data The activity data is the land areas. Uncertainty estimate This is addresses in the Section Uncertainty Assessment. The total carbon emission/removal from forest land remaining forest land has been estimated using the Equation 3.2.1 p.3.23 GPG LULUCF. Table 3.59: Estimate of total change in carbon stocks in forest land remaining forest land and emissions/removals of CO2. Time period (5 years)
Forest land area (ha)
Change in carbon stocks in living biomass
(000 tC)
Change in carbon stocks in
dead organic matter
(000 tC)
Change in carbon stocks in
soils (000 tC)
Total change in carbon stocks
(emissions/removals) (000 tC)
Total CO2 (emissions/removals)
(Gg)
A B C D=A+B+C E=D*44/12 [1985-1989] 2248314 -14760.3 +10315.28 +786.91 -3658.11 -13413.1 [1990-1994] 1968830 -15338.9 +9325.4 +689.09 -5324.41 -19522.8 [1995-1999] 1730490 -15864.8 +8506.02 +605.67 -6753.11 -24761.4 In the Table 3.59, the net increases in carbon stocks (removals) are positive (+) and net decreases (emissions) are negative (-). But for reporting purposes, i.e. in Reporting Tables, emissions are positive (+) and removals negative (-) i.e. there is change in signs.
Land-Use Changes and Greenhouse Gas Fluxes: Scientific Understanding and Contribution to Improving Methodologies for Greenhouse Gas Inventory in BENIN
IPCC NGGIP TSU Inventory Internship 51
• Non-CO2 Greenhouse Gas Emissions N2O emissions from forest soils
- N2O emissions from forest soils due to N fertilisation of forests N2O emissions from managed forest are calculated on the basis of the mineral and organic nitrogen amount applied to forest soils. According to a World Bank report (BIRD, 1993), Benin is one of the African countries where the consumption of synthetic fertilizer is low. In 1992, this consumption was about 38 kg/ha. Only main cash crop and source of currency such as oil palm tree, groundnut and cotton have received official efforts through the policy of fertilizer use. In this context, cotton cultivation consumes today about 90% of synthetic fertilizer used in Benin. Apart from the fraudulent quantity imported from Nigeria, which is subject to any control, official statistics on synthetic fertilizers consumed in Benin are presented in the Table 3.60. Table 3.60: Consumption of fertilizer in Benin 1992 2000 2001 Amount of synthetic fertilizer (tonnes)
24000 68621 70490
Source: Statistic Department of Ministry of Agriculture, Farming and Fishing. The amount of fertilizer used for forest fertilisation is unknown, but it has been noticed that the largest part would be used in agriculture. Therefore, it has been assumed that N2O emissions due to N fertilization of forests are negligible.
- N2O emissions from forest soils due to drainage and rewetting of forest soils Drainage and rewetting of organic forest soils could be reported as “not occurring” in Benin. Therefore, non-CO2 emissions arising from that source could be considered negligible. Non-CO2 Greenhouse Gas Emissions from Biomass Burning Biomass burning is a source of emissions of CO2, CH4, N2O, CO, and NOx. The Equation 3.2.19 p.3.49 GPG LULUCF has been used to estimate the non-CO2 GHG emissions from biomass burning on managed forest lands. The carbon emission estimated for other losses due to fire and presented in the Table 3.34 in Section 3.2.1.1 Forest land remaining forest land has been used as activity data. The estimates are presented in the Table 3.61. Table 3.61: Non-CO2 greenhouse gas emissions from biomass burning in forest land remaining forest land (000 t or Gg) Carbon emissions due to fire (000 t) CH4 CO N2O NOx [1985-1989] 7881.52 126.10 1103.41 0.87 31.53 [1990-1994] 7720.38 123.53 1080.85 0.85 30.88 [1995-1999] 7648.77 122.38 1070.83 0.84 30.60 Choice of Emissions/Removals Factors Default N/C= 0.01 ratio has been used. Default data provided in the Table 3.A.1.15, p.3.185 GPG LULUCF have been used. Choice of Activity Data Carbon loss due to fire is used as activity data. Uncertainty Estimate See Section Uncertainty Assessment The Table 3.62 presents the total estimates of emissions/removals of GHG for the category forest land remaining forest land. Table 3.62: Total emissions/removals of GHG from forest land remaining forest land (Gg) CO2 CH4 CO N2O NOx [1985-1989] -13413.1 -126.10 -1103.41 -0.87 -31.53 [1990-1994] -19522.8 -123.53 -1080.85 -0.85 -30.88 [1995-1999] -24761.4 -122.38 -1070.83 -0.84 -30.60 From the Table 3.62, it can be noted that the category forest land remaining forest land is a net source of GHG emissions.
Land-Use Changes and Greenhouse Gas Fluxes: Scientific Understanding and Contribution to Improving Methodologies for Greenhouse Gas Inventory in BENIN
IPCC NGGIP TSU Inventory Internship 52
3.2.1.2 Land converted to forest land Managed land is converted to forest land by afforestation and reforestation, either by natural or artificial regeneration (including plantations). The definitions of afforestation and reforestation provided by the GPG LULUCF are presented below. Afforestation: direct human-induced conversion of land that has not been forested for a period of at least 50 years to forested land through planting, seeding and/or the human-induced promotion of natural seed sources. Reforestation: direct human-induced conversion of non-forested land to forested land through planting, seeding and/or the human-induced promotion of natural seed sources, on land that was forested but that has been converted to non-forested land. This section covers the land areas that have been forests the last 20 years. After 20 years, they fall into the category forest land remaining forest land. The change in carbon stocks in land converted to forest land has been estimated using the Equation 3.2.21 p.3.51 GPG LULUCF. The equation considers the change in carbon stocks in living biomass, in dead organic matter and in soil.
• Change in carbon stocks in living biomass The calculations distinguish between two broad management practices: intensive (e.g. plantation forestry) and extensive (e.g. naturally regenerated forests with minimum human intervention). The Equation 3.2.22 p.3.51 GPG LULUCF has been used to estimate the change in carbon stocks in living biomass in land converted to forest land through natural and artificial regeneration. Increase in carbon stocks in living biomass The areas of land converted to forest land are presented in the land-use change matrices under conversion of grassland into forest. Actually it has been assumed that those areas include plantation and natural regeneration. The forest plantations mentioned in the Table 2.1 are those that have been forest since a period of more than 20 years, then already considered as forest land remaining forest land. Furthermore, some projects have been implemented for natural regeneration of forests and executed in consultation with the riparian population. But the area of plantations in the state of conversion towards forest as well as the area of forest naturally regenerated is not known. Nevertheless, the land area under natural regeneration would be higher than that under plantation. Based on expert judgment, it has been assumed that the land area under plantation is one-third (1/3) and that under natural regeneration two-third (2/3) of the total area of land converted to forest land. The Table 3.63 shows the distribution of land converted to forest land between plantation and natural regeneration. Table 3.63: Distribution of land converted to forest land between plantation and natural regeneration (ha)
Type of conversion Time-period Plantation Natural regeneration
[1985-1989] 189945 379889 [1990-1994] 184222 368443 [1995-1999] 175193 350386 According to estimate made by the PGFTR on a sample of 1660 ha of plantation, the living biomass stocks are 38000 tdm and 83000 tdm respectively in 2000 and 2006. The average annual per ha increment in above and below ground living biomass can be estimated at G(Total int_man) = (83000-38000)/(1660*6) = 4.52 tdm/ha/yr. For the natural regeneration, G(Total ext_man) is calculated using the Equation 3.2.5 p.3.26 GPG LULUCF with the default value Gw= 5.3 tdm/ha/yr and the value R= 0.5 tdm/tdm instead of default 0.42 tdm/tdm. G(Total ext_man) = 5.3•(1+0.5) = 7.95 tdm/ha/yr. Data on land area in the Table 3.63 and G(Total int_man) and G(Total ext_man) calculated above have been used in the Equation 3.2.23 p.3.52 GPG LULUCF to estimate the increase in carbon stocks in living biomass as presented in the Table 3.64. Table 3.64: Increase in carbon stocks in living biomass in land converted to forest land (000 tC) Time-period Plantation Natural regeneration Total [1985-1989] 429.3 1510.1 1939.4 [1990-1994] 416.3 1464.6 1880.9 [1995-1999] 396.0 1392.8 1788.8
Land-Use Changes and Greenhouse Gas Fluxes: Scientific Understanding and Contribution to Improving Methodologies for Greenhouse Gas Inventory in BENIN
IPCC NGGIP TSU Inventory Internship 53
Decrease in carbon stocks in living biomass due to losses The activities responsible for losses of carbon in land converted to forest land include commercial fellings, fuelwood gathering and fire. Carbon loss due to commercial fellings The total carbon loss due to this activity has already been reported in the Table 3.27 in Section 3.2.1.1 Forest land remaining forest land. The part that is from land converted to forest land is not known. Carbon loss due to fuelwood gathering The data in the Table 3.65 have been calculated from the assumptions elaborated in the Table 3.30. Table 3.65: Loss of carbon due to fuelwood gathering in land converted to forest land (000 tC) Time period Lfuelwood land converted to forest land
Carbon loss due to fuelwood gathering (000 tC) [1985-1989] 3312.47 [1990-1994] 3492.81 [1995-1999] 3634.78 Carbon losses due to fires The carbon loss when fire occurs in land converted to forests is presented in the Table 3.66. The data have been estimated on the basis of the assumptions developed under the Paragraph Carbon loss due to other losses in Section 3.2.1.1 Forest land remaining forest land.
Choice of Emissions/Removals Factors Plantation: the average annual increment in living biomass (a+bgr.) G(Total int_man) = 4.52 tdm/ha/yr. Natural regeneration: G(Total ext_man) = 7.95 tdm/ha/yr. Choice of Activity Data Areas converted to forest land. Uncertainty Estimate This is addressed under the Section Uncertainty Assessment. The total change in carbon stocks in living biomass in land converted to forest is presented in the Table 3.67. Table 3.67: Total change in carbon stocks in living biomass in land converted to forest land (Gg). Time period Total increase in carbon stocks Total decrease in carbon stocks Total change in carbon stocks [1985-1989] + 1939.4 -5229.1 -3289.7 [1990-1994] + 1880.9 -5601.1 -3720.2 [1995-1999] + 1788.8 -5838.9 -4050.1
• Change in carbon stocks in dead organic matter Change in carbon stock in dead wood Binto comes mainly from the natural mortality of trees while Bout is mainly due to decay of dead wood. For the natural regeneration, data on transfer rate into the dead wood pool due to the natural mortality of trees in forest land remaining forest land i.e. 4.35 tdm/ha will be used. For plantations, the forest inventory undertaken by the PGFTR estimated the accumulation of biomass in dead trees for two plantations areas as presented in the Table 3.68. Table 3.68: Accumulation of biomass in dead trees in plantation Location Areas (ha) Annual estimated accumulation (000 tdm) N’dali 200 0.2 DDA 300 0.4 Source: PGFTR, 2000
Table 3.66: Loss of carbon due to fire in land converted to forest land (000 tC) Time period Lfire land converted to forest land
Carbon loss due to fire (000 tC) [1985-1989] 1916.63 [1990-1994] 2108.29 [1995-1999] 2204.12
Land-Use Changes and Greenhouse Gas Fluxes: Scientific Understanding and Contribution to Improving Methodologies for Greenhouse Gas Inventory in BENIN
IPCC NGGIP TSU Inventory Internship 54
The transfer rate into the dead wood pool for plantation will be assumed equal to 1.2 tdm/ha/yr; this is the mean of the range [1-1.33] of data points from the Table 3.68. The areas of plantation and natural regeneration presented in the Table 3.63 have been used together with the above transfer rates to estimate the biomass transfer into the dead wood pool due to natural mortality. The Table 3.69 shows the estimates. Table 3.69: Transfer of carbon into the dead wood pool due to natural mortality in land converted to forest land (000 tC) Time period Plantation Natural regeneration Binto: Total transfer
The Equation 3.5 has been used to estimate the change in carbon stocks in the dead wood pool in land converted to forest land. The same assumptions are used i.e. there is not a large difference between transfers of carbon into the dead wood pool from one year to another. Also, the decay rate from the Equation 3.5 has been used. The estimates of change in carbon stocks in dead wood pool are presented in the Table 3.70. Table 3.70: Change in carbon stocks in the dead wood pool in land converted to forest land (000 tC) Time period Binto Bout Total change in carbon stocks in
dead wood [1985-1989] 940.23 418.09 522.14 [1990-1994] 911.90 405.49 506.41 [1995-1999] 867.21 385.62 481.59 Change in carbon stocks in litter It has been assumed that the litter carbon stocks in non-forest lands converting to forests are stable and the net effect on emission or removal is negligible. The reason is that sufficient information is not available. Choice of Emission/Removal Factors Data on transfer rates into the dead wood pool due to the natural mortality in plantation and natural regeneration are respectively 1.2 tdm/ha and 4.35 tdm/ha. The decay rate has been derived from a study conducted in the tropical forest in Amazon, k=0.19 ±0.026 year-1. Choice of Activity Data Areas of land converted to forest land through natural regeneration and plantation. Uncertainty Estimate This is addressed under the Section Uncertainty Assessment of this report.
• Change in carbon stocks in soils Comprehensive studies do not address the issue of SOC content in land converted to forest land in Benin. Some data on carbon stocks in land under plantation only are provided in the Table 3.71; not change in stocks. Table 3.71: SOC stocks in plantation Location Areas (ha) SOC stocks down to 5 meters (000 tC) N’dali 200 18 TTK 220 20 DDA 300 26 Source: PGFTR, 2000 From the matrices, it can be noticed that mainly grasslands are converted to forest lands. The Equation 3.2.32 p.3.63 GPG LULUCF has been used together with the assumptions that there is no distinction between intensive and extensive management of new forests. Thus, SOCExt forest = SOCInt forest = SOCREF = 134 tC/ha and SOCNon-
forest land = 92 tC/ha (see Table 3.55). Then the per hectare annual change in carbon stocks in mineral soils in land converted to forest land is calculated as follows: (134 – 92)/20 = 2.1 tC/ha/yr. The change in carbon stocks in mineral soil in land converted to forest land is presented in the Table 3.72.
Land-Use Changes and Greenhouse Gas Fluxes: Scientific Understanding and Contribution to Improving Methodologies for Greenhouse Gas Inventory in BENIN
IPCC NGGIP TSU Inventory Internship 55
Table 3.72: Total change in carbon stocks in mineral soils in land converted to forest land (000 tC) Time Period Area of land converted to forest land Total change in carbon stocks in soils [1985-1989] 569834 1196.65 [1990-1994] 552665 1160.60 [1995-1999] 525579 1103.72 Choice of Emission/Removal Factors SOCREF forest = 134 tC/ha, SOCREF grassland = 92 tC/ha. Choice of Activity Data Activity data consists of area of grassland converted to forest land. Uncertainty Estimate Uncertainty related to emission/removal factors and activity data are addressed in Section Uncertainty Assessment.
• Non-CO2 greenhouse gas emissions N2O emissions from soils due to 1) N fertilisation of soils and 2) drainage and rewetting of soils In land converted to forest land, those emissions are considered negligible since the above mentioned activities would not occur or would be used at very low scale. Non-CO2 Greenhouse Gas Emissions from Biomass Burning Data in Table 3.66 have been used in the Equation 3.2.19 p.3.49 GPG LULUCF with the following factors: N/C ratio = 0.01, emission ratios presented in Table 3.A.1.15, p.3.185 GPG LULUCF to estimate the non-CO2 GHG emissions from biomass burning. The estimates are presented in the Table 3.73. Table 3.73: Non-CO2 GHG emissions from biomass burning in land converted to forest land (000 t or Gg) Carbon released
(000 tC) CH4 CO N2O NOx
[1985-1989] 1916.63 30.67 268.33 0.21 7.67 [1990-1994] 2108.29 33.73 295.16 0.23 8.43 [1995-1999] 2204.12 35.27 308.58 0.24 8.82 The uncertainty associated with the estimate of non-CO2 emissions depends on the uncertainty related to the carbon loss due to fire and the emission factors. This is addressed in Section Uncertainty Assessment. The total GHG emissions/removals from the category land converted to forest land are presented in the Table 3.74. Table 3.74: Total emissions/removals of GHG for land converted to forest land (Gg) CO2 CH4 CO N2O NOx [1985-1989] -5760 -30.67 -268.33 -0.21 -7.67 [1990-1994] -7528.36 -33.73 -295.16 -0.23 -8.43 [1995-1999] -9037.56 -35.27 -308.58 -0.24 -8.82 3.2.2 Cropland The characteristics and definition of cropland provided in the Tables 2.1, 2.2 and 2.3 have been used to identify the lands that could be croplands as presented in the Table 3.1. The state of cropland in Benin could be described briefly as follows. The crop-and-fallow complexes in the coastal zone contain large numbers of oil palms (Elaeis guineensis) under which farmers grow their food crops. The palms are often mixed with other trees such as Chlorophora excelsa and Lophira lanceolata, dominating a thick low grassy shrub layer. Further north, there are fewer palm groves and farmland is scattered with isolated species or small thickets, the remaining of the original forests. The most frequent species are Ceiba pentandra and Chlorophora excelsa. Tree and shrub savannah with large inroads by agriculture is typical of most of the central zone. Crops and fallow areas are dotted with trees from the surrounding savannah left by the farmers, especially those supplying edible fruit such as Parkia biglobosa and Butyrospermum paradoxum, which have given rise to a flourishing trade.
Land-Use Changes and Greenhouse Gas Fluxes: Scientific Understanding and Contribution to Improving Methodologies for Greenhouse Gas Inventory in BENIN
IPCC NGGIP TSU Inventory Internship 56
The annual crops in Benin include mainly cereals (maize, groundnut, millet, sorghum, cotton, beans, etc), root crops (yam, cassava, potato) and vegetables while perennial crops consist mainly of trees, shrubs in combination with plantations such as oil palm, coconut, bananas, and mangoes. The current section deals with estimates of GHG emissions/removals from cropland remaining cropland and land converted to cropland. 3.2.2.1 Cropland remaining cropland The three subcategories including living biomass, dead organic matter and soils are considered with a view to estimating GHG emission/removal from cropland remaining cropland. The GPG LULUCF recommends estimating CO2 emissions/removals using the GPG LULUCF and CH4 and N2O emissions using the guidance provided in the Agriculture Chapter of the GPG 2000 and the 96 Guidelines. The Equation 3.3.1 p.3.70 GPG LULUCF has been used to estimate the emission/removal of CO2 from cropland remaining cropland. The change in carbon stocks in living biomass has been estimated using country-specific data on carbon accumulation and loss whereas a combination of country-specific and default data has been used to estimate the change in dead organic matter and soils pools.
• Change in carbon stocks in living biomass Cropland includes all annual and perennial crops as well as fallow land but change in carbon stocks in living biomass is only estimated for perennial woody crops since for annual crops the increase in biomass stocks in a single year due to crop growth is assumed to be balanced by the biomass loss due to harvest and mortality in that same year. Therefore, there is no net accumulation of carbon in the annual crops. The activity data refer to the perennial cropland area including both areas of growing stock and harvested. Increase in carbon stocks due to biomass increment in cropland remaining cropland The Tables 3.76, 3.77, 3.78, 3.79 and 3.80 provide data on estimate of living biomass in trees and shrubs in cropland in the site samples of the four agro-ecological zones of Benin (Sota + Goungoun, Oueme Superieur, TTK, DDA) while the Tables 3.75, 3.81 and 3.82 provide the annual per ha accumulation of living biomass. For cropland (shifting cultivation) in Sota and Goungoun, data in the Table 3.12 have been used together with the assumptions considered in the Table 3.13 in the Equation 3.4 to estimate 5-years accumulation of biomass as presented in the Table 3.75. Table 3.75: Estimate of annual per ha accumulation of living biomass in cropland of Sota and Goungoun
5-years accumulation (000 tdm) Biomass (000 tdm) 1994 Low High
Total Increment for considered cropland (shifting cultivation)
Low High Total Increment 41.3 52.35 Total stock 111.5 152.8 163.85 Annual production per hectare of above and below ground biomass and carbon (total area 11700 ha) Production of biomass (tdm/ha/yr) 1.41 1.79 Production of carbon (tC/ha/yr) 0.71 0.89 Source: Data from project Ben93/G31 The annual per hectare accumulation of living biomass and carbon (a+bgr.) has been calculated by dividing the total increment by the total area (11700 ha) and the time period considered (5 years). For the other sites samples, the land-use categories in the Table 3.16 considered as croplands in the areas covered by the PGFTR are categories 6, 7, 9. From that table, one can notice that OS does not have category 9, N’dali does not have cropland (none of categories 6, 7, 9), TTK does not have category 9 and DDA has all categories (6, 7, and 9).
Land-Use Changes and Greenhouse Gas Fluxes: Scientific Understanding and Contribution to Improving Methodologies for Greenhouse Gas Inventory in BENIN
IPCC NGGIP TSU Inventory Internship 57
Table 3.76 : Estimate of living biomass in cropland of Oueme Superieur LUC Area Vol. Above volume and weight: big trees (circ.> 15 cm) a+bgr.
Biomass (big trees)
a+bgr. Biomass (small trees)
Total biomass (small trees)
Total a+bgr.
Biomass (big and
small trees)
Total organic carbon
ha Stem vol. m³/ha
Total vol. Stem 1000 m³
Branch exp. Factor
Total vol. branch 1000 m³
volume (stem + branch) 1000 m³
Above weight (density 0.71 tdm/ m³)
Total weight 000 tdm
Weight tdm/ha
Weight 000 tdm
Total weight
000 tdm
000 tC
A B C D E F G H I J K L A x B C x D C+E 0.71x F 1.5 x G A x I H + J 0.5 x K 6 7080 7.15 50.6 0.52 26.3 76.9 54.6 82.0 1.08 7.6 89.6 44.8 7 3000 7.15 21.4 0.52 11.2 32.6 23.1 34.7 1.08 3.2 37.9 19.0 Table 3.77 : Estimate of living biomass in cropland of TTK LUC Area Vol. Above volume and weight: big trees (circ.> 15 cm) a+bgr.
Biomass (big
trees)
a+bgr. Biomass (small trees)
Total biomass (small trees)
Total a+bgr.
Biomass (big and
small trees)
Total organic carbon
ha Stem vol.
m³/ha
Total vol.
Stem 1000 m³
Branch exp.
Factor
Total vol.
branch 1000 m³
volume (stem + branch)
1000 m³
Above weight (density
0.71 tdm/ m³)
Total weight
000 tdm
Weight tdm/ha
Weight 000 tdm
Total weight
000 tdm
000 tC
A B C D E F G H I J K L A x B C x D C+E 0.71x F 1.5 x G A x I H + J 0.5 x K 6 4380 6.02 26.4 0.52 13.7 40.1 28.4 42.7 1.08 4.7 47.4 23.7 7 5940 6.02 35.8 0.52 18.6 54.4 38.6 57.9 1.08 6.4 64.3 32.1 Table 3.78 : Estimate of living biomass in cropland of DDA LUC Area Vol. Above volume and weight: big trees (circ.> 15 cm) a+bgr.
Biomass (big
trees)
a+bgr. Biomass (small trees)
Total biomass (small trees)
Total a+bgr.
Biomass (big and
small trees)
Total organic carbon
ha Stem vol.
m³/ha
Total vol.
Stem 1000 m³
Branch exp.
Factor
Total vol.
branch 1000 m³
volume (stem + branch)
1000 m³
Above weight (density
0.71 tdm/ m³)
Total weight
000 tdm
Weight tdm/ha
Weight 000 tdm
Total weight
000 tdm
000 tC
A B C D E F G H I J K L A x B C x D C+E 0.71x F 1.5 x G A x I H + J 0.5 x K 6 4900 10.68 52.3 0.52 27.2 79.5 56.5 84.7 1.08 5.3 90.0 45.0 7 4900 10.68 52.3 0.52 27.2 79.5 56.5 84.7 1.08 5.3 90.0 45.0 9 600 10.68 6.4 0.52 3.3 9.7 6.9 10.4 1.08 0.6 11.0 5.5
Land-Use Changes and Greenhouse Gas Fluxes: Scientific Understanding and Contribution to Improving Methodologies for Greenhouse Gas Inventory in BENIN
IPCC NGGIP TSU Inventory Internship 58
The Table 3.79 is a summary of the Tables 3.76, 3.77 and 3.78. There is no data for N’dali. Table 3.79: Summary of estimates of living biomass in cropland of areas covered by PGFTR Oueme superieur N’dali TTK DDA LUC Area Total
tdm/ha tC/ha tdm/ha tC/ha tdm/ha tC/ha tdm/ha tC/ha Biomass and C stocks/ha
12.65 6.33 - - 10.82 5.41 18.37 9.19
The similar table for Sota and Goungoun is as follows. Table 3.80: Summary of estimates of living biomass in cropland of areas covered by the project Ben93/G31 Sota Goungoun LUC Area Total a+bgr.
Biomass (big and small trees)
Total organic carbon
Area Total a+bgr. Biomass (big and
small trees)
Total organic carbon
ha 000 tdm 000 tC ha 000 tdm 000 tC shifting cultivation 6500 101 50.5 5200 122 61 Total 6500 101 50.5 5200 122 61
tdm/ha tC/ha tdm/ha tC/ha Biomass and C stocks/ha
15.5 7.8 23.5 11.7
The same assumptions presented in the Table 3.13 and the Equation 3.4 have been used to estimate the annual per hectare accumulation of living biomass in cropland of O.S, TTK, and DDA as shown in the Table 3.81. Table 3.81: Estimate of annual per ha accumulation of living biomass in cropland of OS, TTK, DDA Land-use categories Biomass stock in 2000 5-years accumulation 000 tdm 000 tdm Low High 6 227 84 106.54 7 192.2 71.13 90.20 9 11.0 4.07 5.16 Total Increment 159.2 201.9 Total stock 430.2 589.4 632.1 Carbon stock 5-years accumulation 000 t C 000 t C Total Increment 79.6 101 Total stock 215.1 294.7 316.1 Annual per ha production of above and below ground biomass and carbon (total area 30800 ha) Production of biomass (tdm/ha/yr) 1.03 1.31 Production of carbon (tC/ha/yr) 0.52 0.66 A summary of annual per ha accumulation of living biomass in cropland is presented in the Table 3.82. Table 3.82: Summary of annual per ha accumulation of living biomass in cropland of considered areas Sota + Goungoun OS + TTK + DDA Low High Low High Production of biomass (tdm/ha/yr) 1.41 1.79 1.03 1.31 Production of carbon (tC/ha/yr) 0.71 0.89 0.52 0.66 The annual per ha production of biomass (a+bgr.) ranges from 1.03 to 1.79 with a mean of GTotal = 1.41 tdm/ha/yr that will be used for perennial cropland including trees and shrubs. The per hectare biomass stock (a+bgr.) of perennial woody crops in cropland remaining cropland is presented in Tables 3.79 and 3.80. The range is [10.82-23.5] and the mean 17.16 tdm/ha. Data on land area for perennial woody crops is not really available like for annual croplands presented in the Table 3.83.
Land-Use Changes and Greenhouse Gas Fluxes: Scientific Understanding and Contribution to Improving Methodologies for Greenhouse Gas Inventory in BENIN
IPCC NGGIP TSU Inventory Internship 59
Table 3.83: Areas of the main annual croplands in Benin (ha) Year Crop 1987 1988 1989 1990 1991 1992 1993 1994 1995 1996 1997
Source: Yearbook of the Ministry of Rural Development: campaign of 1997-1998. In comparing the total area between 1987 and 1997 in the Table 3.83 (i.e. the overall trend), the average annual change in area has been estimated at 5.9 % and the extrapolation has led to the value 1913934 ha for 1999. The total cropland areas from matrices and the area of annual crop from the above table have been considered to deduce the area of perennial cropland assuming that the area of fallow land is negligible. The distribution is presented in the Table 3.84. Table 3.84: Distribution of land area between annual and perennial crops (ha) [1985-1989] [1990-1994] [1995-1999] Annual crop 1151029 1315747 1913934 Perennial crop 1999545 2257214 1657005 Total cropland 3150574 3572961 3570939 The total increase in carbon stocks due biomass increment in cropland remaining cropland has been calculated using an equation similar to the Equation 3.2.4 p.3.25 of the GPG LULUCF, with GTotal calculated above. Estimates are presented in the Table 3.85. Table 3.85: Total increase in carbon stocks due to biomass increment in perennial crops in cropland remaining cropland Time period Perennial cropland (ha) Increase in carbon stocks (000 tC) [1985-1989] 1999545 +1409.68 [1990-1994] 2257214 +1591.34 [1995-1999] 1657005 +1168.19 Decrease in carbon stocks due to biomass loss in cropland remaining cropland The main losses reported here are the consequences of fuelwood gathering and fires. The commercial fellings are mainly from forest and to lesser extent from grassland. Information on other losses such as pest outbreaks and diseases is unknown. Loss due to fuelwood gathering The distribution of fuelwood gathered between the different land-use categories, presented in the Table 3.30, has been used to estimate the loss of carbon due to fuelwood gathering from cropland remaining cropland as presented in the Table 3.86. Table 3.86: Loss of carbon due to fuelwood gathering from cropland remaining cropland Time period Lfuelwood cropland remaining cropland
Carbon loss due to fuelwood gathering (000 tC) [1985-1989] 1656.24 [1990-1994] 1746.41 [1995-1999] 1817.39 Loss due to fires The Table 3.33 “Land area burned for broad land-use category” provides the areas of cropland and grassland burned, but data are aggregated for these two land-use categories. Together, the total area of grasslands and croplands that burns is 240000 ha. Since additional information does not exist to estimate the proportion of each of these LUC that burns, we assume that 50% is from cropland and 50% from grassland.
Land-Use Changes and Greenhouse Gas Fluxes: Scientific Understanding and Contribution to Improving Methodologies for Greenhouse Gas Inventory in BENIN
IPCC NGGIP TSU Inventory Internship 60
Considering the distribution of cropland between annual and perennial crops in Table 3.84, one can notice that, the proportion of perennial crop is about 63.47%, 63.17% and 46.4% respectively for [1985-1989], [1990-1994] and [1995-1999]. Thus, the total area of perennial crops exposed to fire is 76159.3 ha, 75809.9 ha, 55683 ha respectively for [1985-1989], [1990-1994] and [1995-1999]. Also, it has been assumed that only aboveground biomass burns when fire occurs (i.e. 67% of the total biomass, Source: Forest inventory, PGFTR 2000), but not all the biomass burns, a fraction is transferred for instance into the dead organic matter pool. The IPCC default for this fraction is fBL= 0.4. The Equation 3.2.9 p.3.28 GPG LULUCF has been used to estimate the carbon loss due to fires. The total per ha biomass stock (a+bgr.) calculated above is 17.16 tdm/ha and the aboveground biomass stock is then Bw =11.5 tdm/ha. Thus, the carbon loss due to fires is calculated as follows: Lfire= Afire*5.8/100*11.5*(1-0.4)*0.5 with Afire the area of perennial crop exposed to fire and 5.8% the percent that burned (see Table 3.33). Results are presented in the Table 3.87. Table 3.87: Loss of carbon due to fire in cropland remaining cropland Time period Perennial cropland exposed to fire (ha) Carbon loss due to fire (000 tC) [1985-1989] 76159.3 15.24 [1990-1994] 75809.9 15.17 [1995-1999] 55683.0 11.14 The total decrease in carbon stocks due to biomass loss in cropland remaining cropland is presented in the Table 3.88. Table 3.88: Total decrease in carbon stocks in living biomass in cropland remaining cropland Time period Lfuelwood (Carbon loss due to
fuelwood gathering ) (000 tC)
Lother losses (Carbon loss due to fire)
(000 tC)
Total (000 tC)
[1985-1989] -1656.24 -15.24 -1671.48 [1990-1994] -1746.41 -15.17 -1761.58 [1995-1999] -1817.39 -11.14 -1828.53 The total change in carbon stocks in living biomass presented in the Table 3.89 has been estimated from data in the Tables 3.85 and 3.88 and the Equation 3.2.2. p.3.24 GPG LULUCF. Table 3.89: Total change in carbon stocks in living biomass in cropland remaining cropland Period (5 years) Total increase in carbon stocks due
to biomass increment (000 tC) Total decrease in carbon stocks due
to biomass loss (000 tC) Total change in carbon stocks in
living biomass (000 tC) [1985-1989] +1409.68 -1671.48 -261.8 [1990-1994] +1591.34 -1761.58 -170.24 [1995-1999] +1168.19 -1828.53 -660.34 Choice of Emission/Removal factors - Average annual growth rate (a+bgr.) GTotal = 1.41 tdm/ha/yr. - Biomass loss due to fire: Bw = 11.5 tdm/ha. Choice of Activity Data Activity data consists mainly of country-specific data on areas of annual and perennial cropland. Uncertainty Estimate This is addressed in the Section Uncertainty Assessment.
• Change in carbon stocks in dead organic matter The GPG LULUCF does not provide a basic approach with default parameters to estimate the change in carbon stocks in the dead organic matter pools in cropland remaining cropland. The reason mentioned is that when the guidance was being developed, there was not sufficient scientific information available. However, the general approach applied to forest land is used to estimate the change in carbon stocks in dead organic matter in cropland remaining cropland. Dead wood The biomass in dead wood addressed in this section is due natural mortality and transfer from fire. - Carbon transferred to dead wood pool from fire This is calculated as follows: Afire*5.8/100*11.5*0.4*0.5 with Bw = 11.5 tdm/ha, fBL= 0.4, CF= 0.5 and Afire the area of perennial cropland exposed to fire. Estimates are provided in the Table 3.90.
Land-Use Changes and Greenhouse Gas Fluxes: Scientific Understanding and Contribution to Improving Methodologies for Greenhouse Gas Inventory in BENIN
IPCC NGGIP TSU Inventory Internship 61
Table 3.90: Carbon transfer into dead wood pool due to fire in cropland remaining cropland Time period Perennial cropland area (ha) Carbon stocks transfer (000 tC) [1985-1989] 76159.3 10.16 [1990-1994] 75809.9 10.11 [1995-1999] 55683.0 7.43 - Carbon transferred to dead wood pool from natural mortality The forest inventory collected data on dead trees in cropland as presented in the Tables 3.91 to 3.94. Table 3.91: Estimate of carbon stocks in dead trees due to natural mortality in cropland remaining cropland of Sota and Goungoun Sota Forest Reserve Goungoun Forest Reserve Land-use categories
Total area (ha) Biomass (000 tdm)
Carbon (000 t)
Total area (ha)
Biomass (000 tdm)
Carbon (000 t)
Shifting cultivation
6 500 14 7 5 200 12 6
Table 3.92 : Estimate of carbon stocks in dead trees due to natural mortality in cropland remaining cropland of Oueme Superieur LUC Area Vol. Above volume and weight: big trees (circ.> 15 cm) a+bgr.
Biomass (big trees)
a+bgr. Biomass (small trees)
Total biomass (small trees)
Total a+bgr.
Biomass (big and
small trees)
Total organic carbon
ha Stem vol. m³/ha
Total vol. Stem 1000 m³
Branch exp. Factor
Total vol. branch 1000 m³
volume (stem + branch) 1000 m³
Above weight (density 0.71 tdm/ m³)
Total weight 000 tdm
Weight tdm/ha
Weight 000 tdm
Total weight
000 tdm
000 tC
A B C D E F G H I J K L A x B C x D C+E 0.71x F 1.5 x G A x I H + J 0.5 x K 6 7080 0.50 3.6 0.13 0.4 4.0 2.8 4.3 0.94 6.7 10.9 5.6 7 3000 0.50 1.5 0.13 0.2 1.7 1.2 1.8 0.94 2.8 4.6 2.3 Table 3.93: Estimate of carbon stocks in dead trees due to natural mortality in cropland remaining cropland of TTK LUC Area Vol. Above volume and weight: big trees (circ.> 15 cm) a+bgr.
Biomass (big
trees)
a+bgr. Biomass (small trees)
Total biomass (small trees)
Total a+bgr.
Biomass (big and
small trees)
Total organic carbon
ha Stem vol.
m³/ha
Total vol.
Stem 1000 m³
Branch exp.
Factor
Total vol.
branch 1000 m³
volume (stem + branch)
1000 m³
Above weight (density
0.71 tdm/ m³)
Total weight
000 tdm
Weight tdm/ha
Weight 000 tdm
Total weight
000 tdm
000 tC
A B C D E F G H I J K L A x B C x D C+E 0.71x F 1.5 x G A x I H + J 0.5 x K 6 4380 0.42 1.8 0.13 0.2 2.1 1.5 2.2 0.94 4.1 6.3 3.1 7 5940 0.42 2.5 0.13 0.3 2.8 2.0 3 0.94 5.6 8.6 4.3
Land-Use Changes and Greenhouse Gas Fluxes: Scientific Understanding and Contribution to Improving Methodologies for Greenhouse Gas Inventory in BENIN
IPCC NGGIP TSU Inventory Internship 62
Table 3.94: Estimate of carbon stocks in dead trees due to natural mortality in cropland remaining cropland of DDA LUC Area Vol. Above volume and weight: big trees (circ.> 15 cm) a+bgr.
Biomass (big
trees)
a+bgr. Biomass (small trees)
Total biomass (small trees)
Total a+bgr.
Biomass (big and
small trees)
Total organic carbon
ha Stem vol.
m³/ha
Total vol.
Stem 1000 m³
Branch exp.
Factor
Total vol.
branch 1000 m³
volume (stem + branch)
1000 m³
Above weight (density
0.71 tdm/ m³)
Total weight
000 tdm
Weight tdm/ha
Weight 000 tdm
Total weight
000 tdm
000 tC
A B C D E F G H I J K L A x B C x D C+E 0.71x F 1.5 x G A x I H + J 0.5 x K 6 4900 0.75 3.7 0.13 0.5 4.2 3.0 4.4 0.94 4.6 9.0 4.5 7 4900 0.75 3.7 0.13 0.5 4.2 3.0 4.4 0.94 4.6 9.0 4.5 9 600 0.75 0.4 0.13 0.1 0.5 0.4 0.5 0.94 0.6 1.1 0.6 The Table 3.95 is a summary of the Tables 3.91 to 3.94. Table 3.95: Summary of estimate of carbon stocks in dead trees due to natural mortality in cropland remaining cropland Sota Goungoun OS N’dali TTK DDA Area (ha) 6500 5200 10080 - 10320 10400 Total biomass (000 tdm) 14 12 15.5 - 14.9 19.1 Biomass (tdm/ha) 2.2 2.3 1.5 - 1.4 1.8 The data on biomass per ha ranges from 1.4 to 2.3 tdm/ha. The mean 1.85 tdm/ha will be used to estimate the amount of carbon that entering the dead wood pool due to natural mortality. The estimates are presented in the Table 3.96. Table 3.96: Carbon transfer into the dead wood pool from natural mortality of trees in cropland remaining cropland Time period Perennial cropland area (ha) Total carbon stocks from natural mortality
(000 tC) [1985-1989] 1999545 1849.58 [1990-1994] 2257214 2087.92 [1995-1999] 1657005 1532.73 The total carbon transfer into the dead wood pool is shown in the Table 3.97. Table 3.97: Total carbon transfer into the dead wood pool from fire and natural mortality Time period Total carbon stocks from fire
(000 tC) Total carbon stocks from natural
mortality (000 tC) Total transfer of carbon into
dead wood pool (000 tC): Binto [1985-1989] 10.16 1849.58 1859.74 [1990-1994] 10.11 2087.92 2098.04 [1995-1999] 7.43 1532.73 1540.16 The Equation 3.5 and the associated assumptions have been used to estimate the carbon stocks change in the dead wood pool. Table 3.98: Change in carbon stocks in the dead wood pool in cropland remaining cropland (000 tC) Time period Total transfer of carbon into
dead wood pool (000 tC): Binto Transfer of carbon out of dead
wood pool (000 tC): Bout Total change in carbon stocks in
dead wood pool (000 tC) [1985-1989] 1859.74 826.96 1032.78 [1990-1994] 2098.04 932.92 1165.12 [1995-1999] 1540.16 684.85 855.31
Choice of Emission/Removal Factors - Transfer from fire: Bw= 11.5 tdm/ha - Transfer from natural mortality: per ha carbon stocks: 1.85 tdm/ha -Transfer out the dead wood pool: k= 0.19±0.026 year-1 Choice of Activity Data Area of cropland remaining cropland Uncertainty Estimate See Section Uncertainty Assessment.
Land-Use Changes and Greenhouse Gas Fluxes: Scientific Understanding and Contribution to Improving Methodologies for Greenhouse Gas Inventory in BENIN
IPCC NGGIP TSU Inventory Internship 63
Litter No information on litter is available.
• Change in carbon stocks in soils The soils considered under this section are those that have been cropland since 20 years, this is a default time period in the GPG LULUCF. According to the study “Les Sols Béninois: Classification dans la Base de Référence Mondiale” (Soils in Benin: Classification in the World Reference Base for Soil Resources), five categories of dominant soils exist in Benin. Their origin and evolution result from many factors such as climate, vegetation cover, primary (original) rock, change, geomorphologic history and anthropologic actions. They have been constituted from sedimentary rocks, crystalline rocks and alluvial deposits (Youssouf., I. and Lawani., M. 2000). On the basis of the Soils Map of Benin at scale 1/2500000, one distinguishes by order of importance the main following types of soil: ferruginous tropical soils (65 percent of the total area of the country), less evolved soils (20 percent), “ferrallitique” soils (10 percent), “hydromorphe” soils (3 percent), and vertisols (2 percent). Considering the morphology of profiles and results of chemical analysis, these main soils are correlated with the World Reference Base for Soil Resources (WRB). The Table 3.99 presents the classification and characteristics of soils in Benin. Table 3.99: Classification and characteristics of soils in Benin. National System FAO (WRB) Correspondence to
GPG LULUCF soils defined in Table 3.3.3 p.3.76
Some characteristics Spatial distribution Agricultural value (main crops)
1. Sol ferrugineux tropical concretionné
Luvisol squeletti-chromique
HAC soils Depth variable but less than 3m. Surface horizon rich in organic material: 1.5% in above layer and less than 1% in below layer. Some of them are subject to water erosion. Sometimes, existence of a transition horizon (30-40 cm) and horizon of accumulation of clay and iron. The ratio fine silt/clay is always more than 0.20 and SiO2/Al2O3 > 2. Sometimes poor in N, P, K. pH poorly acid.
Widespread soil in Benin. In the North of coastal sedimentary formations, between 7e and 9e parallel. Between 9e and 12e parallel in “soudano-guinean” climate. In the extreme North of the country in “soudanien” climate.
Agronomic characteristics variables and often heterogeneous. Suitable for all annual crops even tobacco. The soil is more used for cultivation of cotton, maize, and cassava. Yam, sorghum, groundnuts are also cultivated.
2. Sol peu évolué non climatique sur sable du Quaternaire
Arenosol haplique
Sandy soils Not or poorly organized in horizons (profile poorly differentiated). Surface horizon sandy, low organic matter content, organic matter content between 0.5 and 1.5 percent. pH often between 5.5 and 6.5 in surface. Poor capacity of water retention in general. Lack of accumulation horizon.
On the sandy belt of the coastal region. Alongside most of rivers of the country. On granite rock in the Centre and Northern parts of Benin. Annual rainfall between 800-1000 mm, mean annual temperature 26 degree Celsius.
Suitable for coconut tree in the coastal region. Also used for reforestation with different forest trees and for market gardening. Alongside rivers, they are used for cultivation of rice, maize, beans, and potato. In the Centre and Northern parts where depth allows, these soils are used for maize, sorghum, cassava, yam, and groundnut cultivation. In any case, this soil is less used for annual crops. Main perennial crops include oil palm and coconut tree.
Land-Use Changes and Greenhouse Gas Fluxes: Scientific Understanding and Contribution to Improving Methodologies for Greenhouse Gas Inventory in BENIN
IPCC NGGIP TSU Inventory Internship 64
3. Sol ferrallitique moyennement désaturé en (B) typique, faiblement apprauvri.
Acrisol rhodi-haplique
LAC soils Depth between 2 and 8m. pH acid or highly acid, pH: 4.5-6. Low organic matter content 0.98-1.17 percent. Low clay content. Presence almost exclusive of “kaolin” as clay mineral. High content of sesquioxide of iron more often with sesquioxide of Al. Ratio SiO2/Al2O3 < 2
Found in the Continental Terminal, coastal climatic zone between average annual rainfall 850 and 1350 mm. Mean annual temperature 27 degree C. Two dry seasons and two rainy seasons.
In the South, this soil has good physical characteristics: depth, drainage, but low chemical capacity (chemical fertility). Used for forest plantations but mainly for maize, pineapple, groundnut, market gardening. In the North, these soils are mainly used for maize, sorghum, and groundnut. The use of this soil in the South implies the periodic use of fertilizers (synthetic and agricultural residues).
4. Sol hydromorphe peu humifere a pseudogley
Gleysol verti-eutrique .
Wetland soils. Despite the characteristics of this soil presented in the next column, it won’t be considered as organic soil since it doesn’t meet the criteria of organic soil presented in glossary of GPG LULUCF (G.14).
Are characterized by a lack of oxygen for a long period due to the fact that soils are temporary or permanently flooded Accumulation of peat organic matter. Organic matter content less than 8 percent for the first 20 cm. pH acid, varies from 3-7. Clay content often high then poor permeability.
Frequent in the South of Benin particularly in the valleys of rivers Mono, Couffo, Oueme as well as in coastal areas of Atlantic. They constitute also the major part of soils alongside rivers Niger and Alibori. Mean annual temperature 27 degree Celsius. Mean annual rainfall 1200 mm.
Highly fertile and suitable for a large number of annual crops. In the Oueme valley, the main crops are rice, maize, chili, cassava, potato. In the Niger valley, crops are mainly rice and onion. Sorghum and potato are also found as well as paddy fields.
5. Vertisol topomorphe a drainage externe nul, a structure de surface grumeuleuse, compact, modal, sur materiau argileux de l’Eocene.
Vertisol gleyi-hypereutrique
HAC soils Composed of vertisols with or without drainage. High clay content. Clay of type montmorillonite. More than 40 percent of clay on all the profile. Organic matter content 4 to 6 percent in surface. Neutral pH in surface often alkaline in depth. Long flooded soil and slow drainage of water excess. Thickness is variable, from 50cm to 1m.
Are found in the depression of Lama, on some clay alluvia of rivers Mono, Oueme, Niger and in the Centre part of the country.
Vertisols are intensively used for forestry and annual crops which the most practiced is maize. Then market gardening, cotton. Rice is mainly cultivated in the clay alluvia where there is water excess. In the Centre part, these soils are less exploited because of availability of other soils easy to use. However, maize and cotton are practiced.
Source: Data and information compiled from Youssouf., I. and Lawani., M. 2000. More information on the study can be found at: ftp://ftp.fao.org/docrep/fao/005/y3948f/ From the Table 3.99, any soil does not meet the criteria of organic soil presented in the GPG LULUCF. In addition, no information exists on application of lime or dolomite (liming) to soils in Benin, but this practice seems not common in the country. Therefore, all soils will be considered as mineral soils. As it can be noticed in the Table 3.99, one single crop is not practiced in one single type of soil. For example, maize which is the basic crop in Benin is cultivated in all soils. But the area cultivated for each crop in each soil is unknown. It has also been noted that cotton which is one important cash crop in Benin is cultivated mainly in HAC soils. Its cultivation uses increasingly important amount of inputs mainly mineral fertilizer. For the other annual crops (maize, sorghum, rice, cassava, yam, bean, peanut) a default soil will be attributed taking into
Land-Use Changes and Greenhouse Gas Fluxes: Scientific Understanding and Contribution to Improving Methodologies for Greenhouse Gas Inventory in BENIN
IPCC NGGIP TSU Inventory Internship 65
account the soil that is more used for the crop. The following facts noted from the Table 3.99 have been considered. Sandy soils contain low organic matter and are less used as cropland. HAC soils, 67% of the total area of the country, are more used as cropland. LAC soils, 10% of the area of the country with low organic matter content are less cultivated. On the basis of these considerations, default values for the stock change factors FLU, FMG, FI, have been selected from the Table 3.3.4 p.3.77 of the GPG LULUCF. The country-specific parameter SOCREF(cropland) = 81.5 tC/ha (see Table 3.55) has been used. The initial situation and the situation in the inventory year described below are considered to estimate the annual change in carbon stocks in mineral soils in cropland remaining cropland. Initial situation: Cotton is long-term cultivated in HAC soils with reduced tillage and low input. SOCREF= 81.5 tC/ha, FLU= 0.58 ±42%, FMG= 1.16 ±8%, FI= 0.91±4% SOC(0-T)= 81.5*0.58*1.16*0.91 = 49.9 tC/ha. Rice is more cultivated in wetland soils (tillage and input factors FMG, FI are not used), this is paddy rice. SOCREF= 86 tC/ha (default value), FLU= 1.1 Annual crops: Maize, Sorghum, Cassava, Yam, Bean, and Peanut are long-term cultivated in HAC with reduced tillage and medium input. SOCREF= 81.5 tC/ha, FLU= 0.58±42%, FMG= 1.16±8%, FI= 1.0 SOC(0-T)= 81.5*0.58*1.16*1.0 = 54.8 tC/ha. Situation in the inventory year: Cotton is long-term cultivated in HAC soils with intensive tillage (cotton became an important cash crop in the country) and low input. SOCREF= 81.5 tC/ha, FLU= 0.58±42%, FMG= 1.0, FI= 0.91±4% SOC0= 81.5*0.58*1.0*0.91 = 43.02 tC/ha. Rice is more cultivated in wetland soils (tillage and input factors FMG, FI are not used). SOCREF= 86 tC/ha, FLU= 1.1 i.e. same as in initial situation. Maize, Sorghum, Cassava, Yam, Bean, and Peanut are long-term cultivated in HAC with intensive tillage and medium input. SOCREF= 81.5 tC/ha, FLU= 0.58±42%, FMG= 1.0, FI= 1.0 SOC0= 81.5*0.58*1.0*1.0 = 47.27 tC/ha. As mentioned above, the soils considered in this section are those that have been cropland since 20 years, but emissions/removals are estimated for [1985-1989], [1990-1994], [1995-1999]; thus, the area cultivated for each crop between those periods is needed. Table 3.100: Distribution of land area between annual crops (ha). [1985-1989] [1990-1994] [1995-1999] Cotton 89951 186840 536481 Rice 6781 8840 16421 Other annual crops* 1054297 1120067 1361032 Total annual crop 1151029 1315747 1913934 Source: Data from Table 3.83 * Other annual crops include: maize, sorghum, cassava, yams, beans, peanuts. The Equation 3.3.4 p.3.78 GPG LULUCF has enabled to estimate the annual change in carbon stocks in mineral soils as follows: Total annual change = [(43.02 – 49.9)*Acotton]/20 + [(47.27 – 54.8)*Aother crops]/20 = [–6.88*Acotton – 7.53*Aother crops]/20 = – [6.88*Acotton + 7.53*Aother crops]/20 The changes in carbon stocks in soils in cropland remaining cropland are presented in the Table 3.101. These are only changes in carbon stocks in mineral soils, since organic soils and soils subject to liming are negligible.
Land-Use Changes and Greenhouse Gas Fluxes: Scientific Understanding and Contribution to Improving Methodologies for Greenhouse Gas Inventory in BENIN
IPCC NGGIP TSU Inventory Internship 66
Table 3.101: Changes in carbon stocks in soils in cropland remaining cropland (000 t) Time period Changes in C stocks [1985-1989] -431.22 [1990-1994] -489.15 [1995-1999] -699.60 For paddy rice the situation is assumed constant and emissions/removals negligible. Choice of Emission/Removal Factors The following default factors have been used. Initial situation: Cotton: SOCREF= 81.5tC/ha, FLU= 0.58 ±42%, FMG= 1.16 ±8%, FI= 0.91±4% Other crops: SOCREF= 81.5tC/ha, FLU= 0.58±42%, FMG= 1.16±8%, FI= 1.0 Situation in the inventory year: Cotton: SOCREF= 81.5tC/ha, FLU= 0.58±42%, FMG= 1.0, FI= 0.91±4% Other crops: SOCREF=81.5tC/ha, FLU= 0.58±42%, FMG= 1.0, FI= 1.0 Choice of Activity Data Country-specific data on land area have been used. Uncertainty Estimate is addressed in the Section Uncertainty Assessment.
• Non-CO2 Greenhouse Gas Emissions The methodological guidance associated with the following source categories are addressed in the 96 Guidelines and the Chapter 4 Agriculture of the GPG 2000. The GPG LULUCF recommends following those guidelines and reporting the corresponding emissions under the Agriculture sector. - N2O emissions from application of mineral/organic fertilizers, organic residues and biological nitrogen fixation - N2O, NOx, CH4 and CO emissions from on-site and off-site biomass burning - N2O emissions from cultivation of organic soils - CH4 emissions from rice paddies In these conditions, the total estimate of GHG emissions/removals from the category cropland remaining cropland is presented in the Table 3.102. Table 3.102: Total emissions/removals of GHG from cropland remaining cropland (Gg) CO2 [1985-1989] 1245.79 [1990-1994] 1854.34 [1995-1999] -1850.31 According to the estimates presented in the above table, one can notice that from 1995, the cropland remaining cropland category has become a net source of CO2 emissions. The main reason behind this would be the increase in the loss of carbon mainly from soils pool due to the large increase in cultivated area. 3.2.2.2 Land converted to cropland From the matrices, only forest and grassland are converted to cropland. The change in carbon stocks in dead organic matter pool is not addressed in the GPG LULUCF; the reason mentioned was that there was not sufficient information to provide a basic approach with default parameters. Therefore, the current section addresses the change in carbon stocks in living biomass, in soils and emission of non-CO2 GHG.
• Change in carbon stocks in living biomass The methodology proposed in the GPG LULUCF considers only aboveground biomass because limited data were available on belowground biomass in perennial cropland. However, this report extends the application of the guidance to the belowground biomass. The area of land undergoing a transition period from forest land and grassland to cropland is presented in the matrices for a period of five years. But information on the distribution of converted area between annual and perennial crops is not really known.
Land-Use Changes and Greenhouse Gas Fluxes: Scientific Understanding and Contribution to Improving Methodologies for Greenhouse Gas Inventory in BENIN
IPCC NGGIP TSU Inventory Internship 67
The Equations 3.3.9 and 3.3.10 p.3.86 and 3.3.11 p.3.87 GPG LULUCF have been used with some country-specific data to estimate the change in carbon stocks during conversions to cropland.
BeforeAfterconversion CCL −=
conversionconversionconversion LAC ×=Δ CAfter: For perennial crop, the biomass stock is 17.16tdm/ha, thus CAfter = 8.58tC/ha. For annual crop, data are not known; the data provided for perennial crop will be used as default for all croplands together. - Conversion of forest land to cropland CBefore for forest land is 31.2tC/ha (see Section Choice of Emission/Removal factors under forest land remaining forest land). Lconversion = (8.58 – 31.2) = -22.62tC/ha. The carbon loss due to conversion of forest to cropland is as below in the Table 3.103. Table 3.103: Change in carbon stocks due to clearing during conversion of forest to cropland. Time-series Aconversion (ha)
conversionCΔ (losses) (000 tC)
[1985-1989] 36414 -823.68 [1990-1994] 140809 -3185.10 [1995-1999] 548276 -12402.00 This has been apportioned between burning onsite, offsite and decay, using the parameters specified below.
36.0=siteonburnedρ : IPCC default value from the Table 3A.1.12 p.3.179 GPG LULUCF.
:siteoffburnedρ As mentioned in the previous sections, biomass is an important energy source of household in Benin. In addition to biomass burned onsite, it is assumed that most of biomass loss as result of conversion of forest to cropland is removed and burned offsite. The value of 0.54 based on expert judgment is used to be consistent with the previous sections where the fraction of biomass left to decay on the ground is 0.10; then =siteoffburnedρ 0.54.
9.0=oxidρ (IPCC default) Table 3.104: Carbon loss due to biomass burning on-site and off-site and from decay during conversion of forest to cropland (000 tC) Time period
[1985-1989] -823.68 -266.87 -400.31 -82.37 [1990-1994] -3185.10 -1031.97 -1547.96 -318.51 [1995-1999] -12402.00 -4018.25 -6027.37 -1240.20 - Conversion of grassland to cropland CBefore for grassland is 12.85tC/ha (see data in Tables 3.117 and 3.118). Lconversion = (8.58 – 12.85) = -4.27tC/ha.
35.0=siteonburnedρ : IPCC default.
:siteoffburnedρ The same assumption as for the conversion of forest land to cropland is used, then
Land-Use Changes and Greenhouse Gas Fluxes: Scientific Understanding and Contribution to Improving Methodologies for Greenhouse Gas Inventory in BENIN
IPCC NGGIP TSU Inventory Internship 68
Choice of Emission/Removal Factors Country-specific data on CAfter and CBefore have been used.
siteonburnedρ and oxidρ are IPCC defaults, siteoffburnedρ expert judgment. Choice of Activity Data - Area of forest land converted to cropland - Area of grassland converted to cropland Uncertainty Estimate: See Section Uncertainty Assessment in this report.
• Change in carbon stocks in soils According to the classification and characteristics of soils in Benin presented in the Table 3.99, all soils are considered mineral soils. In determining SOC0 and SOC(0-T), the conversions from forest and grassland have been considered separately and the country-specific SOCREF used. The means of data in the Table 3.55 have been used as SOCREF for managed forest and grassland on the basis of the assumption that the soils have been affected by low disturbance regimes. SOCREF is related to soils under native vegetation that have not been subject to significant land use and management impacts. It is used as a baseline or reference to which management-induced changes in soil carbon can be related. Thus, SOCREF(forest land)= 134 tC/ha, SOCREF(grassland)= 92 tC/ha and SOCREF(cropland)= 81.5 tC/ha. Most of soils being converted are used as annual cropland with reduced tillage and medium inputs. In these conditions the following default stock change factors will be used: (FLU, FMG, FI) = (0.58, 1.16, 1.0) respectively. Forest land converted to cropland SOCREF(forest land) = 134 tC/ha, default values for stock change factors (FLU, FMG, FI) are all 1. Then SOC(0-T) = 134 tC/ha for the pre-conversion. Considering the stock change factors above SOC0= 134*0.58*1.16*1.0 = 90.2 tC/ha Thus the average annual change in soil carbon stock is: (90.2 – 134)/20 = -2.2tC/ha/yr. Grassland converted to cropland SOCREF(grassland)= 92 tC/ha, default values for stock change factors (FLU, FMG, FI) are all 1 Then SOC(0-T)= 92 tC/ha for the pre-conversion. Considering the stock change factors above SOC0= 92*0.58*1.16*1.0 = 61.9 tC/ha The average annual change in soil carbon stock is: (61.9 – 92)/20 = -1.5 tC/ha/yr. The total change in carbon stocks in soils has been calculated using the areas provided in matrices (Tables 3.7, 3.8, 3.9) for forest and grassland converted to cropland. The estimates are presented in the Table 3.107. Table 3.107: Total change in carbon stocks in soils in land converted to cropland (000 tC) [1985-1989] [1990-1994] [1995-1999] Area (ha) C stock change Area (ha) C stock change Area (ha) C stock change Forest land converted to cropland 36414 -80.11 140809 -309.78 548276 -1206.21 Grassland converted to cropland 743682 -1115.52 721274 -1081.91 685925 -1028.89 Total change in carbon stocks -1195.63 -1391.69 -2235.09 Choice of Emission/Removals Factors - Reference carbon stocks (SOCREF) have been derived from the country’s soil survey as part of forest inventory: SOCREF(forest land)= 134 tC/ha, SOCREF(grassland)= 92 tC/ha. - Stock change factors (FLU, FMG, FI) are default.
Table 3.106: Carbon loss due to biomass burning on-site and off-site and from decay during conversion of grassland to cropland (000 tC) Time-series
Land-Use Changes and Greenhouse Gas Fluxes: Scientific Understanding and Contribution to Improving Methodologies for Greenhouse Gas Inventory in BENIN
IPCC NGGIP TSU Inventory Internship 69
Choice of Activity Data Activity data include area of land converted to cropland. Uncertainty Estimate This is addressed in the Section Uncertainty Assessment.
• Non-CO2 Greenhouse Gas Emissions This section provides estimate of N2O emissions from mineral soils in land converted to cropland and trace gas emissions (N2O, NOx, CH4 and CO) from onsite and offsite biomass burning. N2O emissions from mineral soils: The total change in carbon stocks in soils presented in the Table 3.107 has been used as activity data to estimate N2O emissions from mineral soils using the Equations 3.3.13 p.3.93, 3.3.14 and 3.3.15 p.3.94 GPG LULUCF and the following default factors: EF1= 0.0125 kg N2O-N/kg N, C:N ratio= 15. Table 3.108 shows results. Table 3.108: Total N2O emissions from mineral soils in land converted to cropland (000 t N2O-N) [1985-1989] [1990-1994] [1995-1999] Land conversion type i Area C stock
Total N2O emissions -1.57 -1.82 -2.93 Guidance is provided in the GPG 2000 to estimate and report N2O emissions from fertilisation of preceding and new land-use. Choice of Emission/Removal factors The following default factors have been used: EF1= 0.0125 kg N2O-N/kg N, C:N ratio= 15 Choice of activity data The country-specific data on land converted to cropland have been used. Trace gas emissions (N2O, NOx, CH4 and CO) from on-site and off-site biomass burning: Lburn onsite and Lburn offsite are used as inputs to estimate the non-CO2 emissions from biomass burning both onsite and offsite during conversion of forest and grassland to cropland. The Equation 3.2.19 p.3.49 GPG LULUCF has been used. The total carbon loss from biomass burned on site and off site is presented in the Table 3.109. Table 3.109: Total carbon loss due to biomass burned on-site and off-site during conversion of forest and grassland to cropland (000 tC). Time period Lburn onsite (forest land + grassland) Lburn offsite(forest land + grassland) Total Lburn (Lburn onsite + Lburn offsite) [1985-1989] -1267.16 -1972.19 -3239.35 [1990-1994] -2002.12 -3072.48 -5074.6 [1995-1999] -4940.85 -7477.18 -12418.03 The Table 3.110 shows the total emissions of non-CO2 gas from conversion of forest and grassland to cropland.
Choice of Emissions/Removals Factors Default N/C= 0.01 ratio and data provided in the Table 3.A.1.15, p.3.185 GPG LULUCF have been used. Choice of Activity Data Carbon losses due biomass burning onsite and offsite and converted land area have been used as activity data. Uncertainty Assessment See Section Uncertainty Assessment.
Table 3.110: Non-CO2 gas emissions from onsite and offsite burning of biomass during conversion of forest and grassland to cropland (000 t). Time period Total Lburn (Lburn onsite + Lburn offsite)
Land-Use Changes and Greenhouse Gas Fluxes: Scientific Understanding and Contribution to Improving Methodologies for Greenhouse Gas Inventory in BENIN
IPCC NGGIP TSU Inventory Internship 70
The compilation of estimate of emissions from lands converted to croplands is presented in the Table 3.111. Table 3.111: Total GHG emissions from land converted to cropland (Gg) CO2 CH4 CO N2O NOx [1985-1989] -19047.7 -51.83 -453.51 -1.93 -12.96 [1990-1994] -28074.3 -81.19 -710.44 -2.38 -20.30 [1995-1999] -64408.6 -198.69 -1738.52 -4.3 -49.67 3.2.3 Grassland The GHG emissions and removals from grassland remaining grassland and land converted to grassland have been estimated using in general country-specific data with some default. 3.2.3.1 Grassland remaining grassland In the GPG LULUCF, methodological guidance is provided only for living biomass and soil; for the dead organic matter pool it has been mentioned that enough information on required parameters was not available. However, some data collected has enabled to estimate the change in carbon stocks in that pool. The Equation 3.4.1 p.3.105 GPG LULUCF to which has been added a third term related to the change in carbon stocks in dead organic matter has been used to estimate the annual change in carbon stocks in grassland remaining grassland.
• Changes in carbon stocks in living biomass The carbon stocks in belowground biomass are larger in grass and more sensitive to management changes and are thus included in estimates of carbon stock changes in living biomass of grassland. In estimating the change in carbon stocks in this pool, perennial woody biomass and biomass of grasses should be considered. However, information on grass biomass is not available. For this reason, only perennial woody biomass will be considered. Increase in carbon stocks in living biomass Data available cover the grasslands in the different agro-ecological zones of Benin. A method similar to the biomass difference approach has been used to estimate the increase in carbon stocks in living biomass. The biomass stock is available for one year (Project Ben 93/G31, 1994 and PGFTR, 2000) and the stock for the second point in time has been estimated based on assumptions presented in the Table 3.13. In estimating the carbon stocks in the different grassland types, the management regimes are implicitly considered. The Equations 3.4.3 p.3.107 and 3.4.5 p.3.108 GPG LULUCF have been used. The Equation 3.4 with the data in the Table 3.13 related to other land-use categories have been used to estimate the five year accumulation of biomass. Estimates are presented in the Table 3.112 for Sota and Goungoun. Table 3.112: Estimate of annual per ha accumulation of living biomass in grassland of Sota and Goungoun
5-years accumulation (000 tdm) Biomass (000 tdm) 1994 Low High
Total Increment for considered grassland (shrubland, rocky woodland) 40
83.2
Total stock 384 424 467.2 5-years accumulation (000 t) Carbon (000 t) Low High
Total Increment 20 41.6 Total stock 192 212 233.6 Annual production per hectare of above and below ground biomass and carbon (total area 16366 ha) Production of biomass (tdm/ha/yr) 0.24 0.51 Production of carbon (tC/ha/yr) 0.12 0.26 The annual per hectare accumulation of biomass has been calculated by dividing the total increment by the total area (16366 ha) and the time period (5 years). Above and below ground biomass are already included according to the Equation 3.3. As far as the land-use categories covered by the PGFTR are concerned, the categories 4, 5 from the Table 3.16 are considered grasslands. The estimate of living biomass (a+bgr.) in different agro-ecological zones is presented in the Tables 3.113 to 3.116.
Land-Use Changes and Greenhouse Gas Fluxes: Scientific Understanding and Contribution to Improving Methodologies for Greenhouse Gas Inventory in BENIN
IPCC NGGIP TSU Inventory Internship 71
Table 3.113 : Estimate of living biomass in grassland of Oueme Superieur LUC Area Vol. Above volume and weight: big trees (circ.> 15 cm) a+bgr.
Biomass (big trees)
a+bgr. Biomass (small trees)
Total biomass (small trees)
Total a+bgr.
Biomass (big and
small trees)
Total organic carbon
ha Stem vol. m³/ha
Total vol. Stem 1000 m³
Branch exp. Factor
Total vol. branch 1000 m³
volume (stem + branch) 1000 m³
Above weight (density 0.71 tdm/ m³)
Total weight 000 tdm
Weight tdm/ha.
Weight 000 tdm
Total weight
000 tdm
000 tC
A B C D E F G H I J K L A x B C x D C+E 0.71x F 1.5 x G A x I H + J 0.5 x K 4 39460 12.77 503.9 0.79 398.1 902.0 640.4 960.6 1.67 65.9 1026.5 513.3 5 3800 12.77 48.5 0.79 38.3 86.9 61.7 92.5 1.67 6.4 98.9 49.4 Table 3.114: Estimate of living biomass in grassland of N’dali LUC Area Vol. Above volume and weight: big trees (circ.> 15 cm) a+bgr.
Biomass (big
trees)
a+bgr. Biomass (small trees)
Total biomass (small trees)
Total a+bgr.
Biomass (big and
small trees)
Total organic carbon
ha Stem vol.
m³/ha
Total vol.
Stem 1000 m³
Branch exp.
Factor
Total vol.
branch 1000 m³
volume (stem + branch)
1000 m³
Above weight (density
0.71 tdm/ m³)
Total weight
000 tdm
Weight tdm/ha
Weight 000 tdm
Total weight
000 tdm
000 tC
A B C D E F G H I J K L A x B C x D C+E 0.71x F 1.5 x G A x I H + J 0.5 x K 4 3370 8.56 28.8 0.79 22.8 51.6 36.7 55.0 1.67 5.6 60.6 30.3 5 - - - - - - - - - - - - Table 3.115: Estimate of living biomass in grassland of TTK LUC Area Vol. Above volume and weight: big trees (circ.> 15 cm) a+bgr.
Biomass (big
trees)
a+bgr. Biomass (small trees)
Total biomass (small trees)
Total a+bgr.
Biomass (big and
small trees)
Total organic carbon
ha Stem vol.
m³/ha
Total vol.
Stem 1000 m³
Branch exp.
Factor
Total vol.
branch 1000 m³
volume (stem + branch)
1000 m³
Above weight (density
0.71 tdm/ m³)
Total weight
000 tdm
Weight tdm/ha
Weight 000 tdm
Total weight
000 tdm
000 tC
A B C D E F G H I J K L A x B C x D C+E 0.71x F 1.5 x G A x I H + J 0.5 x K 4 19880 16.65 331.0 0.79 261.5 592.5 420.7 631.0 1.67 33.2 664.2 332.1 5 - - - - - - - - - - - -
Land-Use Changes and Greenhouse Gas Fluxes: Scientific Understanding and Contribution to Improving Methodologies for Greenhouse Gas Inventory in BENIN
IPCC NGGIP TSU Inventory Internship 72
Table 3.116: Estimate of living biomass in grassland of DDA LUC Area Vol. Above volume and weight: big trees (circ.> 15 cm) a+bgr.
Biomass (big
trees)
a+bgr. Biomass (small trees)
Total biomass (small trees)
Total a+bgr.
Biomass (big and
small trees)
Total organic carbon
ha Stem vol.
m³/ha
Total vol.
Stem 1000 m³
Branch exp.
Factor
Total vol.
branch 1000 m³
volume (stem + branch)
1000 m³
Above weight (density
0.71 tdm/ m³)
Total weight
000 tdm
Weight tdm/ha
Weight 000 tdm
Total weight
000 tdm
000 tC
A B C D E F G H I J K L A x B C x D C+E 0.71x F 1.5 x G A x I H + J 0.5 x K 4 7800 9.55 74.5 0.79 58.9 133.4 94.7 142.0 1.67 13.0 155.0 77.5 5 400 9.55 3.8 0.79 3.0 6.8 4.9 7.3 1.67 0.7 8.0 4.0 Tables 3.117 and 3.118 summarize data related to all agro-ecological zones. Data in the Table 3.117 are obtained from the Table 3.12. Table 3.117: Summary of estimate of living biomass per ha in grassland in areas covered by the project Ben93/G31. Sota Goungoun LUC Area Total a+bgr.
tdm/ha tC/ha tdm/ha tC/ha tdm/ha tC/ha tdm/ha tC/ha Biomass and C stocks/ha
26 13 18 9 33.4 16.7 19.9 9.9
The total biomass per ha ranges from 18 to 33.4 tdm/ha; the estimated mean is 25.7 tdm/ha. The assumptions presented in the Table 3.13 for other land-use categories are also used with the Equation 3.4 to estimate five year accumulation of biomass as shown in the Table 3.119. Table 3.119: Estimate of annual per ha accumulation of living biomass in grassland remaining grassland of OS, N’dali, TTK, DDA Land-use categories Biomass stock in 2000 5-years accumulation 000 tdm 000 tdm Low High 4 1906.3 198.4 413 5 106.9 11.1 23.2 Total Increment 209.5 436.2 Total stock 2013.2 2222.7 2449.4 Carbon stock 5-years accumulation 000 t C 000 t C Total Increment 104.8 218.1 Total stock 1006.6 1111.4 1224.7 Annual per ha production of above and below ground biomass and carbon (total area 74710 ha) Production of biomass (tdm/ha/yr) 0.56 1.17 Production of carbon (tC/ha/yr) 0.28 0.59
Land-Use Changes and Greenhouse Gas Fluxes: Scientific Understanding and Contribution to Improving Methodologies for Greenhouse Gas Inventory in BENIN
IPCC NGGIP TSU Inventory Internship 73
The annual per hectare production of biomass in the grassland of the agro-ecological zones is in the Table 3.120. Table 3.120: Summary of annual per ha accumulation of living biomass in grassland remaining grassland of all areas considered Sota + Goungoun OS + N’dali + TTK + DDA Low High Low High Production of biomass (tdm/ha/yr) 0.24 0.51 0.56 1.17 Production of carbon (tC/ha/yr) 0.12 0.26 0.28 0.59 Considering the range [0.24-1.17], the use of the mean of biomass production 0.71tdm/ha/yr has enabled to estimate the increase in carbon stocks in living biomass. Table 3.121: Total increase in carbon stocks in living biomass in grassland remaining grassland. Time period Grassland (ha) Increase in carbon stocks (000 tC) [1985-1989] 3476953 1234.32 [1990-1994] 3372192 1197.13 [1995-1999] 3206921 1138.46 Decrease in carbon stocks in living biomass Carbon loss due to fuelwood gathering Data in Table 3.29 followed by assumptions in Table 3.30 are used to estimate the total carbon loss due to the fuelwood gathering from grassland remaining grassland as presented in the following table. Table 3.122: Loss of carbon due to fuelwood gathering from grassland remaining grassland (000 tC) Time period Lfuelwood grassland remaining grassland
Carbon loss due to fuelwood gathering (000 tC) [1985-1989] -3312.47 [1990-1994] -3492.81 [1995-1999] -3634.78 Carbon loss due to fire On the basis of the assumption that carbon stocks in the aboveground herbaceous component of grassland are usually small and insensitive to management, the aboveground grass biomass is only considered when estimating non-CO2 emissions from burning. From the database on global burned area in 2000 developed by UNEP, the total burned area of grasslands and croplands together is 2400 km2 (see Table 3.33). To be consistent with the assumption elaborated under cropland, it will be considered that from 2400 km2 burned, 50% is from grassland and 50% from cropland. Information on aboveground grass biomass is not available and only perennial woody biomass is considered. The Equation 3.2.9 p.3.28 GPG LULUCF is used to estimate the loss of carbon due to fires. The interannual variability in burned area is not known and the annually burned area will be considered constant. Furthermore, it has been assumed that only aboveground biomass burns when fire occurs. The average amount of biomass per ha (a+bgr.) is 25.7 tdm/ha and thus the aboveground biomass is 25.7*0.67 = 17.2tdm/ha; fBL = 0.4 (IPCC default). For each time period [1985-1989], [1990-1994], [1995-1999], the loss of carbon is calculated as follows: Carbon released= [120000x5.8/100x5] x17.2x (1-0.4) x0.5 = 179568 tC. The total decrease in carbon stocks is presented in the Table 3.123. Table 3.123: Total decrease in carbon stocks in living biomass of grassland remaining grassland (000 tC) Time period Decrease in carbon stocks (000 tC) [1985-1989] -3492.04 [1990-1994] -3672.38 [1995-1999] -3814.35 Choice of Emission/Removal Factors BEF2= 1.79, basic density D= 0.71tdm/m3, root-to-shoot ratio R= 0.5, carbon fraction of dry matter CF= 0.5. BEF2, D, R, CF values can be seen in the Tables 3.113 to 3.116. Bw= 17.2 tdm/ha. Choice of Activity Data Activity data are areas of grassland, land area burned. Uncertainty Estimate See Section Uncertainty Assessment.
Land-Use Changes and Greenhouse Gas Fluxes: Scientific Understanding and Contribution to Improving Methodologies for Greenhouse Gas Inventory in BENIN
IPCC NGGIP TSU Inventory Internship 74
The total change in carbon stocks in living biomass in grassland remaining grassland has been estimated using data from the Tables 3.121 and 3.123.
• Change in carbon stocks in dead organic matter Although, the GPG LULUCF does not provide a basic approach with default parameters to estimate the change in carbon stocks in dead organic matter pool for this category, the general approach used for forest land has been applied with some available data. No information is available on litter. Dead wood The biomass in this pool is mainly the result of natural mortality and transfer from fire. - Carbon transferred to dead wood from fire The total carbon that enters the dead wood from fire is estimated as follows for each time period considered i.e. [1985-1989], [1990-1994], [1995-1999], assuming that the interannual variability of burned area is negligible. Carbon released= [120000x5.8/100x5] x17.2x 0.4 x 0.5 = 119712 tC. - Carbon from natural mortality The data available on dead trees provided by the partial forest inventory are presented in the Table 3.125 to Table 3.129. Table 3.125: Carbon stocks in dead trees due to natural mortality in grassland remaining grassland of Sota and Goungoun in 1994. Sota Forest Reserve Goungoun Forest Reserve Land-use categories
Total area (ha) Biomass (000 tdm)
Carbon (000 t)
Total area (ha)
Biomass (000 tdm)
Carbon (000 t)
Shrubland 5 012 8 4 3 592 14 7 Rocky woodland 3 261 3 1.5 4 501 8 4 Total 8273 11 5.5 8093 22 11 Table 3.126: Carbon stocks in dead trees due to natural mortality in grassland remaining grassland of Oueme Superieur LUC Area Vol. Above volume and weight: big trees (circ.> 15 cm) a+bgr.
Biomass (big trees)
a+bgr. Biomass (small trees)
Total biomass (small trees)
Total a+bgr.
Biomass (big and
small trees)
Total organic carbon
ha Stem vol. m³/ha
Total vol. Stem 1000 m³
Branch exp. Factor
Total vol. branch 1000 m³
volume (stem + branch) 1000 m³
Above weight (density 0.71 tdm/ m³)
Total weight 000 tdm
Weight tdm/ha.
Weight 000 tdm
Total weight
000 tdm
000 tC
A B C D E F G H I J K L A x B C x D C+E 0.71x F 1.5 x G A x I H + J 0.5 x K 4 39460 0.89 35.1 0.05 1.8 36.9 26.2 39.3 2.61 103.0 142.3 71.1 5 3800 0.89 3.4 0.05 0.2 3.5 2.5 3.8 2.61 9.9 13.7 6.8
Table 3.124: Total change in carbon stocks in living biomass in grassland remaining grassland (000 tC) Time period Total change in carbon stocks (000 tC) [1985-1989] -2257.72 [1990-1994] -2475.25 [1995-1999] -2675.89
Land-Use Changes and Greenhouse Gas Fluxes: Scientific Understanding and Contribution to Improving Methodologies for Greenhouse Gas Inventory in BENIN
IPCC NGGIP TSU Inventory Internship 75
Table 3.127: Carbon stocks in dead trees due to natural mortality in grassland remaining grassland of N’dali LUC Area Vol. Above volume and weight: big trees (circ.> 15 cm) a+bgr.
Biomass (big
trees)
a+bgr. Biomass (small trees)
Total biomass (small trees)
Total a+bgr.
Biomass (big and
small trees)
Total organic carbon
ha Stem vol.
m³/ha
Total vol.
Stem 1000 m³
Branch exp.
Factor
Total vol.
branch 1000 m³
volume (stem + branch)
1000 m³
Above weight (density
0.71 tdm/ m³)
Total weight
000 tdm
Weight tdm/ha
Weight 000 tdm
Total weight
000 tdm
000 tC
A B C D E F G H I J K L A x B C x D C+E 0.71x F 1.5 x G A x I H + J 0.5 x K 4 3370 1.16 3.9 0.05 0.2 4.1 2.91 4.37 2.61 8.8 13.2 6.6 5 - - - - - - - - - - - - Table 3.128: Carbon stocks in dead trees due to natural mortality in grassland remaining grassland of TTK LUC Area Vol. Above volume and weight: big trees (circ.> 15 cm) a+bgr.
Biomass (big
trees)
a+bgr. Biomass (small trees)
Total biomass (small trees)
Total a+bgr.
Biomass (big and
small trees)
Total organic carbon
ha Stem vol.
m³/ha
Total vol.
Stem 1000 m³
Branch exp.
Factor
Total vol.
branch 1000 m³
volume (stem + branch)
1000 m³
Above weight (density
0.71 tdm/ m³)
Total weight
000 tdm
Weight tdm/ha
Weight 000 tdm
Total weight
000 tdm
000 tC
A B C D E F G H I J K L A x B C x D C+E 0.71x F 1.5 x G A x I H + J 0.5 x K 4 19880 1.16 23.1 0.05 1.2 24.2 17.2 25.8 2.61 51.9 77.7 38.8 5 - - - - - - - - - - - - Table 3.129: Carbon stocks in dead trees due to natural mortality in grassland remaining grassland of DDA LUC Area Vol. Above volume and weight: big trees (circ.> 15 cm) a+bgr.
Biomass (big
trees)
a+bgr. Biomass (small trees)
Total biomass (small trees)
Total a+bgr.
Biomass (big and
small trees)
Total organic carbon
ha Stem vol.
m³/ha
Total vol.
Stem 1000 m³
Branch exp.
Factor
Total vol.
branch 1000 m³
volume (stem + branch)
1000 m³
Above weight (density
0.71 tdm/ m³)
Total weight
000 tdm
Weight tdm/ha
Weight 000 tdm
Total weight
000 tdm
000 tC
A B C D E F G H I J K L A x B C x D C+E 0.71x F 1.5 x G A x I H + J 0.5 x K 4 7800 0.67 5.2 0.05 0.3 5.5 3.9 5.8 2.61 20.4 26.2 13.1 5 400 0.67 0.3 0.05 0.01 0.3 0.2 0.3 2.61 1.0 1.3 0.7 The data in the above tables are summarised in the Table 3.130. Table 3.130: Estimate of biomass per ha in dead trees due to natural mortality in grassland remaining grassland Sota Goungoun OS N’dali TTK DDA Area (ha) 8273 8093 43260 3370 19880 8200 Total biomass (000 tdm) 11 22 156 13.2 77.7 27.5 Biomass (tdm/ha) 1.33 2.72 3.61 3.92 3.91 3.35 These data range from 1.33 to 3.92 tdm/ha and the mean 2.63 tdm/ha is used to estimate the carbon stocks that entering the dead wood pool due to natural mortality of trees. The estimates are presented in the Table 3.131.
Land-Use Changes and Greenhouse Gas Fluxes: Scientific Understanding and Contribution to Improving Methodologies for Greenhouse Gas Inventory in BENIN
IPCC NGGIP TSU Inventory Internship 76
Table 3.131: Estimate of carbon stocks in the dead wood pool due to natural mortality in grassland remaining grassland Time period Area of grassland (ha) Total carbon stocks from natural mortality
(000 tC) [1985-1989] 3476953 4572.19 [1990-1994] 3372192 4434.43 [1995-1999] 3206921 4217.10 The Table 3.132 shows the total carbon transferred into the dead wood pool. Table 3.132: Total carbon transfer into the dead wood pool due to fire and natural mortality in grassland remaining grassland Time period Total carbon stocks from fire
(000 tC) Total carbon stocks from natural
mortality (000 tC) Transfer of carbon into dead
wood (000 tC): Binto [1985-1989] 119.71 4572.19 4691.91 [1990-1994] 119.71 4434.43 4554.14 [1995-1999] 119.71 4217.10 4336.81 The Equation 3.5 together with assumptions considered are used to estimate the carbon stocks change in the dead wood pool. Table 3.133: Total carbon stocks change in the dead wood pool in grassland remaining grassland (000 tC) Time period Transfer of carbon into dead
wood (000 tC): Binto Transfer of carbon out of dead
wood (000 tC): Bout Total change in carbon stocks in
dead wood (000 tC) [1985-1989] 4691.91 2086.32 2605.59 [1990-1994] 4554.14 2025.06 2529.08 [1995-1999] 4336.81 1928.42 2408.39 Choice of Emission/Removal Factors Transfer into the dead wood pool natural mortality: 2.63 tdm/ha/yr Above ground biomass Bw= 17.2 tdm/ha; fBL = 0.4 Decay rate: k= 0.19 ± 0.026 year-1. Choice of Activity Data Land area burned, area of grassland. Uncertainty Estimate See Section Uncertainty Assessment
• Change in carbon stocks in soils According to the information provided in the Section Change in carbon stocks in soil in cropland remaining cropland, all soils are mineral and there is no application of lime or dolomite. Therefore the Equation 3.4.7 p.3.111 GPG LULUCF reduced to the sole component of mineral soil will be used. In definitive, it is the Equation 3.4.8 p.3.112 which has been used. The types of soil presented in the Table 3.99 include: luvisols (HAC soils): 65%, arenosols (sandy soils): 20%, acrisols (LAC soils): 10%, Gleysol (Wetland soils): 3% and vertisols (HAC soils): 2%. The majority of soils in Benin are HAC accounting for 67%. As default, it will be assumed that all soils are HAC soils. The SOCREF(grassland)= 92 tC/ha (see Table 3.55) has been used. Data on distribution of grassland according to management (e.g. non-degraded, moderately/severely degraded, improved) are not really available. Some considerations have been done taking into account the overall state of grassland in order to select appropriately the stock change factors. It can be accepted that at the beginning, the majority of grassland was nominally managed and that the state after 20 years was unimproved moderately degraded. In these conditions, the following factors will be used: Initial situation: (FLU, FMG, FI) = (1±NA; 1±NA; 1±NA) NA: Not Available. Situation in the inventory year: (FLU, FMG, FI) = (1±NA; 0.97±10%; 1±NA) Therefore, the initial soil carbon stock is SOC(0-T) = 92•1•1•1= 92 tC/ha and the soil carbon in the inventory year is SOC0 = 92•1•0.97•1= 89.24 tC/ha. Thus, the average annual change in soil C stocks is (89.24-92)/20 = -0.14 tC/ha/yr; decrease in C stocks. The changes in carbon stocks in mineral soils are presented in the Table 3.134. Table 3.134: Total change in carbon stocks in mineral soils in grassland remaining grassland (000 tC)
[1985-1989] [1990-1994] [1995-1999] Area (ha) C stock change Area (ha) C stock change Area (ha) C stock change 3476953 -486.8 3372192 -472.1 3206921 -449
Land-Use Changes and Greenhouse Gas Fluxes: Scientific Understanding and Contribution to Improving Methodologies for Greenhouse Gas Inventory in BENIN
IPCC NGGIP TSU Inventory Internship 77
Choice of Emission/Removal Factors SOCREF, FLU, FMG, and FI above were used. Choice of Activity Data Area of grassland under different management practices. Uncertainty Estimate See Section Uncertainty Assessment
• Non-CO2 greenhouse gas emissions As indicated in Section 3.4.1.3 p.3.120 GPG LULUCF, the IPCC Guidelines and the GPG 2000 (Chapter 4, Agriculture) already addressed emissions of some non-CO2 gases that should be reported in Agriculture sector. The non-CO2 gases addressed here are N2O, NOx, CH4 and CO emitted from burning of grassland. The estimated carbon loss due to fires in grassland is 179568 tC. This loss is used in the Equation 3.2.19 p.3.49 GPG LULUCF to estimate non-CO2 GHG emissions from burning. Table 3.135: Non-CO2 GHG emissions from biomass burning in grassland remaining grassland Gas Emissions (000 t) CH4 -2.87 CO -25.14 N2O -0.02 NOx -0.72 Choice of Emissions/Removals Factors Default N/C= 0.01 ratio and default data provided in the Table 3.A.1.15, p.3.185 GPG LULUCF have been used. Choice of Activity Data Carbon emission from fire is used as activity data as well as data on land area burned. Uncertainty Estimate This is addressed in the Section Uncertainty Assessment The compilation of GHG emissions/removals from grassland remaining grassland is presented in the table below. Table 3.136: Total GHG emissions/removals from the category grassland remaining grassland (Gg) CO2 CH4 CO N2O NOx [1985-1989] -509.41 - 2.87 - 25.14 -0.02 - 0.72 [1990-1994] -1533.66 - 2.87 - 25.14 -0.02 - 0.72 [1995-1999] -2627.17 - 2.87 - 25.14 -0.02 - 0.72 3.2.3.2 Land converted to grassland The total change in carbon stocks in land converted to grassland is estimated using the Equation 3.4.12 p.3.120 GPG LULUCF. The sub-categories considered are living biomass and soil organic matter. Non-CO2 GHGs emissions have also been estimated.
• Change in carbon stocks in living biomass According to the LUC matrices developed in this report (Tables 3.7, 3.8 and 3.9), forest land and cropland are the main lands converted to grasslands. The conversion of forest land to grassland could be the result of deforestation and when cropland is abandoned, it can be taken over by grassland. The Equations 3.4.14, 3.4.15 p.3.123 GPG LULUCF and the Equation 3.4.16 p.3.124 GPG LULUCF have been used together with some country-specific data to estimate the change in carbon stocks in living biomass in land converted to grassland. - Conversion of forest land to grassland The average area (Aconversion) of land undergoing a transition from forest land to grassland is presented in the LUC matrices. Estimate of carbon stocks change: Lconversion = CAfter – CBefore
Land-Use Changes and Greenhouse Gas Fluxes: Scientific Understanding and Contribution to Improving Methodologies for Greenhouse Gas Inventory in BENIN
IPCC NGGIP TSU Inventory Internship 78
CBefore: the living biomass stock for forest was estimated at 62.37 tdm/ha (see Section forest land remaining forest land), then CBefore = 31.2 tC/ha. CAfter: this is 12.85 tC/ha derived from the total biomass for grassland that is 25.7 tdm/ha (see Section grassland remaining grassland). Lconversion = (12.85– 31.2) = -18.35 tC/ha. The conversion has resulted in a loss of biomass. The change in carbon stocks as result of biomass clearing during conversion from forest to grassland is presented in the Table 3.137. Table 3.137: Change in carbon stocks due to clearing during conversion of forest to grassland. Time period Aconversion
conversionCΔ (losses) (000 tC)
[1985-1989] 620969 -11394.8 [1990-1994] 708509 -13001.1 [1995-1999] 242729 -4454.08 Apportion of carbon losses between burning and decay processes.
siteonburnedρ , siteoffburnedρ , decayρ , oxidρ :
36.0=siteonburnedρ : IPCC default value from the Table 3A.1.12 p.3.179 GPG LULUCF.
:siteoffburnedρ The reason mentioned as well as the assumption used in the cropland section have also been
9.0=oxidρ (IPCC default) The Table 3.138 presents the carbon loss from biomass burning onsite and offsite and from biomass decay. Table 3.138: Carbon loss due to biomass burning on-site and off-site and due to decay during conversion of forest to grassland (000 tC) Time period
[1985-1989] -11394.8 -3691.91 -5537.86 -1139.48 [1990-1994] -13001.1 -4212.37 -6318.55 -1300.11 [1995-1999] -4454.08 -1443.12 -2164.68 -445.41 - Conversion of cropland to grassland The matrices show the average area (Aconversion) of land undergoing a transition from cropland to grassland. Estimate of carbon stocks change: Lconversion = CAfter – CBefore CBefore: the biomass stock for perennial cropland is estimated at 8.58 tC/ha derived from the total biomass which is 17.16 tdm/ha. For annual cropland, the default value 5 tC/ha from the GPG LULUCF (Table 3.4.8 p.3.124) is considered. There is no information about areas of perennial cropland and annual cropland converted respectively to grassland. Therefore, an average of data provided above for CBefore has been used. This is (8.58+5)/2= 6.79 tC/ha. CAfter: this is 12.85 tC/ha as above. Lconversion = (12.85 – 6.79) = 6.06 tC/ha. This conversion has resulted in a gain of biomass. The change in carbon stocks as result of biomass clearing during conversion of cropland to grassland is presented in the Table 3.139. Table 3.139: Change in carbon stocks during conversion of cropland to grassland. Time period Aconversion
Land-Use Changes and Greenhouse Gas Fluxes: Scientific Understanding and Contribution to Improving Methodologies for Greenhouse Gas Inventory in BENIN
IPCC NGGIP TSU Inventory Internship 79
Default values:
36.0=siteonburnedρ ; 9.0=oxidρ (IPCC default)
siteoffburnedρ = 0.50
( )siteoffburnedsiteonburneddecay ρρρ +−=1 = 0.14 Choice of Activity Data Areas of forest and cropland converted to grassland. Uncertainty Estimate See Section Uncertainty Assessment The Table 3.140 presents the total change in carbon stocks in living biomass in lands converted to grassland. Table 3.140: Total change in carbon stocks in living biomass in land converted to grassland (000 tC) Time-series Total change in carbon stocks in living biomass (000 tC) [1985-1989] -7845.59 [1990-1994] -10738.6 [1995-1999] 309.77
• Change in carbon stocks in soils The types of conversion to grassland include forest land to grassland, cropland to grassland. The majority of soils in Benin being HAC accounting for 67% of the total area of the country, to be consistency with the previous sections, it will be considered only HAC soils as default, due to lack of information on conversion. Most of grasslands are overgrazed, moderately degraded, assumptions based on expert judgment looking at what could be the situation in the time period considered. Then the default stocks change factors are (FLU, FMG, FI) = (1.0, 0.97±10%, 1.0) from the Table 3.4.5 p.3.118 GPG LULUCF. Forest land converted to grassland SOCREF(forest land)= 134 tC/ha (see Table 3.55). Default values for stock change factors (FLU, FMG, FI) are all 1. Thus, SOC(0-T)= 134 tC/ha. Considering the situation described above that forest is converted into grassland that is overgrazed, moderately degraded, SOC0= 134*1*0.97*1 = 129.98 tC/ha. The average annual change in soil C stock is: (129.98-134)/20 = -0.2 tC/ha/yr. Cropland converted to grassland SOCREF(cropland) = 81.5 tC/ha (see Table 3.55). Most of croplands being converted to grasslands are long-term cultivated with intensive tillage and medium input. This assumption is based on expert judgment considering the situation in cropland remaining cropland. Thus, the default stocks change factors are (FLU, FMG, FI) = (0.58±42%; 1.0; 1.0), from the Table 3.3.4 p.3.77 GPG LULUCF. SOC(0-T)= 81.5*0.58*1*1 = 47.27 tC/ha Croplands are converted into grasslands that are overgrazed, moderately degraded. Then, SOC0= 81.5*1*0.97*1 = 79.06 tC/ha. The average annual change in soil C stocks is: (79.06-47.27)/20 = 1.59 tC/ha/yr. Considering the total areas provided in the matrices for forest land and cropland converted to grassland, the total change in carbon stocks in soils are calculated and presented in the table below. Table 3.141: Total change in carbon stocks in soils in land converted to grassland (000 tC) [1985-1989] [1990-1994] [1995-1999] Area (ha) C stock change Area (ha) C stock change Area (ha) C stock change Forest land converted to grassland 620969 -124.19 708509 -141.70 242729 -48.55 Cropland converted to grassland 585678 +931.23 373356 +593.64 786114 +1249.92 Total change in carbon stocks +807.03 +451.93 +1201.38 The total conversion of forest and cropland to grassland has resulted in a gain in carbon stocks in soils.
Land-Use Changes and Greenhouse Gas Fluxes: Scientific Understanding and Contribution to Improving Methodologies for Greenhouse Gas Inventory in BENIN
IPCC NGGIP TSU Inventory Internship 80
Choice of Emission/Removal Factors SOCREF(forest land)= 134 tC/ha; SOCREF(cropland) = 81.5 tC/ha. Default stock change factors: Forest land: (FLU, FMG, FI) = (1,1,1). Cropland: (FLU, FMG, FI) = (0.58±0.42; 1.0; 1.0). Grassland: (FLU, FMG, FI) = (1.0, 0.97±10%, 1.0). Choice of Activity Data Areas of land converted to grassland. Uncertainty Estimate See Section Uncertainty Assessment
• Non-CO2 gases Emissions of non-CO2 gases have been estimated from the portion of biomass burned both onsite and offsite during conversion of forest to grassland; the conversion of cropland to grassland having resulted in a net gain in carbon, emissions of non-CO2 gases are assumed negligible. The Equation 3.2.19 p.3.49 GPG LULUCF has been used. Table 3.142: Carbon loss due to biomass burning on-site and off-site during conversion of forest land to grassland (000 tC). Time-series Lburn onsite Lburn offsite Lburn onsite + Lburn offsite [1985-1989] -3691.91 -5537.86 -9229.77 [1990-1994] -4212.37 -6318.55 -10530.9 [1995-1999] -1443.12 -2164.68 -3607.8 The non-CO2 trace gas emissions are presented in the following table.
Choice of Emissions/Removals Factors Default N/C= 0.01 ratio and data provided in the Table 3.A.1.15, p.3.185 GPG LULUCF have been used. Choice of Activity Data Emission of carbon from biomass burning onsite and offsite is used as activity data. Uncertainty Estimate See Section Uncertainty Assessment The Table 3.144 presents the compilation of GHG emissions/removals from the category land converted to grassland. Table 3.144: Total GHG emissions/removals from land converted to grassland (Gg) CO2 CH4 CO N2O NOx [1985-1989] -25808.05 -147.68 -1292.17 -1.02 -36.92 [1990-1994] -37717.79 -168.49 -1474.33 -1.16 -42.12 [1995-1999] +5540.88 -57.72 -505.09 -0.40 -14.43 3.2.4 Other lands Under this section, other lands include the IPCC land-use categories for which estimates of emissions and removals have not been developed in this report. These are wetland, settlement and other land. Furthermore, the GPG LULUCF also has not provided comprehensive methodological guidance for those land-use categories.
Table 3.143: Non-CO2 gases emitted from onsite and offsite burning of biomass during conversion of forest to grassland (000 tonnes). Time-series Lburn onsite + Lburn offsite (000 tC) CH4 CO N2O NOx [1985-1989] -9229.77 -147.68 -1292.17 -1.02 -36.92 [1990-1994] -10530.9 -168.49 -1474.33 -1.16 -42.12 [1995-1999] -3607.8 -57.72 -505.09 -0.40 -14.43
Land-Use Changes and Greenhouse Gas Fluxes: Scientific Understanding and Contribution to Improving Methodologies for Greenhouse Gas Inventory in BENIN
IPCC NGGIP TSU Inventory Internship 81
3.2.5 Compilation of estimates The Table 3.145 is a compilation of the estimates of GHG emissions/removals from the LULUCF sector. Table 3.145: Compilation of estimates of GHG emissions/removals from the LULUCF sector CO2 CH4 CO N2O NOx [1985-1989] -63292.47 -359.15 -3142.56 -4.05 -89.8 [1990-1994] -92522.57 -409.81 -3585.92 -4.64 -102.45 [1995-1999] -97144.16 -416.93 -3648.16 -5.8 -104.24 Trend [1985-1989] to [1995-1999] 53.48% 16.09% 16.09% 43.21% 16.08%
The Figure 3.1 shows the level of emissions/removals as well as the trend for each gas and each land-use category for the time period considered.
Figure 3.1: Greenhouse gas emiss ions/removals level and trend from land-use categories
-700
-600
-500
-400
-300
-200
-100
0
100
[1985-1989] [1990-1994] [1995-1999]
Hun
dred
s
Time period
FF: fores t land remaining forest land, LF: land converted to fores t land CC: cropland remaining cropland, LC: land converted to cropland
GG: grass land remaining grass land, LG: land converted to grass land
In the Figure 3.1 emissions are negative while removals are positive. 3.3 CROSS-CUTTING ISSUES 3.3.1 Uncertainty estimate As stated in the GPG 2000 and GPG LULUCF, there is no predetermined level of precision for estimate of GHG emissions/removals and the uncertainty information is not intended to dispute the validity of the inventory estimates. Instead, it is assessed to help prioritise efforts to improve the accuracy of inventories in future and guide decision on methodological choice. However, efforts should be undertaken at each step when the inventory is being developed to reduce the uncertainty as much as possible. Uncertainty can be estimated using either Tier 1 or Tier 2 approach described below.
Land-Use Changes and Greenhouse Gas Fluxes: Scientific Understanding and Contribution to Improving Methodologies for Greenhouse Gas Inventory in BENIN
IPCC NGGIP TSU Inventory Internship 82
The Tier 1 approach uses simple errors propagation equations and simple combination of uncertainties by category to estimate overall uncertainty for one year and the uncertainty in the trend. The Tier 2 approach uses the technique of Monte Carlo simulation to estimate uncertainties by category and overall uncertainty for one year and the uncertainty in the trend. The simulation uses two distinct operations that is to say sampling (i.e. selection of random values from probability distribution function: PDF) and iteration which is the calculation of the spreadsheet. In the context of this study, Tier 2 approach has been performed using @RISK Professional v4.5. Spreadsheets have been developed for each LUC and the uncertainty in emission/removal factors and activity data is described using the appropriate PDF. An overview of statistical parameters for PDF is presented in Annex III while an example of spreadsheet is provided in Annex IV for forest land remaining forest land. The PDF are selected based on the combination of available data and expert judgment. After the simulation, the uncertainty in outputs which are emissions and removals of GHG and trends has been estimated as 95% confidence interval. An example of simulation results is presented in Annex V for forest land remaining forest land. The estimate of uncertainty associated with emissions/removals is summarised in the Table 3.146 for the period [1995-1999]. Table 3.146: Uncertainty associated with emissions and removals estimates in [1995-1999] Land-use category Gas [1995-1999]
CO2 21% CH4 27% N2O 29% CO 34%
Forest land remaining forest land
NOx 24% CO2 14% CH4 25% N2O 27% CO 33%
Land converted to forest land
NOx 21% Cropland remaining cropland CO2 40%
CO2 13% CH4 31% N2O 36% CO 37%
Land converted to cropland
NOx 28% CO2 81% CH4 28% N2O 28% CO 35%
Grassland remaining grassland
NOx 24% CO2 64% CH4 30% N2O 32% CO 37%
Land converted to grassland
NOx 27% The trend in the spreadsheets has been calculated as the ratio of the change in estimates between [1995-1999] and [1985-1989] divided by the [1985-1989]’s estimate. The uncertainty associated with the trend in CO2 emissions from land converted to grassland and land converted to cropland are respectively 14% and 28% and that related to CO2 emissions from other categories ranges from 64 to 93%. The uncertainty associated with the trend in non-CO2 emissions from land converted to grassland is 9% while for the other categories it is around 35%. 3.3.2 Other cross-cutting issues
• Identification of key categories and significant subcategories The key category analysis is an iterative process and initial estimates are needed for each subcategory to perform the analysis. The current study deals with only the LULUCF sector and the general method for identifying key categories has been applied at the level of that sector. Both Tier 1 and Tier 2 methods have been applied. Tier 1 Method: Tier 1 level assessment The analysis has been performed for each time period for which estimates have been made, i.e. [1985-1989], [1990-1994] and [1995-1999]. The results are presented in the Tables 3.147 to 3.149.
Land-Use Changes and Greenhouse Gas Fluxes: Scientific Understanding and Contribution to Improving Methodologies for Greenhouse Gas Inventory in BENIN
IPCC NGGIP TSU Inventory Internship 83
Table 3.147: Spreadsheet for the Tier 1 analysis – level assessment [1985-1989]
A B C D E
Source/sink categories Direct GHG [1985-1989]
estimates (absolute value)
Level Assessment from column C
Cumulative Total of column D
Land converted to grassland CO2 25808.08 0.3460 0.3460
Land converted to cropland CO2 19047.70 0.2554 0.6014
Forest land remaining forest land CO2 13413.1 0.1798 0.7813
Land converted to forest land CO2 5760 0.0772 0.8585
Land converted to grassland CH4 3101.28 0.0416 0.9001
Forest land remaining forest land CH4 2648.1 0.0355 0.9356
Cropland remaining cropland CO2 1245.79 0.0167 0.9523
Land converted to cropland CH4 1088.43 0.0146 0.9669
Land converted to forest land CH4 644.07 0.0086 0.9755
Land converted to cropland N2O 598.30 0.0080 0.9835
Grassland remaining grassland CO2 509.41 0.0068 0.9904
Land converted to grassland N2O 316.20 0.0042 0.9946
Forest land remaining forest land N2O 269.7 0.0036 0.9982
Land converted to forest land N2O 65.10 0.0009 0.9991
Total 118779.45 1.0000 The key categories are those that, when summed together in descending order of magnitude, add up to 95% of the total in column D. Those categories are in gray in the above tables. The analysis of tables shows that from [1985-1989] to [1995-1999], the Tier 1 level assessment identified seven (7) key categories for each time period with five (5) categories common to all. Those five (5) categories include CO2 emissions from forest land remaining forest land, land converted to forest land, land converted to cropland, land converted to grassland and CH4 emissions from forest land remaining forest land. Furthermore CH4 emissions from land converted to cropland and CO2 emissions from grassland remaining grassland are new key categories for [1995-1999]. The categories shaded in dark red have to be examined with respect to the qualitative criteria. Tier 1 trend assessment The trend analysis has been performed considering estimates for the periods [1985-1989] and [1995-1999] as shown in the Table 3.150.
Land-Use Changes and Greenhouse Gas Fluxes: Scientific Understanding and Contribution to Improving Methodologies for Greenhouse Gas Inventory in BENIN
IPCC NGGIP TSU Inventory Internship 85
Table 3.150: Spreadsheet for the Tier 1 analysis – trend assessment
A B C D E F G
Source/sink categories Direct GHG [1985-1989] estimates
[1995-1999] estimates
Trend Assessment
% Contribution
to trend
Cumulative Total of
column F
Land converted to grassland CO2 -25808.05 5540.88 0.2741 0.4438 0.4438
Land converted to cropland CO2 -19047.70 -64408.60 0.2235 0.3619 0.8057
Forest land remaining forest land CO2 -13413.10 -24761.40 0.0294 0.0476 0.8533
Cropland remaining cropland CO2 1245.79 -1850.31 0.0231 0.0374 0.8907
Land converted to grassland CH4 -3101.28 -1212.12 0.0213 0.0345 0.9252
Land converted to cropland CH4 -1088.43 -4172.49 0.0158 0.0256 0.9508
Grassland remaining grassland CO2 -509.41 -2627.17 0.0116 0.0188 0.9696
Forest land remaining forest land CH4 -2648.10 -2569.98 0.0086 0.0139 0.9835
Land converted to forest land CO2 -5760.00 -9037.56 0.0027 0.0044 0.9879
Land converted to cropland N2O -598.30 -1333.00 0.0027 0.0044 0.9922
Land converted to grassland N2O -316.20 -124.00 0.0022 0.0036 0.9958
Land converted to forest land CH4 -644.07 -740.67 0.0014 0.0023 0.9981
Forest land remaining forest land N2O -269.70 -260.40 0.0009 0.0015 0.9995
Total 0.6176 1.0000 In the Table 3.150, emissions are negative and removals positive. The Tier 1 trend assessment identified six (6) key categories, two (2) of them have not been identified by the level assessment of [1995-1999]. Tier 2 Method: The identification of key categories using a Tier 2 method is based on estimate of uncertainties related to emissions/removals. The method has been applied for the level assessment as well as for the trend as this can be seen in the Tables 3.151 and 3.152.
Land-Use Changes and Greenhouse Gas Fluxes: Scientific Understanding and Contribution to Improving Methodologies for Greenhouse Gas Inventory in BENIN
IPCC NGGIP TSU Inventory Internship 86
Table 3.151: Spreadsheet for the Tier 2 analysis – level assessment [1995-1999]
A B C D E F G
Source/sink categories Direct GHG Tier 1 level assessment [1995-1999]
Relative category
uncertainty %
Level assessment
with uncertainty
% contribution
to the assessment
Cumulative Total of
column F
Land converted to cropland CO2 0.5423 13% 0.07050 0.3430 0.3430
Forest land remaining forest land CO2 0.2085 21% 0.04379 0.2130 0.5560
Land converted to grassland CO2 0.0466 64% 0.02982 0.1451 0.7011
Grassland remaining grassland CO2 0.0221 81% 0.01790 0.0871 0.7882
Land converted to cropland CH4 0.0351 31% 0.01088 0.0529 0.8411
Land converted to forest land CO2 0.0761 14% 0.01065 0.0518 0.8930
Cropland remaining cropland CO2 0.0156 40% 0.00624 0.0304 0.9233
Forest land remaining forest land CH4 0.0216 27% 0.00583 0.0284 0.9517
Land converted to cropland N2O 0.0112 36% 0.00403 0.0196 0.9713
Land converted to grassland CH4 0.0102 30% 0.00306 0.0149 0.9862
Land converted to forest land CH4 0.0062 25% 0.00155 0.0075 0.9937
Forest land remaining forest land N2O 0.0022 29% 0.00064 0.0031 0.9968
Land converted to grassland N2O 0.0010 32% 0.00032 0.0016 0.9984
Land converted to forest land N2O 0.0006 27% 0.00016 0.0008 0.9992
Land-Use Changes and Greenhouse Gas Fluxes: Scientific Understanding and Contribution to Improving Methodologies for Greenhouse Gas Inventory in BENIN
IPCC NGGIP TSU Inventory Internship 87
The Tier 1 and Tier 2 level assessments identified the same number (seven) of key categories with the only difference that the Tier 1 includes CH4 emission from forest land remaining forest land while CO2 emissions from cropland remaining cropland is included in the Tier 2. With regard to the trend assessment, the Tier 1 identified six key categories when the Tier 2 included four. Only CO2 emission from grassland remaining grassland identified in the Tier 2 is not included in the Tier 1. Furthermore, all key categories identified by the Tier 2 trend assessment have also been identified by the Tier 2 level assessment of [1995-1999]. From all that has been written before, one can conclude that the categories that could be considered key in the context of this study are those presented in the Table 3.151. In these conditions, the significant subcategories that are those accounting for 25-30% of emissions/removals for the overall category have been identified and presented in the Table 3.153. Those subcategories have to be prioritised in terms of methodological choice. Moreover, the sensitivity analysis as part of the uncertainty assessment provided additional information on relevant parameters that need to be considered carefully. Table 3.153: Key categories, significant subcategories and relevant parameters. Key category Significant subcategories Additional information from the
sensitivity analysis: input variables that cause large changes in the model outputs
Forest land remaining forest land – CO2 - Changes in C stocks in living biomass - Changes in C stocks in dead organic matter
Biomass expansion factor, volume of fuelwood gathering, aboveground biomass stocks, decay rate constant, basic wood density, land area.
Land converted to forest land – CO2 - Changes in C stocks in living biomass Land area, increment in living biomass in natural regeneration, transfer rate into dead wood pool due natural mortality in forest regeneration, increment in living biomass in plantation, SOC accumulation.
Cropland remaining cropland – CO2 - Changes in C stocks in living biomass - Changes in C stocks in dead organic matter - Changes in C stocks in soils
Increment in total biomass in perennial crops, area of perennial and annual cropland, transfer rate into dead wood due natural mortality, decay rate constant, annual per ha change in soil organic carbon (SOCRREF, stock change factors).
Land converted to cropland – CO2 - Changes in C stocks in living biomass: forest conversion contributes 81%, grassland conversion contributes 19%.
Carbon before and after conversion during conversion of forest, area of forest converted, carbon before conversion during conversion of grassland, area of grassland converted, annual per ha change in carbon stocks in soil during conversion of forest and grassland.
Land converted to cropland – CH4 - Biomass burning: forest conversion is more important.
CH4 emission factor for biomass burning, carbon before and after conversion during conversion of forest, area of forest land converted, fraction of biomass that oxidizes when burned, carbon before conversion during conversion of grassland, fraction of biomass burned onsite and offsite.
Grassland remaining grassland – CO2 - Changes in C stocks in living biomass - Changes in C stocks in dead organic matter
Carbon loss due to fuelwood gathering, land area, transfer rate into dead wood due natural mortality, decay rate constant, average increment in total biomass, annual per ha change in C stocks in soil, fraction of biomass left to decay.
Land converted to grassland – CO2 - Changes in C stocks in soils: cropland conversion is more important.
Area of cropland converted, carbon after conversion during conversion of forest, area of forest land converted, carbon before conversion during conversion of forest and cropland, annual per ha change in C stocks in soil during conversion cropland
Land-Use Changes and Greenhouse Gas Fluxes: Scientific Understanding and Contribution to Improving Methodologies for Greenhouse Gas Inventory in BENIN
IPCC NGGIP TSU Inventory Internship 88
Assessment of deforestation The land-use change matrices presented in Tables 3.7 to 3.9 show that deforestation occurs through conversion of forest to grassland and to cropland. The estimate of emissions associated with each conversion has been derived from the sections “Land converted to cropland” and “Land converted to grassland” and are presented below. - Conversion of forest to cropland Table 3.154: Estimate of emissions from conversion of forest to cropland (Gg) [1985-1989] [1990-1994] [1995-1999] CO2 -3020.16 -11678.7 -45474 CH4 -10.6749 -41.2789 -160.73 CO -93.4052 -361.19 -1406.39 N2O -0.07339 -0.28379 -1.10502 NOx -2.66872 -10.3197 -40.1825 - Conversion of forest to grassland Table 3.155: Estimate of emissions from conversion of forest to grassland (Gg) [1985-1989] [1990-1994] [1995-1999] CO2 -41780.9 -47670.7 -16331.6 CH4 -147.676 -168.495 -57.7248 CO -1292.17 -1474.33 -505.092 N2O -1.01527 -1.1584 -0.39686 NOx -36.9191 -42.1237 -14.4312 The total GHG emissions due deforestation is presented in the Table 3.152. Table 3.156: Estimate of total emissions from conversion of forest to cropland and grassland (Gg) [1985-1989] [1990-1994] [1995-1999] CO2 -44801.1 -59349.4 -61805.6 CH4 -158.351 -209.774 -218.455 CO -1385.58 -1835.52 -1911.48 N2O -1.08866 -1.44219 -1.50188 NOx -39.5878 -52.4434 -54.6137 The smallest category identified as key (see Table 3.151) is “CO2 emissions from cropland remaining cropland” that accounts for 1850.31 Gg. The “CO2 emissions from deforestation” during [1995-1999] were estimated at 61805.6 Gg, then larger than the smallest key category. Thus, the “CO2 emissions from deforestation” will also be considered key. The analysis from the above tables shows that the conversion of forest to cropland is the significant land conversion.
• QA/QC, Time series consistency, Recalculations, Verification A complete inventory should also address in a comprehensive manner the above mentioned cross-cutting issues. The estimates in the current report have used the same methodologies, emission/removal factors assuming that the latter have not followed large changes, as well as the same sources and methods of processing of data for the time periods considered. 3.4 USE OF DECISION TREES TO IDENTIFY APPROPRIATE TIERS FOR POOLS A key category analysis has not been conducted considering a complete inventory including all the IPCC sectors. Instead as mentioned in the part Identification of key categories, the general method has been used at the sectoral level of LULUCF. Significant subcategories for which it would be good practice to use higher tiers have been identified without the need of using the decision trees. This initial assessment has identified key categories for future development. 3.5 REPORTING OF ESTIMATES OF GREENHOUSE GAS EMISSIONS AND REMOVALS In this report, emissions are negative while removals are positive. To fulfil the reporting requirements, in the reporting tables, emissions are reported as positive values and removals negative.
Land-Use Changes and Greenhouse Gas Fluxes: Scientific Understanding and Contribution to Improving Methodologies for Greenhouse Gas Inventory in BENIN
IPCC NGGIP TSU Inventory Internship 89
Chapter 4
Conclusions and Recommendations 4.1 KEY FINDINGS The study demonstrates the use of the GPG LULUCF in a context characterised by little data and few resources, thus fulfilling the aim of the project. While the use of default data was one important issue identified from the review of the GHG inventory developed for 1995 and provided in the initial national communication of Benin on climate change, the current study has heavily relied on country-specific data and sound assumptions developed to fill some data gaps. Thus, important data including activity data, emission/removal factors are provided in this report as well as useful references. In addition to estimated parameters, the identification of significant subcategories within categories is another important output. Furthermore, an overview of relevant parameters that need to be considered with a view to improving the quality of inventories in the LULUCF sector has been provided. According to these estimates, the LULUCF sector emitted during the period [1995-1999] 107700 Gg CO2 equivalent, an increase of 49% compared to [1985-1989]. The category land converted to cropland is the major source of CO2 emissions and the conversion of forest to cropland is the most significant subcategory. Whereas the study has been concentrated on Benin, it acknowledges the regional similarity of land-use categories, management practices and disturbances between countries in West Africa and suggests the use of some outputs as default at regional level. Moreover, it constitutes a model for similar circumstances. Finally, the study recognizes that the improvement of GHG inventories in our countries in West Africa requires research, training sessions and capacity building activities on different aspects of inventories. The increasingly important involvement in different international scientific processes related to inventories would also be useful. All this would enable to get rid of the relatively high uncertainty associated with the inventories in the region. One important technical capacity improvement as result of this study includes the use of software for assessing the uncertainty associated with data and emissions/removals estimates. 4.2 FOLLOW-UP Further research needs to be conducted in order to find solutions regarding how to improve data quality mainly for subcategories identified as significant in terms of contribution in emissions/removals or uncertainties or both. That research should be concentrated on identified relevant parameters that require more attention. As mentioned in the report, one important issue identified is the one of the carbon stored in products made from biomass (e.g. paper, furniture). These products have been traded among countries and to describe properly the fate of the stored carbon, a life cycle analysis is needed. The development and improvement of that life cycle assessment are very important to assess the carbon flux within a country and among nations. This issue would constitute an area for future research.
Land-Use Changes and Greenhouse Gas Fluxes: Scientific Understanding and Contribution to Improving Methodologies for Greenhouse Gas Inventory in BENIN
IPCC NGGIP TSU Inventory Internship 90
Land-Use Changes and Greenhouse Gas Fluxes: Scientific Understanding and Contribution to Improving Methodologies for Greenhouse Gas Inventory in BENIN
IPCC NGGIP TSU Inventory Internship 91
References The references presented in Annex II complement those presented below, which in addition to documents, includes also some relevant websites. Intergovernmental Panel on Climate Change (IPCC). (2003). Penman J., Gytarsky M., Hiraishi T., Krug T., Kruger D., Pipatti R., Buendia L., Miwa K., Ngara T., Tanabe K., and Wagner F. (Eds). Good Practice Guidance for Land Use, Land-Use Change and Forestry. IPCC/IGES, Hayama, Japan. Intergovernmental Panel on Climate Change (IPCC). (2003). Penman J., Gytarsky M., Hiraishi T., Krug T., Kruger D., Pipatti R., Buendia L., Miwa K., Ngara T., Tanabe K., and Wagner F. (Eds). Definitions and Methodological Options to Inventory Emissions from Direct Human-induced Degradation of Forests and Devegetation of Other Vegetation Types. IPCC/IGES, Hayama, Japan. Intergovernmental Panel on Climate Change (IPCC). (2000a). Penman J., Kruger D., Galbally I., Hiraishi T., Nyenzi B., Emmanuel S., Buendia L., Hoppaus R., Martinsen T., Meijer J., Miwa K., and Tanabe K. (Eds). Good Practice Guidance and Uncertainty Management in National Greenhouse Gas Inventories. IPCC/OECD/IEA/IGES, Hayama, Japan. Intergovernmental Panel on Climate Change (IPCC). (1997). Houghton J.T., Meira Filho L.G., Lim B., Treanton K., Mamaty I., Bonduki Y., Griggs D.J. and Callander B.A. (Eds). Revised 1996 IPCC Guidelines for National Greenhouse Gas Inventories. IPCC/OECD/IEA, Paris, France. Intergovernmental Panel on Climate Change (IPCC). (2000b). Watson R., Noble I.R., Bolin B., Ravindranath, N.H., Verardo D.J. and Dokken D.J. (Eds). Land Use, Land-Use Change, and Forestry: A Special Report. Cambridge University Press. Cambridge, UK. J.Q. Chambers., N. Higuchi., J.P. Schimel., L.V. Ferreira., J.M. Melack. Decomposition and carbon cycling of dead trees in tropical forests of the central Amazon: In Oecologia vol. 122, Number 3, February 2000, pages 380-388. University of Maryland's 1km Global Land Cover Product Hansen, M., DeFries, R., Townshend, J. R. G. and Sohlberg, R., 2000, Global land cover classification at 1km resolution using a decision tree classifier, International Journal of Remote Sensing, Vol. 21, pp. 1331-1365. http://www.geog.umd.edu/landcover/1km-map.html Ahern, Frank J. SPB Academic Pub., 2001. Global and Regional Vegetation Fire Monitoring from Space: Planning a Coordinated International Effort. Johann G. Goldammer & Cornelis de Ronde. Wildland Fire Management Handbook for Sub Sahara Africa. Arino and Melinotte 1997: Satellite data from European Space Agency (ESA) for fires in Africa, Latin America, SE Asia, and Oceania detected during 1993. http://www.igbp.kva.se: International Geosphere-Biosphere Programme (IGBP) http://www.bsrsi.msu.edu/wfw: World Forest Watch http://www.globalforestwatch.org/english/index.htm: Global Forest Watch http://www.wri.org: World Resources Institute http://earthtrends.wri.org/country_profiles/index.cfm?theme=9: Forests, grasslands, drylands: country profiles http://www.wri.org/wr2000 http://www.fao.org/countryprofiles/index.asp?subj=5&iso3=BEN: country profile and mapping information system- Benin http://www.inform.umd.edu/landcover/global-cover.html http://edcdaac.usgs.gov/glcc/glcc.html http://www.unep-wcmc.org: World Conservation Monitoring Centre: http://www/ifpri.org Global Forest Resources Assessment 2000 (FRA 2000) available at www.fao.org/forestry/site/7949/en Global Land Cover Characteristics Data Base Version 1.0 and Version 2.0 available at http://edcdaac.usgs.gov/glcc/globe_int.html : United States Geological Survey (USGS) http://www.fao.org http://www.fao.org/forestry/fop/fopw/Climate/doc/Y3431E.pdf
Land-Use Changes and Greenhouse Gas Fluxes: Scientific Understanding and Contribution to Improving Methodologies for Greenhouse Gas Inventory in BENIN
IPCC NGGIP TSU Inventory Internship 92
http://www.nhq.nrcs.usda.gov/NRI/1997/stat_estimate.htm http://www.efi.fi/projects/dfde/ http://www.whrc.org/new_england/Howland_Forest/Carbon_Sequestration.htm http://www.whrc.org/: Woods Hole Research Centre. - FAO Global Forest Fire Assessment: 1990-2000 of the FRA 2000. http://www.ruf.uni-freiburg.de/fireglobe/iffn/country/country.htm: International Forest Fire News (IFFN), containing forest fire country notes collected between 1990 and 2000. http://www.grid.unep.ch/activities/earlywarning/preview/ims/gba/:UNEP database on global burnt area for 2000. http://www.fao.org/gtos/gofc-gold/2001_n.html: Global Observation of Forest and Land Cover Dynamics.
Land-Use Changes and Greenhouse Gas Fluxes: Scientific Understanding and Contribution to Improving Methodologies for Greenhouse Gas Inventory in BENIN
IPCC NGGIP TSU Inventory Internship 93
Annex I: TSU Inventory Internship Research Proposal
Technical Support Unit Inventory Internship
------------------------------ Research proposal
Submitted by G.H.Sabin Guendehou, Researcher BENIN Centre for Scientific and Technical Research 03. P.O.Box 2048 COTONOU - Republic of BENIN
Theme: Land use changes and Greenhouse Gas fluxes: Scientific Understanding and Contribution to Improving Methodologies for Greenhouse Gas Inventory in BENIN. (a) Problem Statement: Lands and Forests in Benin and other countries in West Africa are subject to pressure from human activities such as land work and forests exploitation. These activities are responsible for forests degradation and devegetation of other vegetation types and destruction of soils organic matter. This situation leads both to increase in emission of greenhouse gases (GHG) and reduction in carbon sequestration which estimation requires the use of appropriate methodologies and necessary expertise in conditions that reduce uncertainties. A review of GHG inventories(1) done for eleven countries(2) in West Africa, considering the IPCC Guidelines for National GHG inventory (IPCC, 1997) and the IPCC Good Practice Guidance and Uncertainty Management (IPCC, 2000) as well as an analysis of reports and conclusions of thematic workshops on inventories in African Countries (notably Nairobi, January 1999; Accra, August 1999; Cotonou, October 2001), and the analysis of information provided to the National Communication Support Programme (NCSP) by the countries within the framework of the development of a Regional Project entitled “Capacity building for improving the quality of GHG inventory in West and francophone Central Africa” have enabled to identify issues related to the quality of GHG inventories in these regions. The identified issues concern methodologies, data, uncertainty assessment, quality assurance/quality control, institutional arrangements, technical capacity, GHG accounting and reporting principles (relevance, completeness, consistency, transparency, accuracy and comparability). The assessment of uncertainties associated with inventories in the region in LUCF and Agriculture sectors more concerned by the current theme is based on expert judgement using qualitative criteria since there is a lack of knowledge for quantifying uncertainties in practice. Uncertainties are estimated as high and this is largely caused by the lack of expertise and use of default methodologies and parameters (activity data, emission, removal and conversion factors,…) i.e. which do not always correspond to the national circumstances of countries in the region. Unfortunately, our countries do not have Institute or Department of University where these issues are taught. Therefore, there is a need to be oriented towards existing Centres or Institutes known to better address those issues. The research will develop issues related to GHG inventories in LUCF sector. It will deliver knowledge and build capacities on processes leading to emission and removal of GHG for land categories and conversions and in turn contribute to improve the quality of GHG inventories. (b) Main Objectives: The main objectives of the project are outlined below:
1. Enhance understanding of C and GHG fluxes for land use categories and conversions; 2. On the basis of the enhanced understanding, improve and deepen the use of the IPCC methodologies for
the establishment of GHG inventories; 3. Contribute to improve the quality of GHG inventories in West Africa. Issues such as sampling, data
collection, site investigations, QA/QC, uncertainties assessment, calculation of emission and removal factors will be developed.
(c) Expected Outcomes: The main following outcomes are expected:
• Knowledge on interactions between land use, land use change and GHG fluxes has improved;
(1) Guendehou, G.H.S., and Ahlonsou, E.D. (2003). Greenhouse Gas Inventories in West Africa: Relevant Issues and Strategy for Improving the Quality, In: Proceedings of the Third International Methane and Nitrous Oxide Mitigation Conference, Beijing, China, Nov 2003, pp. 709-714. (2) Benin, Burkina Faso, Ivory Coast, Gambia, Ghana, Guinea, Mali, Niger, Nigeria, Senegal and Togo.
Land-Use Changes and Greenhouse Gas Fluxes: Scientific Understanding and Contribution to Improving Methodologies for Greenhouse Gas Inventory in BENIN
IPCC NGGIP TSU Inventory Internship 94
• Methodologies for inventorying GHG from land use and land use changes have improved and are mastered as well as cross-cutting issues;
• Emissions and removals of GHG can accurately be calculated; • A report that presents the results of the research conducted for the LULUCF sector in Benin is prepared
and available. (d) Methodology: The conducting of the research will be concentrated on applying the Good Practice Guidance on LULUCF (GPG 2003) to Benin. Therefore, Benin-specific data in the LULUCF sector will be supplied and used. Given the similar circumstances between countries in west Africa in this sector in terms of climate conditions, vegetation and sols types, management practices, as well as inventories preparation and development conditions and inventories characteristics (use of default methodologies, emission factors, data for example), applying GPG on LULUCF to Benin can be considered as a representative case study. There will not be significant differences between choice of methods, emission/removal factors relevant to countries in the region and the findings of the study can be used at the regional level. Difficulties and issues encountered in this application will be raised and solutions proposed to overcome them will be presented. The research will show how the GPG on LULUCF could be applied to West Africa through study on Benin. (e) Capacity Building and Statement of expected long-term benefits of the proposed research: In general we lack human resources to conduct researches and works on climate change issues focusing on GHG emissions estimation. The research project will contribute to strengthen knowledge and experience in this field. The acquired knowledge and experience and obtained results will be used at regional level through: 1) participation in the regional project “Capacity building for improving the quality of GHG inventories” that will put a particular emphasis on LUCF sector 2) presentations at relevant scientific meetings 3) publications in scientific journals. The experience and knowledge gained will enable to improve national inventories quality for the Second National Communication and continue research in this field. They could also be taught in training programmes at University and Institutes. The conducting of the research will also contribute to develop research partnerships and enable me to be more involved in some international scientific processes.
Land-Use Changes and Greenhouse Gas Fluxes: Scientific Understanding and Contribution to Improving Methodologies for Greenhouse Gas Inventory in BENIN
IPCC NGGIP TSU Inventory Internship 95
Annex II: Some information generated by the desk-data collection
Title of Document Main information available Location in the document
Period for which data is available
Some data gaps noted
Some comments
The study on cartography, inventory and management of classified forest in northern area in Benin. Final report, December 2000. 245 pages.
1. Areas of land-use categories in the study areas. 2. Areas of cultivated land within the classified forests (forest land converted to cropland). 3. Afforestation: afforested areas and planted species in the study area. 4. Fires in forest plantations: causes, areas and species burned. 5. Daily consumption of fuelwood. 6. Annually cultivated land areas and main crops. 7. Forest types and definitions (crown density, diameter at breast height, tree height…). 8. Soil survey: classification and distribution. 9. Geographical location and climatic parameters of study area.
1. page 20-21 2. p.15 3. p. 16-17 &20 4. p. 18 & 181 5. p. 28 6. p.30 7. p. 20-21 &38-41 8. p. 46-47& 210-222 9. p.5-6
(1996, 1997, 1998, 1999).
1. Biomass growth rate 2. Above and below ground biomass 3. Soils C content
To collect data the study used aerial photography, land use and vegetation survey. Three classified forests located in the north of Benin were covered by the study. Data from other studies on similar land-use categories in Benin could be used to fill the data gap (please see the study mentioned below).
Village Based Management of Wooded Savanna for carbon sequestration. An estimate of the carbon sequestration impact of the project. UNDP/GEF Project: BEN/93/G31.February 1999. 37 pages.
1. Total area covered by the project, land-use categories and associated areas. 2. Estimate of total woody biomass stock and carbon stored in wood: above and below ground biomass, living and dead trees. Forest types and areas. Equations used to estimate biomass in live and dead trees. 3. Biomass growth rate (tdm/yr) 4. Organic carbon stored in soils in the forests reserves. 5. Estimate of total accumulation of carbon in the forest reserves. 6. Areas and species planted and estimates of stock of wood and organic carbon. Use of equation to estimate conversion factor. 7. Estimates of areas of forests cleared for agricultural expansion and loss of wood and soil carbon as a result of land-use change. 8. Estimate of 5 and 10 years accumulation of carbon in living biomass in forests and in soils.
The study collected information from existing sources supplemented by sites visits and a few field measurements. It covered three areas (of natural forests and planted trees) other than those covered by the above mentioned study, in the northern part of the country.
(1)Une étude de base sur la teneur en carbone organique de la biomasse ligneuse et des sols rencontrés dans les zones d’intervention du PGFTR. Octobre 2000. 145 pages.
1. List of forests covered, areas of forests, type of vegetation by agro ecological zone. 2. Types and areas of land-use categories covered by the investigation (see map). 3. Some parameters related to some land-use categories (forests, savannah and plantations): density, dry matter content, biomass expansion factor. 4. Conversion factors for estimating above and below ground biomass, carbon content in living
Detailed information is not provided on characteristics of different agro-ecological zones covered, for e.g. climatic conditions (temperature,
The objective of the study is to contribute to stabilize the C flux through better management of forests with the participation of local populations. The study used field surveys (measurements of height and stem of trees…), analysis in laboratories for determination of density of wood, soil organic C content.
Land-Use Changes and Greenhouse Gas Fluxes: Scientific Understanding and Contribution to Improving Methodologies for Greenhouse Gas Inventory in BENIN
IPCC NGGIP TSU Inventory Internship 96
Title of Document Main information available Location in the document
Period for which data is available
Some data gaps noted
Some comments
and dead trees for different land-use categories: volume, biomass expansion factor, density, root-to-shoot ratio, C fraction. Estimation of soils carbon content. 5. Estimation of dry weight and C content of biomass in trees. 6. Calculation of above and below ground biomass. 7. Estimation of wood volume per ha for different land-use categories. 8. Estimate of volume of above and below ground biomass for each forest. 9. Evaluation of soil C content for different land-use categories. 10. Estimation of annual production of above ground biomass.
rainfall, etc). A study mentioned below addressed this issue.
(2La gestion de l’information sur les sols et les eaux pour la sécurité alimentaire au Bénin. Rapport du Bénin, Avril 2003.. 68 pages.
1. Main causes of deforestation in Benin 2. Land-use categories in Benin: areas, location, species of trees encountered (map of land cover). 3. Some data on change in areas of some land-use categories. 4. Some statistics on consumption of synthetic fertilizers in Benin. 5. Some data on production of wood for some uses: fuel wood, charcoal… 6. Comparison of areas (dynamic) for different land covers between 1978 and 1998 and map of degradation of land cover.
.1992,2000, 2001: fertilizers .1978-1998 for land cover dynamic.
The study is conducted mainly in a view to establishing a data base for the management of food security. It covered all the national territory of Benin. Data are obtained from vegetation map of Benin developed by National Centre for Remote Sensing and Forest Cover Monitoring using satellite image Landsat and Spot XS recorded between 1990 and 1997 and aerial photography carried out in 1995 by the National Geographic Institute.
(3)Evolution des ressources forestieres, exploitation des terres et diagnostic des consommations et des approvisionnements des grands centres urbains en energies traditionnelles. Avril 1999. 104 pages.
1. Relation agriculture-forest: forests areas converted to agriculture 2. Relation pasture-forest: forests areas subject to pasture. 3. Causes of degradation of forest resources 4. Dynamic of wood lands: situation in 1980 and evolution of the situation between 1980 and 1995. 5. Consumption of wood for energy (fuel wood and wood charcoal): daily consumption and estimated annual consumption. Sources of wood for energy: natural forests and plantations. 6. Areas of plantations and species planted
Objectives of the study: Analyze: - Dynamic of (changes in) vegetation areas - Impact of agricultural activities on vegetation and sustainable production of wood for energy. - Qualitative and quantitative evaluation of vegetation cover and forest production. - Fuel wood consumption, in order to develop a management plan for production of wood for energy use.
(4)Etude de la filiere bois au Benin. Rapport final, aout 1997.
1. Areas of vegetation and other land cover in Benin (FAO, 1980) 2. Areas of plantations
1. p.40 2. p.42-43 3. p.44
1980, 1997 The study dealt with sustainable use of biomass energy.
Land-Use Changes and Greenhouse Gas Fluxes: Scientific Understanding and Contribution to Improving Methodologies for Greenhouse Gas Inventory in BENIN
IPCC NGGIP TSU Inventory Internship 97
Title of Document Main information available Location in the document
Period for which data is available
Some data gaps noted
Some comments
3. Estimation of repartition of lands according to land cover. 4. Estimation of volume of wood available in Benin by types of vegetation.
4. p.47
Forestry Outlook Study for Africa Subregional Report West Africa African Development Bank, European Commission, Food and Agriculture Organization of the United Nations, 2003. 66 pages.
1. Key statistics on West African forests in 2000: total forest area in 2000, forest plantation, natural forests, percentage forest area, forest area per capita, other wooded lands for the 15 countries in West Africa. 2. Annual forest cover change in West Africa, 1990-2000: cover loss, rate of change. 3. Main causes of deforestation 4. Current situation of management of natural forests and woodlands 5. Current situation of forest plantations in West Africa: total forest plantations areas, annual planting rate, plantation area by species group. 6. Trends in fuel wood consumption in West Africa by country. 7. Trends in industrial round wood production in West Africa 8. Overview of wood industry in West Africa. 9. Information on non-wood forest products 10. Extent of protected areas in West Africa in 1997. 11. Population changes in Africa and West Africa; size and density of population in West Africa. 12. GDP and per capita gross national income of West African Countries.
1) 2000 2) 1990-2000 5) 2000 4) 2000 6) 1980-2000 7) 1980-2000 10) 1997 11) 1980, 1990, 2000 and projection up to 2020.
The study provides an overview of the current situation and the likely changes in forestry up to 2020 in West Africa. A major concern of forestry in the subregion is the rapid rate of deforestation. West Africa’s natural forests have been largely deforested and degraded , particularly since the 1970s
Forests, Grasslands, and Drylands – Benin. Earth Trends Country Profiles, 2003. World Resources Institute (WRI). 7 pages.
1. Forest area and change: total forest area, natural forest area, plantations area, total dryland area, change in forest area (total, natural, plantations: 1990-2000), forest area by crown cover (2000), ecosystem areas by type 2. Some information on forests protected, wood production and trade. 3. Sources and definitions of terms.
1. p.1 2. p.2 3. p. 3-7
1990-2000
(5)La Revue et l’Amelioration des Données Relatives aux Produits Forestiers au Benin. Mahouna B. Tchiwanou, Octobre 2000. Projet GCP/INT/679/EC du Programme de partenariat Commission Europeenne – FAO (1998-2001). 47 pages.
1. Status of forests: land cover and land areas by vegetation type. 2. Dynamic of woodland areas between 1980 and 1997. 3. Repartition of land by land cover 4. Wood productivity by type of vegetation. 5. Estimate of wood volume available in Benin. 6. Volume of wood product imported and wood exported.
Literature search, focus group discussion, fields surveys.
Land-Use Changes and Greenhouse Gas Fluxes: Scientific Understanding and Contribution to Improving Methodologies for Greenhouse Gas Inventory in BENIN
IPCC NGGIP TSU Inventory Internship 98
Title of Document Main information available Location in the document
Period for which data is available
Some data gaps noted
Some comments
(6)Etude sur les Formations Forestieres Naturelles et sur les Plantations Forestieres au Benin, Lucien Akpado, 2000. Projet GCP/INT/679/EC du Programme de partenariat Commission Europeenne – FAO (1998-2002).
1. Statistics of vegetation map of Benin: area by type of land cover. 2. Forest plantations from 1985-1998. 3. Estimation of wood volume for some plantations areas (areas, average age of plantations, average growth rate). 4. Definitions and classification of different types of vegetation.
1. p.6 2. p.6-9 3. p.11-20 4. p.10-11
2) 1986-1998 3) 1985-1998
Literature search, focus group discussion, fields surveys.
Reconsidering the extent of deforestation in twentieth century West Africa. J. Fairhead and M. Leach. Unalysva – No. 192. From FAO website. 11 pages.
Suggested revisions to deforestation estimates since 1990.
p.8 This is an article suggesting that the extent of deforestation that has occurred in West Africa during the twentieth century is currently being exaggerated. It presents key findings of detailed research on vegetation change over the past century in Cote d’Ivoire, Sierra Leone, Liberia, Ghana, Togo and Benin
Understanding the Forest Resources Assessment 2000. Emily Matthews, WRI, March 2001. 12 pages. www.wri.org
1. Estimates of total forest at the regional and global levels according to Forest Resources Assessment 1990 and FRA 2000: total forest cover by region in 1990 and 2000. 2. Gross tropical deforestation in the 1980s and 1990s. 3. Gross deforestation: rates of change in Natural Forest Cover and Plantation area. 4. Net deforestation: rates of change in total forest cover.
1. p.2 2. p.6 3. p.10 4. p.11
1990-2000 The paper is prepared in response to the launch of the Forest Resources Assessment 2000. It comments on the methodology, summarizes the findings of FRA 2000, provides some guidelines for interpreting them, and asks what we really learned from the study. It concludes with some recommendations for improving global forest monitoring. The study deals only with FAO’s new estimates of forest area and deforestation rates.
Grassland Ecosystems a pilot analysis of global ecosystems. Robin P. White, Siobhan Murray, Mark Rohweder. WRI 2000. 53 pages.
1. Grassland extent and change 2. Carbon storage 3. Definition of grasslands 4. Top countries for percent of grassland area (Benin is included as 1st) 5. Some information on human modification of grassland cover: agriculture, settlements, fire, domestic livestock. 6. Change in grassland extent: historical change, recent change. 7. Grassland storage of carbon
The study provides an overview of ecosystem condition at the global and continental levels. Identifies information gaps that limit the current understanding of ecosystem condition.
Other information 1. Consumption on trade wood (quantities used in joinery and some other uses: sources of supply, species harvested …) and wood for energy. 2. Daily consumption of wood an wood charcoal 3. Rainfall in different agro-ecological areas in Benin.
Estimated for the period 1992-1997
Land-Use Changes and Greenhouse Gas Fluxes: Scientific Understanding and Contribution to Improving Methodologies for Greenhouse Gas Inventory in BENIN
IPCC NGGIP TSU Inventory Internship 99
Title of Document Main information available Location in the document
Period for which data is available
Some data gaps noted
Some comments
Some information from FAO’s website www.fao.org/forestry/site/18310/en/ben www.fao.org/forestry/site/7949/en
1. Information on closed forests: location, composition (tree species), height of different storeys, rainfall received. 2. Information on open forests: location, composition (tree species), height of different storeys, rainfall received. 3. Forests areas statistics: estimates of forest cover in 2000 and annual change rate between 1990 and 2000. 4. Most recent forest cover state (land area in 1996). Distribution of total forest area by ecological zone. 5. Reclassification of national forest categories: national categories of forests and other land uses are reclassified into the global classification system used by FAO. National forests cover definitions. 6. Land areas according to reclassification. 7. Plantation areas by species groups. 8. Data on land areas, forests areas, area change between 1990-2000 (total forest), and volume and above ground biomass (total forest). 10. Forest plantations 2000 (total plantation area, plantation area by species group). 11. Volume of biomass in forest.
1990-2000 1. Closed forests composed of broadleaved forests (closed semi-deciduous or deciduous forest, gallery forests). 2. Open forest: broadleaved (open forest and savannah woodland, tree savannah, periodically flooded open forests, stands altered by humans), shrubs. 3. Estimates are based on examination of forests inventory reports and are part of the results from the Global Forest Resources Assessment 2000 (the estimate has been made by linear extrapolation of the change between 1975 and 1996 up 2000)
Land-Use Changes and Greenhouse Gas Fluxes: Scientific Understanding and Contribution to Improving Methodologies for Greenhouse Gas Inventory in BENIN
IPCC NGGIP TSU Inventory Internship 100
Title of Document Main information available Location in the document
Period for which data is available
Some data gaps noted
Some comments
Forest Resources Assessment 2000 Terms and Definitions
Definitions of terms such as: land classifications (land cover, protected areas, land ownership, ecological zones), forest parameters (volume and biomass, fellings and removals, non-wood forest products and forest service), changes (forest cover changes, forest fire).
Measurements of Carbon Sinks. Keith Openshaw. Algas Meeting Manila, 5-9 June 1995.
1. Organic carbon in rain forest soil at varying depths. 2. Some information on sources of errors.
1. p. 7 2. further in the document (French part)
(7)Guide de Mesurage du Bois du Nouveau-Brunswick, Canada, 3e Edition. Direction de la Gestion des Forets, Ressources Naturelles et Energie. Février 2003. 82 pages.
1. Measurement of forestry products in cubic meter, mass. 2. Establishment of dendrometric and conversion factors tables.
Fire Situation in Benin in Africa Fire Special. International Forest Fire News, FAO/UN-ECE/ILO. N.25-July 2001.
Fire situation in ten (10) countries in Africa. http:www.ruf.uni-freiburg.de/fireglobe/iffn/country/country.htm
(8)Les sols Béninois: Classification dans la Base de Référence Mondiale. I. Youssouf & M. Lawani.
Different soils types encountered in Benin are presented: geographical distribution from South to North, soils description including physical and chemical characteristics, spatial distribution, agricultural value (main crops) as well as equivalence in the World Reference Base for Soil Resources.
Throughout the document.
This has been presented at the 14th Meeting of West and Central African Committee for Soils Correlation.
Land-use and farming systems in Benin. Attanda M. Igue, Anne Floquet and Karl Stahr. In Adapted Farming in West Africa: Issues, Potentials and Perspectives. F. Graef, P. Lawrence and M. von Oppen (Editors). 2000 Verlag Ulrich E. Grauer, Stuttgart, Germany, ISBN 3-86186-315-4. 12 pages.
Provides an overview of cropping and farming systems in the following agro-ecological areas of Benin: South, Centre part, Northern part. Presents different crops cultivated annual and perennial crops. Includes also some information on land-use and land cover as well as dynamic. Strategies developed by farmers to overcome decrease in land productivity are also addressed.
For land-use and land cover: 1978-1997. . Changes in cropping area in some regions: 1986-1996.
. Definitions used to identify land-use classes.
The development of agriculture is more and more intensive mainly with the inclusion of cotton which is an important cash crop in Benin. Data difficult to use for the development of emission/removal of GHG.
Note: Translation (1) A basis study on the organic carbon content of biomass in trees and soils in the areas of implementation of the programme PGFTR. (2) Management of information on soils and water resources for the food security of Benin. (3) Dynamic of forest resources, land use and diagnosis of supply and consumption of traditional energy in urban areas. (4) Study on different uses of wood in Benin. (5)Review and Improvement of data related to forest products in Benin. (6)Study on natural forests and forest plantations. (7)Guide of Measurement of Wood of New Brunswick, Canada, 3e Edition. Department of Management of Forests, Natural Resources and Energy. February 2003. (8) Soils in Benin: Classification in the World Reference Base for Soil Resources.
Land-Use Changes and Greenhouse Gas Fluxes: Scientific Understanding and Contribution to Improving Methodologies for Greenhouse Gas Inventory in BENIN
IPCC NGGIP TSU Inventory Internship 101
Annex III: Overview of statistical parameters for PDF Given the great number of samples collected on biomass and the sampling/measurement methods described in “Sampling procedure for estimating living biomass by PGFTR” in “Section 3.2.1 Forest Land”, the collected data would be relatively accurate and uncertainty low even though it was a partial inventory of the different land use categories. Thus, estimated parameters including diameter, height, stem volume, biomass expansion factor, wood density would lead to relatively accurate values on above and below ground biomass. The sampling considered also biomass stocks in dead trees. Furthermore, some experiments have been conducted for the determination of the SOC based on samples collected in twenty pedological profiles. All things considered, the statistical parameters specified below are based on the combination of available data, estimated parameters and expert judgment. Forest land 1) Forest land remaining forest land Change in C stocks in living biomass - Increase in C stocks Land area (ha): Considering data from FAO, WRI and the one from the national statistics as two data points, the following gives an idea of the uncertainty. Source and year Area (ha) FAO, WRI 2000 2650000 National statistics 2000 2256069
:μ Mean 2453035 σ : Standard deviation 98482.75 The mean and the 95% confidence interval based on the standard error of the mean is 2453035±139276 (139276 = 2*98482.75/21/2). But the data from national statistics has been used, in this case the uncertainty estimated as the 95% confidence interval is 2σ , i.e. 2256069±196966 or 2256069±8%.
When the uncertainty is known, σ could be deduced from the equation U=×1002μσ
, where U is the
uncertainty in %; for the time period considered, data on land area are as follows: [1985-1989]: μ = 2248314 [1990-1994]: μ = 1968830 [1995-1999]: μ = 1730490 σ as % of μ is 4%. Average increment in total biomass (tdm/ha/yr): Four data have been estimated: 1.18, 2.46, 0.79, 1.64. The range is [0.79-2.46] and μ = 1.63. The default value from the GPG LULUCF for annual aboveground biomass increment is 1.3 tdm/ha/yr for Africa, thus the total biomass increment is 1.95 tdm/ha/yr with R= 0.5 (root to shoot ratio). Considering these two data on total biomass increment as lower and upper limits, σ has been estimated at 0.08 and σ as % of μ is 4.5%. This value will be used for that parameter for all LUC. Carbon fraction of dry matter: CF (tC/tdm): 2%. μ = 0.5; σ as % of μ is 1%. - Decrease in C stocks Carbon loss due to commercial fellings (Lfellings), 000 tC:
Land-Use Changes and Greenhouse Gas Fluxes: Scientific Understanding and Contribution to Improving Methodologies for Greenhouse Gas Inventory in BENIN
IPCC NGGIP TSU Inventory Internship 102
Extracted volume, roundwood (000 m3) [1985-1989]: μ = 1246.2 [1990-1994]: μ = 1423.1 [1995-1999]: μ = 1563.5 These country-specific data are published by FAO. The data on commercial fellings are relatively accurate; uncertainty could vary slightly due to the extent of illegal logging. But illegal fellings and underreporting constitute minor part of C loss from forest; they should not affect overall estimates and associated uncertainties so much. An uncertainty of 5% is considered reasonable. σ as % of μ is 2.5%. Basic wood density (tdm/m3): 0.71. μ = 0.71. This parameter has been determined by experiments conducted jointly by two laboratories in Benin. The estimate would be more or less accurate even though information on uncertainty was not available. Based on expert judgment, the following range of uncertainty seems acceptable [2-6%]. It will be used the value 4%. σ as % of μ is 2%. Biomass expansion factor: BEF2. The following three data have been estimated from the forest inventory: 1.75; 1.48; 1.48. Considering the range [1.48-1.75], μ = 1.62; σ = 0.0675. σ as % of μ is 4%. fBL= 0.4. In Benin, the population has heavily relied on biomass used as energy source and thus it is expected that little amount of biomass from commercial fellings is left to decay on the ground in forest and other land use categories. In these conditions the use of the default value 0.4 seems inappropriate since it appears high for the country. A value between [0.09-0.11] with a mean of 0.10 would be acceptable. In this case, the σ as % of μ is 5%. Carbon loss due to fuelwood gathering (Lfuelwood), 000 tC Fuelwood gathering, 000 m3: uncertainty of same order of magnitude as commercial fellings i.e. 5%. The σ as % of μ is 2.5%. [1985-1989]: μ = 14399.55 [1990-1994]: μ = 15183.5 [1995-1999]: μ = 15800.65 The uncertainty associated with the other parameters: density, BEF2, CF is the same as above. Carbon loss due to fire (Lfire), 000 tC Forest areas affected by fire (ha): data are obtained from satellite (UNEP database on global burnt area), thus relatively accurate, uncertainty 5%. σ as % of μ is 2.5%. [1985-1989]: μ = 611511.20 [1990-1994]: μ = 596223.40 [1995-1999]: μ = 588579.50 Average biomass stocks, tdm/ha: The estimate of this parameter using data from the partial forest inventory gave the following results for the different LUC: 40.35, 37.92, 48.02, 86.82, 54.87, 70.34. The range is [37.92-86.82] and the estimated μ = 62.37. Considering the reasons mentioned in the introduction of this annex, and the comparison made under Average increment in total biomass, the σ as % of μ is estimated at 4.5%. The aboveground biomass is 67% of total biomass: μ = 41.79 and σ as % of μ is 4.5%. Change in carbon stocks in DOM, 000 tC - Change in carbon stocks in dead wood, 000 tC Transfer into the dead wood pool (Binto), 000 tC The spreadsheet will calculate the transfer from commercial fellings and fire using parameters specified under C loss due to commercial fellings and C loss due to fires.
Land-Use Changes and Greenhouse Gas Fluxes: Scientific Understanding and Contribution to Improving Methodologies for Greenhouse Gas Inventory in BENIN
IPCC NGGIP TSU Inventory Internship 103
Transfer rate into dead wood, natural mortality tdm/ha/yr The following data 2.1, 6.6, 3.1, 3.1, 3.5, 5.3 have been estimated for the different LUC. The associated range is [2.1-6.6] and μ = 4.35. The estimates have been derived from the partial forest inventory; the uncertainty of 10%. Decay rate constant: k=0.19 ±0.026 year-1. σ = 0.013 and the σ as % of μ is 7%. - Change in carbon stocks in litter, 000 tC: uncertainty based on expert judgment 20%. The σ as % of μ is 10%. Change in carbon stocks in soils, 000 tC Soil organic carbon accumulation (SOC), tC/ha/yr The following data: 0.23, 0.55, 0.15, 0.37 have been estimated; the associated range is [0.15-0.55] and μ = 0.35. The assumptions used to estimate the SOC accumulation have been based on carbon accumulation in living biomass. It is expected that the uncertainties would be of the same order of magnitude; the σ as % of μ is 5%. Non-CO2 Greenhouse gas emissions The length of the interval of the emission ratios in the Table 3A 1.15 p.3.185 GPG LULUCF has been considered as 4σ . EF CH4 emissions from biomass burning, t/tC burned: μ = 0.016; σ as % of μ is 13%. EF CO emissions from biomass burning, t/tC burned: μ = 0.14; σ as % of μ is 17%. EF N2O emissions from biomass burning, t/tC burned: μ = 0.00011; σ as % of μ is 14%. EF NOx emissions from biomass burning, t/tC burned: μ = 0.004; σ as % of μ is 11%. Fraction of biomass burned onsite, offsite, left on the ground, oxidized: σ as % of μ is 5%. 2) Land converted to forest land Change in carbon stocks in living biomass, 000 tC - Increase in carbon stocks (biomass increment), 000 tC Land area: uncertainty ±8%. The σ as % of μ is 4%. [1985-1989]: μ = 569834 [1990-1994]: μ = 552665 [1995-1999]: μ = 525579 Average biomass increment in plantation (tdm/ha/yr): μ = 4.52; the σ as % of μ is 4.5%. Average biomass increment in natural regeneration (tdm/ha/yr): μ = 7.95; the σ as % of μ is 4.5%. - Decrease in carbon stocks (biomass loss), 000 tC Carbon loss due to commercial fellings (Lfellings), 000 tC: not included in this subcategory. Carbon loss due to fuelwood gathering (Lfuelwood), 000 tC The distribution identified under the section forest land remaining forest land will be used. Considering the C loss due to fuelwood gathering as output in the model, σ as % of μ is estimated at 5%. Carbon loss due to fire (Lfire), 000 t The distribution identified under the section forest land remaining forest land will be used.
Land-Use Changes and Greenhouse Gas Fluxes: Scientific Understanding and Contribution to Improving Methodologies for Greenhouse Gas Inventory in BENIN
IPCC NGGIP TSU Inventory Internship 104
Considering the C loss due to fire as output in the model, σ as % of μ is estimated at 5%. Change in carbon stocks in DOM, 000 tC Transfer into the dead wood is due to natural mortality of trees in plantation and in natural regeneration. Natural regeneration: the distribution identified under forest land remaining forest land will be used; σ as % of μ is 5%. Plantation: The transfer rate into the dead wood pool is between [1-1.33] tdm/ha/yr. μ =1.2, σ = 0.0825; the σ as % of μ is 7%. Change in carbon stocks in soils, 000 tC Soil organic carbon accumulation (SOC), tC/ha/yr The combined uncertainties associated with SOCREF forest (26%) and SOCREF grassland (14%) gives 16%. Then, μ = 2.1 and the σ as % of μ is 8%. Non-CO2 Greenhouse gas emissions The distribution considered under forest land remaining forest land will be used. Cropland 1) Cropland remaining cropland Change in carbon stocks in living biomass, 000 tC Increase in carbon stocks in perennial crops, 000 tC Area of perennial woody crops (ha): The area has been estimated by difference between the total cropland and the annual cropland. The latter has been obtained from Agricultural census. The uncertainty is estimated 5%. [1985-1989]: μ = 1999545 [1990-1994]: μ = 2257214 [1995-1999]: μ = 1657005 Average increment in total biomass in perennial woody crops (tdm/ha/yr) The range of data is [1.03-1.79], μ = 1.41; the σ as % of μ is 4.5%. Decrease in carbon stocks (biomass loss), 000 tC Carbon loss due to commercial fellings (Lfellings), 000 tC: not occurring. Carbon loss due to fuelwood gathering (Lfuelwood), 000 tC The distribution identified under the forest land section will be used. σ as % of μ is 5%. Carbon loss due to fire (Lfire), 000 t Areas affected by fires (ha): Data are from satellite, relatively accurate, uncertainty 5%. [1985-1989]: μ = 4417.24 [1990-1994]: μ = 4396.97 [1995-1999]: μ = 3229.61 The total biomass range is [10.82-23.5] tdm/ha. Data are: 12.65, 10.82, 18.37, 15.5, and 23.5. μ =17.16; σ as % of μ is 4.5%.
Land-Use Changes and Greenhouse Gas Fluxes: Scientific Understanding and Contribution to Improving Methodologies for Greenhouse Gas Inventory in BENIN
IPCC NGGIP TSU Inventory Internship 105
Average aboveground biomass stocks, tdm/ha: μ = 11.5; σ as % of μ is 4.5%. Change in carbon stocks in DOM, 000 tC Change in carbon stocks in dead wood, 000 tC Transfer rate into dead wood, natural mortality tdm/ha/yr Five data including 2.2, 2.3, 1.5, 1.4, 1.8 ranging between [1.4-2.3] have been estimated; the μ = 1.85. Considering the reasons mentioned above in Section Forest land, the σ as % of μ is 5%. Change in carbon stocks in soils, 000 tC The default uncertainty associated with land area is 10-15%. It will be used 10%. The uncertainty associated with SOCREF(cropland), and stock change factors FLU, FMG, FI have been combined to estimate uncertainty related to SOC0 and SOC(0-T) and then associated with the annual per ha change in C stocks. Change in carbon stocks in cotton land, 000 tC Area of cotton land (ha): the σ as % of μ is 5%. [1985-1989]: μ = 89951 [1990-1994]: μ = 186840 [1995-1999]: μ = 536481 Annual per ha change in carbon stocks in cotton land (tC/ha/yr): The combined uncertainty gives 10%. μ = -0.34; the σ as % of μ is 5%. Change in carbon stocks in other croplands, 000 tC Area of other crops (ha): the σ as % of μ is 5%. [1985-1989]: μ = 1054297 [1990-1994]: μ = 1120067 [1995-1999]: μ = 1361032 Annual per ha change in carbon stocks in other cropland (tC/ha/yr): The combined uncertainty gives 10%. μ = -0.38; the σ as % of μ is 5%. 2) Land converted to cropland Change in carbon stocks in living biomass, 000 tC Change in carbon stocks during conversion of forest to cropland, 000 tC Area of forest land converted to cropland: default uncertainty 10-15%. It will be used 10%. The σ as % of μ is 5%. [1985-1989]: μ = 36414 [1990-1994]: μ = 140809 [1995-1999]: μ = 548276 Carbon before conversion (tC/ha): the combined uncertainty (tdm/ha and CF) gives 9%: μ = 31.2; the σ as % of μ is 4.5%. Carbon after conversion (tC/ha): the combined uncertainty (tdm/ha and CF) gives 9%. μ = 8.58; the σ as % of μ is 4.5%. Change in carbon stocks during conversion of grassland to cropland, 000 tC Area of grassland converted to cropland: default uncertainty 10-15%. It will be used 10%. The σ as % of μ is 5%.
Land-Use Changes and Greenhouse Gas Fluxes: Scientific Understanding and Contribution to Improving Methodologies for Greenhouse Gas Inventory in BENIN
IPCC NGGIP TSU Inventory Internship 106
[1985-1989]: μ = 743682 [1990-1994]: μ = 721274 [1995-1999]: μ = 685925 Carbon before conversion (tC/ha): the combined uncertainty gives 9%. μ = 12.85; the σ as % of μ is 4.5%. Carbon after conversion (tC/ha): the combined uncertainty gives 9% μ = 8.58; the σ as % of μ is 4.5%. Change in carbon stocks in DOM, 000 tC: not considered. Change in carbon stocks in soils, 000 tC Change in C stocks in soils, conversion forest to cropland, 000 tC Annual per ha change in C stocks, conversion forest to cropland, tC/ha/yr: uncertainties associated with SOCREF, and stock change factors FLU, FMG, FI have been combined to estimate uncertainty related to SOC0 and SOC(0-T) and then uncertainty associated with the annual per ha change in C stocks. Combined uncertainties gave 25%. Then, μ = -2.2; the σ as % of μ is 12%. Change in C stocks in soils, conversion grassland to cropland, 000 tC Annual per ha change in C stocks, conversion grassland to cropland, tC/ha/yr: combined uncertainties gave 20%. Then, μ = -1.5; the σ as % of μ is 10%. Non-CO2 Greenhouse gas emissions N2O emissions from mineral soils EF N2O emissions from conversion of forest and grassland to cropland: μ = 0.0125 kg N2O-N/kg N; σ as % of μ is 17% C:N ratio, kg C/kg N: μ =15; σ as % of μ is 17% Non-CO2 emissions from biomass burning See under forest land remaining forest land. Also: Fraction of biomass burned onsite: 0.36; expert judgment σ as % of μ is 5% Fraction of biomass burned offsite: 0.54; as σ as % of μ is 5% Fraction of biomass that oxidized: 0.1; as σ as % of μ is 5% Grassland 1) Grassland remaining grassland Change in carbon stocks in living biomass, 000 tC Land area (ha): default uncertainty 10-15% (GPG LULUCF). 10% will be used. The σ as % of μ is 5%. [1985-1989]: μ = 3476953 [1990-1994]: μ = 3372192 [1995-1999]: μ = 3206921 Increase in carbon stocks (biomass increment), 000 tC Average increment in total biomass (tdm/ha/yr)
Land-Use Changes and Greenhouse Gas Fluxes: Scientific Understanding and Contribution to Improving Methodologies for Greenhouse Gas Inventory in BENIN
IPCC NGGIP TSU Inventory Internship 107
The data range is [0.24-1.17], the mean and the standard deviation are: μ = 0.71; σ as % of μ is estimated at 4.5%. Decrease in carbon stocks (biomass loss), 000 tC Carbon loss due to commercial fellings (Lfellings), 000 tC: already included in forest land. Carbon loss due to fuelwood gathering (Lfuelwood), 000 tC The PDF identified under forest land remaining forest land has been considered to identify the standard deviation. σ as % of μ is 5%. [1985-1989]: μ = -3312.47 [1990-1994]: μ = -3492.81 [1995-1999]: μ = -3634.78 Carbon loss due to fire (Lfire), 000 t Areas affected by fires (ha): uncertainty 5%. μ = 34800; σ as % of μ is 2.5%. Average total biomass stocks, tdm/ha. Data are: 23.57, 23.35, 26, 18, 33.4, 19.9. The range of data is [18-33.4]. μ = 25.7; σ as % of μ is 4.5%. The aboveground biomass μ = 17.2; the σ as % of μ is 4.5%. Fraction biomass left to decay: See under forest land remaining forest land. Change in carbon stocks in DOM, 000 tC Transfer rate into dead wood, natural mortality tdm/ha/yr: the range of data is [1.33-3.92]. μ = 2.63; σ as % of μ is 5%. Decay rate constant, year-1 See under forest Change in carbon stocks in soils, 000 tC Annual per ha change in C stocks, tC/ha/yr Uncertainties associated with SOCREF, and stock change factors FLU, FMG, FI have been combined to estimate uncertainty related to SOC0 and SOC(0-T) , then uncertainty associated with the annual per ha change in C stocks has been estimated. Combined uncertainties gave 14%, then μ = -0.14; the σ as % of μ is 7%. Non-CO2 Greenhouse gas emissions See under forest land remaining forest land. 2) Land converted to grassland Change in carbon stocks in living biomass, 000 tC Change in carbon stocks during conversion of forest to grassland, 000 tC Area of forest land converted to grassland (ha): default uncertainty range: 10-15 % (GPG LULUCF). The σ as % of μ is 5%. [1985-1989]: μ = 620969 [1990-1994]: μ = 708509 [1995-1999]: μ = 242729 Carbon before conversion (tC/ha): the combined uncertainty gives 9%: μ = 31.2; σ as % of μ is 4.5%.
Land-Use Changes and Greenhouse Gas Fluxes: Scientific Understanding and Contribution to Improving Methodologies for Greenhouse Gas Inventory in BENIN
IPCC NGGIP TSU Inventory Internship 108
Carbon after conversion (tC/ha): the combined uncertainty gives 9%: μ =12.85; σ as % of μ is 4.5%. Change in carbon stocks during conversion of cropland to grassland, 000 tC Area of cropland converted to grassland (ha). 10-15 % (GPG LULUCF). The σ as % of μ is 5%. [1985-1989]: μ =585678 [1990-1994]: μ =373356 [1995-1999]: μ =786114 Carbon before conversion (tC/ha): the combined uncertainty is 9%. μ =6.79; σ as % of μ is 4.5%. Carbon after conversion (tC/ha): the combined uncertainty is 9%. μ =12.85; σ as % of μ is 4.5%. Change in carbon stocks in DOM, 000 tC: not considered. Change in carbon stocks in soils, 000 tC Change in C stocks in soils, conversion forest to grassland, 000 tC Annual per ha change in C stocks, conversion forest to grassland, tC/ha/yr μ = -0.2; σ as % of μ is 5%. Change in C stocks in soils, conversion cropland to grassland, 000 tC Annual per ha change in C stocks, conversion cropland to grassland, tC/ha/yr μ = 1.59; σ as % of μ is 5%. Non-CO2 Greenhouse gas emissions See section forest remaining forest land Also: Fraction of biomass burned onsite: 0.36; expert judgment σ as % of μ is 5% Fraction of biomass burned offsite: 0.54; expert judgment σ as % of μ is 5% Fraction of biomass that oxidized: 0.1; expert judgment σ as % of μ is 5%.
Land-Use Changes and Greenhouse Gas Fluxes: Scientific Understanding and Contribution to Improving Methodologies for Greenhouse Gas Inventory in BENIN
IPCC NGGIP TSU Inventory Internship 109
Annex IV: Spreadsheet for @RISK: example for forest land remaining forest land
Time period [1985-1989]
[1990-1994]
[1995-1999]
Forest land remaining forest land
μ σ as % of μ
μ σ as % of μ
μ σ
as % of μ
CO2 -13413.22 -19522.74 -24761.69
CH4 -126.10 -123.53 -122.38
CO -1103.41 -1080.85 -1070.83
N2O -0.87 -0.85 -0.84 Emissions(-)/removals(+) of GHGs, (000 t or Gg)
NOx -31.53 -30.88 -30.60
Land area (ha) 2248314 4% 2248314 1968830 4% 1968830 1730490 4% 1730490
Change in carbon stocks in living biomass, 000 tC -14760.34 -15338.87 -15864.88
N2O emissions from drainage and rewetting of forest
0 0 0
CH4 emissions from biomass burning, 000 t
-126.10 -123.53 -122.38
EF CH4 emissions from biomass burning, t/tC burned
0.016 13% 0.016 0.016 13% 0.016 0.016 13% 0.016
CO emissions from biomass burning, 000 t -1103.41 -1080.85 -1070.83 EF CO emissions from biomass burning, t/tC burned 0.14 17% 0.14 0.14 17% 0.14 0.14 17% 0.14 N2O emissions from biomass burning, 000 t
-0.87 -0.85 -0.84
EF N2O emissions from biomass burning, t/tC burned
NOx emissions from biomass burning, 000 t -31.53 -30.88 -30.60
EF NOx emissions from biomass burning, t/tC burned 0.004 11% 0.004 0.004 11% 0.004 0.004 11% 0.004
Land-Use Changes and Greenhouse Gas Fluxes: Scientific Understanding and Contribution to Improving Methodologies for Greenhouse Gas Inventory in BENIN
IPCC NGGIP TSU Inventory Internship 111
Annex V: Simulation results: example for CO2 emissions from forest land remaining forest land
Summary Information
Workbook Name Spreadsheets_for_@Risk_
Sabin_exos_uncert.xls
Number of Simulations 1
Number of Iterations 10000
Number of Inputs 126
Number of Outputs 79
Sampling Type Monte Carlo
Simulation Start Time 11/30/2005 10:08
Simulation Stop Time 11/30/2005 10:09
Simulation Duration 00:00:57
Random Seed 28879631
Summary Statistics
Statistic Value %tile Value Minimum -34848.91 5% -29186.41
Maximum -14949.48 10% -28230.43
Mean -24754.29 15% -27548.86
Std Dev 2666.29 20% -26976.27
Variance 7109091.233 25% -26547.53
Skewness -0.026771877 30% -26141.09
Kurtosis 2.938471936 35% -25784.19
Median -24750.73 40% -25439.45
Mode -27871.02 45% -25110.53
Left X -29803.69 50% -24750.73
Left P 3% 55% -24371.21
Right X -19362.13 60% -24023.14
Right P 98% 65% -23690.45
Diff X 10441.56 70% -23333.53
Diff P 95% 75% -22925.90
#Errors 0 80% -22518.08
Filter Min 85% -21996.89 Filter Max 90% -21355.46
#Filtered 0 95% -20430.13
Regression Sensitivity for CO2 /[1995-1999]/K5
Std b Coefficients
Land area (ha) / [1990-199.../H11-.001 Area of cotton land (ha) /.../H37 .001 Fraction biomass left to d.../E24 .01
Extracted volume roundwood.../K20-.026 Soil organic carbon accumu.../E43 .041 Average increment in total.../E15 .088 Transfer rate into dead wo.../E37 .145
Carbon fraction of dry mat.../E16-.152 Areas affected by fire, ha.../K28-.16
Land area (ha) / [1995-199.../K11 .228 Basic wood density / [1985.../E21-.271 Decay rate constant, year-.../E38-.286
Average aboveground biomas.../E29-.29 Volume of fuelwood gatheri.../K26-.308
Change in carbon stocks in.../K40 .5 Biomass expansion factor /.../E22-.535
-1 -0.75 -0.5 -0.25 0 0.25 0.5 0.75 1
Distribution for CO2 / [1995-1999]/K5
Values in Thousands
0.000
0.200
0.400
0.600
0.800
1.000
Mean=-24754.29
-36 -30.5 -25 -19.5 -14-36 -30.5 -25 -19.5 -14
3% 95% 2% -29.8037 -19.3621
Mean=-24754.29
Distribution for CO2 / [1995-1999]/K5
Val
ues
in 1
0 ̂-4
Values in Thousands
0.000
0.200
0.400
0.600
0.800
1.0001.200
1.4001.600
Mean=-24754.29
-36 -30.5 -25 -19.5 -14-36 -30.5 -25 -19.5 -14
3% 95% 2% -29.8037 -19.3621
Mean=-24754.29
Land-Use Changes and Greenhouse Gas Fluxes: Scientific Understanding and Contribution to Improving Methodologies for Greenhouse Gas Inventory in BENIN
IPCC NGGIP TSU Inventory Internship 112
Sensitivity Rank Name Regr Corr #1 Biomass expansion factor / [1985-1989] / $E$22 -0.535 -0.520 #2 Change in carbon stocks in litter, 000 tC / [1995-1999] / $K$40 0.500 0.473 #3 Volume of fuelwood gathering, 000 m3 / [1995-1999] / $K$26 -0.308 -0.295 #4 Average aboveground biomass stocks, tdm/ha / [1985-1989] / $E$29 -0.290 -0.291 #5 Decay rate constant, year-1 / [1985-1989] / $E$38 -0.286 -0.270 #6 Basic wood density / [1985-1989] / $E$21 -0.271 -0.275 #7 Land area (ha) / [1995-1999] / $K$11 0.228 0.207 #8 Areas affected by fire, ha / [1995-1999] / $K$28 -0.160 -0.133 #9 Carbon fraction of dry matter (tC/tdm) / [1985-1989] / $E$16 -0.152 -0.141 #10 Transfer rate into dead wood, natural mortality tdm/ha/yr / [1985-1989] / $E$37 0.145 0.139 #11 Average increment in total biomass (tdm/ha/yr) / [1985-1989] / $E$15 0.088 0.078 #12 Soil organic carbon accumulation (SOC), tC/ha/yr / [1985-1989] / $E$43 0.041 0.056 #13 Extracted volume roundwood, 000 m3 / [1995-1999] / $K$20 -0.026 -0.027 #14 Fraction biomass left to decay / [1985-1989] / $E$24 0.010 0.015 #15 Area of cotton land (ha) / [1990-1994] / $H$37 0.001 0.004 #16 Land area (ha) / [1990-1994] / $H$11 -0.001 0.009