FINAL Landbank Responsiveness to Changing Organic Material Volumes and Soil Heavy Metal Limits Report 4 for Defra Project SP0569 02 November 2010 Submitted to: Judith Stuart Soils Policy Defra Room 3C, Nobel House 17 Smith Square London SW1P 3JR Prepared by Fiona Nicholson, Steven Humphries and Brian Chambers ADAS Gleadthorpe, Meden Vale, Mansfield Notts NG20 9PF
Transcript
FINAL
Landbank Responsiveness to Changing Organic Material Volumes and Soil Heavy Metal Limits
Report 4 for Defra Project SP0569
02 November 2010 Submitted to: Judith Stuart Soils Policy Defra Room 3C, Nobel House 17 Smith Square London SW1P 3JR
Prepared by Fiona Nicholson, Steven Humphries and Brian Chambers ADAS Gleadthorpe, Meden Vale, Mansfield Notts NG20 9PF
i
EXECUTIVE SUMMARY
The objective of this study was to run a range of scenarios, using ALOWANCE-PLUS, to determine the responsiveness of the agricultural landbank to any changes in the maximum permissible soil heavy metal concentrations; and in addition, to spatially disaggregate the temporal capacity for each of the scenarios. The “Soil Strategy for England” (Defra, 2009) aimed to prevent long-term soil pollution with heavy metals, in particular, as a result of spreading organic and inorganic materials to land. As part of this, the existing limits for heavy metals in soils where organic materials (e.g. biosolids, compost, digestate, paper crumble etc.) are applied to agricultural land were being reviewed. Any reduction in the maximum permissible soil heavy metal limits could restrict the area of agricultural land to which organic materials can be applied. Therefore this project was undertaken to inform discussions on the impact of any potential changes in soil heavy metal limit values on the landbank available for recycling organic materials. To determine the length of time for which the agricultural landbank would continue to be available to receive organic materials (i.e. the soil temporal capacity), the functionality of the ALOWANCE-PLUS software was enhanced to estimate the temporal capacity (in years) at a range of soil heavy metal limit values and organic material concentrations. ALOWANCE-PLUS estimated the current agricultural landbank for the addition of ‘new’ sources of organic materials (i.e. over and above the quantities currently recycled to land) at c.5.1 million hectares (ha). Using 2020 projected organic materials volumes, it was estimated that the landbank would only be reduced by a small amount (c.0.1 million ha) to c.5.0 million ha, with little change in geographical distribution. If the maximum permissible soil Zn concentration was reduced to 100 mg/kg (compared with presently 200 mg Zn/kg in the pH range 5-7), it was estimated that the landbank would decrease to c.3.5 million ha, with a more rapid decrease once the maximum permissible concentration was lower than 150 mg/kg. In particular, there would be restrictions on the landbank available for spreading organic materials in north-east and north-west England, the Midlands, south Wales and south-west England. However, the landbank was much less sensitive to decreases in maximum permissible concentrations for the other heavy metal scenarios tested (i.e. Cu, Ni and Pb), because there were only relatively small areas where ‘background’ soil metal concentrations were above the maximum scenario levels tested. If maximum permissible soil heavy metal concentrations were reduced to c.60% of the current values for Zn, Cu, Ni and Pb the landbank would be reduced to c.4.3 million ha (c.15% decrease), with most of the reduction due to the lower soil Zn limit value.
ii
After 1000 years of annual organic material applications at 2020 volumes and current soil metal limit values, the landbank was estimated to reduce from c.5.0 million ha to c.4.7 million ha, indicating little overall additional long-term pressure on the landbank. Also, it was estimated that it would take less than 200 years of annual organic material additions (at 2020 volumes) to reach the current soil Zn concentration limit (200 mg/kg) in some parts of north-east and north-west England, the Midlands and south Wales (equivalent to an additional c.0.05 million ha excluded from the landbank). However, if the soil metal limits were reduced to 75% or 60% of the current values, ,the area of landbank excluded after 200 years of organic material additions would be considerably larger (an additional c.0.3 and c.0.6 million ha, respectively)..
3. LANDBANK RESPONSIVENESS TO CHANGING ORGANIC MATERIAL VOLUMES ...................................................................................................... 6
4. LANDBANK RESPONSIVENESS TO CHANGING SOIL HEAVY METAL LIMITS .......................................................................................................... 10
4.1 Landbank response to changing Zn limits.................................................................... 10
4.2 Landbank response to changing Cu limits ................................................................... 14
4.3 Landbank response to changing Ni limits .................................................................... 16
4.4 Landbank response to changing Pb limits ................................................................... 17
4.5 Landbank response to changing Cd limits ................................................................... 19
4.6 Landbank response to changing limits for all metals.................................................. 19
APPENDIX 2. THE ALOWANCE SOFTWARE TOOL ................................. 38
1
1. OBJECTIVES
The objectives of this study were: 1. To run a range of scenarios using ALOWANCE-PLUS at different soil
heavy metal limits (at increments along the scale) between the current and a range of possible lower maximum permissible soil metal concentrations.
2. To determine the responsiveness of the agricultural landbank to changing maximum permissible soil concentrations for different metals.
3. To spatially disaggregate the temporal capacity for each of these scenarios and determine the local impacts of changing the maximum permitted soil metal concentrations.
2. INTRODUCTION
One of the key objectives of the “Soil Strategy for England” (Defra, 2009) was the prevention of long-term soil pollution with heavy metals (including zinc–Zn, copper–Cu, nickel–Ni, lead–Pb, cadmium–Cd, chromium–Cr and mercury–Hg), in particular, as a result of spreading organic and inorganic materials to land. As part of the implementation of the Soil Strategy, the existing limits (thresholds) for heavy metals in soils where organic materials are applied were being reviewed. This report follows on from work presented in Report 3 for Defra project SP0569, which developed a quantitative inventory of heavy metal inputs to agricultural soils to determine the scale and relative importance of different sources of metals, either deposited from the atmosphere or applied to agricultural land.
Legislative measures controlling heavy metal inputs to agricultural soils are limited to those applied to biosolids (sewage sludge) applications. The Sludge (Use in Agriculture) Regulations 1989 (SI, 1989), as amended in 1990 (SI, 1990), include soil heavy metal limit values where sewage sludge is applied to agricultural land. This legislation is supported by a Code of Practice for Agricultural Use of Sewage Sludge (DoE, 1996), containing some refinements to the soil metal limit values, primarily relating to soil Zn concentrations. However, the soil heavy metal limit values from DoE (1996) are used or referred to in a number of other regimes where organic materials are applied to agricultural land in order to prevent the over application and/or accumulation of metal salts, including the Quality Protocol for Compost (WRAP/EA, 2008), the Quality Protocol for Digestate (WRAP/EA, 2009), the Code of Practice for Landspreading Paper Mill Sludges (Paper Federation of Great Britain, 1998) and the application of other ‘waste’ materials under exemption from the Environmental Permitting Regulations (SI, 2007). Any reduction in the maximum permissible soil heavy metal limits could restrict the area of agricultural land to which these materials (e.g. biosolids, compost, digestate, paper crumble etc.) can be applied. Therefore this project was undertaken to inform discussions on the impact of any potential changes in soil heavy metal limit values on the landbank available for recycling organic materials.
2
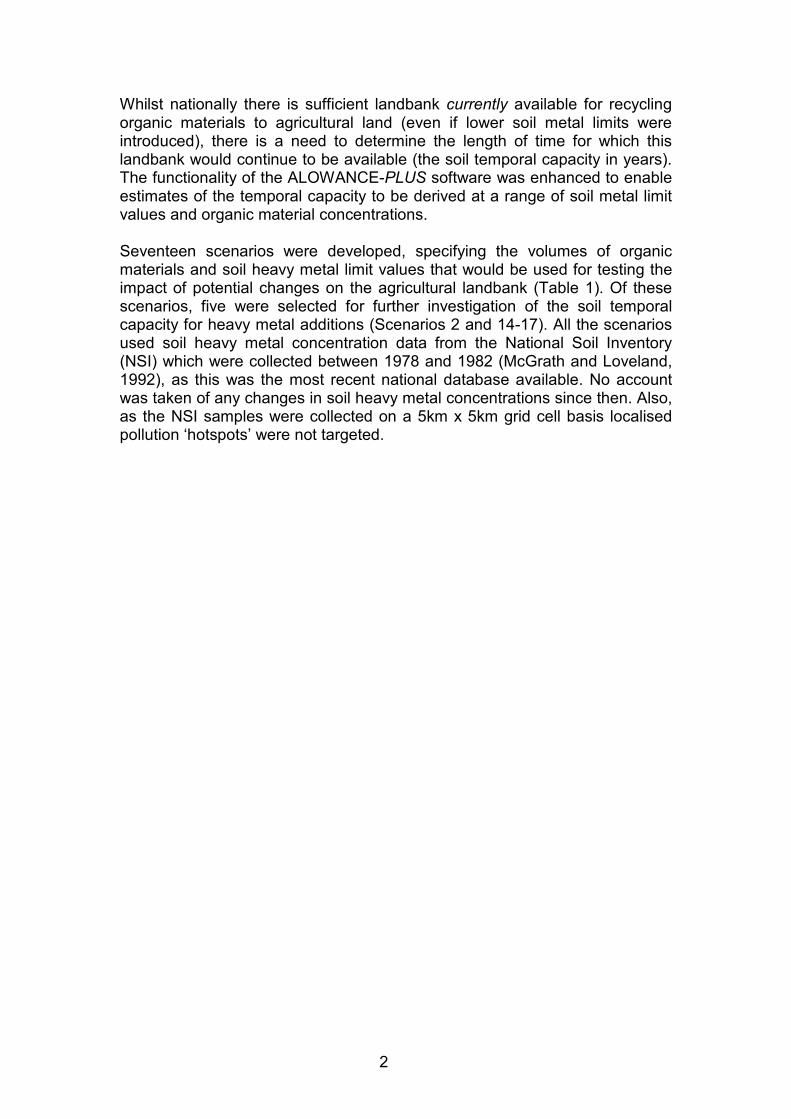
Whilst nationally there is sufficient landbank currently available for recycling organic materials to agricultural land (even if lower soil metal limits were introduced), there is a need to determine the length of time for which this landbank would continue to be available (the soil temporal capacity in years). The functionality of the ALOWANCE-PLUS software was enhanced to enable estimates of the temporal capacity to be derived at a range of soil metal limit values and organic material concentrations. Seventeen scenarios were developed, specifying the volumes of organic materials and soil heavy metal limit values that would be used for testing the impact of potential changes on the agricultural landbank (Table 1). Of these scenarios, five were selected for further investigation of the soil temporal capacity for heavy metal additions (Scenarios 2 and 14-17). All the scenarios used soil heavy metal concentration data from the National Soil Inventory (NSI) which were collected between 1978 and 1982 (McGrath and Loveland, 1992), as this was the most recent national database available. No account was taken of any changes in soil heavy metal concentrations since then. Also, as the NSI samples were collected on a 5km x 5km grid cell basis localised pollution ‘hotspots’ were not targeted.
3
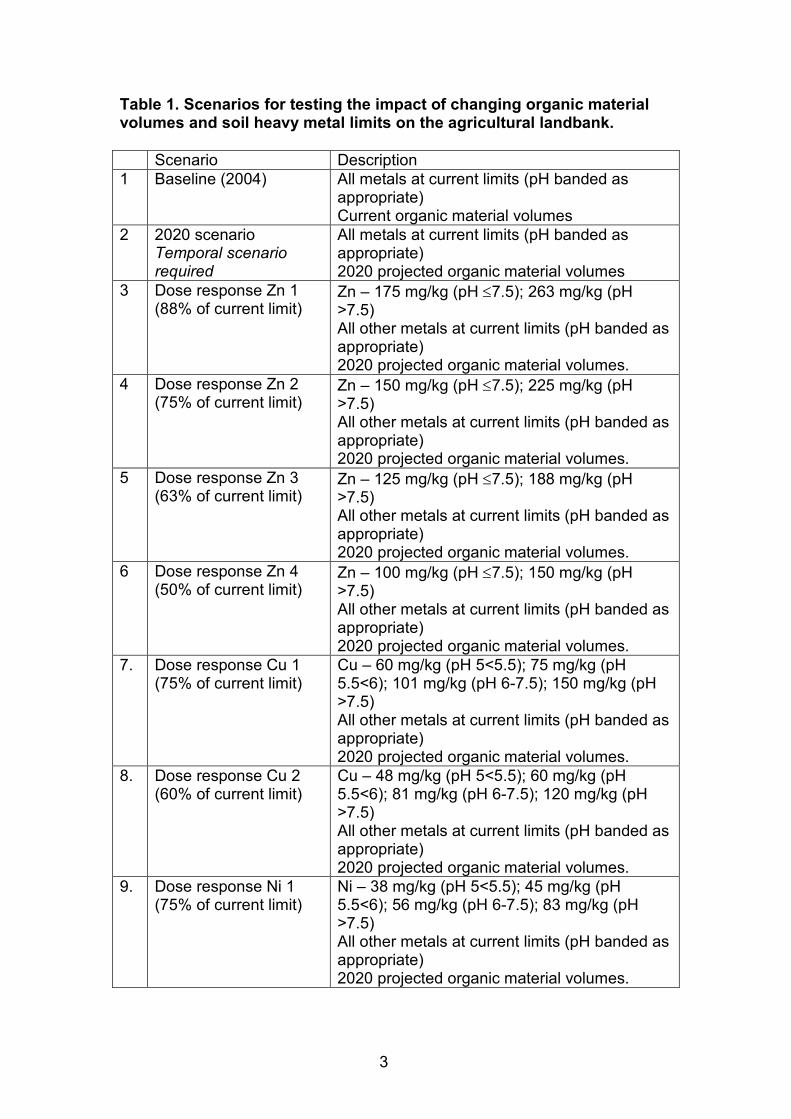
Table 1. Scenarios for testing the impact of changing organic material volumes and soil heavy metal limits on the agricultural landbank.
Scenario Description
1 Baseline (2004) All metals at current limits (pH banded as appropriate) Current organic material volumes
2 2020 scenario Temporal scenario required
All metals at current limits (pH banded as appropriate) 2020 projected organic material volumes
3 Dose response Zn 1 (88% of current limit)
Zn – 175 mg/kg (pH ≤7.5); 263 mg/kg (pH >7.5) All other metals at current limits (pH banded as appropriate) 2020 projected organic material volumes.
4 Dose response Zn 2 (75% of current limit)
Zn – 150 mg/kg (pH ≤7.5); 225 mg/kg (pH >7.5) All other metals at current limits (pH banded as appropriate) 2020 projected organic material volumes.
5 Dose response Zn 3 (63% of current limit)
Zn – 125 mg/kg (pH ≤7.5); 188 mg/kg (pH >7.5) All other metals at current limits (pH banded as appropriate) 2020 projected organic material volumes.
6 Dose response Zn 4 (50% of current limit)
Zn – 100 mg/kg (pH ≤7.5); 150 mg/kg (pH >7.5) All other metals at current limits (pH banded as appropriate) 2020 projected organic material volumes.
7. Dose response Cu 1 (75% of current limit)
Cu – 60 mg/kg (pH 5<5.5); 75 mg/kg (pH 5.5<6); 101 mg/kg (pH 6-7.5); 150 mg/kg (pH >7.5) All other metals at current limits (pH banded as appropriate) 2020 projected organic material volumes.
8. Dose response Cu 2 (60% of current limit)
Cu – 48 mg/kg (pH 5<5.5); 60 mg/kg (pH 5.5<6); 81 mg/kg (pH 6-7.5); 120 mg/kg (pH >7.5) All other metals at current limits (pH banded as appropriate) 2020 projected organic material volumes.
9. Dose response Ni 1 (75% of current limit)
Ni – 38 mg/kg (pH 5<5.5); 45 mg/kg (pH 5.5<6); 56 mg/kg (pH 6-7.5); 83 mg/kg (pH >7.5) All other metals at current limits (pH banded as appropriate) 2020 projected organic material volumes.
4
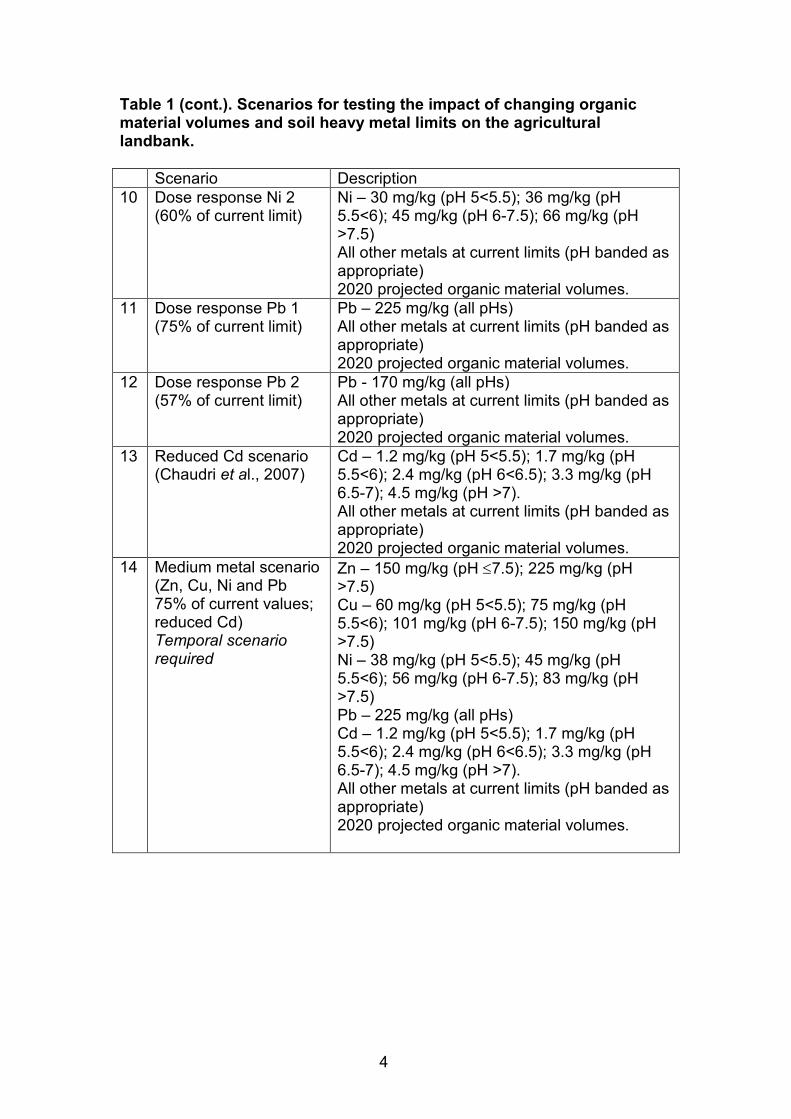
Table 1 (cont.). Scenarios for testing the impact of changing organic material volumes and soil heavy metal limits on the agricultural landbank.
Scenario Description
10 Dose response Ni 2 (60% of current limit)
Ni – 30 mg/kg (pH 5<5.5); 36 mg/kg (pH 5.5<6); 45 mg/kg (pH 6-7.5); 66 mg/kg (pH >7.5) All other metals at current limits (pH banded as appropriate) 2020 projected organic material volumes.
11 Dose response Pb 1 (75% of current limit)
Pb – 225 mg/kg (all pHs) All other metals at current limits (pH banded as appropriate) 2020 projected organic material volumes.
12 Dose response Pb 2 (57% of current limit)
Pb - 170 mg/kg (all pHs) All other metals at current limits (pH banded as appropriate) 2020 projected organic material volumes.
13 Reduced Cd scenario (Chaudri et al., 2007)
Cd – 1.2 mg/kg (pH 5<5.5); 1.7 mg/kg (pH 5.5<6); 2.4 mg/kg (pH 6<6.5); 3.3 mg/kg (pH 6.5-7); 4.5 mg/kg (pH >7). All other metals at current limits (pH banded as appropriate) 2020 projected organic material volumes.
14 Medium metal scenario (Zn, Cu, Ni and Pb 75% of current values; reduced Cd) Temporal scenario required
Zn – 150 mg/kg (pH ≤7.5); 225 mg/kg (pH >7.5) Cu – 60 mg/kg (pH 5<5.5); 75 mg/kg (pH 5.5<6); 101 mg/kg (pH 6-7.5); 150 mg/kg (pH >7.5) Ni – 38 mg/kg (pH 5<5.5); 45 mg/kg (pH 5.5<6); 56 mg/kg (pH 6-7.5); 83 mg/kg (pH >7.5) Pb – 225 mg/kg (all pHs) Cd – 1.2 mg/kg (pH 5<5.5); 1.7 mg/kg (pH 5.5<6); 2.4 mg/kg (pH 6<6.5); 3.3 mg/kg (pH 6.5-7); 4.5 mg/kg (pH >7). All other metals at current limits (pH banded as appropriate) 2020 projected organic material volumes.
5
Table 1 (cont.). Scenarios for testing the impact of changing organic material volumes and soil heavy metal limits on the agricultural landbank.
Scenario Description
15 Low metal scenario (Zn, Cu, Ni and Pb c.60% of current values; reduced Cd) Temporal scenario required
Zn – 125 mg/kg (pH ≤7.5); 188 mg/kg (pH >7.5) Cu – 48 mg/kg (pH 5<5.5); 60 mg/kg (pH 5.5<6); 81 mg/kg (pH 6-7.5); 120 mg/kg (pH >7.5) Ni – 30 mg/kg (pH 5<5.5); 36 mg/kg (pH 5.5<6); 45 mg/kg (pH 6-7.5); 66 mg/kg (pH >7.5) Pb – 170 mg/kg (all pHs). Cd – 1.2 mg/kg (pH 5<5.5); 1.7 mg/kg (pH 5.5<6); 2.4 mg/kg (pH 6<6.5); 3.3 mg/kg (pH 6.5-7); 4.5 mg/kg (pH >7). All other metals at current limits (pH banded as appropriate) 2020 projected organic material volumes.
16 Digestate 1 Temporal scenario only
Assume 400 mg Zn/kg dry matter in digestate. All metals at current limits (pH banded as appropriate) 2020 projected organic material volumes
17 Digestate 2 Temporal scenario only
Assume 200 mg Zn/kg dry matter in digestate. All metals at current limits (pH banded as appropriate) 2020 projected organic material volumes
6
3. LANDBANK RESPONSIVENESS TO CHANGING ORGANIC MATERIAL VOLUMES
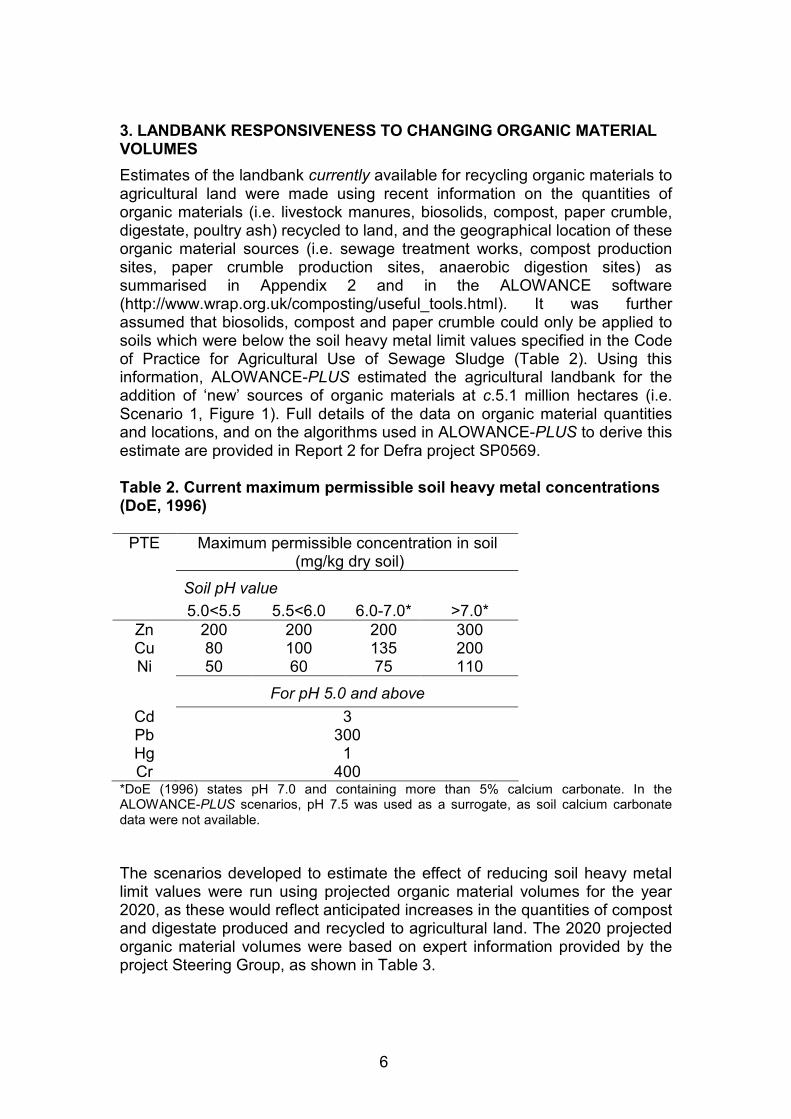
Estimates of the landbank currently available for recycling organic materials to agricultural land were made using recent information on the quantities of organic materials (i.e. livestock manures, biosolids, compost, paper crumble, digestate, poultry ash) recycled to land, and the geographical location of these organic material sources (i.e. sewage treatment works, compost production sites, paper crumble production sites, anaerobic digestion sites) as summarised in Appendix 2 and in the ALOWANCE software (http://www.wrap.org.uk/composting/useful_tools.html). It was further assumed that biosolids, compost and paper crumble could only be applied to soils which were below the soil heavy metal limit values specified in the Code of Practice for Agricultural Use of Sewage Sludge (Table 2). Using this information, ALOWANCE-PLUS estimated the agricultural landbank for the addition of ‘new’ sources of organic materials at c.5.1 million hectares (i.e. Scenario 1, Figure 1). Full details of the data on organic material quantities and locations, and on the algorithms used in ALOWANCE-PLUS to derive this estimate are provided in Report 2 for Defra project SP0569. Table 2. Current maximum permissible soil heavy metal concentrations (DoE, 1996)
PTE Maximum permissible concentration in soil (mg/kg dry soil)
Soil pH value
5.0<5.5 5.5<6.0 6.0-7.0* >7.0*
Zn 200 200 200 300 Cu 80 100 135 200 Ni 50 60 75 110
For pH 5.0 and above
Cd 3 Pb 300 Hg 1 Cr 400
*DoE (1996) states pH 7.0 and containing more than 5% calcium carbonate. In the ALOWANCE-PLUS scenarios, pH 7.5 was used as a surrogate, as soil calcium carbonate data were not available.
The scenarios developed to estimate the effect of reducing soil heavy metal limit values were run using projected organic material volumes for the year 2020, as these would reflect anticipated increases in the quantities of compost and digestate produced and recycled to agricultural land. The 2020 projected organic material volumes were based on expert information provided by the project Steering Group, as shown in Table 3.
7
Figure 1. Scenario 1: The current agricultural landbank available for recycling ‘new’ sources of organic materials (ha)
Note: Figure 1 (and other maps showing the landbank area i.e. Figures 2, 4-7, 16-17, 19) shows red cells around the coastline, which are an artefact of the GIS data processing methodology. Grid squares adjacent to the coast often consist of only a small proportion of ‘land’, with the remainder of the grid square being ‘sea’. Thus only a small area of land is potentially available for recycling organic materials and the grid square is coloured red..
8
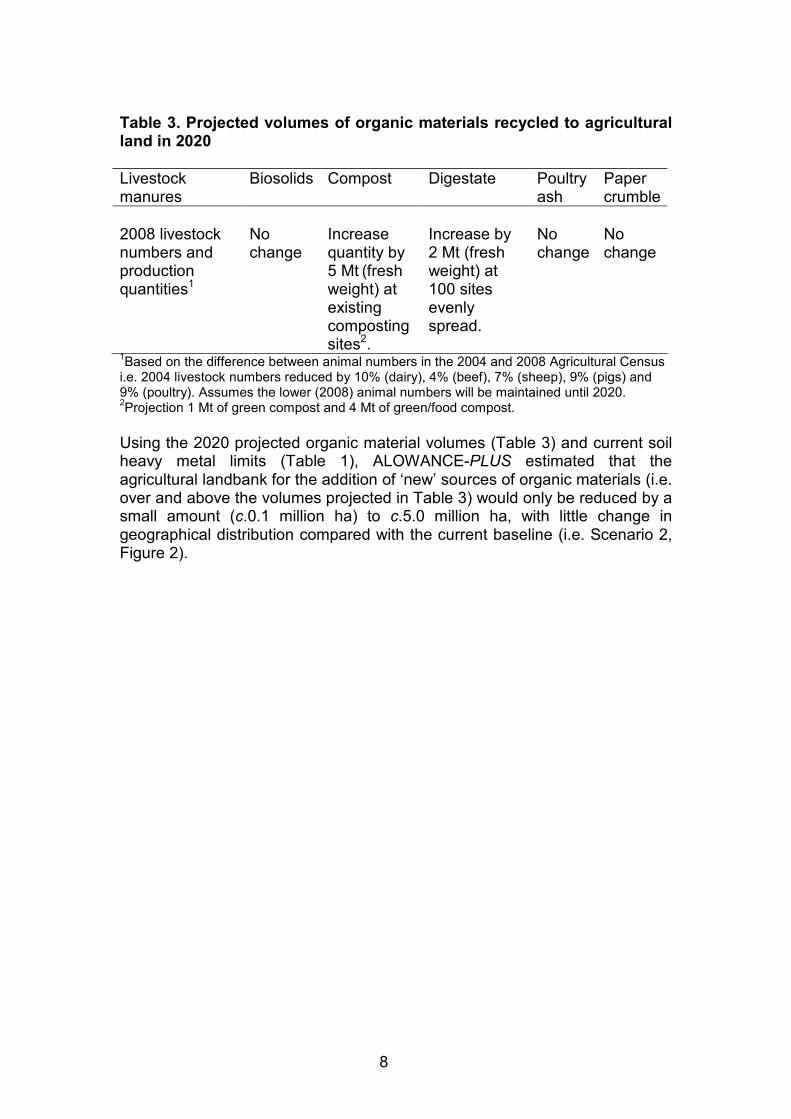
Table 3. Projected volumes of organic materials recycled to agricultural land in 2020
Livestock manures
Biosolids Compost Digestate Poultry ash
Paper crumble
2008 livestock numbers and production quantities1
No change
Increase quantity by 5 Mt (fresh weight) at
existing composting sites2.
Increase by 2 Mt (fresh weight) at 100 sites evenly spread.
No change
No change
1Based on the difference between animal numbers in the 2004 and 2008 Agricultural Census i.e. 2004 livestock numbers reduced by 10% (dairy), 4% (beef), 7% (sheep), 9% (pigs) and 9% (poultry). Assumes the lower (2008) animal numbers will be maintained until 2020. 2Projection 1 Mt of green compost and 4 Mt of green/food compost.
Using the 2020 projected organic material volumes (Table 3) and current soil heavy metal limits (Table 1), ALOWANCE-PLUS estimated that the agricultural landbank for the addition of ‘new’ sources of organic materials (i.e. over and above the volumes projected in Table 3) would only be reduced by a small amount (c.0.1 million ha) to c.5.0 million ha, with little change in geographical distribution compared with the current baseline (i.e. Scenario 2, Figure 2).
9
Figure 2. Scenario 2: The agricultural landbank available for recycling ‘new’ sources of organic materials using 2020 projected organic material volumes (ha)
10
4. LANDBANK RESPONSIVENESS TO CHANGING SOIL HEAVY METAL LIMITS
4.1 Landbank response to changing Zn limits
Scenarios 3-6 (Table 1) were designed to test the impact of reducing the maximum permissible soil Zn concentration in increments from the current
values (Scenario 2; 200 mg/kg at soil pH ≤7.5 and 300 mg/kg at soil pH >7.5)
to 50% of the current values (Scenario 6; 100 mg/kg at soil pH ≤7.5 and 150 mg/kg at soil pH >7.5), whilst leaving the limit values for all other metals unchanged. Table 4 and Figure 3 show that the landbank decreased from c.5.0 million ha
where the maximum permissible soil Zn concentration at pH ≤7.5 was 200 mg/kg (i.e the current maximum concentration) to c.3.5 million ha where the
maximum permissible soil Zn concentration at pH ≤7.5 was reduced to 100 mg/kg (i.e. 50% of the current maximum concentration), equivalent to a c.30% decrease in the available landbank. The decrease in the landbank was more
rapid once the maximum permissible soil Zn concentration at pH ≤7.5 was below 150 mg/kg (i.e. 75% of the current maximum concentration). Table 4. Agricultural landbank responsiveness to changing maximum permissible soil Zn concentrations
Maximum permissible soil Zn concentration at soil
pH ≤7.5 (mg/kg)
% of current maximum
permissible soil Zn concentration
at soil pH ≤7.5
Agricultural landbank area
(mha)
Decrease in landbank
compared with current maximum permissible Zn concentration (%)
Figure 3. Agricultural landbank responsiveness to changing maximum permissible soil Zn concentrations.
3.0
3.5
4.0
4.5
5.0
5.5
40 50 60 70 80 90 100
Soil Zn limit (% of current limit value)
Landbank (million ha)
q
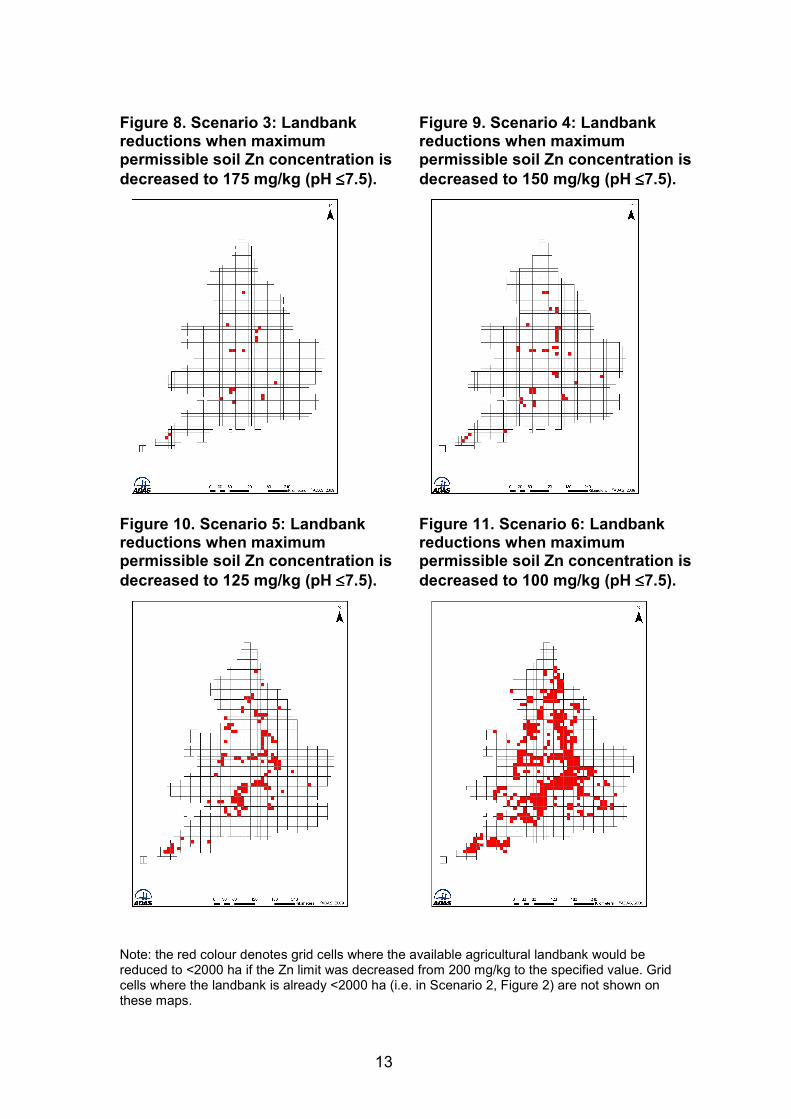
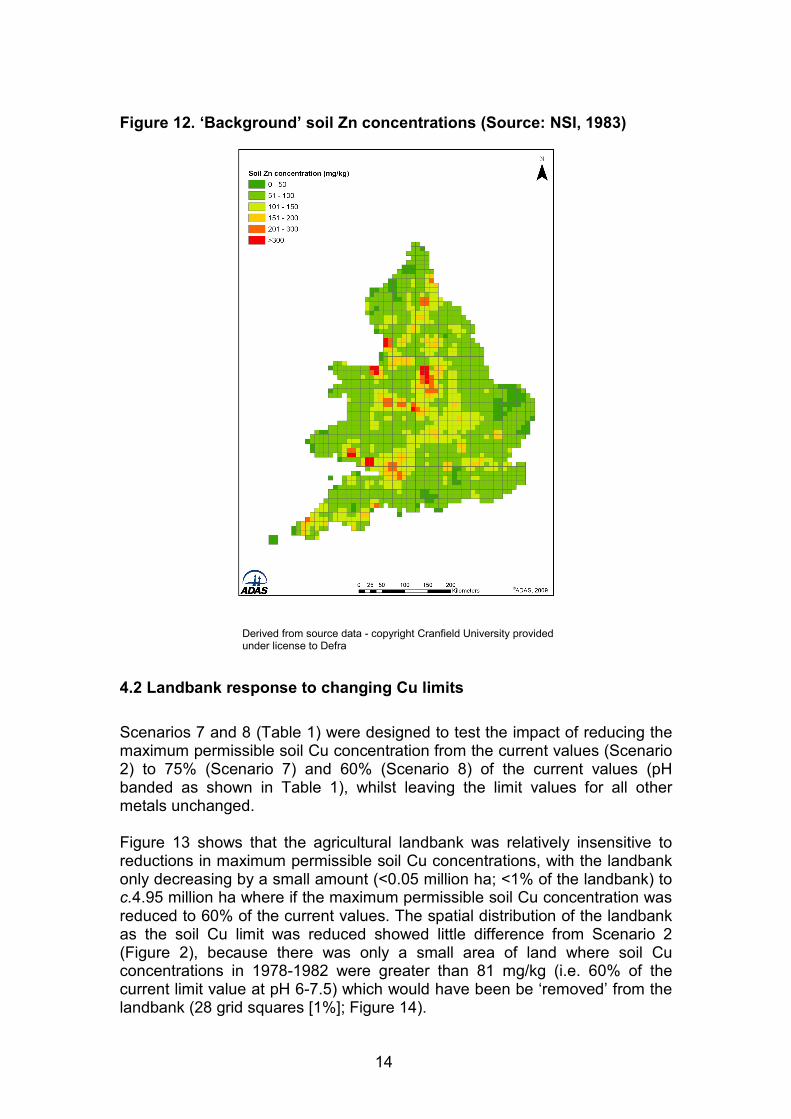
The spatial distribution of the agricultural landbank as the soil Zn limit was reduced showed that there would be greater restrictions on spreading organic materials in north-east and north-west England, the Midlands, south Wales and south-west England, particularly if the soil Zn limit was reduced below 150 mg/kg (Figures 4-7). The areas where the landbank was reduced to <2000 ha as the soil Zn limit decreased are shown in Figures 8-11. These corresponded to those grid squares where the ‘background’ soil Zn concentration in 1978-1982 was greater than 100 mg/kg (541 grid squares [28%]; Figure 12).
Soil Zn limit (% of current limit values)
12
Figure 4. Scenario 3: Landbank (ha) at a maximum permissible soil Zn concentration of 175 mg/kg (pH
≤≤≤≤7.5).
Figure 5. Scenario 4: Landbank (ha) at a maximum permissible soil Zn concentration of 150 mg/kg (pH
≤≤≤≤7.5).
Figure 6. Scenario 5: Landbank (ha) at a maximum permissible soil Zn concentration of 125 mg/kg (pH
≤≤≤≤7.5).
Figure 7. Scenario 6: Landbank (ha) at a maximum permissible soil Zn concentration of 100 mg/kg (pH
≤≤≤≤7.5).
13
Figure 8. Scenario 3: Landbank reductions when maximum permissible soil Zn concentration is
decreased to 175 mg/kg (pH ≤≤≤≤7.5).
Figure 9. Scenario 4: Landbank reductions when maximum permissible soil Zn concentration is
decreased to 150 mg/kg (pH ≤≤≤≤7.5).
Figure 10. Scenario 5: Landbank reductions when maximum permissible soil Zn concentration is
decreased to 125 mg/kg (pH ≤≤≤≤7.5).
Figure 11. Scenario 6: Landbank reductions when maximum permissible soil Zn concentration is
decreased to 100 mg/kg (pH ≤≤≤≤7.5).
Note: the red colour denotes grid cells where the available agricultural landbank would be reduced to <2000 ha if the Zn limit was decreased from 200 mg/kg to the specified value. Grid cells where the landbank is already <2000 ha (i.e. in Scenario 2, Figure 2) are not shown on these maps.
Derived from source data - copyright Cranfield University provided under license to Defra
4.2 Landbank response to changing Cu limits
Scenarios 7 and 8 (Table 1) were designed to test the impact of reducing the maximum permissible soil Cu concentration from the current values (Scenario 2) to 75% (Scenario 7) and 60% (Scenario 8) of the current values (pH banded as shown in Table 1), whilst leaving the limit values for all other metals unchanged. Figure 13 shows that the agricultural landbank was relatively insensitive to reductions in maximum permissible soil Cu concentrations, with the landbank only decreasing by a small amount (<0.05 million ha; <1% of the landbank) to c.4.95 million ha where if the maximum permissible soil Cu concentration was reduced to 60% of the current values. The spatial distribution of the landbank as the soil Cu limit was reduced showed little difference from Scenario 2 (Figure 2), because there was only a small area of land where soil Cu concentrations in 1978-1982 were greater than 81 mg/kg (i.e. 60% of the current limit value at pH 6-7.5) which would have been be ‘removed’ from the landbank (28 grid squares [1%]; Figure 14).
15
Figure 13. Agricultural landbank responsiveness to changing maximum permissible soil Cu concentrations.
4.70
4.75
4.80
4.85
4.90
4.95
5.00
50 60 70 80 90 100
Soil Cu limit (% of current limit value)
Landbank (million ha)
Figure 14. ‘Background’ soil Cu concentrations (Source: NSI, 1983)
Derived from source data - copyright Cranfield University provided under license to Defra.
Soil Cu limit (% of current limit values)
16
4.3 Landbank response to changing Ni limits
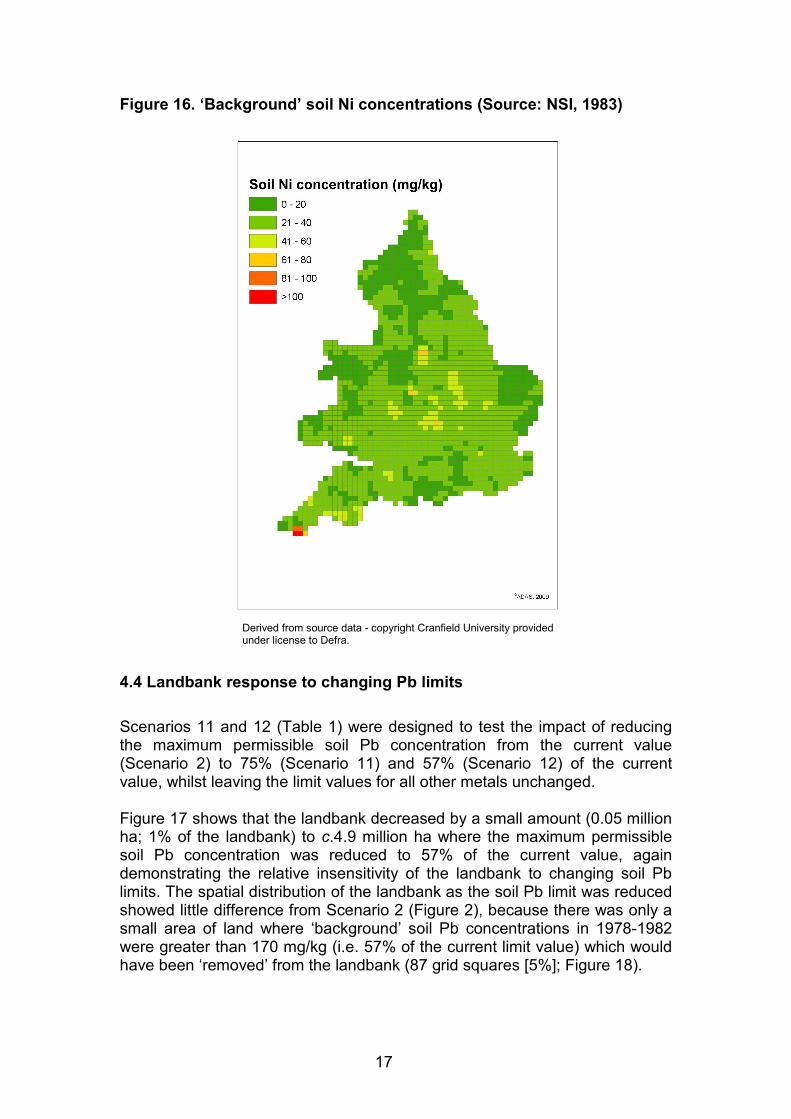
Scenarios 9 and 10 (Table 1) were designed to test the impact of reducing the maximum permissible soil Ni concentration from the current values (Scenario 2) to 75% (Scenario 9) and 60% (Scenario 10) of the current values (pH banded as shown in Table 1), whilst leaving the limit values for all other metals unchanged. As for Cu, the landbank was relatively insensitive to reductions in maximum permissible soil Ni concentrations, with the landbank only decreasing by a small amount (c.0.1 million ha; 2% of the landbank) to c.4.9 million ha where the maximum permissible soil Ni concentration was reduced to 60% of the current values (Figure 15). The spatial distribution of the landbank as the soil Ni limit was reduced showed little difference from Scenario 2 (Figure 2), because there was only a small area of land where ‘background’ soil Ni concentrations in 1978-1982 were greater than 45 mg/kg (i.e. 60% of the current limit value at pH 6-7.5) which would be ‘removed’ from the landbank (44 grid squares [2%]; Figure 16). Figure 15. Agricultural landbank responsiveness to changing maximum permissible soil Ni concentrations.
4.70
4.75
4.80
4.85
4.90
4.95
5.00
50 60 70 80 90 100
Soil Ni limit (% of current limit value)
Landbank (million hectares)
Soil Ni limit (% of current limit values)
17
Figure 16. ‘Background’ soil Ni concentrations (Source: NSI, 1983)
Derived from source data - copyright Cranfield University provided under license to Defra.
4.4 Landbank response to changing Pb limits
Scenarios 11 and 12 (Table 1) were designed to test the impact of reducing the maximum permissible soil Pb concentration from the current value (Scenario 2) to 75% (Scenario 11) and 57% (Scenario 12) of the current value, whilst leaving the limit values for all other metals unchanged. Figure 17 shows that the landbank decreased by a small amount (0.05 million ha; 1% of the landbank) to c.4.9 million ha where the maximum permissible soil Pb concentration was reduced to 57% of the current value, again demonstrating the relative insensitivity of the landbank to changing soil Pb limits. The spatial distribution of the landbank as the soil Pb limit was reduced showed little difference from Scenario 2 (Figure 2), because there was only a small area of land where ‘background’ soil Pb concentrations in 1978-1982 were greater than 170 mg/kg (i.e. 57% of the current limit value) which would have been ‘removed’ from the landbank (87 grid squares [5%]; Figure 18).
18
Figure 17. Agricultural landbank responsiveness to changing maximum permissible soil Pb concentrations.
Derived from source data - copyright Cranfield University provided under license to Defra.
Soil Pb limit (% of current limit values)
19
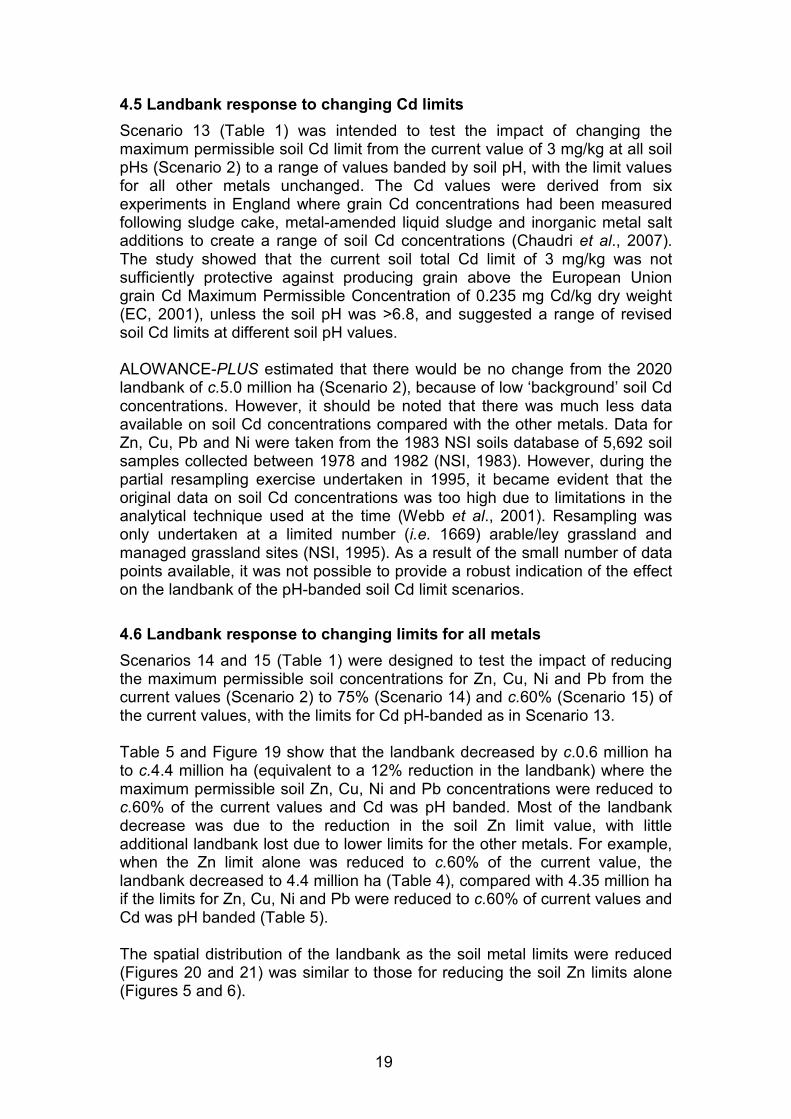
4.5 Landbank response to changing Cd limits
Scenario 13 (Table 1) was intended to test the impact of changing the maximum permissible soil Cd limit from the current value of 3 mg/kg at all soil pHs (Scenario 2) to a range of values banded by soil pH, with the limit values for all other metals unchanged. The Cd values were derived from six experiments in England where grain Cd concentrations had been measured following sludge cake, metal-amended liquid sludge and inorganic metal salt additions to create a range of soil Cd concentrations (Chaudri et al., 2007). The study showed that the current soil total Cd limit of 3 mg/kg was not sufficiently protective against producing grain above the European Union grain Cd Maximum Permissible Concentration of 0.235 mg Cd/kg dry weight (EC, 2001), unless the soil pH was >6.8, and suggested a range of revised soil Cd limits at different soil pH values. ALOWANCE-PLUS estimated that there would be no change from the 2020 landbank of c.5.0 million ha (Scenario 2), because of low ‘background’ soil Cd concentrations. However, it should be noted that there was much less data available on soil Cd concentrations compared with the other metals. Data for Zn, Cu, Pb and Ni were taken from the 1983 NSI soils database of 5,692 soil samples collected between 1978 and 1982 (NSI, 1983). However, during the partial resampling exercise undertaken in 1995, it became evident that the original data on soil Cd concentrations was too high due to limitations in the analytical technique used at the time (Webb et al., 2001). Resampling was only undertaken at a limited number (i.e. 1669) arable/ley grassland and managed grassland sites (NSI, 1995). As a result of the small number of data points available, it was not possible to provide a robust indication of the effect on the landbank of the pH-banded soil Cd limit scenarios.
4.6 Landbank response to changing limits for all metals
Scenarios 14 and 15 (Table 1) were designed to test the impact of reducing the maximum permissible soil concentrations for Zn, Cu, Ni and Pb from the current values (Scenario 2) to 75% (Scenario 14) and c.60% (Scenario 15) of the current values, with the limits for Cd pH-banded as in Scenario 13. Table 5 and Figure 19 show that the landbank decreased by c.0.6 million ha to c.4.4 million ha (equivalent to a 12% reduction in the landbank) where the maximum permissible soil Zn, Cu, Ni and Pb concentrations were reduced to c.60% of the current values and Cd was pH banded. Most of the landbank decrease was due to the reduction in the soil Zn limit value, with little additional landbank lost due to lower limits for the other metals. For example, when the Zn limit alone was reduced to c.60% of the current value, the landbank decreased to 4.4 million ha (Table 4), compared with 4.35 million ha if the limits for Zn, Cu, Ni and Pb were reduced to c.60% of current values and Cd was pH banded (Table 5). The spatial distribution of the landbank as the soil metal limits were reduced (Figures 20 and 21) was similar to those for reducing the soil Zn limits alone (Figures 5 and 6).
20
Table 5. Agricultural landbank responsiveness to changing maximum permissible soil concentrations for all metals
Maximum permissible soil metal concentration (mg/kg)
Zn (pH
≤7.5)
Cu (pH 6-7.5)
Ni (pH 6-7.5)
Pb (all pHs)
Cd % of current maximum permissible
soil concentration
Agricultural landbank area (mha)
Decrease in landbank
compared with current maximum permissible concentrations
(%)
200
135 75 300
3
100 5.0
-
150
101 56 225
pH banded*
75 4.75
4
125 81
45 170
pH banded*
c.60 4.35
12
*See Table 1 for details of pH banded soil Cd limits (Scenarios 14 and 15)
Figure 19. Agricultural landbank responsiveness to changing maximum permissible soil concentrations for all metals.
3.0
3.5
4.0
4.5
5.0
5.5
50 60 70 80 90 100
Soil metal limit (% of current limit value)
Landbank (million hectares)
21
Figure 20. Scenario 14: Agricultural landbank (ha) at maximum permissible soil metal concentrations of 75% of current values.
Figure 21. Scenario 15: Agricultural landbank (ha) at maximum permissible soil metal concentrations of 60% of current values.
22
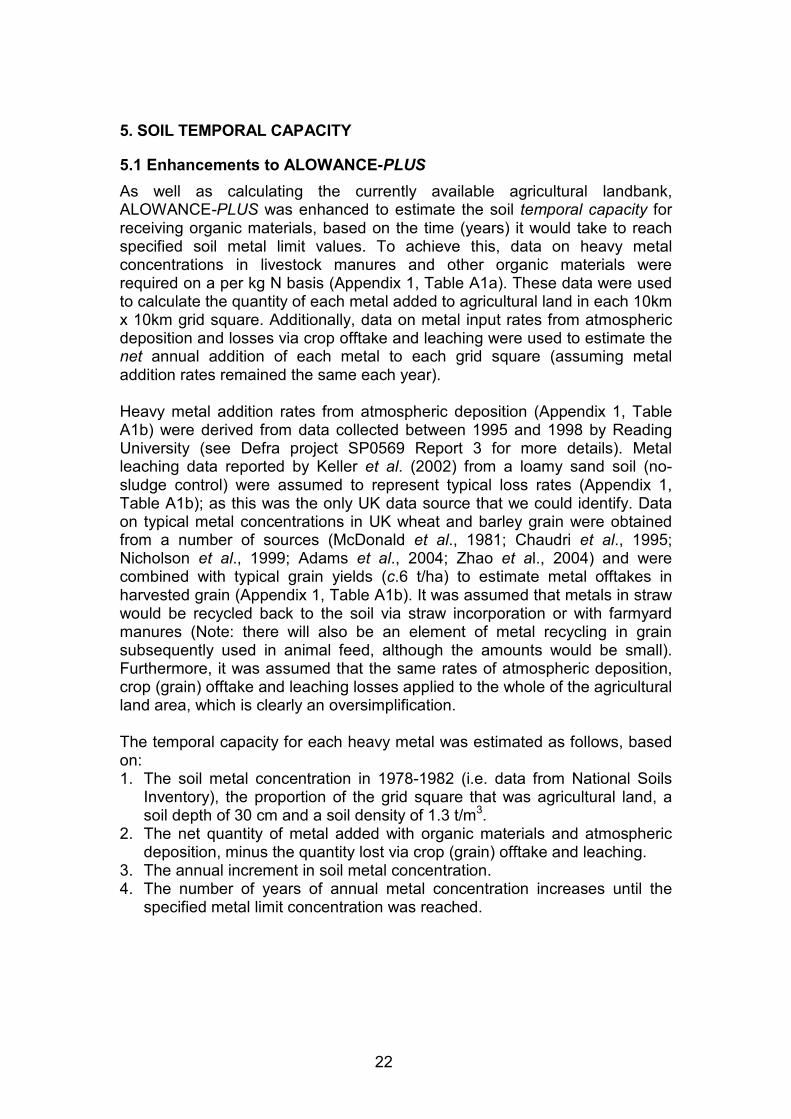
5. SOIL TEMPORAL CAPACITY
5.1 Enhancements to ALOWANCE-PLUS
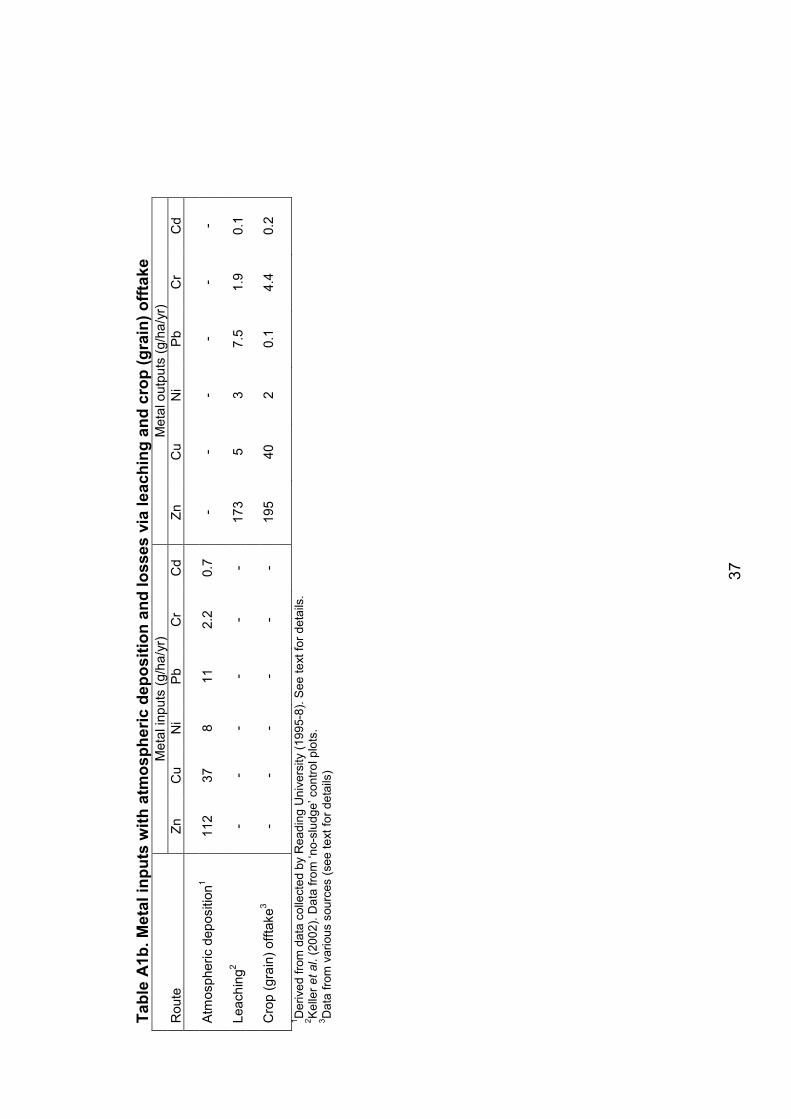
As well as calculating the currently available agricultural landbank, ALOWANCE-PLUS was enhanced to estimate the soil temporal capacity for receiving organic materials, based on the time (years) it would take to reach specified soil metal limit values. To achieve this, data on heavy metal concentrations in livestock manures and other organic materials were required on a per kg N basis (Appendix 1, Table A1a). These data were used to calculate the quantity of each metal added to agricultural land in each 10km x 10km grid square. Additionally, data on metal input rates from atmospheric deposition and losses via crop offtake and leaching were used to estimate the net annual addition of each metal to each grid square (assuming metal addition rates remained the same each year). Heavy metal addition rates from atmospheric deposition (Appendix 1, Table A1b) were derived from data collected between 1995 and 1998 by Reading University (see Defra project SP0569 Report 3 for more details). Metal leaching data reported by Keller et al. (2002) from a loamy sand soil (no-sludge control) were assumed to represent typical loss rates (Appendix 1, Table A1b); as this was the only UK data source that we could identify. Data on typical metal concentrations in UK wheat and barley grain were obtained from a number of sources (McDonald et al., 1981; Chaudri et al., 1995; Nicholson et al., 1999; Adams et al., 2004; Zhao et al., 2004) and were combined with typical grain yields (c.6 t/ha) to estimate metal offtakes in harvested grain (Appendix 1, Table A1b). It was assumed that metals in straw would be recycled back to the soil via straw incorporation or with farmyard manures (Note: there will also be an element of metal recycling in grain subsequently used in animal feed, although the amounts would be small). Furthermore, it was assumed that the same rates of atmospheric deposition, crop (grain) offtake and leaching losses applied to the whole of the agricultural land area, which is clearly an oversimplification. The temporal capacity for each heavy metal was estimated as follows, based on: 1. The soil metal concentration in 1978-1982 (i.e. data from National Soils
Inventory), the proportion of the grid square that was agricultural land, a soil depth of 30 cm and a soil density of 1.3 t/m3.
2. The net quantity of metal added with organic materials and atmospheric deposition, minus the quantity lost via crop (grain) offtake and leaching.
3. The annual increment in soil metal concentration. 4. The number of years of annual metal concentration increases until the
specified metal limit concentration was reached.
23
5.2 Changes in the landbank with time
Based on current soil heavy metal limit values (Scenario 2), ALOWANCE-PLUS was used to estimate the landbank remaining after 1000 years of annual organic material applications at 2020 volumes. After 1000 years, the landbank was estimated to have reduced from c.5.0 million ha to c.4.7 million ha (equivalent to a c.5% reduction in the landbank; Table 6 and Figure 22), indicating that there would be little additional long-term pressure on the overall agricultural landbank. Also, there was little overall change in the geographical distribution of the available landbank after 1000 years of organic material applications (Figure 23). Table 6. Change in agricultural landbank after 1000 years of annual applications at 2020 organic material volumes (Scenario 2).
Elapsed time (years)
Landbank (million ha)
Decrease in landbank (%)
0 5.0 -
200 4.95 1
400 4.9 2
600 4.85 3
800 4.8 4
1000 4.7 5
24
Figure 22. Change in agricultural landbank after 1000 years of annual applications at 2020 organic material volumes (Scenario 2).
4.7
4.8
4.9
5.0
0 200 400 600 800 1000
Elapsed Time (Years)
Landbank (million ha)
Figure 23. Scenario 2: Changes in landbank (ha) distribution assuming 2020 organic materials volumes and current maximum permissible soil metal concentrations between 2009 and 3000.
25
5.3 Soil temporal capacity (in years) for heavy metals
Based on current soil heavy metal limit values and 2020 projected organic materials volumes (Scenario 2), ALOWANCE-PLUS was used to predict the time at which the soil would first reach a metal limit concentration (i.e. the number of years it would take before the soil limit concentration for Zn or Cu or Ni or Pb or Cd or Cr was reached). These predictions aimed to enhance the ‘worst case’ temporal capacity estimates that were made for a ‘typical’ soil in Defra project SP0547 (Sources and impacts of past, present and future contamination of soil) and updated in Report 3 for Defra project SP0569, viz.:
• The ‘actual’ metal concentrations measured for each grid square were used (NSI, 1983), so that some grid squares would be higher and some lower than the median concentration previously used to represent a typical soil.
• All the organic material additions were spatially disaggregated and assumed to be spread evenly over the available agricultural land area (see Report 2 for project SP0569 for details). Hence, overall application rates were considerably lower than the ‘typical’ field rates assumed in the ‘worst case’ estimates for the individual organic materials (i.e. livestock manures, biosolids, compost, paper crumble and digestate). In both cases, the organic materials were assumed to be applied each year.
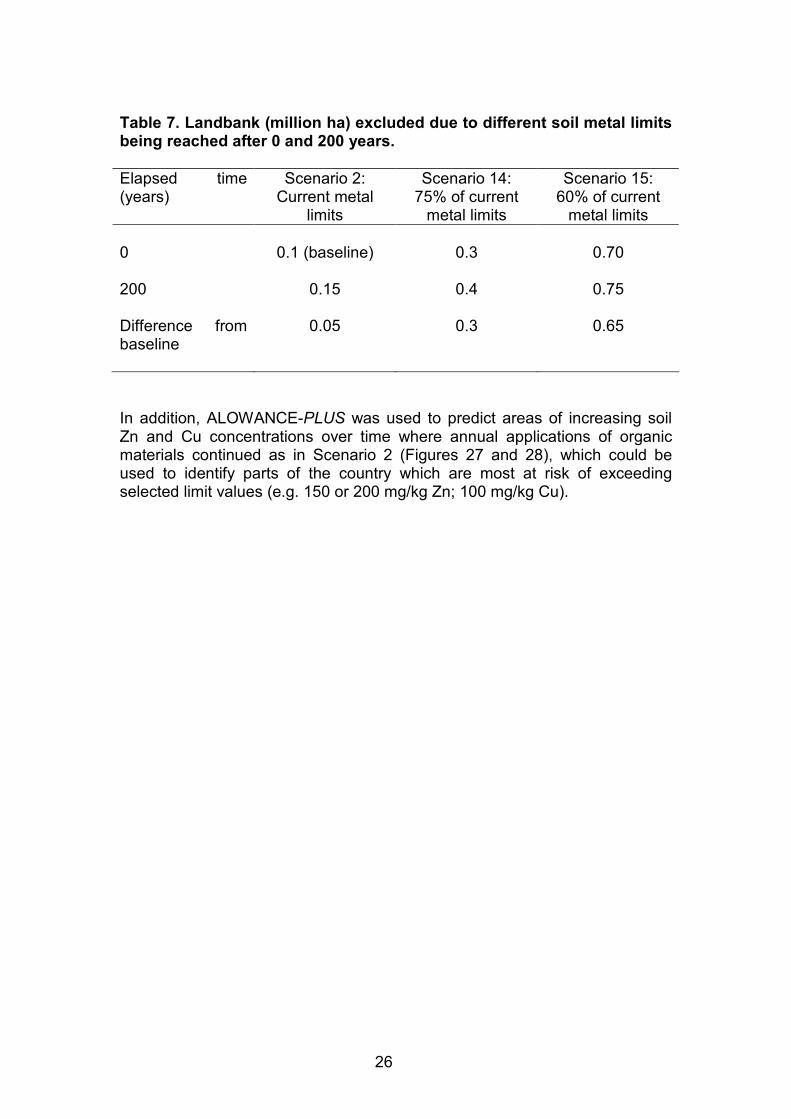
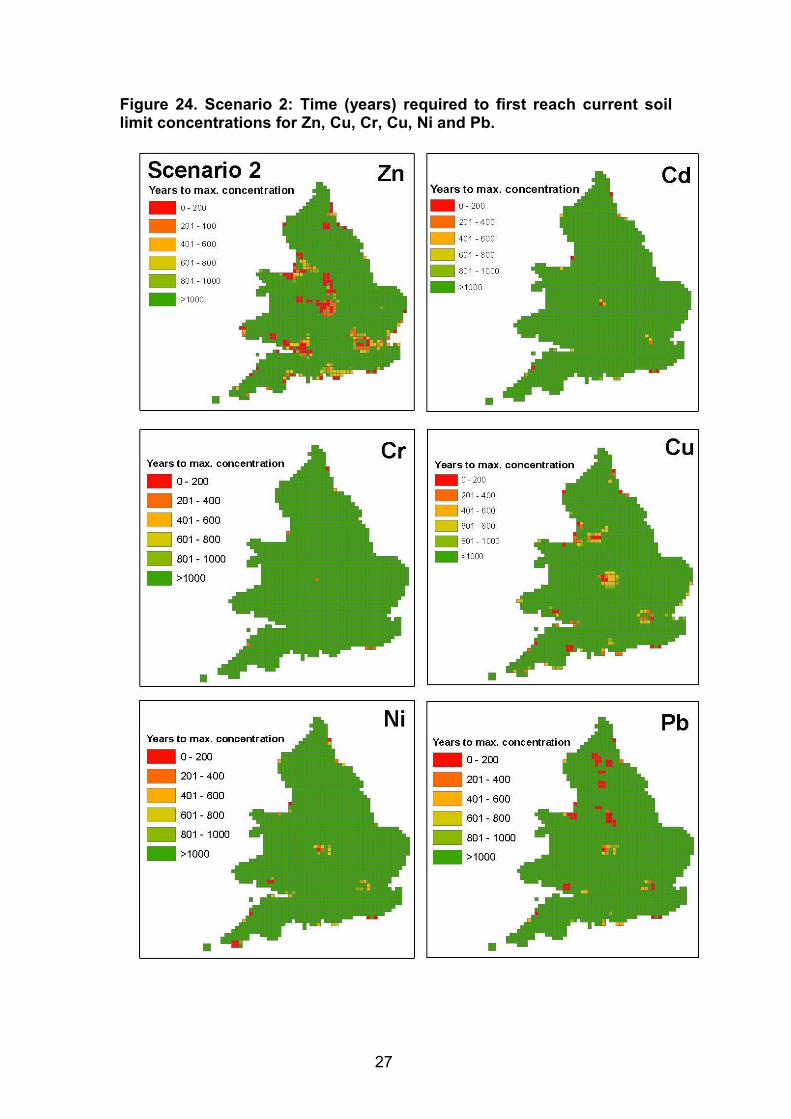
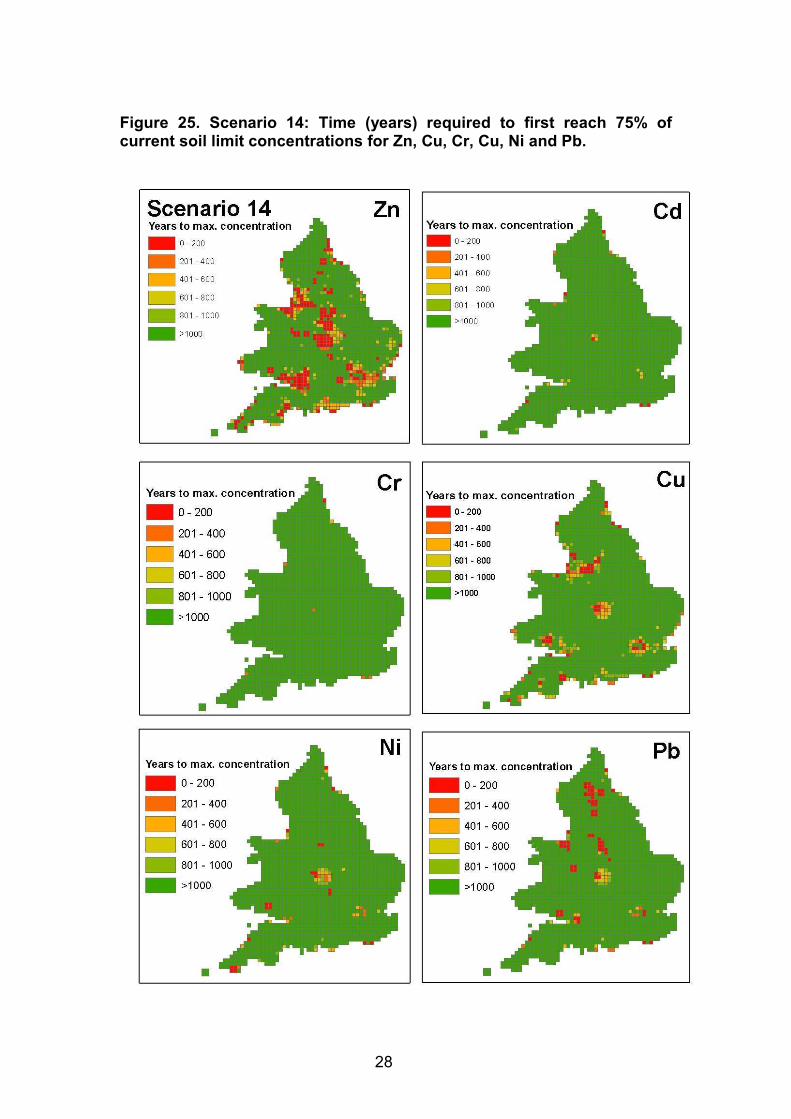
It is also important to note that ALOWANCE-PLUS predictions are based on averaged soil metal concentration data for a 10 km by 10 km grid square, and do not necessarily reflect the actual situation for an individual field within that grid square. Thus, a grid square on average may have a temporal capacity for Zn of less than 200 years, but an individual field within that grid square may have a much greater (or lower) capacity. These predictions should therefore only be used to provide an indication of areas where there may be pressure on the landbank because of soil metal concentrations. Figure 24 shows that it would take less than 200 years of annual organic material additions for the soil to reach the current limit concentration for Zn (200 mg/kg) in parts of north-east and north-west England, the Midlands and south Wales (equivalent to an additional c.0.05 million ha excluded from the landbank, Table 7), although for most of the country it would take more than 1000 years for the limit value to be reached. Similar calculations were made for Cu, Cd, Cr, Ni and Pb (Figure 24). However, if the soil metal limit values were reduced to 75% (Scenario 14) or 60% (Scenario 15) of the current values, the land area estimated to have reached the new limit values in <200 years was considerably greater, mostly due to the increased area where the soil Zn limit was reached (Figures 25 and 26). Note: some grid squares may reach the limit value for more than one metal, however the grid square is only excluded from the landbank area once. Table 7 shows that an additional 0.3 million ha would be excluded from the landbank after 200 years if metal limits were 75% of the current values, rising to 0.65 million ha if the limits were reduced to 60% of current values.
26
Table 7. Landbank (million ha) excluded due to different soil metal limits being reached after 0 and 200 years.
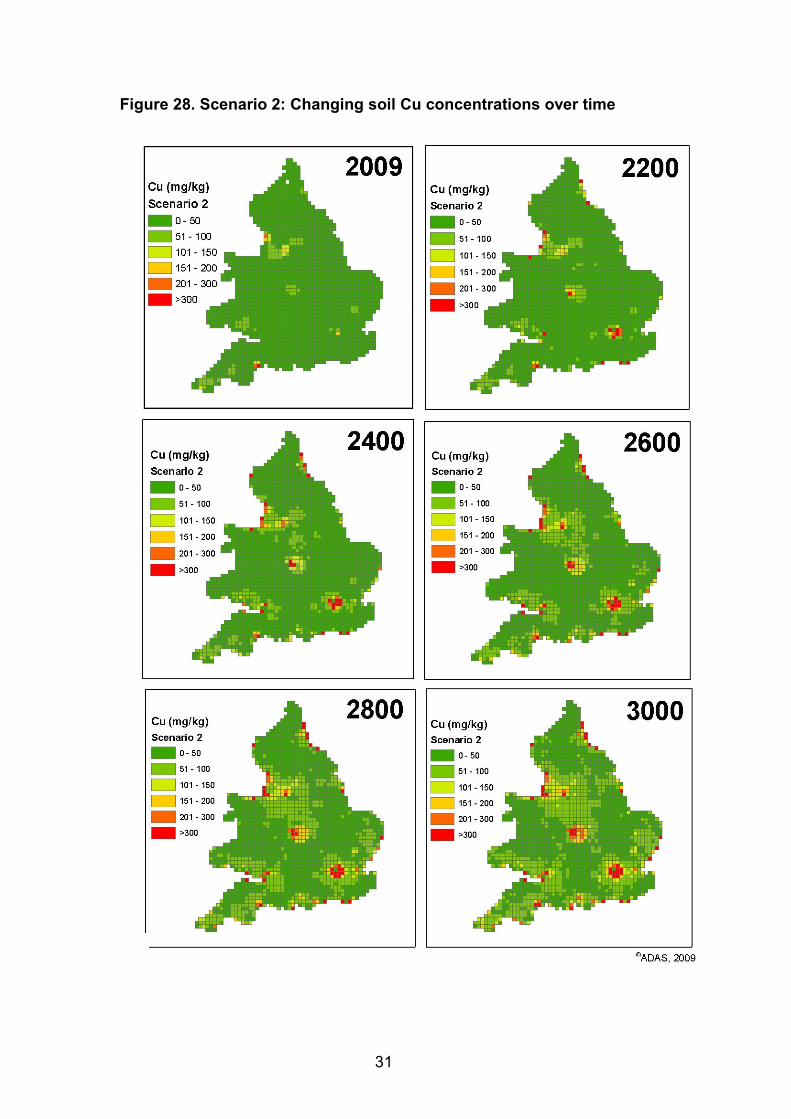
In addition, ALOWANCE-PLUS was used to predict areas of increasing soil Zn and Cu concentrations over time where annual applications of organic materials continued as in Scenario 2 (Figures 27 and 28), which could be used to identify parts of the country which are most at risk of exceeding selected limit values (e.g. 150 or 200 mg/kg Zn; 100 mg/kg Cu).
27
Figure 24. Scenario 2: Time (years) required to first reach current soil limit concentrations for Zn, Cu, Cr, Cu, Ni and Pb.
28
Figure 25. Scenario 14: Time (years) required to first reach 75% of current soil limit concentrations for Zn, Cu, Cr, Cu, Ni and Pb.
29
Figure 26. Scenario 15: Time (years) required to first reach 60% of current soil limit concentrations for Zn, Cu, Cr, Cu, Ni and Pb.
30
Figure 27. Scenario 2: Changing soil Zn concentrations over time
31
Figure 28. Scenario 2: Changing soil Cu concentrations over time
32
5.4 Changing heavy metal concentrations in digestate
ALOWANCE-PLUS was used to evaluate how the soil temporal capacity would be affected by different digestate Zn concentrations (Scenarios 16 and 17). Current soil metal limit values and 2020 projected organic material volumes were used, with the digestate Zn concentration set at 400 mg/kg dry matter (dm) (Scenario 16) or 200 mg/kg dm (Scenario 17). Changing the digestate Zn concentration to either 200 or 400 mg/kg dm (baseline value c.290 mg/kg dm) had very little impact on the soil temporal capacity. For example, increasing the digestate Zn content to 400 mg/kg was estimated to decrease the landbank capacity by only c.4,000 ha after 1000 years of application. Sensitivity analysis showed that even if the digestate Zn concentration was increased 10-fold (to 4,000 mg/kg dm), the reduction in landbank capacity after 1000 years of application would only be c.50,000 ha.
6. SUMMARY AND CONCLUSIONS
ALOWANCE-PLUS estimated the current agricultural landbank for the addition of ‘new’ sources of organic materials (i.e. over and above the quantities currently recycled to land) at c.5.1 million ha (see Report 2 for project SP0569). Using 2020 projected organic materials volumes, ALOWANCE-PLUS estimated that the agricultural landbank would only be reduced by a small amount (c.0.1 million ha) to c.5.0 million ha, with little change in geographical distribution. If the maximum permissible soil Zn concentration was reduced to 100 mg/kg
(compared with presently 200 mg/kg at pH ≤7.5), it was estimated that the landbank would decrease to c.3.5 million ha, with a more rapid decrease once the maximum permissible soil Zn concentration was lower than 150 mg/kg. In particular, there would be restrictions on the landbank available for spreading organic materials in north-east and north-west England, the Midlands, south Wales and south-west England. However, the landbank was much less sensitive to decreases in maximum permissible concentrations for the other metal scenarios tested (i.e. Cu, Ni and Pb), because there were only relatively small areas where current soil metal concentrations were above the maximum scenario levels tested. If maximum permissible soil heavy metal concentrations were reduced to c.60% of the current values for Zn, Cu, Ni and Pb the landbank would be reduced to c.4.3 million ha (c.15% decrease), with most of the reduction due to the lower soil Zn limit values. As only a small number of data points were available for soil Cd concentrations, it was not possible to provide a robust indication of the effect on the landbank of the pH-banded soil Cd limit scenarios. After 1000 years of organic material applications at 2020 volumes and at current soil heavy metal limit values, the landbank was estimated to reduce from c.5.0 million ha to c.4.7 million ha, indicating little overall additional long-term pressure on the landbank. Also, it was estimated that it would take less than 200 years of organic material additions (at 2020 volumes) to reach the
33
current soil Zn concentration limit (200 mg/kg) in some parts of north-east and north-west England, the Midlands and south Wales, although for most of the country it would take more than 1000 years for the limit value to be reached. However, if the soil metal limit values were reduced to 75% or 60% of the current value, the area of landbank excluded after 200 years of organic material additions would be considerably greater (an additional c.0.3 and c 0.6 million ha, respectively). Maps of changing soil Zn and Cu concentrations over time were produced (assuming 2020 organic material volumes and composition), which can be used to identify parts of the country most at risk of exceeding selected soil metal limit values (e.g. 150 or 200 mg/kg Zn; 100 mg/kg Cu). Increasing digestate Zn concentrations up to 400 mg/kg dm (compared with the baseline concentration of c.290 mg/kg dm) had very little impact on the soil temporal capacity (assuming 2020 volumes). Moreover, sensitivity analysis showed that even if the digestate Zn concentration was increased 10-fold (to 4,000 mg/kg dm), the reduction in landbank capacity after 1000 years of application would only be c.50,000 ha.
7. SUGGESTIONS FOR FURTHER WORK
• ALOWANCE-PLUS temporal capacity calculations are sensitive to the values entered for heavy metal inputs (i.e. via atmospheric deposition) and outputs (i.e. via crop offtake and leaching). Whilst robust data on grain offtakes are available, there is still some uncertainty over grassland/livestock system metal outputs and atmospheric deposition input rates (see Report 2 for Defra project SP0569), and very little data on metal leaching from soils under UK conditions. Notably, ALOWANCE-PLUS Zn and Cu outputs (via crop offtake and leaching) are estimated to be greater than inputs via atmospheric deposition. To ensure that estimates of the soil temporal capacity for organic material additions are robust, there is a need to acquire better data on metal input and outputs.
• There is only limited national data on soil Cd concentrations; better coverage is required to properly test the impact of pH-banded soil metal limits on the available landbank.
• In the longer term, there will be a need to keep the ALOWANCE-PLUS tool ‘up to date’, to reflect changes in organic material metal loadings as a result of changes in livestock numbers and the quantities of non-farm organic materials recycled to land etc., along with changes in their metal concentrations. The ALOWANCE-PLUS software has been designed to allow such changes to be accommodated without the need for substantial reprogramming.
34
8. REFERENCES
Adams, M. L., Zhao, F. J., Mc Grath, S. P., Nicholson, F. A. and Chambers, B. J. (2004). Predicting cadmium concentrations in wheat and barley grain using soil properties. Journal of Environmental Quality, 33, 532-541.
Chaudri, A. M., Zhao, F. J., McGrath, S. P. and Crosland, A. R. (1995). The cadmium content of British wheat grain. Journal of Environmental Quality, 24, 850-855.
Chaudri, A., McGrath, S., Gibbs, P., Chambers, B., Carlton-Smith, C., Godley, A., Bacon, J., Campbell, C. and Aitken, M. (2007). Cadmium availability to wheat grain in soils treated with sewage sludge or metal salts. Chemosphere, 66, 1415–1423.
Defra (2009). Safeguarding our Soils. A Strategy for England. PB13297. Defra Publications, London.
DoE (1996). Department of the Environment. Code of Practice for Agricultural Use of Sewage Sludge. DoE Publications.
EC (2001). Commission Regulation (EC) No. 466/2001 of 8 March 2001 setting maximum levels for certain contaminants in foodstuffs. Official Journal of European Communities Legislation 77, 1–13.
Gibbs P, Muir I, Richardson S, Hickman G and Chambers B (2005) Landspreading on agricultural land: nature and impact of paper wastes spread in England and Wales, Environment Agency, Bristol.
Keller, C., McGrath, S. P. and Dunham, S. J. (2002). Trace metal leaching through a soil-grassland system after sewage sludge application. Journal of Environmental Quality, 31, 1550-1560.
McDonald, P., Edwards, R. A., Greenhalgh, J. F. D. and Morgan, C. A. (1981). Animal Nutrition. 3rd Edition. Pearson Education Ltd, Harlow.
McGrath, S. P. and Loveland, P.J. (1992). The Soil Geochemical Atlas of England and Wales. Blackie Academic and Professional, London.
Nicholson, F. A., Chambers, B. J., Williams, J. R. and Unwin, R. J. (1999) Heavy metal contents of livestock feeds and animal manures in England and Wales. Bioresource Technology, 70, 23-31.
Paper Federation of Great Britain (1998) Code of Practice for Landspreading Paper Mill Sludge. Paper Federation of Great Britain, Swindon.
Smith, K. A. and Frost, J .P. (2000). Nitrogen excretion by farm livestock with respect to land spreading requirements and controlling nitrogen losses to ground and surface waters. Part 1: cattle and sheep. Bioresource Technology, 71, 173-181.
35
SI (1989). The Sludge (Use in Agriculture) Regulations 1989, SI 1263. HMSO, London.
SI (1990). The Sludge (Use in Agriculture) Regulations 1990, SI 880. HMSO, London.
SI (2007). The Environmental Permitting (England and Wales) Regulations 2007, SI No 3538. http://www.opsi.gov.uk/si/si2007/pdf/uksi_20073538_en.pdf (Accessed 06/01/10).
Webb, J., Loveland, P. J., Chambers, B. J., Mitchell, R. and Garwood, T. (2001). The impact of modern farming practices on soil fertility and quality in England and Wales. Journal of Agricultural Science, 137,127-138.
Zhao, F. J., Adams, M. L., Dumont, C., McGrath, S. P., Chaudri, A. M., Nicholson, F. A., Chambers, B. J. and Sinclair, A. H. (2004). Factors affecting the concentrations of lead in British wheat and barley grain. Environmental Pollution, 131, 461-468.
36
APPENDIX 1. TABLES
Table A1a. Metal concentration of livestock manures and other organic materials
Dry
N
Metal concentration (mg/kg fresh weight)
Metal concentration (g/kg N)
Type of material
matter
(%)
(g/kg
fw)10
Zn
Cu
Ni
Pb
Cr
Cd
Zn
Cu
Ni
Pb
Cr
Cd
Livestock excreta:1
Dairy cattle
10
3.6
15.9
9.73
0.49
0.66
0.46
0.02
4.4
2.7
0.14
0.18
0.13
0.01
Beef cattle
10
3.6
14.4
2.73
0.52
0.30
0.53
0.02
4.0
0.8
0.14
0.08
0.15
0.01
Pig
6
4.4
64.2
24.2
0.31
0.18
0.22
0.02
14.6
5.5
0.07
0.04
0.05
0.00
Sheep
15
6
20.2
3.97
0.76
0.45
0.78
0.03
3.4
0.7
0.13
0.08
0.13
0.01
Poultry 2
35
19
91.7
18.5
1.1
6.97
1.98
0.22
4.8
1.0
0.06
0.37
0.1
0.01
Horse/goat/deer 3
10
3.6
14.4
2.73
0.52
0.30
0.53
0.02
4.0
0.8
0.14
0.08
0.15
0.01
Biosolids (as dry solids)4
- 36
636
330
38.1
151
91.9
1.73
17.7
9.2
1.06
4.19
2.55
0.05
Green compost5
60
7.5
112
33
9.4
60
12.8
0.37
14.9
4.4
1.25
7.98
1.71
0.05
Paper crumble (biologically
treated)6
28
7.5
38
30
2.9
8
5.0
0.20
5.1
4.0
0.39
1.07
0.67
0.03
Paper
crumble
(non-
biologically treated)6
41
2.2
40
21
1.3
3
2.6
0.05
18.6
9.9
0.59
1.5
1.19
0.02
Digestate7
3.5
8.2
10
2
0.3
1.5
0.5
0.04
1.2
0.2
0.04
0.18
0.06
0.01
Fibrophos8
nd
0.01
2000
500
nd
nd
nd
nd
200000
50000
nd
nd
nd
nd
CropKare9
nd
0.01
1662
291
15.2
11.6
nd
1.2
166200
29100
1520
1160
nd
120
nd = no data
1Livestock excreta metal concentrations are from the manures survey undertaken in this project. Metal concentrations at 10% dm for cattle, 6% dm for pig, 15% dm for sheep
and 35% for layers were calculated from regressions of the fresh weight metal and dry matter contents (See SP0659 Report 3 for full details).
2Metal (and N) contents of broiler and other poultry excreta assumed to be the same as layer manure.
3Metal (and N) content of horse, goat and deer excreta assumed to be the same as beef excreta.
4Mean of data for 2001 to 2007 for England and Wales supplied by the Environment Agency (M. Davis, pers. comm.). All biosolids types use the same metal analysis.
5Mean metal contents of c.100 green compost samples certified for PAS100 by the Composting Association in 2008
6Gibbs et al. (2005)
7Mean of metal analysis data from two anaerobic digestion plants.
8 http://www.fibrophos.co.uk
9http://cropkare.com/traceelem.html
10N content of livestock excreta at stated dry matters from Defra “Fertiliser Manual (RB209)” (In press), except sheep excreta (Smith and Frost, 2000)
37
Table A1b. Metal inputs with atmospheric deposition and losses via leaching and crop (grain) offtake
Metal inputs (g/ha/yr)
Metal outputs (g/ha/yr)
Route
Zn
Cu
Ni
Pb
Cr
Cd
Zn
Cu
Ni
Pb
Cr
Cd
Atmospheric deposition1
112
37
8
11
2.2
0.7
- -
- -
- -
Leaching2
- -
- -
- -
173
5
3
7.5
1.9
0.1
Crop (grain) offtake3
- -
- -
- -
195
40
2
0.1
4.4
0.2
1Derived from data collected by Reading University (1995-8). See text for details.
2Keller et al. (2002). Data from ‘no-sludge’ control plots.
3Data from various sources (see text for details)
38
APPENDIX 2. THE ALOWANCE SOFTWARE TOOL
Organic materials are a valuable source of nutrients for crop growth and organic matter that can maintain and enhance soil physical conditions. There are around 9.3 million hectares of agricultural land in England and Wales potentially available for the recycling of organic materials, although not all soils or land uses are suitable. There is clearly a need to understand the size and distribution of the available landbank at both a national and local level. ALOWANCE (Agricultural Land and Organic ‘Waste’: A National Capacity Estimator) is a GIS-based tool which estimates the available agricultural landbank based on a number of physical and practical constraints (Table A2a), and legislative restrictions on organic material recycling including:
• restrictions on nitrogen (N) loading rates within Nitrate Vulnerable Zones (NVZs),
• restrictions in the Sewage Sludge Directive (i.e. soil pH and heavy metal concentrations),
• topography and proximity to water courses (surface and ground),
• risks of pathogen transfer to food crops and water bodies,
• crop nutrient requirements,
• land management agreements in Environmentally Sensitive Areas (ESAs) etc.,
• restrictions on manure use in Sites of Special Scientific Interest (SSSIs), National Nature Reserves (NNRs), and
• rules for the management of organically farmed land. ALOWANCE has an embedded methodology for calculating: 1) the potential landbank capacity; 2) current farm manure N production; 3) the proportion of the landbank already taken up by farm manures and existing non-farm organic materials (i.e. biosolids, compost, paper crumble, digestate); and 4) the landbank remaining for ‘new’ sources of organic materials. It can be used to identify areas where there is a potential shortage or surplus of available agricultural land for recycling organic materials. Farm manure N production is calculated using livestock numbers from the 2004 agricultural census, combined with farm manure N production data (i.e. the quantity of N produced after losses during housing and storage are accounted for, expressed as of kg N/animal/year) for each livestock type as published in the NVZ Action Programme (NVZ-AP). The N loading was subdivided into field deposited N (i.e. deposited directly in the field by grazing livestock) and manure N handled as FYM (straw-based farmyard manure), slurry, poultry litter or poultry manure. In this way, different legislative and practical constraints on the handling and spreading of these materials was accommodated.
39
Table A2a: Summary of physical and legislative restrictions to the agricultural landbank available for spreading organic materials.
Factor or land designation
Source of restriction ALOWANCE constraints
Topography Practical limitations on spreading
• No spreading if slope >16°.
• This exclusion only applies to handled manures – excreta deposited during grazing is not affected.
Watercourses Code of Good Agricultural Practice (Defra, 2009); NVZ legislation (Defra/EA, 2008)
• No spreading within 10m of any watercourse (including ditches).
• No spreading within 50m radius of a spring, well or borehole used for human consumption or farm dairies.
• This exclusion only applies to handled manures – excreta deposited during grazing is not affected.
SPZs EA Groundwater Source Protection Zones (SPZs)
• No biosolids to be applied within a SPZ Zone 1
ESAs Environmentally Sensitive Areas (ESAs)
• Only farmyard manure (FYM) may be spread
SSSIs Sites of Special Scientific Interest (SSSIs)
• Only FYM may be spread
NNRs National Nature Reserves • Only FYM may be spread
NVZs NVZ legislation (Defra/EA, 2008)
• No organic materials in front of legumes. ALOWANCE removes the area of peas/beans from the landbank.
• Maximum livestock manure N loading rates (i.e. from handled manures and field deposited excreta) are 170 kg/ha for arable land and grassland.
Organically managed farmland
UKROFS Standards (2003). Now superceded by ACOS (Advisory Committee on Organic Standards).
• Maximum livestock manure N loading rate (from handled manure and field deposited excreta) is 170 kg N/ha/yr
(both inside and outside NVZs).
• No biosolids or paper crumble may be spread.
Outdoor pigs • Manure cannot be spread on land occupied by outdoor pigs
• ALOWANCE assumes that RTE crops areas have no capacity to receive slurry or biosolids/paper crumble.
Soil pH
Sludge Regulations (SI, 1989) and Code of Practice (DoE, 1996)
• Biosolids may not applied if soil pH<5
Soil heavy metal concentrations
Sludge Regulations (SI, 1989) and Code of Practice (DoE, 1996)
• Biosolids (and compost/paper crumble) may only be applied if soil heavy metal concentrations are below maximum permissible levels.
40
In addition to farm manures, ALOWANCE includes data layers on the location of sewage treatment works (i.e. biosolids production sites), composting sites, paper crumble production sites, anaerobic digestors and power plants burning poultry litter. For each site, information on the quantity of organic materials produced for land spreading (i.e. biosolids, compost, paper crumble, digestate, poultry ash) was obtained and combined with data on the ‘typical’ N content of the materials, to calculate the N loading to agricultural land in each 10 x 10 km grid square. For biosolids, a ‘typical’ N content of 36 kg N/t dry solids (ds) was used for all biosolids types based on the mean N content of biosolids reported by the Environment Agency between 2001 and 2007. The quantities of biosolids applied to agricultural land were provided by the individual Water Companies for 2005/6, compost tonnages were provided by The Composting Association for 2004/5 and paper crumble quantities were from 2003 (Gibbs et al., 2005). To ensure that specific sources of non-farm organic materials could not be identified, the N was assumed to be distributed evenly across grid squares within a specified transport distance, which was based on industry information. The N from non-farm materials was added to the farm manure N loading to calculate the total N loading to agricultural land for each 10 x 10 km grid square. Two versions of ALOWANCE were developed based on 2004 agricultural census data. ALOWANCE-PLUS is a PC-based tool which provides the full functionality of ALOWANCE to a small number of ‘expert’ users. It incorporates scenario testing capabilities, allowing the agricultural landbank capacity to be calculated interactively. ALOWANCE-ONLINE is a web-based version of ALOWANCE which provides basic information to general users, including pre-selected map ‘layers’ (generated from ALOWANCE-PLUS) and a simple query tool. It can currently be accessed via the WRAP website: http://www.wrap.org.uk/composting/useful_tools.html. Results from ALOWANCE-PLUS showed in 2004 that there was c.9.3 million hectares of agricultural land (the theoretical landbank). After exclusions due to physical and landuse restrictions, and after accounting for livestock N production, c.5.5 million hectares of land remained. Exclusions based on soil pH and maximum permitted metal concentrations reduced the landbank by c.150,000 ha, and after accommodating current sources of non-farm organic materials (biosolids, compost, paper crumble and digestate), the estimated agricultural landbank for the addition of ‘new’ sources of organic materials was c.5.1 million hectares. Spatial representations showed that in some parts of the country (e.g. North-west England) the landbank was already under ‘pressure’ and transport of any future ‘new’ sources of organic materials away from these areas may be required.