Page 1
Essex-Windsor Solid Waste Authority 360 Fairview Ave. West, Suite 211
ESSEX, Ontario N8M 3G4 Internet: www.ewswa.org
EEsssseexx--WWiinnddssoorr
LLaannddffiillll SSiittee NNoo.. 22
Page 2
ESSEX-WINDSOR SOLID WASTE AUTHORITY
Essex Landfill Site No. 2 2008 - 2009
BIENNIAL OPERATIONS REPORT
Page 3
TABLE OF CONTENTS ________________________________________________________________________
1 INTRODUCTION ..................................................................................................................................... 1 1.1 CERTIFICATE OF APPROVAL .................................................................................................................. 1 1.2 PURPOSE ............................................................................................................................................... 1 1.3 COMPLIANCE ......................................................................................................................................... 1
2 INSPECTIONS AND COMPLAINTS .................................................................................................... 2 2.1 SITE INSPECTIONS ................................................................................................................................. 2 2.2 COMPLAINTS ......................................................................................................................................... 2
3 SITE DEVELOPMENT AND MAINTENANCE ................................................................................... 2 3.1 VEGETATION AND COVER ..................................................................................................................... 3 3.2 DRAINAGE ............................................................................................................................................. 3 3.3 ROADS .................................................................................................................................................. 4 3.4 MAINTENANCE ...................................................................................................................................... 4
4 LEACHATE MANAGEMENT ................................................................................................................ 4 4.1 LEACHATE QUANTITY ........................................................................................................................... 4
Figure 1: Historical Data of Leachate Quantities 1990-2009 ............................................................... 5 Figure 2: Leachate Capture Rates 1990-2009 ....................................................................................... 5
4.2 LEACHATE QUALITY ............................................................................................................................. 6 Table 1: Leachate Quality Results for MH6 and MH8 ........................................................................... 6
4.3 LEACHATE SPRINGS .............................................................................................................................. 7 4.4 LEACHATE SYSTEM OPERATIONS .......................................................................................................... 7 4.5 LEACHATE SYSTEM MAINTENANCE ...................................................................................................... 7
5 MONITORING PROGRAMS ................................................................................................................. 8 5.1 GROUND WATER MONITORING ............................................................................................................. 8 5.2 PRECIPITATION EVENT SURFACE WATER SAMPLING ............................................................................. 8 5.3 PRECIPITATION MEASUREMENTS........................................................................................................... 9
Table 2: Precipitation Comparison ...................................................................................................... 10 Figure 3: Precipitation Comparison 2008-2009 .................................................................................. 10
5.4 LEACHATE LEVEL MEASUREMENTS ..................................................................................................... 11 5.5 METHANE GAS MEASUREMENTS ......................................................................................................... 11
Table 3: 2008-2009 Gas Monitoring for Landfill No. 2 ....................................................................... 11 5.6 CONTAMINANT ATTENUATION ZONE ASSESSMENT .............................................................................. 12 5.7 MONITORING CONCLUSIONS & RECOMMENDATIONS FOR 2008-2009 .................................................. 12
2008 Monitoring Program Conclusions ............................................................................................... 12 2009 Monitoring Program Conclusions ............................................................................................... 14
5.8 RECOMMENDED CHANGES TO THE MONITORING AND MEASUREMENT PROGRAMS FOR 2008 AND 2009 .......................................................................................................................................................... 15
Recommended Modifications to the 2008 Monitoring Program .......................................................... 15 Recommended Modifications to the 2009 Monitoring Program .......................................................... 16
Page 4
APPENDIX A Post Closure Maintenance and Inspection Reports 2008-2009
APPENDIX B
1992–1998 Leachate Quality (MH7) Historical Leachate Quality at Manhole 6 (1999 – 2007) Historical Leachate Quality at Manhole 8 (1999 – 2007)
Figure: Leachate Analysis for Manhole 7 (MH7) Figure: Leachate Analysis for Manhole 6 (MH6) Figure: Leachate Analysis for Manhole 8 (MH8)
APPENDIX C
Annual Monitoring Reports for 2008 & 2009, prepared by Genivar Consultants L.P. (Under separate cover)
APPENDIX D
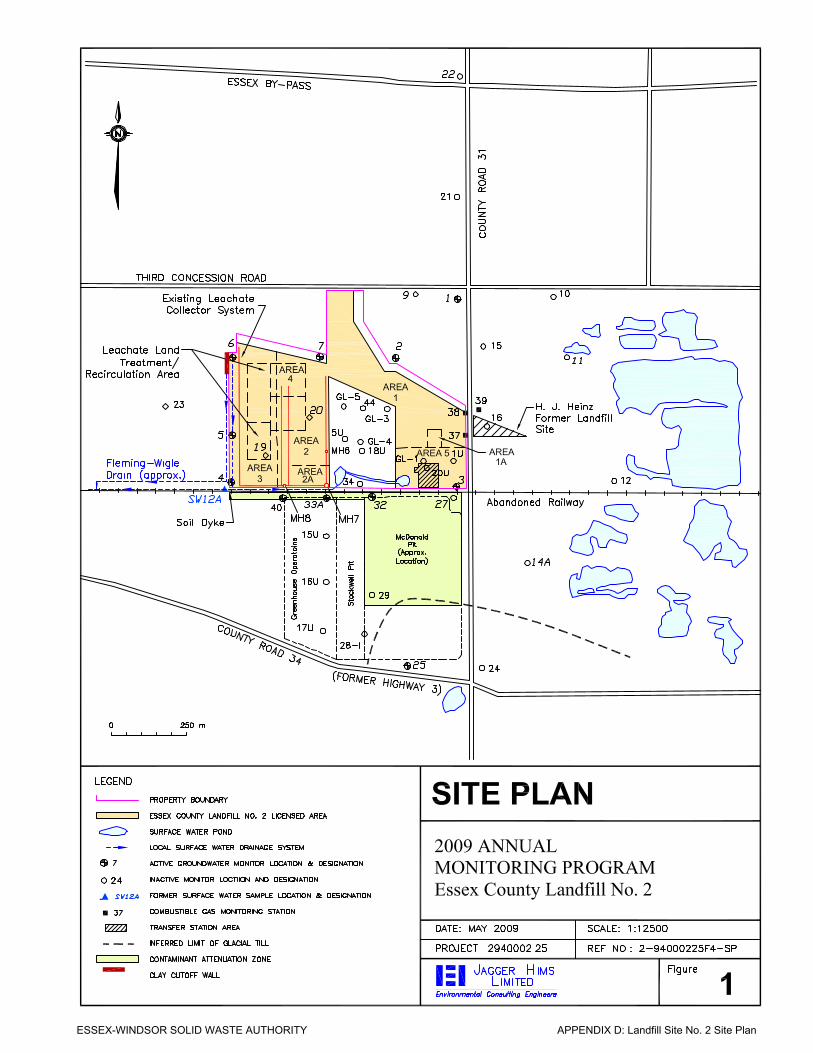
Landfill Site No. 2 Site Plan (provided by Genivar Consultants L.P.)
Page 5
ESSEX-WINDSOR SOLID WASTE AUTHORITY 1
1 INTRODUCTION
Essex County Sanitary Landfill Site No. 2 is located in parts of Lots 12 and 13, Eastern
Division, Concession 2, in the Town of Kingsville (formerly the Township of Gosfield
South). The site fronts on Essex County Road 31, known as the Albuna Townline Road.
Landfill 2 closed to the receipt of waste in October 1993. In August 1993 a Transfer
Station was built on a portion of the licensed landfill site. Waste from the service area of
the landfill site is now processed through the Transfer Station and then hauled to the
Essex-Windsor Regional Landfill for disposal.
1.1 CERTIFICATE OF APPROVAL
The site is licensed under Provisional Certificate of Approval No. A 011401, dated
December 2, 1985 which was subsequently amended on August 8, 2007. It
encompasses an area of 38.5 ha of which 30.17 ha, in Areas 1 through 5, were
approved for waste disposal (see Appendix D for area locations). No waste was disposed
of in Area 5, and it is now the location of the Transfer Station.
1.2 PURPOSE
This report reflects the perpetual care of the landfill site, as set out in the End Use and
Closure Plan dated February 1993 and approved August 8, 2007 and amended
September 25, 2007, as well as the monitoring programs that were in effect for the
years 2008 and 2009. The End Use and Closure Plan specifies that biennial operations
reports will be submitted to the Ministry of the Environment effective 1998.
1.3 COMPLIANCE
Landfill Site No. 2 had a historical off-site chemical plume that previously resulted in
non-compliance issues with regards to Guideline B-7 criteria for the reasonable use of
groundwater for some analytes. In November 2004, the Essex-Windsor Solid Waste
Authority applied and received approval to establish a Contamination Attenuation Zone
on a number of the properties located to the south of the landfill. The monitoring results
for 2008 and 2009 indicate that the operation of the leachate collection system and the
Page 6
LANDFILL SITE NO. 2 2008-2009
ESSEX-WINDSOR SOLID WASTE AUTHORITY 2
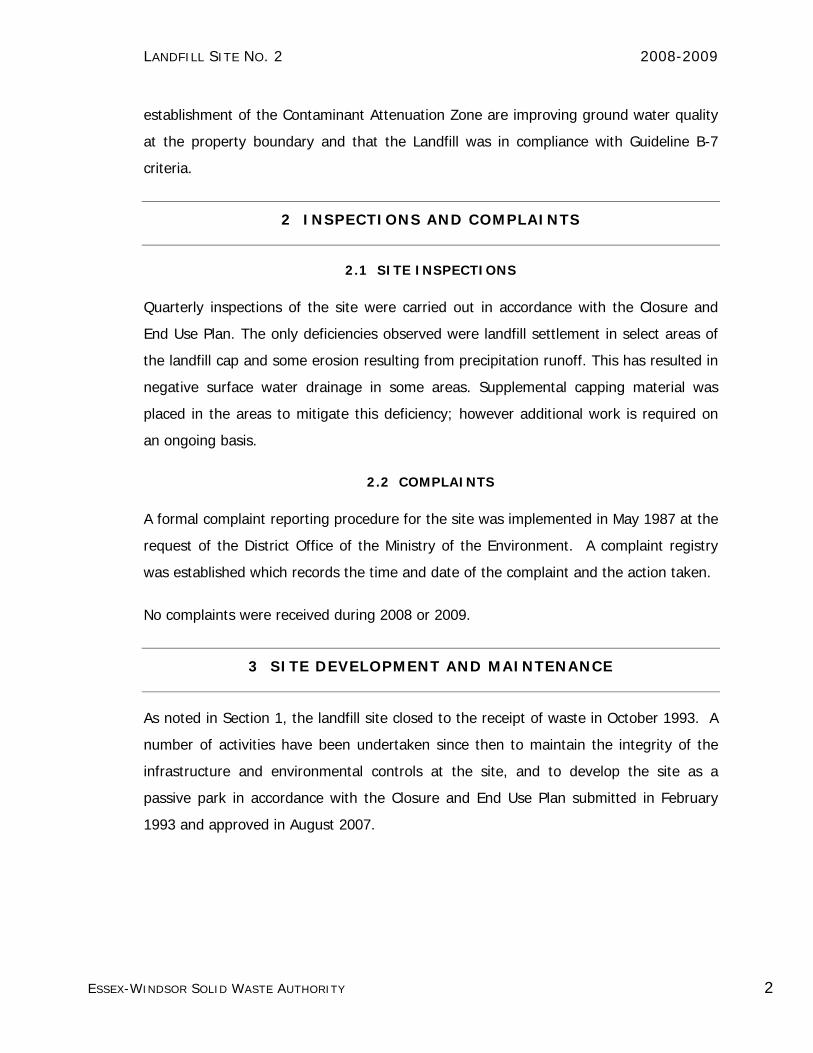
establishment of the Contaminant Attenuation Zone are improving ground water quality
at the property boundary and that the Landfill was in compliance with Guideline B-7
criteria.
2 INSPECTIONS AND COMPLAINTS
2.1 SITE INSPECTIONS
Quarterly inspections of the site were carried out in accordance with the Closure and
End Use Plan. The only deficiencies observed were landfill settlement in select areas of
the landfill cap and some erosion resulting from precipitation runoff. This has resulted in
negative surface water drainage in some areas. Supplemental capping material was
placed in the areas to mitigate this deficiency; however additional work is required on
an ongoing basis.
2.2 COMPLAINTS
A formal complaint reporting procedure for the site was implemented in May 1987 at the
request of the District Office of the Ministry of the Environment. A complaint registry
was established which records the time and date of the complaint and the action taken.
No complaints were received during 2008 or 2009.
3 SITE DEVELOPMENT AND MAINTENANCE
As noted in Section 1, the landfill site closed to the receipt of waste in October 1993. A
number of activities have been undertaken since then to maintain the integrity of the
infrastructure and environmental controls at the site, and to develop the site as a
passive park in accordance with the Closure and End Use Plan submitted in February
1993 and approved in August 2007.
Page 7
LANDFILL SITE NO. 2 2008-2009
ESSEX-WINDSOR SOLID WASTE AUTHORITY 3
3.1 VEGETATION AND COVER
In 2008 and 2009 additional clay cover soils were placed in select areas of the Landfill to
mitigate landfill settlement. Compost was spread over the clay as a topsoil amendment
and the area was seeded. Weeds and grass were cut and trimmed as required.
In 2001 & 2002 the Essex-Windsor Solid Waste Authority collaborated with the Essex
County Field Naturalists and planted approximately 3,670 indigenous trees and shrubs in
Buffer Areas 6 & 9. These plantings complement plantings carried out in previous years,
and are consistent with the End Use Plan as a passive park. The trees and shrubs
planted at the site were pruned, weeds and grass were removed from around their
trunks and wood chips were placed at the base of the trees as mulch. In summary a
total of 12,368 trees and shrubs have been planted to date at Landfill Site No. 2.
In both 2008 and 2009, Dominion Tree Service were contracted to remove or trim trees
that were growing over the hydro line running to pump station 1. In 2009 Rivard
Excavating was contracted to remove brush along the west property line of the site so
that access to the west leg of the leachate collection system could be maintained.
In order to promote a thicker and healthier growth of grass on top of the waste cells, a
number of major grass cuts were completed in 2008 and 2009. By cutting the grass
more often weed patches do not get a chance to germinate and the grass is allowed to
reestablish itself in poor growth areas. A healthy, thick grass growth reduces erosion,
surface water infiltration and cell cap desiccation. Preliminary inspection results suggest
that the regular cutting of the grass has resulted in a much thicker healthier growth of
grass.
3.2 DRAINAGE
Minor repairs to promote surface water drainage were completed in 2008 and 2009.
Eroded areas of the landfill cap were repaired as required. The surface water monitoring
program continued to confirm that the repairs made to the dyke in 1999 to separate the
site from the Fleming-Wigle Drain have been effective.
Page 8
LANDFILL SITE NO. 2 2008-2009
ESSEX-WINDSOR SOLID WASTE AUTHORITY 4
3.3 ROADS
Internal stone roads were top dressed with new stone on an annual basis. Cold patch
was applied to paved road surfaces to eliminate potholes in the asphalt as required.
3.4 MAINTENANCE
Staff of the Essex-Windsor Solid Waste Authority carried out the day to day
maintenance of the site. This included, but was not limited to, fence and gate repairs
cut or damaged by individuals looking to gain access to the site, painting or replacing
monitor casings and bentonite seals and landscaping.
4 LEACHATE MANAGEMENT
A leachate collection system is in place at Landfill Site No. 2. A perimeter collection
system was installed along the western boundary of Area 3, the southern boundary of
Areas 2A, 3 and 4, and eastern boundary of Area A2 in 1990. Two leachate underdrain
pipes were installed through the centre of Area 4 in 1991 to control leachate levels in
this area. In October 1992, the perimeter leachate collector system was extended
northerly along the entire eastern boundary of Area 2. The catchment area of the
collector system is approximately 11.1 hectares.
Leachate collected in the system drains to Maintenance Hole 7 (MH7), as shown on the
Site Plan in Appendix D, where it is pumped into a forcemain that delivers the leachate
to an upstream location in the Town of Leamington sewer system. In July of 2007,
approximately 400 metres of the leachate forcemain east of County Rd. 31 was
relocated to permit the land owner to mine out aggregate located under the forcemain.
4.1 LEACHATE QUANTITY
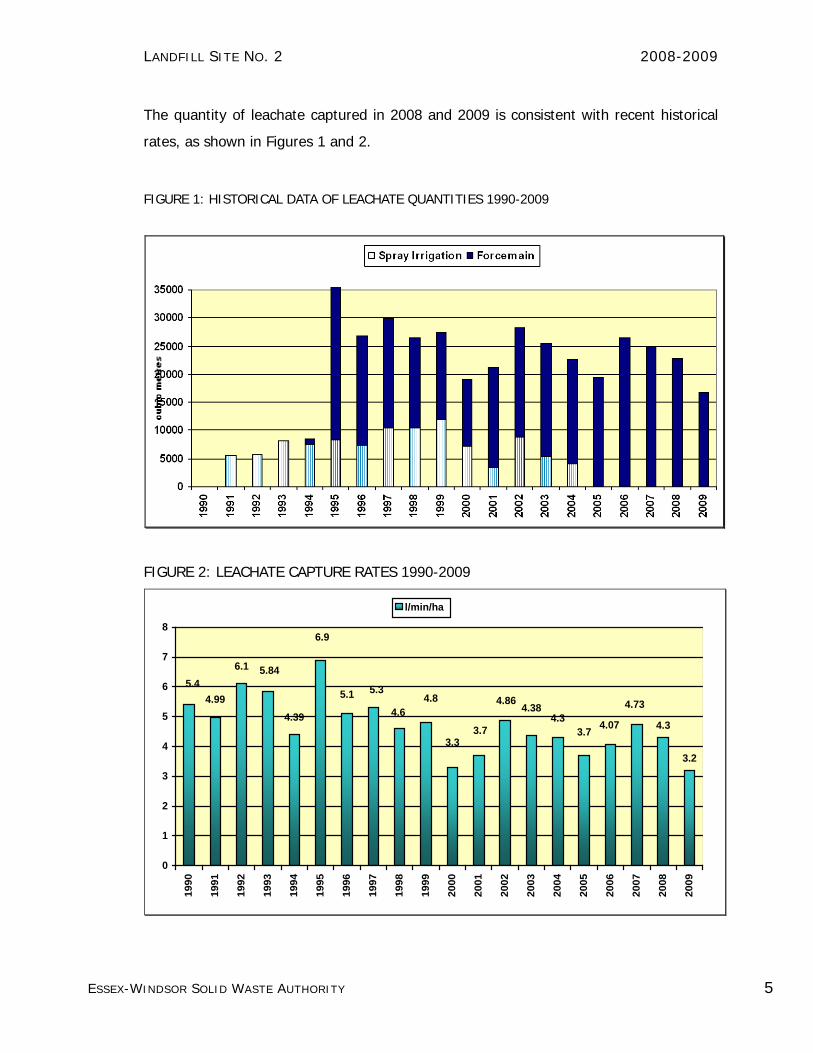
In 2008 an amount of 22,622.40 m3 of leachate was pumped into the forcemain for
treatment. This volume was equivalent to a leachate capture rate of 4.3 L/min/ha.
In 2009 an amount of 16,824.90 m3 of leachate was pumped into the forcemain for
treatment. This volume was equivalent to a leachate capture rate of 3.2 L/min/ha.
Page 9
LANDFILL SITE NO. 2 2008-2009
ESSEX-WINDSOR SOLID WASTE AUTHORITY 5
The quantity of leachate captured in 2008 and 2009 is consistent with recent historical
rates, as shown in Figures 1 and 2.
FIGURE 1: HISTORICAL DATA OF LEACHATE QUANTITIES 1990-2009
FIGURE 2: LEACHATE CAPTURE RATES 1990-2009
4.3
3.2
4.73
4.073.74.3
4.384.86
3.73.3
4.85.3
4.6
5.45.84
4.99
6.1
6.9
5.1
4.39
0
1
2
3
4
5
6
7
8
1990
1991
1992
1993
1994
1995
1996
1997
1998
1999
2000
2001
2002
2003
2004
2005
2006
2007
2008
2009
l/min/ha
Page 10
LANDFILL SITE NO. 2 2008-2009
ESSEX-WINDSOR SOLID WASTE AUTHORITY 6
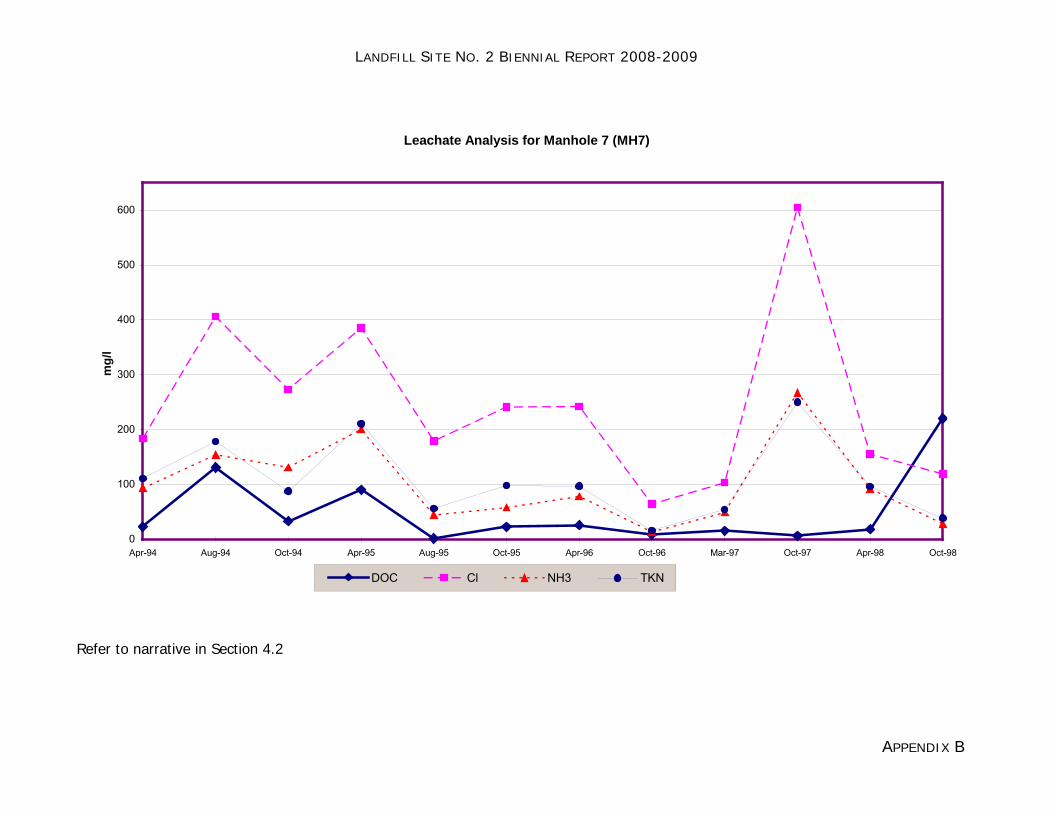
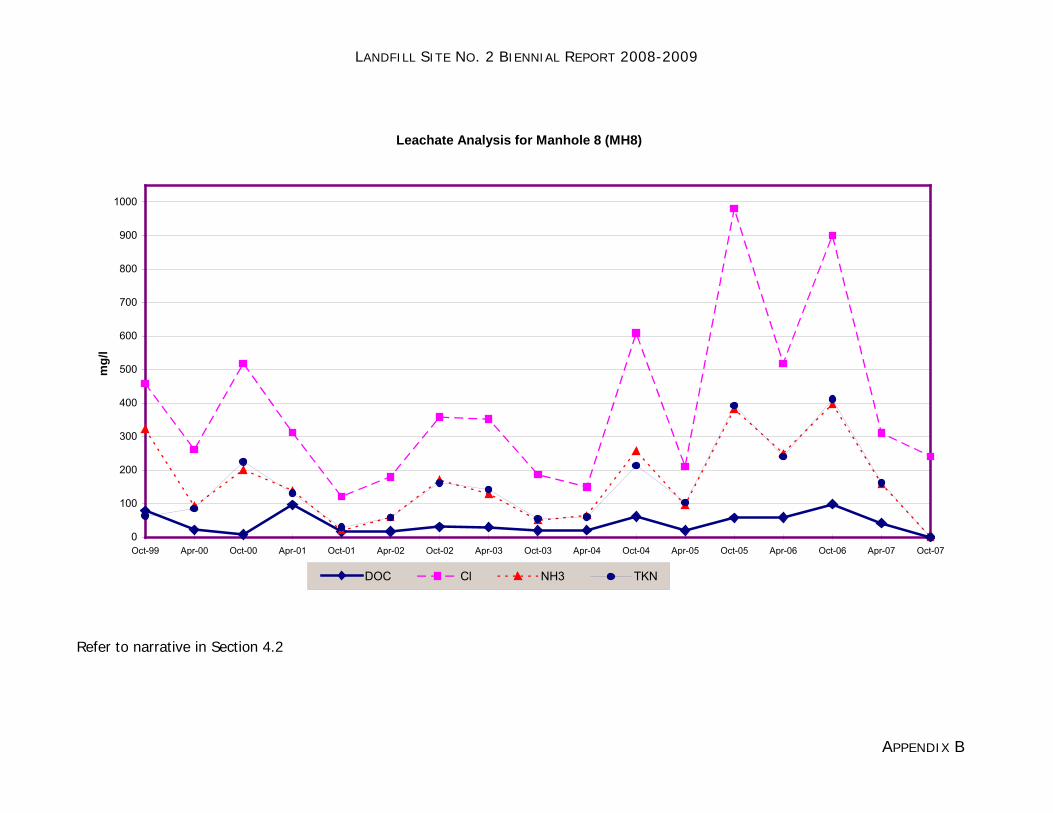
4.2 LEACHATE QUALITY
Analysis of the leachate for general chemistry is carried out two times per year as part
of the Landfill Leachate Monitoring Program. Samples are collected for analysis from two
locations within the leachate collection system, MH6 and MH8. The leachate is analyzed
for pH, chloride, boron, conductivity and vinyl chloride. Leachate characteristics for the
landfill were historically based on leachate collected from MH7 of the leachate collector
system. MH7 collects leachate from both the western portion and the eastern portion of
the leachate collector system. However, samples were collected from MH8 (western
portion, west of MH7) and MH6 (eastern portion, north of MH7) since 2000, to better
represent the leachate concentrations within the different portions of the collector
system.
The analytical results for 2008 and 2009 are shown in Table 1, and Appendix B. In
summary, the chemical concentrations are typical of old leachate from municipal solid
waste landfills in southern Ontario. Similar to the historic chemical results, in 2009 the
leachate collected in the eastern portion of the collector system (MH6) is diluted by
ground water and/or infiltration of precipitation, but contains elevated concentrations of
vinyl chloride. Samples could not be obtained from MH8 for April and October 2009 due
to insufficient volume recovery.
TABLE 1: LEACHATE QUALITY RESULTS FOR MH6 AND MH8
MH6 MH8
PARAMETER Apr 2-08 Oct 30-08 Apr 3-09 Oct 13-09 Apr 2-08 Oct 30-08 Apr 3-09 Oct 13-09
pH (pH units) 7.83 7.53 6.91 7.38 7.77 7.20 DRY DRY Conductivity 1,549 1,310 2,380 1,510 2,491 8,530 DRY DRY Chloride (mg/L) 166 121 191 107 198 957 DRY DRY Boron (mg/L) 0.60 0.58 0.85 0.48 0.50 0.30 DRY DRY Vinyl chloride (ug/L) 32.4 25.3 34.4 14.6 <0.2 <0.2 DRY DRY
Parameters tested were amended per September 25, 2007 C of A No. A011401 The historical analytical results are shown in Appendix B.
Page 11
LANDFILL SITE NO. 2 2008-2009
ESSEX-WINDSOR SOLID WASTE AUTHORITY 7
4.3 LEACHATE SPRINGS
There were no leachate stains or springs detected during 2008 and 2009.
4.4 LEACHATE SYSTEM OPERATIONS
The current operating elevations of the pumps in MH7, which pump leachate into the
forcemain, are 211.60 metres above sea level (m.a.s.l (off)) and 212.25 m.a.s.l. (on) to
maintain gravity flow within the leachate collector system and to attempt to prevent the
off-site movement of leachate. The leachate forcemain remained operational for most of
2008 and 2009 with minor exceptions.
4.5 LEACHATE SYSTEM MAINTENANCE
The Closure and End Use Plan specifies that the entire leachate management system is
to be flushed and cleaned every two years. The work was carried out in 2008 by Benko
Sewer Systems Ltd. and is scheduled to be flushed again in 2010.
On a number of occasions during 2008 and 2009 minor repairs and maintenance were
carried out on the system as required. This included but was not limited to, flow meter
calibrations, valve adjustments and pump station repairs.
In April 2009, MH6 was raised in order to reduce surface water infiltration through the
manhole lid.
In 1996, the development of a greenhouse operation on the adjacent property west of
the Landfill resulted in the excavation of the upper 3 to 4 metres of soil. Observations
during subsequent monitoring events and groundwater elevations determined for 1998
through to 2002 that the ground water flow system around Monitor 6 was changed from
historic conditions by the development of the greenhouse complex and further, resulted
in an unacceptable landfill effect on ground water quality at the landfill property
boundary near Monitor 6.
In February of 2003, Rivard Contracting was awarded a contract to construct a low
permeability barrier near the northwestern corner of the Landfill. The objective of the
Page 12
LANDFILL SITE NO. 2 2008-2009
ESSEX-WINDSOR SOLID WASTE AUTHORITY 8
low permeability barrier was to reduce the westerly movement of ground water near
Monitor 6. As a result, ground water near Monitor 6 would be induced to move toward
the landfill perimeter collector system, similar to subsurface conditions prior to the
development west of the Landfill. Subsequent monitoring results compiled since the
repairs were carried out suggests that the cut off wall is working successfully and thus
an off site landfill effect at this location is not anticipated.
5 MONITORING PROGRAMS
The Closure and End Use Plan for Landfill No. 2 sets out a detailed annual monitoring
program for the site. The program includes: monitoring of the ground water, sampling
of surface water following 30 mm precipitation events, and the measurement of
precipitation, methane gas and leachate levels. Genivar Consultants L.P. carried out all
of the monitoring programs at the site during 2008 and 2009.
5.1 GROUND WATER MONITORING
The annual ground water monitoring program consists of the following components:
• Measurement of groundwater levels at 20 monitoring locations
• Collection of ground water samples from 14 monitors in April and October.
• Analysis of samples collected for organic and inorganic parameters.
• Preparation of interim reports and the annual report.
5.2 PRECIPITATION EVENT SURFACE WATER SAMPLING
The Precipitation Event Monitoring Program includes the collection of samples from one
surface water monitoring location, SW12, following a 30 mm precipitation event at least
once in each quarter. Three precipitation events occurred in 2008. On July 2, 2008
there was 46.0 mm of precipitation, on September 13, 2008 there was 64.0 mm, and on
December 9, 2008 the site received 36.8 mm of precipitation. Surface water samples
were not collected since Station SW12A remained dry after the events.
Page 13
LANDFILL SITE NO. 2 2008-2009
ESSEX-WINDSOR SOLID WASTE AUTHORITY 9
There were five precipitation events in 2009. On February 12, 2009 there was 50.6
mm, March 9, 2009 38.8 mm, March 10, 2009 50 mm, June 19, 2009 44.7 mm and on
June 25, 2009 the site received 32.4 mm of precipitation. On all occasions, surface
water station SW12A was dry and as a result, samples could not be taken.
Consistent with historic results since the spring of 1998, surface water runoff from the
site was not detected west of the soil dyke in the Fleming-Wigle Drain. Therefore no
samples were submitted for laboratory analysis.
5.3 PRECIPITATION MEASUREMENTS
The measurement of precipitation is carried out at the site to assist in calculating
leachate capture rates, and to trigger the precipitation event surface water monitoring
program. The amount of precipitation received, by month, for the past 7 years is shown
in Table 2. The results are presented graphically in Figure 3. A total of 888.8 mm of
precipitation was recorded in 2008, and 808.0 mm was recorded during 2009.
Page 14
LANDFILL SITE NO. 2 2008-2009
ESSEX-WINDSOR SOLID WASTE AUTHORITY 10
TABLE 2: PRECIPITATION COMPARISON
MONTH 2009 2008 2007 2006 2005 2004 2003 January 34.0 55.6 102.7 66.1 71.6 19.2 16.0 February 75.8 85.0 8.5 49.8 58.6 24.4 25.2 March 118.6 79.8 61.0 50.0 11.6 67.6 51.0 April 99.0 49.0 103.0 58.2 71.0 25.8 69.0 May 29.8 65.4 35.1 119.5 27.4 176.8 121.3 June 106.3 91.2 28.8 99.1 14.6 45.4 89.8 July 47.4 72.5 45.4 109.0 74.2 75.2 80.1 August 91.3 31.8 178.8 89.0 64.4 77.7 115.7 September 53.1 105.2 47.7 85.4 17.6 19.0 120.2 October 73.7 40.4 57.4 109.8 14.0 33.7 66.8 November 16.8 99.2 49.8 78.4 82.6 84.4 80.8 December 62.2 113.7 81.0 30.2 86.2 47.2 48.4
Total 808.0 888.8 799.2 944.5 593.8 696.4 884.3
FIGURE 3: PRECIPITATION COMPARISON 2008-2009
0
20
40
60
80
100
120
140
JAN FEB MAR APR MAY JUN JUL AUG SEP OCT NOV DEC
mm
of P
reci
pita
tion
2009 2008
Page 15
LANDFILL SITE NO. 2 2008-2009
ESSEX-WINDSOR SOLID WASTE AUTHORITY 11
5.4 LEACHATE LEVEL MEASUREMENTS
Leachate levels are measured monthly within the collector system to determine the
effectiveness of the system. When leachate elevations within the collector system are
greater than the forcemain “on” elevation of 212.25 m.a.s.l. leachate could move
beyond the collector system into the upper aquifer south of the landfill.
The leachate level monitoring results confirm that the operational changes made to the
collector system after September 27th, 2000 have generally resulted in leachate
elevations being lower than the forcemain “on” elevations and is having a positive effect
in improving ground water quality at the landfill property boundary.
5.5 METHANE GAS MEASUREMENTS
Measurements for methane gas were taken in January, February, March, November and
December of 2008 and 2009 at Monitors 37, 38 and 39.
The detected concentrations were notably below the lower explosive limit (LEL), thus
there is no potential combustible gas hazard for residences in the area. The methane
measurement results for 2008 and 2009 are as shown in Table 3.
TABLE 3: 2008-2009 GAS MONITORING FOR LANDFILL NO. 2
DATE
MONITOR 37 MONITOR 38 MONITOR 39
% LEL
Organic Vapours (PPM)
% LEL
Organic Vapours (PPM)
% LEL
Organic Vapours (PPM)
Jan 21-08 0.0 <1.0 0.0 <1.0 0.0 <1.0 Feb 20-08 0.0 <1.0 0.0 <1.0 0.0 <1.0 Mar 20-08 0.0 <1.0 0.0 <1.0 0.0 <1.0 Nov 17-08 0.0 <1.0 0.0 <1.0 0.0 <1.0 Dec 12-08 0.0 <1.0 0.0 <1.0 0.0 <1.0 Jan 6-09 0.0 <1.0 0.0 <1.0 0.0 <1.0 Feb 3-09 0.0 <1.0 0.0 <1.0 0.0 <1.0
Mar 17-09 0.0 <1.0 0.0 <1.0 0.0 <1.0 Nov 5-09 0.0 <1.0 0.0 <1.0 0.0 <1.0 Dec 4-09 0.0 <1.0 0.0 <1.0 0.0 <1.0
LEL = lower explosive limit; PPM = parts per million
Page 16
LANDFILL SITE NO. 2 2008-2009
ESSEX-WINDSOR SOLID WASTE AUTHORITY 12
5.6 CONTAMINANT ATTENUATION ZONE ASSESSMENT
The Contaminant Attenuation Zone (CAZ) established south of the site provides an
opportunity to maintain a small CAZ for the upper aquifer, with ground water flow in the
lower aquifer moving back below Landfill No.2. South of the Landfill, shallow ground
water within the upper aquifer mixes with deeper ground water in the lower aquifer as a
result of aggregate extraction activities that removed the intervening aquitard. As a
result, the ground water that moves in a southerly direction from the Landfill’s south site
boundary enters the lower aquifer and mixes with the deep ground water, then
subsequently moves below the landfill site in a northerly direction.
Based on the 2008 and 2009 ground water quality results, it is apparent that the
operation of the perimeter collector system and utilization of the CAZ are effective at
maintaining acceptable ground water quality and prevent unacceptable off site impacts
for chloride, boron, and vinyl chloride as a result of landfill leachate. Continued
monitoring will be completed to evaluate the ongoing performance of the leachate
collector system and the CAZ.
5.7 MONITORING CONCLUSIONS & RECOMMENDATIONS FOR 2008-2009
The conclusions and recommendations based on the results of the 2008 and 2009
monitoring program carried out by Genivar Consultants L.P. were as follows:
2008 MONITORING PROGRAM CONCLUSIONS
The 2008 groundwater flow patterns associated with (a) the upper sand unit and
weathered glacial till, and (b) the lower sand unit are consistent with historic
patterns.
Leachate quality within the collector system is typical for closed municipal solid
waste landfill sites in southern Ontario. Similar to historic chemical results, the
2008 chemical concentrations are typically greater within the collector system
Page 17
LANDFILL SITE NO. 2 2008-2009
ESSEX-WINDSOR SOLID WASTE AUTHORITY 13
west of MH7 (MH8), relative to the eastern portion (MH6). One exception
continues to be greater vinyl chloride concentrations at MH6.
There are elevated chloride concentrations in the upper aquifer to the northeast,
northwest, and south of the landfill waste. However, Guideline B-7 criteria were
satisfied at the compliance points during 2008 for chloride and boron
concentrations, except for chloride in April and June at Monitor 3-III. Elevated
concentrations east of the landfill continue to be affected by road salting.
Vinyl chloride concentrations were not detected within the monitoring wells at
the downgradient limits of the contaminant attenuation zone, except at Monitor
32. However, groundwater near Monitor 32 moves into the lower aquifer
through the pits to the south that are within the contaminant attenuation zone.
Within the lower aquifer the groundwater moves back below the landfill site.
Operations at the property west of the landfill modified groundwater flow
conditions around the northwest corner of the landfill (Monitor 6). Construction
of a low permeable clayey barrier was completed in February 2002 to redirect
groundwater to the leachate collector system. Thus, an off-site landfill effect at
this location is not anticipated.
Operation of the leachate collector system is improving groundwater quality at
the landfill site boundary. The system should continue to be operated in 2009.
The contaminant attenuation zone south of the landfill provides sufficient
attenuation capacity for groundwater compliance with Guideline B-7 criteria for
chloride, boron, and vinyl chloride concentrations in the upper aquifer.
The landfill affects groundwater quality within the lower aquifer below the
landfill. Road salting and adjacent land uses also affect groundwater quality
south of the landfill. At the landfill compliance point the lower aquifer
groundwater quality was acceptable and complied with ODWQS and Guideline B-
7 criteria. Vinyl chloride was not detected within the groundwater of the lower
aquifer.
Page 18
LANDFILL SITE NO. 2 2008-2009
ESSEX-WINDSOR SOLID WASTE AUTHORITY 14
Surface water flow within the Fleming-Wigle Drain continued to not be detected
downstream of the soil dyke during 2008.
Landfill gas migration from the landfill was not a concern for residences in 2008.
2009 MONITORING PROGRAM CONCLUSIONS
The 2009 groundwater flow patterns associated with (a) the upper sand unit and
weathered glacial till, and (b) the lower sand unit are consistent with historic
patterns.
Leachate quality within the collector system is typical for closed municipal solid
waste landfill sites in southern Ontario.
There are elevated chloride concentrations in the upper aquifer to the northeast,
northwest, and south of the landfill waste. However, Guideline B-7 criteria were
satisfied at the compliance points during 2009 for chloride and boron
concentrations, except for chloride in April at Monitor 3-III. Groundwater at
Monitor 3-III is induced to move toward the CAZ to the south. Elevated
concentrations east of the landfill continue to be affected by road salting.
Vinyl chloride concentrations were not detected within the monitoring wells at
the downgradient limits of the CAZ, except at Monitor 32. However,
groundwater near Monitor 32 moves into the lower aquifer through the pits to
the south that are within the CAZ. Within the lower aquifer the groundwater
moves back below the landfill site and vinyl chloride was not detected at the
lower aquifer compliance points.
Operations at the property west of the landfill modified groundwater flow
conditions around the northwest corner of the landfill (Monitor 6). Construction
of a low permeable clayey barrier was completed in February 2002 to redirect
groundwater to the leachate collector system. Thus, an off-site landfill effect at
this location is not anticipated.
Page 19
LANDFILL SITE NO. 2 2008-2009
ESSEX-WINDSOR SOLID WASTE AUTHORITY 15
Operation of the leachate collector system is improving groundwater quality at
the landfill site boundary. The system should continue to be operated in 2010.
The contaminant attenuation zone south of the landfill provides sufficient
attenuation capacity for groundwater compliance with Guideline B-7 criteria for
chloride, boron, and vinyl chloride concentrations.
Surface water flow within the Fleming-Wigle Drain continued to not be detected
downstream of the soil dyke during 2009.
Landfill gas migration from the landfill was not a concern for residences in 2009.
5.8 RECOMMENDED CHANGES TO THE MONITORING AND MEASUREMENT
PROGRAMS FOR 2008 AND 2009
RECOMMENDED MODIFICATIONS TO THE 2008 MONITORING PROGRAM
The following modifications to the 2008 monitoring program were recommended:
The operation of the west portion of the collector system should be continued in
2009.
The contaminant attenuation zone south of the landfill should continue to be
used in 2009.
To assist with re-evaluation of elevated chloride concentrations detected at
Monitor 3-III, the use of salt as a de-icer on the site should be reviewed by the
Waste Authority. If chloride concentrations at Monitor 3-III continue to increase
in 2009 an investigation into potential chloride sources should be completed.
Remove water quality testing at Monitor 25-I as there is no longer a direct
hydraulic connection within the lower aquifer from this location to the site.
Continue the water level monitoring to confirm the lower aquifer groundwater
flow direction below the landfill site.
Page 20
LANDFILL SITE NO. 2 2008-2009
ESSEX-WINDSOR SOLID WASTE AUTHORITY 16
As the site is no longer hydraulically connected to the Fleming-Wigle Drain since
the installation of the soil dyke, the continuation of surface water monitoring
after precipitation events is not warranted.
Decommission monitoring wells no longer required for the approved monitoring
program. These monitoring wells should be decommissioned in accordance with
regulations to prevent well damage and impacts to the aquifers.
As methane has not been detected for a number of years, the gas monitoring at
the site should be discontinued.
RECOMMENDED MODIFICATIONS TO THE 2009 MONITORING PROGRAM
The following modifications to the 2009 monitoring program were recommended:
The operation of the west portion of the collector system should be continued in
2010.
The contaminant attenuation zone south of the landfill should continue to be
used in 2010.
To assist with re-evaluation of elevated chloride concentrations detected at
Monitor 3-III, the use of salt as a de-icer on the site should be reviewed by the
Authority. Monitor 3-III will be assessed in 2010 to determine if chloride
concentrations should be investigated further.
Remove water quality testing at Monitor 25-I as there is no longer a direct
hydraulic connection within the lower aquifer from this location to the site.
Continue the water level monitoring to confirm the lower aquifer groundwater
flow direction below the landfill site.
As the site is no longer hydraulically connected to the Fleming-Wigle Drain since
the installation of the soil dyke, the continuation of surface water monitoring
after precipitation events is not warranted.
Page 21
LANDFILL SITE NO. 2 2008-2009
ESSEX-WINDSOR SOLID WASTE AUTHORITY 17
Decommission monitoring wells no longer required for the approved monitoring
program. These monitoring wells should be decommissioned in accordance with
regulations to prevent well damage and impacts to the aquifers.
As methane has not been detected for a number of years, the gas monitoring at
the site should be discontinued.
MR. ELI MAODUS
General Manager
____________________________
MR. RALPH REISER
Waste Disposal Manager
______________________________
Page 22
Appendix A ________________________________________________________________________
Post Closure Maintenance and Inspection Reports for the years 2008 and 2009
Page 23
Margaret
Typewritten Text
Landfill Supervisor
Margaret
Typewritten Text
First Quarter 2008
Page 24
Margaret
Typewritten Text
Landfill Supervisor
Margaret
Typewritten Text
Second Quarter 2008
Page 25
Margaret
Typewritten Text
Third Quarter 2008
Margaret
Typewritten Text
Landfill Supervisor
Page 26
Margaret
Typewritten Text
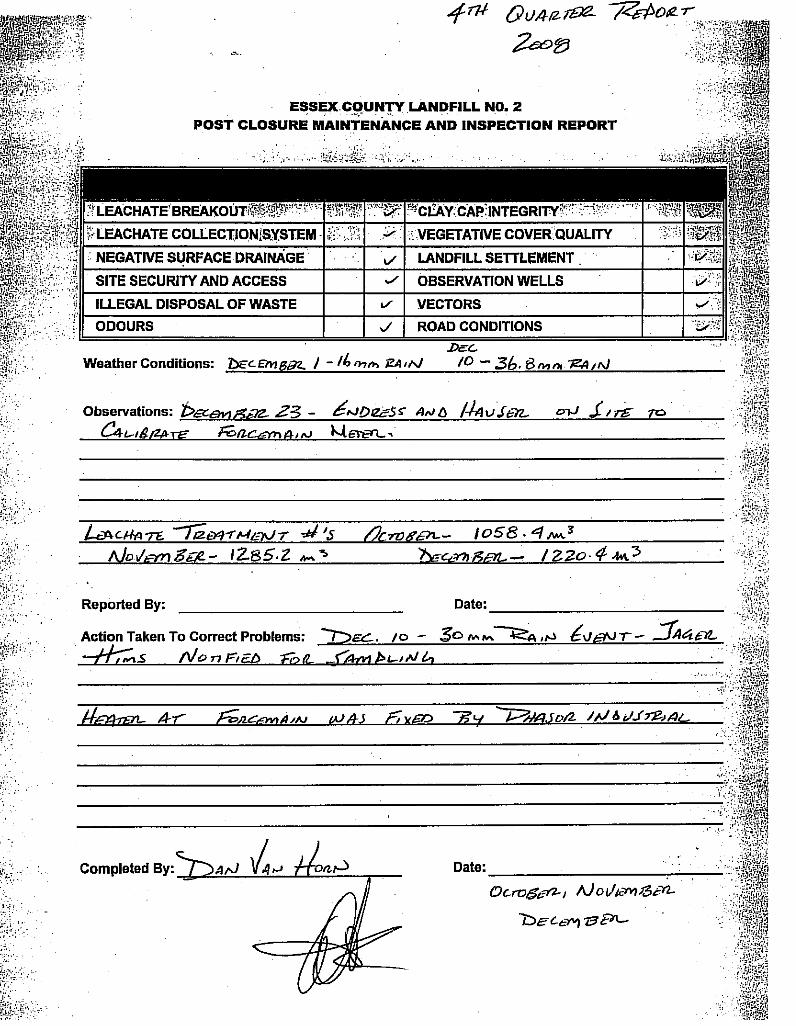
Fourth Quarter 2008
Margaret
Typewritten Text
Landfill Supervisor
Page 27
Margaret
Typewritten Text
First Quarter 2009
Margaret
Typewritten Text
Landfill Supervisor
Page 28
Margaret
Typewritten Text
Second Quarter 2009
Margaret
Typewritten Text
Landfill Supervisor
Page 29
Margaret
Typewritten Text
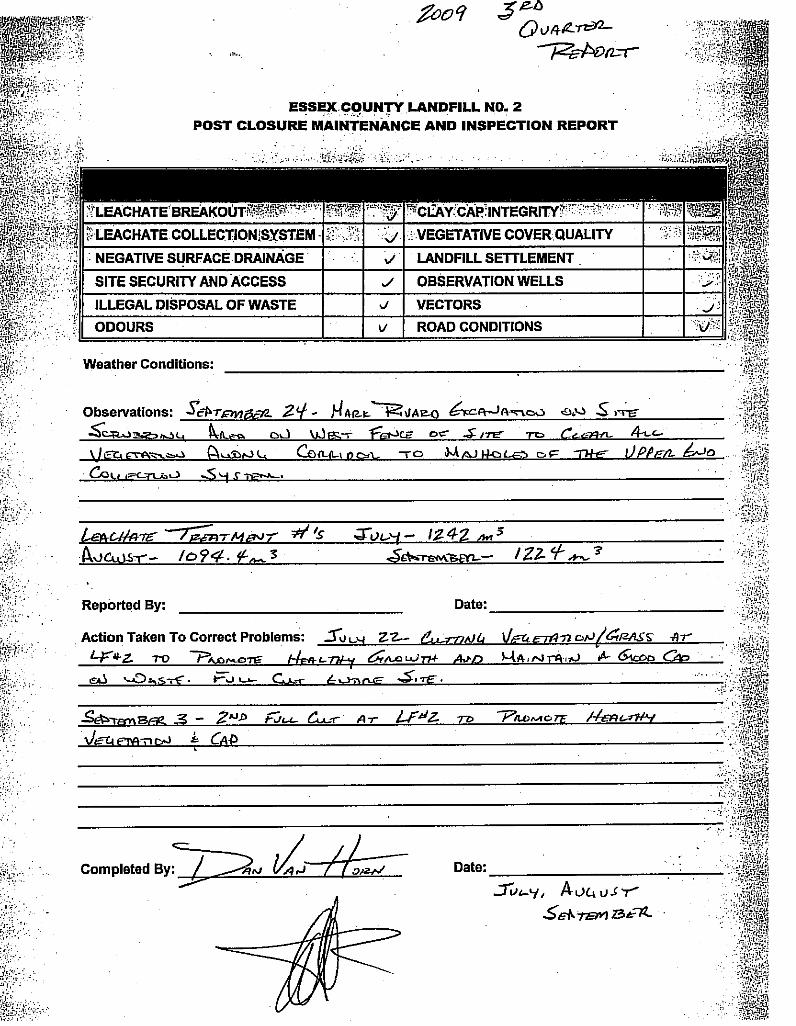
Third Quarter 2009
Margaret
Typewritten Text
Landfill Supervisor
Page 30
Margaret
Typewritten Text
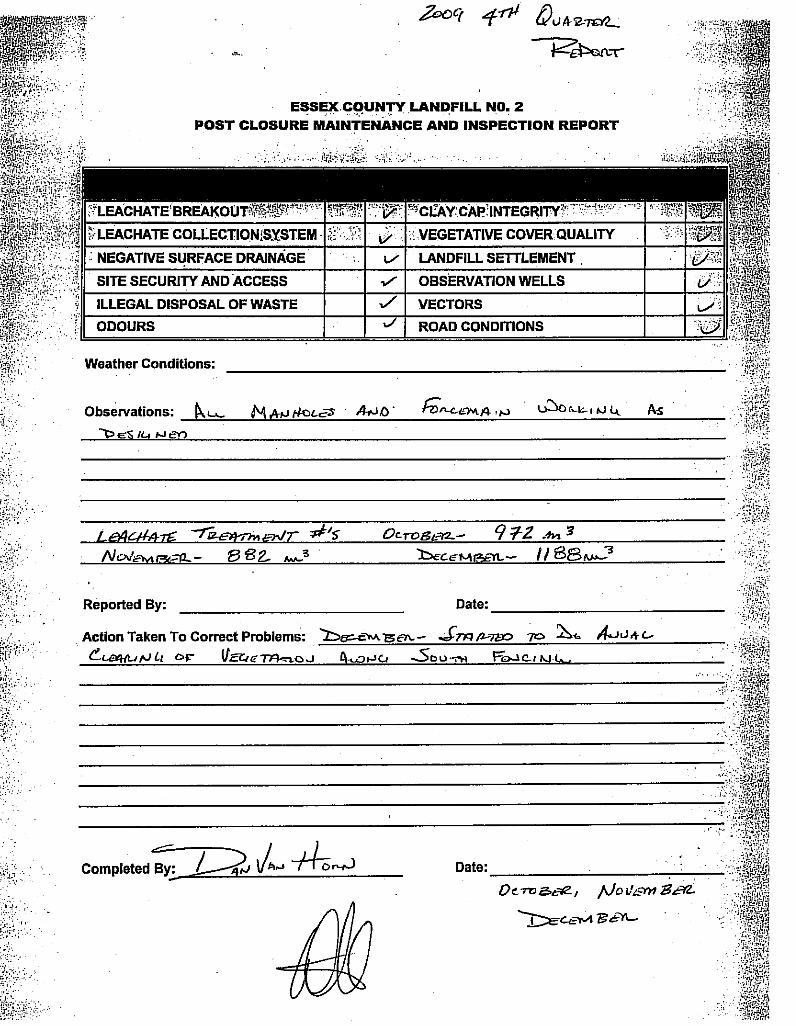
Fourth Quarter 2009
Margaret
Typewritten Text
Landfill Supervisor
Page 31
Appendix B ________________________________________________________________________
1992–1998 Leachate Quality (MH7)
Historical Leachate Quality At Manhole 6 (1999 – 2007)
Historical Leachate Quality At Manhole 8 (1999-2007)
Figure: Leachate Analysis for MH7
Figure: Leachate Analysis for MH6
Figure: Leachate Analysis for MH8
Page 32
LANDFILL SITE NO. 2 BIENNIAL REPORT 2008-2009
APPENDIX B
TABLE: 1992–1998 LEACHATE QUALITY (MH7)
Group Parameter Apr-92 Aug-92 Oct-92 Apr-93 Aug-93 Oct-93 Apr-94 Aug-94 Oct-94 Apr-95 Aug-95 Oct-95 Apr-96 Oct-96 Mar-97 Oct-97 Apr-98 Oct-98
16 Vinyl Chloride (ug/l) - - 506.00 30.20 28.40 ND 14.00 ND 55.00 ND 72.50 99.60 ND 61.60 8.30 5.40 3.00 <2.50
17 Benzene (ug/l) 2.05 ND ND ND ND ND TR ND ND 10.60 ND ND ND ND 1.20 1.00 0.50 0.50
Toluene (ug/l) 12.10 33.60 1.60 5.20 ND ND ND ND ND 0.66 0.30 ND ND ND ND 4.10 <0.20 5.60
O-Xylene/Styrene (ug/l) 3.11 ND ND ND ND ND 1.00 3.10 ND 0.83 ND ND ND ND ND 1.80 0.70 5.70
M & P Xylenes (ug/l) 7.34 ND ND 2.50 ND ND 1.60 1.30 ND 1.60 0.30 ND ND ND ND 4.10 0.50 14.30
Ethylbenzene (ug/l) - - - 2.70 ND ND ND ND ND 4.41 ND ND ND ND ND 1.80 <0.20 4.70
ND = Below Detection Limits mg/l = Parts Per MillionNA = Not Analyzed ug/l = Parts Per Billion- = Not detected ng/l = Parts Per Trillion
Page 33
LANDFILL SITE NO. 2 BIENNIAL REPORT 2008-2009
APPENDIX B
HISTORICAL LEACHATE QUALITY AT MANHOLE 6 (1999 – 2007)
Parameter MH 6 mg/L (unless indicated otherwise)
APR 21/99
APR 7/00
OCT 19/00
APR 09/01
OCT 12/01
APR 2/02
OCT 17/02
APR 4/03
OCT 31/03
APR 5/04
OCT 10/04
APR 7/05
OCT 7/05
APR 27/06
OCT 10/06
APR 4/07
OCT 25/07
Benzene 0.3 0.4 <0.8 <0.1 <2.0 0.5 1.4 <0.4 <0.2 <0.8 1.2 0.6 <0.1 0.5 <0.5 0.6 NR
Ethyl benzene 0.4 <0.4 <1.6 <0.2 <4.0 <0.4 <0.1 <0.4 <0.2 <0.8 <0.2 <0.5 <0.1 <0.5 <0.5 <0.5 NR
Toluene 0.4 <0.4 <1.6 <0.2 <4.0 <0.4 <0.2 <0.8 <0.4 <1.6 <0.4 <1 <0.2 <0.5 1.2 <0.5 NR
O-xylene 0.4 <0.4 <1.6 <0.2 <4.0 <0.4 <0.1 <0.4 <0.2 <0.8 <0.2 <0.5 <0.2 <0.5 <0.5 <0.5 NR
M,P-xylene 1.1 <0.4 <1.6 <0.2 <4.0 <0.4 <0.1 <0.4 <0.2 <0.8 <0.2 <0.5 <0.2 <1.0 <1.0 <1.0 NR
Vinyl Chloride (ug/L) 12.0 76.3 77.5 10.9 141.0 31.8 19.4 35.2 16.3 48.9 78.1 34.9 149.0 12.5 5.8 43.6 59.6
pH (pH units) 7.24 6.97 7.04 7.53 7.15 7.05 7.21 7.43 7.97 7.53 7.48 7.26 7.89 INS 7.97 7.84 NR
Chloride 170 196 252 120 234 181 307 272 199 173 233 232 177 248 135 164 112.0
Ammonia NA 51.8 30.2 33.5 43.4 71.9 134.0 59.1 29.7 52.9 73.1 111.0 60.0 109.0 31.3 75.9 NR
TKN 47.9 50.0 29.9 30.3 56.8 68.6 140.0 67.0 31.0 49.6 95.0 109.0 58.1 99.0 32.9 79.0 NR
Boron 0.41 0.49 0.39 0.28 0.47 0.48 1.00 0.51 0.46 0.51 1.11 0.65 0.63 0.80 0.42 0.66 0.48
Phenols 0.001 0.001 — BDL BDL BDL BDL BDL BDL 0.001 BDL 0.001 BDL <0.001 <0.001 <0.001 NR
Potassium 63.2 63.0 50.0 35.0 45.0 57.0 94.0 69.0 43.0 53.0 161.0 70.0 54.0 86.0 54.0 62.0 NR
DOC 14.5 11.8 6.9 8.9 15.9 12.3 27.5 14.1 8.0 11.1 16.9 16.6 12.3 39.1 11.3 14.9 NR
Note: * indicates trace level is less than Estimated Quantitation Limit and greater than the Method Detection Limit. NR – denotes not required per September 25, 2007 C of A No. A011401
Page 34
LANDFILL SITE NO. 2 BIENNIAL REPORT 2008-2009
APPENDIX B
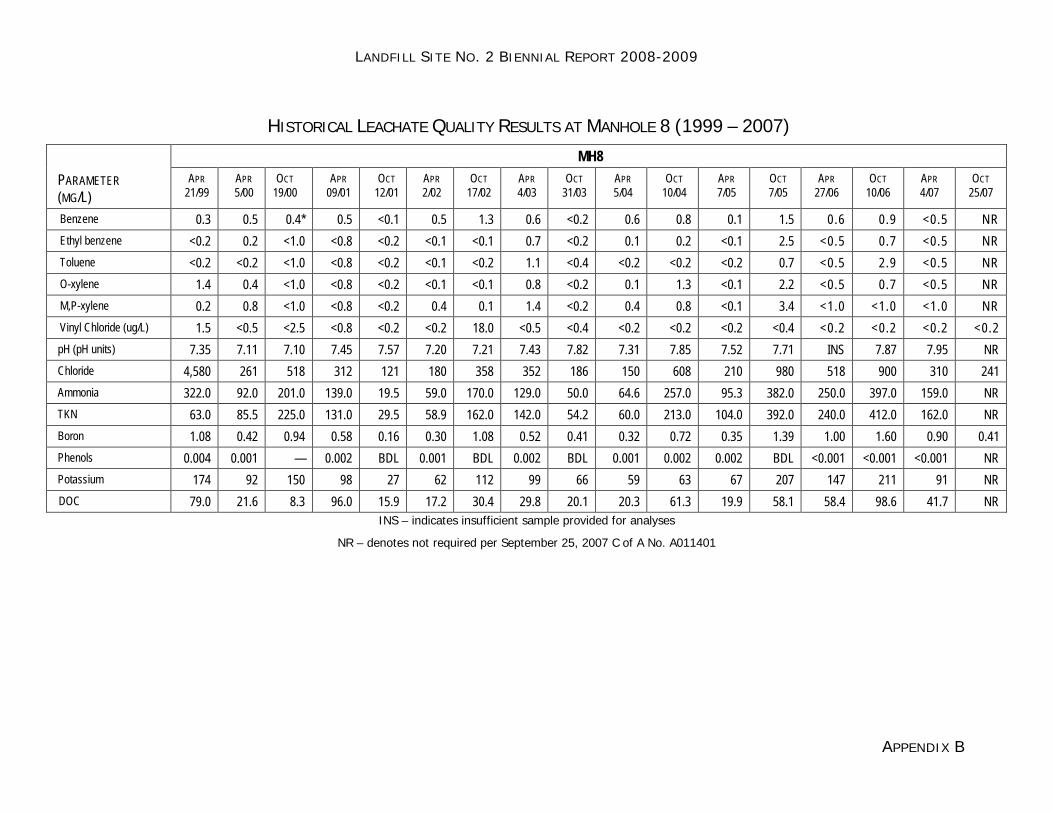
HISTORICAL LEACHATE QUALITY RESULTS AT MANHOLE 8 (1999 – 2007)
MH8
PARAMETER (MG/L)
APR 21/99
APR 5/00
OCT 19/00
APR 09/01
OCT 12/01
APR 2/02
OCT 17/02
APR 4/03
OCT 31/03
APR 5/04
OCT 10/04
APR 7/05
OCT 7/05
APR 27/06
OCT 10/06
APR 4/07
OCT 25/07
Benzene 0.3 0.5 0.4* 0.5 <0.1 0.5 1.3 0.6 <0.2 0.6 0.8 0.1 1.5 0.6 0.9 <0.5 NR Ethyl benzene <0.2 0.2 <1.0 <0.8 <0.2 <0.1 <0.1 0.7 <0.2 0.1 0.2 <0.1 2.5 <0.5 0.7 <0.5 NR Toluene <0.2 <0.2 <1.0 <0.8 <0.2 <0.1 <0.2 1.1 <0.4 <0.2 <0.2 <0.2 0.7 <0.5 2.9 <0.5 NR O-xylene 1.4 0.4 <1.0 <0.8 <0.2 <0.1 <0.1 0.8 <0.2 0.1 1.3 <0.1 2.2 <0.5 0.7 <0.5 NR M,P-xylene 0.2 0.8 <1.0 <0.8 <0.2 0.4 0.1 1.4 <0.2 0.4 0.8 <0.1 3.4 <1.0 <1.0 <1.0 NR Vinyl Chloride (ug/L) 1.5 <0.5 <2.5 <0.8 <0.2 <0.2 18.0 <0.5 <0.4 <0.2 <0.2 <0.2 <0.4 <0.2 <0.2 <0.2 <0.2 pH (pH units) 7.35 7.11 7.10 7.45 7.57 7.20 7.21 7.43 7.82 7.31 7.85 7.52 7.71 INS 7.87 7.95 NR Chloride 4,580 261 518 312 121 180 358 352 186 150 608 210 980 518 900 310 241 Ammonia 322.0 92.0 201.0 139.0 19.5 59.0 170.0 129.0 50.0 64.6 257.0 95.3 382.0 250.0 397.0 159.0 NR TKN 63.0 85.5 225.0 131.0 29.5 58.9 162.0 142.0 54.2 60.0 213.0 104.0 392.0 240.0 412.0 162.0 NR Boron 1.08 0.42 0.94 0.58 0.16 0.30 1.08 0.52 0.41 0.32 0.72 0.35 1.39 1.00 1.60 0.90 0.41 Phenols 0.004 0.001 — 0.002 BDL 0.001 BDL 0.002 BDL 0.001 0.002 0.002 BDL <0.001 <0.001 <0.001 NR Potassium 174 92 150 98 27 62 112 99 66 59 63 67 207 147 211 91 NR DOC 79.0 21.6 8.3 96.0 15.9 17.2 30.4 29.8 20.1 20.3 61.3 19.9 58.1 58.4 98.6 41.7 NR
INS – indicates insufficient sample provided for analyses
NR – denotes not required per September 25, 2007 C of A No. A011401
Page 35
LANDFILL SITE NO. 2 BIENNIAL REPORT 2008-2009
APPENDIX B
Leachate Analysis for Manhole 7 (MH7)
0
100
200
300
400
500
600
Apr-94 Aug-94 Oct-94 Apr-95 Aug-95 Oct-95 Apr-96 Oct-96 Mar-97 Oct-97 Apr-98 Oct-98
mg/
l
DOC Cl NH3 TKN
Refer to narrative in Section 4.2
Page 36
LANDFILL SITE NO. 2 BIENNIAL REPORT 2008-2009
APPENDIX B
Leachate Analysis for Manhole 6 (MH6)
0
100
200
300
400
500
600
Apr-99 Apr-00 Oct-00 Apr-01 Oct-01 Apr-02 Oct-02 Apr-03 Oct-03 Apr-04 Oct-04 Apr-05 Oct-05 Apr-06 Oct-06 Apr-07 Oct-07
mg/
l
DOC Cl NH3 TKN
Refer to narrative in Section 4.2
Page 37
LANDFILL SITE NO. 2 BIENNIAL REPORT 2008-2009
APPENDIX B
Leachate Analysis for Manhole 8 (MH8)
0
100
200
300
400
500
600
700
800
900
1000
Oct-99 Apr-00 Oct-00 Apr-01 Oct-01 Apr-02 Oct-02 Apr-03 Oct-03 Apr-04 Oct-04 Apr-05 Oct-05 Apr-06 Oct-06 Apr-07 Oct-07
mg/
l
DOC Cl NH3 TKN
Refer to narrative in Section 4.2
Page 38
Appendix C ________________________________________________________________________
Annual Monitoring Reports for 2008 and 2009 prepared by Genivar Consultants L.P. are available under separate cover.
Page 39
Appendix D ________________________________________________________________________
Landfill Site No. 2 Site Plan
Page 40
ESSEX-WINDSOR SOLID WASTE AUTHORITY APPENDIX D: Landfill Site No. 2 Site Plan