Page 1
1
LANDFIRE Product Descriptions with References
March 2019
LANDFIRE Product Descriptions with References
Reference
LANDFIRE Reference Database
The LANDFIRE (LF) National (LF 1.X) LF Reference Database (LFRDB) includes vegetation and fuel data
from approximately 800,000 geo- referenced sampling units throughout the United States (U.S.).
These data are amassed from numerous sources and in large part from existing information resources
of outside entities, such as the U.S. Department of Agriculture (USDA) Forest Service (USFS) Forest
Inventory and Analysis (FIA) Program, the U.S. Geological Survey (USGS) National Gap Analysis
Program (GAP), and state natural heritage programs.
Vegetation data drawn from these sources and used by LF include natural community occurrence
records, estimates of canopy cover and height per plant taxon, and measurements (such as diameter,
height, crown ratio, crown class, and density) of individual trees. Fuel data used include biomass
estimates of downed woody material, percentage cover and height of shrub and herb layers, and
canopy base height estimates. Digital photos of the sampled units are archived when available.
Toney and others (2007) explain in detail how these types of field data, specifically those collected by
the FIA, have been acquired and incorporated into the LFRDB and used in LF. Several key attributes
are systematically derived from the acquired data and included in the LFRDB. These attributes include
existing and potential vegetation type in the form of NatureServe's Ecological Systems (Comer and
others 2003; Toney and others 2007), uncompacted crown ratios (Toney and Reeves 2009), and
several canopy fuel metrics (such as bulk density) derived from the FuelCalc program (Reinhardt and
others 2006).
Records were carefully screened for information or spatial errors. Accepted data points were
processed for associations with ancillary data via a series of spatial overlays, including unlimited
access to the Landsat archive, the National Land Cover Database (NLCD, Homer and others 2004), the
digital elevation model and derivatives (USGS 2005), soil depth and texture layers (for example, USDA
Natural Resources Conservation Service (NRCS) 2005), and a set of 42 simulated biophysical gradient
layers (such as evapotranspiration, soil temperature, and degree days). These biophysical gradient
layers were generated using WX-BGC, an ecosystem simulator derived from BIOME-BGC (Running and
Hunt 1993) and GMRS-BGC (Keane and others 2002). Extracted values from each of these overlays
are archived in the LFRDB as predictor variables for LF mapping.
For LF Remap (LF 2.0), new and updated plot information are being compiled and used to inform
Page 2
2
LANDFIRE Product Descriptions with References
existing vegetation mapping. The entire LF Remap Public LFRDB will be made available for download
at the completion the LF Remap effort, expected in mid to late 2020.
Public Events Geodatabase
The LF National (LF 1.X) Public Events Geodatabase is a collection of recent natural disturbance and
land management activities used to update existing vegetation and fuel layers during LF Program
deliverables. Public Events exclude proprietary and/or sensitive data.
This geodatabase includes three feature classes - Raw Events, Model Ready Events, and Exotics. The
Public Raw and Model Ready Event feature classes include natural disturbance and vegetation/fuel
treatment data. The Public Exotics feature class contains data on the occurrence of exotic or invasive
plant species. There is also a look up table for the source code (lutSource_Code), an attribute found in
all three feature classes. The source code is an LF internal code assigned to each data source. Consult
the table “lutSource_Code” in the geodatabases for more information about the data sources included
in, and excluded from, releases.
The data compiled in the three feature classes are collected from disparate sources including federal,
state, local, and private organizations. All data submitted to LF are evaluated for inclusion into the LF
Events geodatabase. Acceptable Event data must have the following minimum requirements to be
included in the Events geodatabase:
1) be represented by a polygon on the landscape and have a defined spatial coordinate system
2) have an acceptable event type (Appendix B) or exotics plant species
3) be attributed with year of occurrence or observation of the current data call.
For LF Remap (LF 2.0), this collection of treatments on the landscape is being compiled and events are
being produced for the years 2015 and 2016. These polygons are being used to inform Annual
Disturbance products for LF Remap. The entire LF Events Geodatabase will be released to the public
at the end of the LF Remap effort, expected in mid to late 2020.
Forest Vegetation Simulator Ready Database (FVSRDB)
A public version of the LF National (LF 1.X) FVSRDB is available containing attributes for Forest
Vegetation Simulator (FVS) simulations. The Public FVSRDB includes plot level data for all FVS variants
nationwide. All data were collected from the LFRDB and contain no proprietary and/or sensitive
information.
Data archived in the Public FVSRDB includes predefined input tables used for initializing stand/plot
information (StandInit and TreeInit tables).
Page 3
3
LANDFIRE Product Descriptions with References
Disturbance
Annual Disturbance - 1999-Current Year (DistYear)
DistYear products reflect change on the landscape caused by management activities and natural
disturbance, providing temporal and spatial information related to landscape change.
LF National (LF 1.X) DistYear products were developed through a multistep process using varied
geospatial datasets to identify and label changes in vegetation cover. This process utilized Landsat
change detection methods; Landsat-derived indices (e.g., Normalized Difference Vegetation Index
(NDVI) and Difference Normalized Burn Ratio (dNBR)); disturbance Event perimeters; fire severity and
extent mapping from Monitoring Trends in Burn Severity (MTBS), Burned Area Reflectance
Classification (BARC), and Rapid Assessment of Vegetation Condition after Wildfire (RAVG) fire
mapping; Protected Area Database (PAD) ownership data; and Burned Area Essential Climate Variable
(BAECV) data.
MTBS, BARC, and RAVG data provided extent, cause, and severity of fire-related disturbance. Event
perimeters collected from local, state, and federal agencies, along with other cooperators were
integrated into the LF Events Geodatabase. They were processed by disturbance type priority and
rasterized to provide disturbance-specific causality. PAD data provided management-level
information and BAECV offered a possible causality to disturbances detected using processed Landsat
imagery.
Disturbances not identified by Events or fire mapping efforts were mapped by processing Landsat
best- pixel image composite tiles (98 tiles covering the contiguous U.S. and 4 tiles covering Hawaii.)
Image tiles were also created for selected areas to address MTBS gap filling in Alaska.
Change was primarily identified using the Multi-Index Integrated Change Algorithm (MIICA) methods
(Jin, et. al. 2013). This process identified changed pixels. Landsat-derived dNBR provided an estimate
of severity for all changed pixels including LF Events and were also used to mitigate the Landsat 7
Scan Line Corrector (SLC)-off and cloud gap issues within the MTBS datasets. These data and
additional Landsat scenes were used in combination to create regression-based models. In areas
where modeling could not be used a 12x12 focal majority process was used to fill MTBS data gaps.
The final disturbance products are grid files, defined by year (i.e., 2013, 2014). Disturbance raster
attributes include; year, type (causality, if known), severity (low, medium, and high), data source(s),
and additional attributes associated with causality and severity confidence.
Starting in LF ReMap (LF 2.0), a varied approach was adopted to more accurately represent
disturbances within the Fuels environment. To ensure disturbance data were correctly utilized in this
process, a series of collaboration meetings (Reference, Disturbance, Vegetation and Fuels Teams)
were held reviewing the suite of disturbance data components. From these discussions three
Page 4
4
LANDFIRE Product Descriptions with References
adjustments were implemented prior to HDist/FDist development: disturbance attribute assignment
updates, use/not use logic updates, and development of a disturbance hierarchy for multiple
disturbance entries.
LF Remap DistYear products are attributed with disturbance type and severity and used to inform and
update LF vegetation and fuel products. The final Annual Disturbance products depict disturbances
that occurred in that year. Disturbance attribute information is provided by cooperators from local,
state, and federal agencies, private organizations, as well as national fire mapping programs (e.g.,
MTBS). These data offered information regarding the location, extent, and type of disturbances and
were consolidated into the LF Events Geodatabase.
Landsat image-based change detection was used to locate disturbances not included in the LF Events
Geodatabase or provided by other fire mapping programs. It also provided an estimate of severity for
both satellite-based change and LF Events. Landsat imagery for two seasons (centered near June
24/25 and September 7/8) spanning four years (e.g., 2014, 2015, 2016, 2017) were processed into
best-pixel composite images (98 tiles covering the conterminous U.S., each composite a nominal tile
size of 10,000 x 10,000 pixels, and 4 tiles of varying size covering the Hawaiian Islands). No image-
based change detection was performed for Alaska.
The image composites were used to create vegetation indices (i.e., Normalized Difference Vegetation
Index (NDVI) and Normalized Burn Ratio (NBR)) and other derivatives which serve as inputs into
MIICA. The MIICA outputs and differenced products (e.g., dNDVI) and dNBR) were used by image
analysts to identify where change was located on the landscape. Classification and regression
modelling were also used to identify disturbances.
Fire severity and extent disturbances were sourced from MTBS, BARC, and RAVG programs. Any no-
data gaps caused by clouds, water, or Landsat 7 SLC-off artifacts were filled using spectral modeling
techniques utilizing Landsat image composites as input. The result was continuous and consistent
severity and extent information for fire scars. In rare cases where modeling is ineffective at filling
gaps, a 13x13 focal majority filter was used. Smaller fires were identified using the BAECV product
and included as determined by the analyst.
Causality and severity information assigned to a disturbance was prioritized by the data source.
Highest priorities came from fire mapping programs (i.e., MTBS, BARC, RAVG), followed by the LF
Event Geodatabase descriptions, and lastly, Landsat image-based change detection. Additional
attribution was provided by BAECV where identified disturbances that intersect BAECV detections
were assigned a fire causality. PAD information helped determine remaining causality assignments.
Page 5
5
LANDFIRE Product Descriptions with References
Vegetation Disturbance (VDist)
LF National (LF 1.X) VDist products are
composites of DistYear products for the
previous 10 years. Disturbances were grouped
by disturbance type, or cause, (i.e. fire or
mechanical treatment), disturbance severity
(Low, Moderate, or High), and time since
disturbance. These combinations of type,
severity, and time since disturbance were used
to inform LF vegetation transitions and to
update existing vegetation products (Type, Cover, and Height) for disturbances on the landscape. Fire
occurrences were assumed to be the most impactful and take precedence, followed by the more
recent disturbances taking precedence for a given location.
To leverage disturbance data within the fuel’s environment for LF Remap (LF 2.0), an updated VDist
product was developed called Historical Disturbance (HDist). HDist replaces VDIST in LF Remap.
Fuel Disturbance (FDist)
LF National (LF 1.X) FDist products are composites of the latest 10 years of DistYear products
representing disturbance year and original disturbance code to meet LF fuel mapping needs and
serve as input to the LF Total Fuel Change Tool (LFTFC). The product development involves a
comprehensive review of disturbance attributes. and does not include chemical, biological, or
development disturbances. Filtering to remove logically inconsistent disturbance/EVT combinations
such as insect and disease within herbaceous landscapes was implemented. Fire occurrences take
precedence, followed by the most recent disturbance.
Developed for FDist, the Use/Not Use Disturbance logic was developed to check for logical
inconsistencies between disturbance types and the underlying vegetation. (i.e. If a fire disturbance
falls within a body of water). If a discrepancy was found, the disturbance was flagged and removed
from the FDist data layer. For LF ReMap (LF 2.0), development included updating/adding additional
disturbance logic checks related to: lifeform, shrub-mastication and insect & disease to ensure logical
inconsistencies would not persist between disturbance type and vegetation lifeform or type:
• Lifeform Use/Not Use - limits disturbances to logical vegetation lifeforms
• Shrub Mastication Use/Not Use - limits mastication in shrubs to commonly masticated existing vegetation types
• Insect & Disease Use/Not Use - limits insect & disease disturbances to existing vegetation types affected by bug infestations (conifer species) or disease mortality
Page 6
6
LANDFIRE Product Descriptions with References
FDist is a refinement of VDist in LF 1.X products and is a refinement of Historical Disturbance in LF
Remap (LF 2.0) to more accurately represent disturbance scenarios within the fuels’ environment.
Historical Disturbance (HDist)
New with LF Remap (LF 2.0) the HDist product uses the latest 10 years of DistYear data (and attribute
code system) to identify disturbance year, type, and severity, representing the history of disturbance
for a 10-year span. HDist development involves a comprehensive review of fuel and disturbance
attribute assignments, use/not use scenarios and the development of a disturbance hierarchy. Each
year’s disturbance scenarios were checked against time relevant LF vegetation to check for logical
inconsistencies. Errant disturbance codes were flagged and updated to a discard code with the
remaining disturbance codes cross walked to FDist codes.
HDist replaces VDist from previous LF versions incorporating pre-disturbance vegetation logic (based
on disturbance year and vegetation type).
Vegetation Transition Magnitude (VTM)
The LF National (LF 1.X) VTM represents the relative magnitude of change applied to a pixel during
the LF vegetation updating process and provides information regarding disturbance type and the
resulting impact on vegetation life-form or tree canopy cover through LF 2014. Information about the
disturbance type and the resulting change to vegetation life-form or tree canopy cover were used to
characterize this change. VTM was generated concurrent with the updating process using tables and
a series of database queries on a spatial overlay of vegetation and disturbance raster data. To keep LF
vegetation products current, subsequent versions of these data were updated with mapped
occurrences of known disturbance and severity. The mapping process integrates disturbances
mapped using remote sensing of landscape change paired with user contributed polygons with
management activities over a two-year period.
The effect of these disturbances on the vegetation were modeled or predicted using a series of tables
that link pre-disturbance Existing Vegetation Type (EVT), Existing Vegetation Height (EVH), and
Existing Vegetation Cover (EVC), and a range of possible disturbance types and severities with post-
disturbance EVT, EVH, and EVC. For forested vegetation, these tables were informed by computer
simulations in the Forest Vegetation Simulator (FVS - www.fs.fed.us/fmsc/fvs/) while non-forest
vegetation were informed by a series of simple rule-sets generated heuristically for each individual
map zone. Final updating occurred when the tables were linked with a spatial overlay of vegetation
and mapped occurrences of disturbance and used to assign EVT, EVH, and EVC. Finally, a unique code
was assigned to all pixels that associate them with a disturbance type as well as categories of change
magnitude expressed either in a change in vegetation life-form or a change in tree cover.
Page 7
7
LANDFIRE Product Descriptions with References
Forest Vegetation Transition Database (FVTDB)
The LF National (LF 1.X) FVTDB contains information that describes post-disturbance vegetation
changes. The forest vegetation was described by EVT, EVH, and EVC. Information archived in the
FVTDB includes the disturbance tables and tools to summarize and sort post disturbance vegetation
transitions resulting from FireData, Mechanical, Insects Disease, and Windthrow.
Non-forest Vegetation Transition Database (NFVTDB)
The LF National (LF 1.X) NFVTDB contains information that describes both post-disturbance
vegetation changes and vegetation changes resulting from succession without disturbance. The non-
forest vegetation is described by EVT, EVC, and EVH. Information archived in the NVSTDB includes the
disturbance and no disturbance data tables and tools to summarize and sort post disturbance
vegetation transitions.
Forest Vegetation Simulator Disturbance Database (FVSDDB)
A public version of the LF National (LF 1.X) FVSDDB is available containing FVS disturbance simulation
outputs. The database contains no proprietary and/or sensitive information and is derived from FVS
analysis of the FVSRDB. The Public FVSDDB includes disturbance analysis outputs covering all FVS
Variants at multiple severities and time-steps.
Outputs archived in the Public FVSDDB include
predefined outputs used for stand/plot
analysis post disturbance using the STANDSQL
keyword in FVS.
More detailed output data descriptions can be
found in the Essential FVS Guide.
Page 8
8
LANDFIRE Product Descriptions with References
Vegetation
Existing Vegetation Type (EVT)
LF National (LF 1.X) EVT products represent the species composition currently present at a given site.
LF vegetation map units were derived from NatureServe’s Ecological Systems classification, which is a
nationally consistent set of mid-scale ecological units (Comer and others 2003). Existing vegetation
was mapped through a predictive modeling approach using a combination of field reference
information, Landsat imagery, and spatially explicit biophysical gradient data.
Field data keyed to dominant vegetation type at the plot level were used as "training data" to drive
the modeling process. Attribute information linked the LF EVT map units to existing classifications
such as the U.S. National Vegetation Classification System (USNVC)and those of the Society of
American Foresters and Society for Range Management.
LF Remap (LF 2.0) EVT products represent the current distribution of the terrestrial ecological systems
classification developed by NatureServe for the western hemisphere.
LF Remap EVT includes ruderal or semi-natural vegetation types within the USNVC and were mapped
using decision tree models informed by field reference data, Landsat imagery, elevation/topographic
and biophysical gradient inputs. The models were developed separately for each life-form including
tree, shrub, herbaceous, and sparse vegetation and were generated for each Environmental
Protection Agency (EPA) Level III Ecoregion.
Riparian, alpine, sparse, and other site-specific EVTs were constrained by predetermined masks.
Urban and developed areas were derived from the NLCD, whereas agricultural lands originate from
the Cropland Data Layer (CDL) and Common Land Unit (CLU) database. Developed ruderal classes
were identified by combining wildland-urban-interface (WUI) data with population density
information from the U.S. Census Bureau. The final EVT product was reconciled through QA/QC
measures to ensure life-form is synchronized with both EVC and EVH.
Disturbance data were included in LF Remap products to describe areas on the landscape that
experienced change within the previous 10-year period. Among the 18 types of disturbances mapped
were fire, timber harvest, weather-driven events, and insect and disease. Final disturbance products
contain data assembled from remotely sensed land change products, MTBS program data, and the LF
Events Geodatabase.
National Vegetation Classification (NVC)
New with LF Remap (LF 2.0), the NVC product represents the current distribution of vegetation
groups within the USNVC. Groups within the NVC hierarchy are defined as combinations of relatively
narrow sets of diagnostic plant species, including dominants and co-dominants, broadly similar
Page 9
9
LANDFIRE Product Descriptions with References
composition, and diagnostic growth forms. NVC groups were mapped using decision tree models
informed by field reference data, Landsat imagery, elevation/topographic and biophysical gradient
inputs. The models were developed separately for each life-form including tree, shrub, herbaceous,
and sparse vegetation. Models were generated for each individual EPA Level III Ecoregion. Riparian,
alpine, sparse, and other site-specific EVTs were constrained by predetermined masks.
Urban and developed areas were derived from the NLCD, whereas agricultural lands originate from
the CDL and CLU database. Developed ruderal classes were identified by combining WUI data with
population density information from the US Census Bureau. The final NVC Groups product was
reconciled through QA/QC measures to ensure life-form is synchronized with both EVC and EVH.
Disturbance data were included in LF Remap products to describe areas that experienced change
within the previous 10-year period. Among the 18 types of disturbances mapped were fire, timber
harvest, weather-driven events, and insect and disease. Final disturbance products contain data
assembled from remotely sensed land change products, MTBS, and the LF Events Geodatabase
Existing Vegetation Cover (EVC)
The LF National (LF 1.X) EVC products represent the vertically projected percent cover of the live
canopy layer for a 30-m grid cell. EVC was generated using a predictive modeling approach that
related Landsat imagery and spatially explicit biophysical gradients to calculated values of average
canopy cover from field training sites and digital orthophoto quadrangles.
LF Remap (LF 2.0) EVC products depict percent canopy cover by life-form and is an important input to
other LF mapping efforts. Canopy cover was modeled separately for tree, shrub, and herbaceous life-
forms. Lidar observations, FIA program plot data, multi-temporal Landsat imagery, vegetation indices,
and other geospatial data sets were used to inform regression-tree models. Rule-based predictive
models were used to generate life-form-specific cover classes. These model outputs were then
merged into a single existing cover product. The EVC product was reconciled through QA/QC
measures to ensure life-form is synchronized with both EVH and EVT products.
Disturbance data were included in LF Remap products to describe areas that experienced change
within the previous 10-year period. Among the 18 types of disturbances mapped were fire, timber
harvest, weather-driven events, and insect and disease. Final disturbance products contain data
assembled from remotely sensed land change products, MTBS, and the LF Events Geodatabase.
Existing Vegetation Height (EVH)
LF National (LF1.X) EVH products represent the average height of the dominant vegetation for a 30-m
grid cell. EVH was generated using a predictive modeling approach that related Landsat imagery and
spatially explicit biophysical gradients to calculated values of average dominant height from field
training sites.
Page 10
10
LANDFIRE Product Descriptions with References
LF Remap (LF 2.0) EVH products depict the canopy height by life-form and serves as a primary input
to other LF products. Canopy height was modeled separately for tree, shrub, and herbaceous life-
forms. Lidar observations, USFS FIA program plot data, multi-temporal Landsat imagery, vegetation
indices, and other geospatial data sets were used to inform regression-tree models. Rule-based
predictive models were used to generate life-form-specific height classes. These model outputs were
then merged into a single existing height product. The EVH product was reconciled through QA/QC
measures to ensure life-form is synchronized with EVC and EVT products.
Disturbance data were included in LF Remap products to describe areas that experienced change
within the previous 10-year period. Among the 18 types of disturbances mapped were fire, timber
harvest, weather-driven events, and insect and disease. Final disturbance products contain data
assembled from remotely sensed land change products, MTBS, and the LF Events Geodatabase.
Biophysical Settings (BPS)
LF National (LF 1.X) BPS products represent the vegetation that may have been dominant on the
landscape prior to Euro-American settlement and was based on both the current biophysical
environment and an approximation of the historical disturbance regime. Map units were based on
NatureServe's Ecological Systems classification and represent the natural plant communities that may
have been present during the reference period.
Each BPS map unit was matched with a model of vegetation succession and served as key inputs to
the LANDSUM landscape succession model. The actual time-period for BPS was a composite of the
historical context provided by the fire regime and vegetation dynamics models and the more recent
field and geospatial inputs used to create it. BPS is unchanged from LF National’s BPS except for
updates made to water, barren, and snow classes (additions or removal), so that not-vegetated cover
types within the BPS product matches LF existing vegetation and fuel products.
The LF Remap (LF 2.0) update for BPS products is that BPS now includes Mean Fire Return Interval
(MFRI), Percent of Low-severity Fire (PLS), Percent of Mixed-severity Fire (PMS), Percent of
Replacement-severity Fire (PRS), and Fire Regime Groups (FRG) as attributes.
Environmental Site Potential (ESP)
The LF National (LF 1.X) ESP products represent the vegetation that could be supported at a given site
based on the biophysical environment. Map units were named according to NatureServe's Ecological
Systems classification, a nationally consistent set of mid-scale ecological units, and represent the
natural plant communities that would become established at late or climax stages of successional
development in the absence of disturbance. In LF, this product was used to inform the existing
vegetation and fuel mapping processes.
LF’s use of these classification units to describe environmental site potential differs from their
Page 11
11
LANDFIRE Product Descriptions with References
intended use as units of existing vegetation. They reflected the current climate and physical
environment, as well as the competitive potential of native plant species. The LF ESP concept is
similar to the concept used in classifications of potential vegetation, including habitat types
(Daubenmire 1968; Pfister and others 1977) and plant associations (Henderson and others 1989). ESP
was generated using a predictive modeling approach that relates spatially explicit layers representing
biophysical gradients and topography to field training sites assigned to ESP map units. It is important
to note that ESP is an abstract concept and represents neither current nor historical vegetation.
Biophysical Settings Models and Descriptions (BpS)
BpS models describe vegetation, geography, biophysical characteristics, succession stages, and
disturbance regimes for each BpS and some of the major disturbance types affecting these
ecosystems prior to significant alterations by European settlers. BPS helps to synthesize the best
available knowledge of vegetation dynamics and quantify the natural range of variability in
vegetation composition and structure.
Models consist of two components: (1) a comprehensive biophysical setting (BpS) model description
and (2) a quantitative, state-and-transition BpS model, created in the public domain software
Vegetation Dynamics Development Tool (VDDT; ESSA Technologies Ltd. 2007). Each model represents
a BpS. And a BpS represents the vegetation that may have been dominant on the landscape prior to
Euro-American settlement and is based on both the current biophysical environment and an
approximation of the historical disturbance regime. BpS modeling units are based on NatureServe's
Ecological Systems classification, a nationally consistent set of mid-scale ecological units (Comer et al.
2003). LF's use of these classification units to describe BpS differs from their intended use as units of
existing vegetation. As used in LF, model unit names represent the natural plant communities that
may have been present during the reference period.
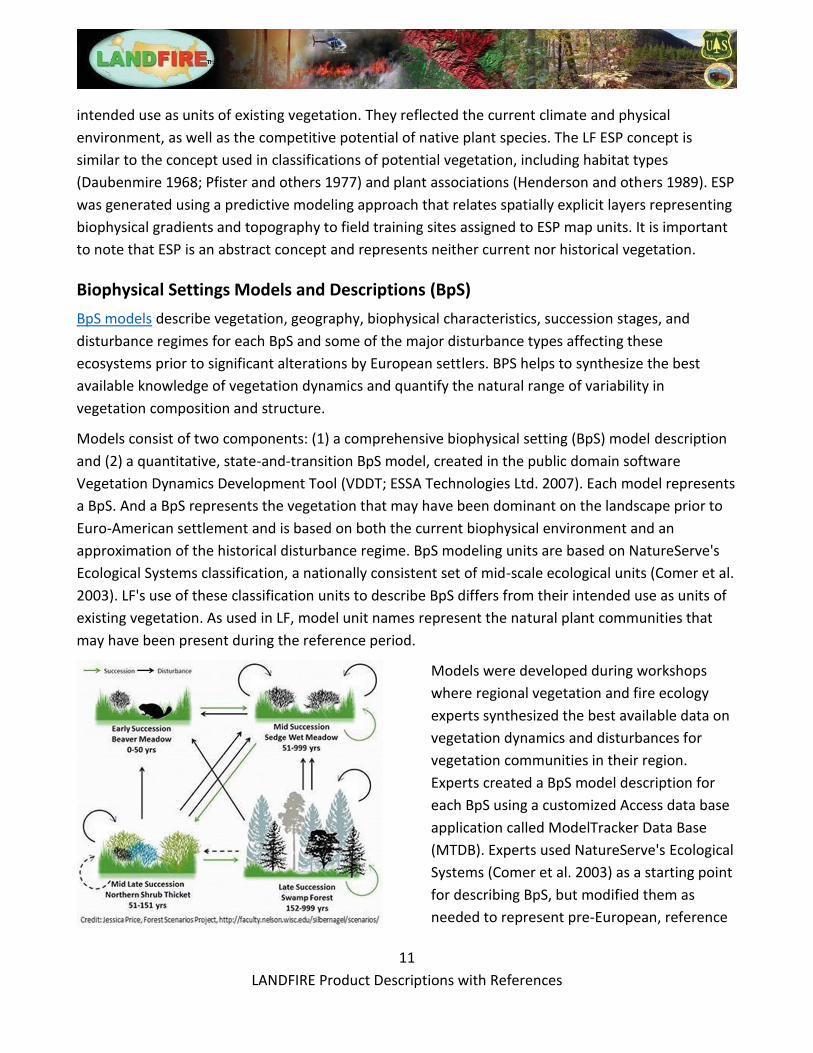
Models were developed during workshops
where regional vegetation and fire ecology
experts synthesized the best available data on
vegetation dynamics and disturbances for
vegetation communities in their region.
Experts created a BpS model description for
each BpS using a customized Access data base
application called ModelTracker Data Base
(MTDB). Experts used NatureServe's Ecological
Systems (Comer et al. 2003) as a starting point
for describing BpS, but modified them as
needed to represent pre-European, reference
Page 12
12
LANDFIRE Product Descriptions with References
conditions and added additional information to ModelTracker to create a comprehensive BpS
description document. Experts used the VDDT to quantify the vegetation dynamics of each BpS.
Quantitative models were based on inputs such as fire frequency and severity, the probability of
other disturbances, and the rate of vegetation growth and succession. Models were used to simulate
several centuries of vegetation dynamics and produce outputs such as the percent of the landscape in
each class and the frequency of disturbances. Outputs were checked against available data whenever
possible.
ModelTracker descriptions and VDDT inputs were derived from literature review and expert input
during and after modeling workshops. A model review process during and/or following workshops
garnered additional expert input and offered an opportunity to refine models.
BpS model descriptions and quantitative BpS models, were used in LF 1) to help define and map BpS;
2) to help map succession classes; and 3) as inputs to the spatial fire and succession simulation
model, LANDSUM (Keane et al. 2002), which generates reference conditions used to calculate Fire
Regime Condition Class (FRCC), a standardized, interagency index to measure the departure of
current conditions from reference conditions (Hann et al. 2004).
For a complete description of the methodology used to develop LF vegetation models consult the
"LANDFIRE Vegetation Dynamics Modeling Manual" (The Nature Conservancy et al. 2006).
Page 13
13
LANDFIRE Product Descriptions with References
Fuel
13 Anderson Fire Behavior Fuel Models (FBFM13)
Fire behavior fuel models represent distinct distributions of fuel loading found among surface fuel
components (live and dead), size classes, and fuel types. Fuel models are described by the most
common fire- carrying fuel type (grass, brush, timber litter, or slash), loading and surface area-to-
volume ratio by size class and component, fuelbed depth, and moisture of extinction. These standard
LF National (LF 1.X) 13 Anderson Fire Behavior Fuel Models (FBFM13) serve as input to Rothermel’s
mathematical surface fire behavior and spread model (Rothermel 1972). FBFM13 can serve as input
to the FARSITE fire growth simulation model (Finney 1998) and FlamMap fire potential simulator
(Stratton 2004). Further detail on these original fire behavior fuel models can be found in Anderson
(1982) and Rothermel (1983).
In LF Remap (LF 2.0), Fuel Vegetation Type (FVT), Fuel Vegetation Cover (FVC), and Fuel Vegetation
Height (FVH) were incorporated in place of EVT, EVC, and EVH in fuel model assignment for disturbed
areas to represent pre-disturbance scenarios (dating back to 2007). The combination of pre-
disturbance and non-disturbance vegetation were used to assign surface fuel models by informing
how much or little and what type of fuels are natural or acted on by a disturbance event.
40 Scott and Burgan Fire Behavior Fuel Models (FBFM40)
This set of standard fire behavior fuel models represents more fuel models in every fuel type (grass,
shrub, timber, and slash) than does Anderson's set of 13 fuel models. The main objective in creating
LF National (LF 1.X) FBFM40 was to increase the ability to illustrate the effects of fuel treatments
using fire behavior modeling. FBFM40 can serve as input to the FARSITE fire growth simulation model
(Finney 1998), FlamMap fire potential simulator (Stratton 2004), BehavePlus fire behavior model
(Andrews and others 2005), NEXUS crown fire potential model (Scott 2003), and FFE-FVS forest stand
simulator (Reinhardt and Crookston 2003).
Nomographs for estimating fire behavior using the new fuel models without the use of a computer
are now available (through Rocky Mountain Research Station Publications). Further detail about
these 40 fire behavior fuel models can be found in Scott and Burgan (2005).
In LF Remap (LF 2.0), FVT, FVC, and FVH were incorporated in place of EVT, EVC, and EVH in fuel
model assignment for disturbed areas to represent pre-disturbance scenarios (dating back to 2007).
The combination of pre-disturbance and non-disturbance vegetation were used to assign surface fuel
models by informing how much or little and what type of fuels are natural or acted on by a
disturbance event.
Page 14
14
LANDFIRE Product Descriptions with References
Fuel Vegetation Type (FVT)
New with LF Remap (LF 2.0), FVT represents a modified version of EVT that more accurately leverages
fuel transition assignments related to disturbed areas by re-establishing pre-disturbance vegetation.
Linking disturbed areas to pre-disturbance EVTs allows fuel model transition assignments to properly
align with logic developed from Fuels Calibration Workshops, giving more accurate representations
during fire behavior analysis.
FVT was developed using the full suite of LF vegetation releases and HDist, the most recent 10 years
of disturbance data.
Fuel Vegetation Cover (FVC)
New with LF Remap (LF 2.0), FVC represents a modified version of EVC that was mapped as
continuous estimates of canopy cover for tree, shrub, and herbaceous lifeforms with a potential
range from 0-100 percent. To translate continuous EVC values into fuel model assignments, EVC
values were binned to correspond with the bins for previous LF versions.
FVC was developed using the full suite of LF vegetation releases and HDist, the most recent 10 years
of disturbance data. FVC more accurately leverages fuel transition assignments related to disturbed
areas to properly align with logic developed from Fuels Calibration Workshops.
Fuel Vegetation Height (FVH)
New with LF Remap (LF 2.0), FVH represents a modified version of EVH that was mapped as
continuous estimates of canopy height for tree, shrub, and herbaceous lifeforms. To translate
continuous EVH values into fuel model assignments, EVH values were binned to correspond with the
bins for previous LF versions.
FVH was developed using the full suite of LF vegetation releases and HDist, the most recent 10 years
of disturbance data. FVH more accurately leverages fuel transition assignments related to disturbed
areas to properly align with logic developed from Fuels Calibration Workshops.
Forest Canopy Bulk Density (CBD)
CBD describes the density of available canopy fuel in a stand. It is defined as the mass of available
canopy fuel per canopy volume unit that would burn in a crown fire. Geospatial data describing
canopy bulk density supplies information for fire behavior models, such as FARSITE (Finney 1998), to
determine the initiation and spread characteristics of crown fires across landscapes (VanWagner
1977, 1993). LF National (LF 1.X) CBD was generated using a predictive modeling approach that
relates Landsat imagery and spatially explicit biophysical gradients to calculated values of CBD from
field training sites. Because of model requirements, these data are provided for forested areas only.
Page 15
15
LANDFIRE Product Descriptions with References
The units of measurement for the CBD products are kg m-3 * 100.
In LF Remap (LF 2.0), FVT, FVC, and FVH were incorporated in place of EVT, EVC, and EVH for
disturbed areas to represent pre-disturbance scenarios (dating back to 2007). The combination of
pre-disturbance and non-disturbance vegetation were used to calculate CBD by informing how much
or little and what type of fuels are natural or acted on by a disturbance event.
Forest Canopy Base Height (CBH)
CBH describes the average height from the ground to a forest stand’s canopy bottom. Specifically, it is
the lowest height in a stand at which there is enough forest canopy fuel to propagate fire vertically
into the canopy. Geospatial data describing canopy base height provides information for fire behavior
models, such as FARSITE (Finney 1998), to determine areas in which a surface fire is likely to
transition to a crown fire (VanWagner 1977, 1993). LF National (LF 1.X) CBH was generated using a
predictive modeling approach that relates Landsat imagery and spatially explicit biophysical gradients
to calculated values of CBH from field training sites. Because of model requirements, these data are
provided for forested areas only. The units of measurement for the CBH products are meters * 10.
In LF Remap (LF 2.0), FVT, FVC, and FVH were incorporated in place of EVT, EVC, and EVH for
disturbed areas to represent pre-disturbance scenarios (dating back to 2007). The combination of
pre-disturbance and non-disturbance vegetation are used to calculate CBH by informing how much or
little and what type of fuels are natural or acted on by a disturbance event.
Forest Canopy Height (CH)
CH describes the average height of the top of the vegetated canopy. Geospatial data describing
canopy height supplies information to fire behavior models, such as FARSITE (Finney 1998), to
determine the probability of crown fire ignition, calculate wind reductions, and compute the volume
of crown fuel (VanWagner 1977, 1993). LF National (LF 1.X) CH was generated using a predictive
modeling approach that relates Landsat imagery and spatially explicit biophysical gradients to
calculated values of average dominant height from field training sites. Because of model
requirements, these data are provided for forested areas only. The units of measurement for the LF
CH layer are meters * 10.
In LF Remap (LF 2.0), FVT, FVC, and FVH were incorporated in place of EVT, EVC, and EVH for
disturbed areas to represent pre-disturbance scenarios (dating back to 2007). The combination of
pre-disturbance and non-disturbance vegetation are used to calculate CH by informing how much or
little and what type of fuels are natural or acted on by a disturbance event.
Page 16
16
LANDFIRE Product Descriptions with References
Forest Canopy Cover (CC)
CC describes the percent cover of the tree canopy in a stand. Specifically, canopy cover describes the
vertical projection of the tree canopy onto an imaginary horizontal surface representing the ground’s
surface. A spatially explicit map of CC supplies information to fire behavior models, such as FARSITE
(Finney 1998), to determine surface fuel shading for calculating dead fuel moisture and for calculating
wind reductions. LF National (LF 1.X) CC was generated using a predictive modeling approach that
relates Landsat imagery and spatially explicit biophysical gradients to calculated values of average
canopy cover from field training sites and digital orthophoto quadrangles. The units of measurement
for the LF CC layer are percent.
In LF Remap (LF 2.0), FVT, FVC, and FVH were incorporated in place of EVT, EVC, and EVH for
disturbed areas to represent pre-disturbance scenarios (dating back to 2007). The combination of
pre-disturbance and non-disturbance vegetation are used to calculate CC by informing how much or
little and what type of fuels are natural or acted on by a disturbance event.
Canadian Forest Fire Danger Rating System (CFFDRS)
LF National (LF 1.X) CFFDRS depicts fuel types "as an identifiable association of fuel elements of
distinctive species, form, size, arrangement, and continuity that will exhibit characteristic fire
behavior under defined burning conditions" (Pyne, Andrews, and Laven, 1996; Stocks and others
1989). The CFFDRS arranges fuel types into five major groups with 16 discrete fuel types that are
qualitatively distinguished by variations in their forest floor and organic layer, their surface and
ladder fuels, and their stand structure and composition.
The CFFDRS assignments for Alaska were made by fire behavior and fuels experts based on Existing
Vegetation Type (EVT) descriptions and representative photos.
The CFFDRS product is currently created for Alaska only.
Fuel Loading Models (FLM)
LF National (LF 1.X) FLM surface fuel classification system characterizes wildland surface fuel. FLMs
provide a simple and consistent way for managers to describe onsite fuel for input into fire behavior
and effects software and contain representative loading for each fuel component (e.g., woody and
non-woody) for typical vegetation classification systems. They characterize fuel loading across all
vegetation and ecological types. FLM may be used to simulate wildland fire effects using applications
such as FOFEM (Reinhardt and others 1997) and CONSUME (Ottmar and others 1993).
FLM are assigned to the LF vegetation map unit classification systems. Geospatial representation of
fire effects fuel models may be used to prioritize fuel treatment areas, evaluate fire hazard and
potential status, and examine past, present, and future fuel loading characterizations.
Page 17
17
LANDFIRE Product Descriptions with References
Fuel Characteristics Classification System Fuelbeds (FCCS)
LF National (LF 1.X) FCCS was developed by the USDA, Pacific Northwest Experiment Station, Pacific
Wildland Fire Sciences Laboratory (PWFSL) in Seattle, WA. FCCS is a system for describing wildland
fuels. Fire managers can use the FCCS to assign fuelbed characteristics for the purposes of predicting
fuel consumption and smoke production through PWFSL’s CONSUME software. Upon full
implementation, the LF team plans to work with FCCS staff to provide crosswalk assignments of FCCS
fuelbed numbers to LF existing vegetation layers.
FCCS fuel beds have been mapped in LF and are preloaded in the Fuel and Fire Tools (FFT) application.
For LF Remap (LF 2.0), FCCS is planned to be produced with production occurring after fuels
production and released as part of the final release for CONUS in mid to late 2020.
Fuel Rulesets Database
The Fuel Rulesets Database is a standalone database exported from LFTFC in Microsoft Access Form
format and displays LF fuel rules by EVT, non-disturbance or disturbance type, and LF map zone. Fuel
rulesets are comprised of the described EVT, combinations of ranges of cover and height, and
Biophysical Setting (BpS) within each EVT. Information regarding whether canopy is available for
crown fire activity is also provided
Page 18
18
LANDFIRE Product Descriptions with References
Fire Regime
Fire Regime Groups (FRG)
LF National (LF 1.X) FRG represents an integration of the spatial fire regime characteristics of
frequency and severity simulated using the vegetation and disturbance dynamics model LANDSUM
(Keane and others 2002). These groups are intended to characterize the presumed historical fire
regimes within landscapes based on interactions between vegetation dynamics, fire spread, fire
effects, and spatial context (Hann and others 2004). FRG definitions have been altered from previous
applications (Hann & Bunnell 2001; Schmidt and others 2002; Wildland Fire Communicator’s Guide)
to best approximate the definitions outlined in the Interagency Fire Regime Condition Class
Guidebook (Hann and others 2004). These definitions were refined to create discrete, mutually
exclusive criteria appropriate for use with LF’s fire frequency and severity data products.
FRG is created by linking the BpS Group attribute in the BpS layer with the Refresh Model Tracker
(RMT) data and assigning the FRG attribute. This geospatial product should display a reasonable
approximation of FRG, as documented in the RMT.
For LF Remap (LF 2.0), this product, along with Mean Fire Return Interval, Percent Low-severity Fire,
Percent Mixed-severity Fire, and Percent Replacement-severity Fire are part of the BPS Attribute
Table.
Mean Fire Return Interval (MFRI)
LF National 9LF 1.X) MFRI quantifies the average period between fires under the presumed historical
fire regime. This frequency is derived from vegetation and disturbance dynamics simulations using
LANDSUM (Keane and others 2002, Hann and others 2004). The MFRI layer is intended to represent
one component of the presumed historical fire regimes within landscapes based on interactions
between vegetation dynamics, fire spread, fire effects, and spatial context.
For LF Remap (LF 2.0), this product, along with FRG, Percent Low-severity Fire, Percent Mixed-severity
Fire, and Percent Replacement-severity Fire are part of the BPS Attribute Table.
Percent Low-severity Fire (PLS)
LF National (LF 1.X) PSL quantifies the amount of mixed -severity fires relative to mixed- and
replacement-severity fires under the presumed historical fire regime. Low severity is defined as less
than 25 percent average top-kill within a typical fire perimeter for a given vegetation type (Hann and
others 2004). This percent is derived from vegetation and disturbance dynamics simulations using
LANDSUM (Keane and others 2002). The PLS layer is intended to represent one component of the
presumed historical fire regimes within landscapes based on interactions between vegetation
Page 19
19
LANDFIRE Product Descriptions with References
dynamics, fire spread, fire effects, and spatial context.
For LF Remap (LF 2.0), this product, along with FRG, MFRI, Percent Mixed-severity Fire, and Percent
Replacement-severity Fire are part of the BPS Attribute Table.
Percent Mixed-severity Fire (PMS)
LF National (LF 1.X) PMS quantifies the amount of low-severity fires relative to low- and replacement-
severity fires under the presumed historical fire regime. Mixed severity is defined as between 25 and
75 percent average top-kill within a typical fire perimeter for a given vegetation type (Hann and
others 2004). This percent is derived from vegetation and disturbance dynamics simulations using
LANDSUM (Keane and others 2002). The PMS layer is intended to represent one component of the
presumed historical fire regimes within landscapes based on interactions between vegetation
dynamics, fire spread, fire effects, and spatial context.
For LF Remap (LF 2.0), this product, along with FRG, MFRI, PLS, and Percent Replacement-severity Fire
are part of the BPS Attribute Table.
Percent Replacement-severity Fire (PRS)
LF National (LF 1.X) PRS quantifies the amount of replacement-severity fires relative to low- and
mixed-severity fires under the presumed historical fire regime. Replacement severity is defined as
greater than 75 percent average top-kill within a typical fire perimeter for a given vegetation type
(Hann and others 2004). This percent is derived from vegetation and disturbance dynamics
simulations using LANDSUM (Keane and others 2002). The PRS layer is intended to represent one
component of the presumed historical fire regimes within landscapes based on interactions between
vegetation dynamics, fire spread, fire effects, and spatial context.
For LF Remap (LF 2.0), this product, along with FRG, MFRI, PLS, and PMS are part of the BPS Attribute
Table.
Succession Classes (SClass)
LF National (LF 1.X) SClass categorizes current vegetation composition and structure into up to five
successional states defined for each LF BpS Model. An additional category defines uncharacteristic
vegetation components that are not found within the compositional or structural variability of
successional states defined for each BpS model, such as exotic species. These succession classes are
similar in concept to those defined in the Interagency Fire Regime Condition Class (FRCC) Guidebook.
SClass is created by linking the BpS layer with the SClass rulesets. This geospatial product should
display a reasonable approximation of SClass, documented in the LF Vegetation Dynamics Models.
The current successional classes and their historical reference conditions are compared to assess
departure of vegetation characteristics; this departure can be quantified using methods such as FRCC.
Page 20
20
LANDFIRE Product Descriptions with References
Five successional classes, "A" (1) - "E" (5) define successional states represented within a given BpS
model. 'UN' (6) represents uncharacteristic native vegetation for the BpS model on which these
vegetation conditions are found. These are taken to represent vegetation cover, height, or
composition that would not have been expected to occur on the BpS during the reference condition
period. 'UE' (7) represents uncharacteristic exotic vegetation for the BpS model on which these
vegetation conditions are found. Additional data layer values were included to represent Water (111),
Snow / Ice (112), Barren (131), and Sparsely Vegetated (132). Non-burnable Urban (120), Burnable
Urban (121), Non- burnable Agriculture (180), and Burnable Agriculture (181) are provided to mask
out such areas from analysis of vegetation departure. To use this layer for assessing vegetation
departure from historical reference conditions, it is necessary to combine this layer with BpS and LF
map zone data layers. The subsequent combination of map zone, BpS, and SClass can then be found
within LF Historical Reference Condition tables. Caution is warranted in assessing vegetation
departure across map zone boundaries, as the classification schemes used to produce BpS and SClass
may vary slightly between adjacent map zones. Furthermore, reference conditions are simulated
independently for each map zone, resulting in potentially unique measurements of reference conditions
for a given BpS between adjacent map zones.
For LF Remap (LF 2.0), production for SClass is scheduled to begin after fuels production and will be
part of the final release for CONUS in mid to late 2020.
Vegetation Condition Class (VCC)
LF National (LF 1.X) VCC, a reclassification of the Vegetation Departure (VDEP) product, is a discrete
metric that quantifies the amount that current vegetation has departed from the simulated historical
vegetation reference conditions (Hann and Bunnell 2001; Hardy and others 2001; Hann and others
2004; Holsinger and others 2006). Refer to the VDEP Data Summary and metadata to review how that
data was created.
Vegetation condition classes are defined in two ways, the original 3-category system from Fire
Regime Condition Class (FRCC), and a new 6-category system. In the original 3-category system, the
VDEP value is reclassified as Condition Class I: VDEP value from 0 to 33 (Low Departure), Class II: VDEP
value between 34 - 66 (Moderate Departure), and Condition Class III: VDEP value from 67 to 100
(High Departure). The new 6-category system is defined to provide more resolution to VCC and be
collapsible to the old 3-category system. The new VCC categories are Condition Class I.A: VDEP
between 0 and 16 (Very Low Departure), Condition Class I.B: VDEP between 17 and 33 (Low to
Moderate Departure), Condition Class II.A: VDEP between 34 and 50 (Moderate to Low Departure),
Condition Class II.B: VDEP between 51 and 66 (Moderate to High Departure), Condition Class III.A:
VDEP between 67 and 83 (High to Moderate Departure), and Condition Class III.B: VDEP between 84 and
100 (High Departure). Current vegetation conditions are derived from a classification of LF layers of
Page 21
21
LANDFIRE Product Descriptions with References
existing vegetation type, cover, and height.
For LF Remap (LF 2.0), VCC production is scheduled to begin after fuels production and will be part of
the final release for CONUS in mid to late 2020.
Vegetation Departure (VDEP)
LF National (LF 1.X) VDEP categorizes departure between current vegetation conditions and reference
vegetation conditions using a range from 0 to 100 according to the methods outlined in the
Interagency Fire Regime Condition Class Guidebook (Hann and others 2004). Technical Methods:
"Summary units" for the departure computation were defined as a BpS with identical reference
condition values regardless of map zone. This is a change from previous versions of LF. For example,
speculate that a specific BpS is present in map zone 1, 2, 4, 5, 6 and 8. The reference conditions for
this BpS are identical in map zones 1, 2, 4, 5 and 8 so those map zones become a "summary unit" for
the departure computation (VDEP) in LF 2014. Since reference conditions are unique for this BpS in
map zone 6, it is a separate summary unit for calculating departure (VDEP) in LF 2014. Within each
biophysical setting in each summary unit, we compare the reference percentage of each succession
class (SClass) to the current percentage, and the smaller of the two is summed to determine the
similarity index for the BpS. This value is then subtracted from 100 to determine the departure value.
Departure value is between 0 - 100, with 100 representing maximum departure.
The LF VDEP approach differs from that outlined in the Interagency Fire Regime Condition Class
Guidebook as follows: LF VDEP is based on departure of current vegetation conditions from reference
vegetation conditions only, whereas the Guidebook approach includes departure of current fire
regimes from those of the reference period. The reference conditions are derived from quantitative
vegetation and disturbance dynamics models developed in VDDT/ST-Sim. The current conditions are
derived from the corresponding version of LF SClass; please refer to the product description page at
https://landfire.gov for more information. The proportion of the landscape occupied by each SClass in
each BpS unit in each summary unit is used to represent the current condition of that SClass in the
VDEP calculation. The areas currently mapped to agriculture, urban, water, barren, or sparsely
vegetated BpS units are not included in the VDEP calculation; thus, VDEP is based entirely on the
remaining area of each BpS unit that is occupied by valid SClasses.
Refer to the VDEP product page for version comparisons. Current vegetation conditions are derived
from a classification of LF layers of existing vegetation type, cover, and height.
Page 22
22
LANDFIRE Product Descriptions with References
Topographic
Elevation
Elevation represents land height in meters above mean sea level.
In LF National (LF 1.X) Elevation products, the DEM layer is a derivative of the National Elevation
Dataset (NED), the primary elevation data product produced and distributed by the USGS. The NED
provided the best available public domain raster elevation data of the conterminous U.S., Alaska,
Hawaii, and territorial islands in a seamless format. Derived from diverse source data, NED data was
processed to a common coordinate system and unit of vertical measure. All NED data are distributed
in geographic coordinates in units of decimal degrees, and in conformance with the North American
Datum of 1983 (NAD 83). All elevation values are provided in units of meters and are referenced to
the North American Vertical Datum of 1988 (NAVD 88) over the conterminous U.S. The vertical
reference will vary in other areas. NED data are available nationally at resolutions of 1 arc-second
(approx. 30 meters) and 1/3 arc-second (approx. 10 meters), and in limited areas at 1/9 arc-second
(approx. 3 meters). For the LF product the 1 arc second NED digital elevation model (DEM) was
projected from Geographic to Albers and clipped out to the LF boundary.
For LF Remap (LF 2.0), Elevation is generated from ⅓ arc-second Digital Elevation Models (DEM),
previously referred to as NED. The ⅓ arc-second DEM is part of the USGS 3D Elevation Program
(3DEP), which provides the best available public domain raster elevation data of the conterminous
U.S., Alaska, Hawaii, and insular areas in a seamless format. The ⅓ arc-second 3DEP DEM data were
projected from Geographic to Albers Equal Area, resampled to 30m spatial resolution, and then
clipped to the LF boundary. Elevation unit measurements are meters above mean sea level.
Aspect
Aspect represents the azimuth of the sloped surfaces across a landscape.
LF National (LF 1.X) Aspect was generated from NED DEM that was been clipped to the LF boundary.
The aspect grid defines downslope direction. Non-defined aspect (slope is less than or =2) are
assigned a value of -1. Aspect values range from 0.0 to 359.0 degrees. -9999 indicates NoData. Values
have been adjusted to account for the Albers projection. The aspect grid was computed using the
aspect function in ArcGIS 10.1.
For LF Remap (LF 2.0) Aspect is generated from 3DEP 1/3rd arc-second DEM that has been clipped to
the LF boundary. The aspect grid defines downslope direction. Non-defined aspect (slope is less than
or =2) are assigned a value of -1. Aspect values range from 0.0 to 359.0 degrees. -9999 indicates
NoData. Values have been adjusted to account for the Albers projection. The aspect grid, computed
using the aspect algorithm in GDAL version 2.0.12, defines downslope direction in degrees.
Page 23
23
LANDFIRE Product Descriptions with References
Slope
Slope represents the change of elevation over a specific area.
LF National (LF 1.X) Slope was generated from NED DEM that has been clipped to the LF boundary.
The slope grid was generated using the "slope" function. The slope grid was created using the degree
option and not with using percent in ArcGIS 10.1.
For LF Remap (LF 2.0), Slope is generated from 3DEP 1/3rd arc-second DEM that has been clipped to
the LF boundary. The slope raster data were created using the degree slope algorithm in GDAL
version 2.0.12.
Page 24
24
LANDFIRE Product Descriptions with References
References
Anderson, H. E. 1982. Aids to determining fuel models for estimating fire behavior. General Technical
Report INT-122, United States Department of Agriculture, Forest Service, Intermountain Forest
and Range Experiment Station, Ogden, UT. 26 p
Andrews, P. L., C. D. Bevins, R. C. Seli. 2005. BehavePlus fire modeling system, version 3.0: User's Guide.
Gen. Tech. Rep. RMRS-GTR-106WWW. Department of Agriculture, Forest Service, Rocky
Mountain Research Station. Ogden, UT. 142 p.
Comer, P., D. Faber-Langendoen, R. Evans, S. Gawler, C. Josse, G. Kittel, S. Menard, M. Pyne, M. Reid,
K. Schulz, K. Snow, and J. Teague. 2003. Ecological Systems of the United States: A Working
Classification of U.S. Terrestrial Systems. NatureServe, Arlington, VA. 75 p.
Daubenmire, R. 1968. Plant Communities: A Textbook of Plant Synecology. Harper and Row Publ., New
York. 300 p. ESSA Technologies Ltd. 2005. Vegetation dynamics development tool, User’s guide,
Version
5.1. Prepared by ESSA Technologies Ltd., Vancouver, BC. 188 pp.
ESSA Technologies Ltd. 2007. Vegetation Dynamics Development Tool User Guide, Version 6.0. Prepared
by ESSA Technologies Ltd., Vancouver, BC. 196 pp.
Finney, M. A. 1998. FARSITE: Fire Area Simulator-model development and evaluation. Res. Pap. RMRS-
RP-4, Ogden, UT: U.S. Department of Agriculture, Forest Service, Rocky Mountain Research Station,
Fort Collins, CO. 47 p.
Hann, W. J. and D. L. Bunnell, 2001. Fire and land management planning and implementation across
multiple scales. International Journal of Wildland Fire 10:389-403.
Hann, W.; Shlisky, A.; Havlina, D.; Schon, K.; Barrett, S.; DeMeo, T.; Pohl, K.; Menakis, J.; Hamilton, D.;
Jones, J.; Levesque, M.; Frame, C. 2004. Interagency Fire Regime Condition Class Guidebook. Last
update September: Version 3.0. [Homepage of the Interagency and The Nature Conservancy fire
regime condition class website, USDA Forest Service, U.S. Department of the Interior, The Nature
Conservancy, and Systems for Environmental Management]. [Online]. Available:
http://www.fire.org/niftt/released/FRCC_Guidebook_2010_final.pdf.
Hardy, C. C., K. M. Schmidt, J. M. Menakis, and N. R. Sampson. 2001. Spatial data for national fire
planning and fuel management. International Journal of Wildland Fire 10:353-372.
Henderson, J. A., D. H. Peter, R. D. Lesher, D. C. Shaw. 1989. Forested Plant Associations of the Olympic
National Forest. USDA Forest Service, Pacific Northwest Region. R6-ECOL-TP 001-88. 502 p.
Page 25
25
LANDFIRE Product Descriptions with References
Holsinger, L, R.E. Keane, B. Steele, M. Reeves, and S.D. Pratt. 2006a. Using historical simulations of
vegetation to assess departure of current vegetation conditions across large landscapes. Pp. 315-
366 in: Rollins, M.G. and C.K. Frame, tech. eds. 2006. The LF Prototype Project: nationally consistent
and locally relevant geospatial data for wildland fire management. Gen. Tech. Rep. RMRS-GTR-
175. U.S. Forest Service, Rocky Mountain Research Station, Fort Collins, Colorado.
Homer, C.; Huang, C.; Yang, L.; [and others]. 2004. Development of a 2001 national land-cover
database for the United States. Photogrammetric Engineering and Remote Sensing. 70: 829-840.
Huang, C., Song, K., Kim, S., Townshend, J., Davis, P., Masek, J. & Goward . 2008. Use of a Dark Object
Concept and Support Vector Machines to Automate Forest Cover Change Analysis. Remote Sensing
of Environment, Issue 112, p. 970-985.
Jin, Suming; Yang, Limin; Danielson, Patrick; Homer, Collin; Fry, Joyce; and Xian, George. 2013. A
comprehensive change detection method for updating the National Land Cover Database to circa
2011.
Keane, R. E., R. Parsons, and P. Hessburg. 2002. Estimating historical range and variation of landscape
patch dynamics: limitations of the simulation approach. Ecological Modeling 151:29-49.
Keane, R.E.; L. M. Holsinger, and S.D. Pratt. 2006. Simulating historical landscape dynamics using the
landscape fire succession model LANDSUM version 4.0 Gen. Tech. Rep. RMRS-GTR-171CD. US
Forest Service, Rocky Mountain Research Station. Fort Collins, Colorado: 73 p.
Ottmar, R. D.; M. F. Burns, J. N. Hall, and A. D. Hanson. 1993. CONSUME users guide. Gen. Tech. Rep.
PNW-GTR-304. U.S. Department of Agriculture, Forest Service, Pacific Northwest Research Station.
Portland, OR. 17p.
Pfister, R. D., B. L. Kovalchik, S. F. Arno and R. C. Presby. 1977. Forest Habitat-types of Montana. USDA
Forest Service, Intermountain Forest and Range Experiment Station, Ogden, Utah. GTR-INT- 34. 174
p.
Pratt, S.D., L. Holsinger, and R.E. Keane. 2006. Using simulation modeling to assess historical Reference
conditions for vegetation and fire Regimes for the LF prototype project. Pp. 277-315 in: Rollins,
M.G. and C.K. Frame, tech. eds. 2006. The LF Prototype Project: nationally consistent and locally
relevant geospatial data for wildland fire management. Gen. Tech. Rep. RMRS-GTR -175. U.S. Forest
Service, Rocky Mountain Research Station, Fort Collins, Colorado.
Reinhardt, E. D.; R. E. Keane and J. K. Brown. 1997. First Order Fire Effects Model: FOFEM 4.0, user’s
guide. General Technical Report INT-GTR-344. 65p.
Reinhardt, E. and N. L. Crookston, (Technical Editors). 2003. The Fire and Fuels Extension to the Forest
Vegetation Simulator. General. Technical. Report. RMRS-GTR-116. U.S. Department of Agriculture,
Forest Service, Rocky Mountain Research Station. Ogden, UT. 209 p.
Page 26
26
LANDFIRE Product Descriptions with References
Reinhardt, E., D. Lutes, and J. Scott. 2006. FuelCalc: A Method for Estimating Fuel Characteristics. Pp. 273-
282 in Andrews, P. L., and B. W. Butler, comps. Fuels Management-How to Measure Success:
Conference Proceedings. 28-30 March 2006; Portland, OR. Proceedings RMRS-P-41. Fort Collins, CO:
Rollins, M.; Ward, B.; Dillon, G.; Pratt, S.; Wolf, A. 2007. Developing the LF Fire Regime Data Products.
[Homepage of the LF Project website, USDA Forest Service, U.S. Department of the Interior].
[Online].
Rothermel, R. C. 1972. A mathematical model for predicting fire spread in wildland fuel. Research Paper
INT-115, United States Department of Agriculture, Forest Service, Intermountain Forest and
Range Experiment Station, Ogden, UT. 42 p.
Rothermel R. C. 1983. How to predict the spread and intensity of forest and range fires. General Technical
Report INT- 143, United States Department of Agriculture, Forest Service, Intermountain
Research Station, Ogden, UT. 53 p.
Running, S. W. and E. R. Hunt. 1993. Generalization of a forest ecosystem process model for other
biomes, BIOME- BGC, and an application for global scale models. Pp. 141-157 in scaling
physiological processes: leaf to globe. Burlington, MA: Academic Press.
Schmidt, K. M., J. P. Menakis, C. C. Hardy, W. J. Hann, and D. L. Bunnell. 2002. Development of coarse-
scale spatial data for wildland fire and fuel management. General Technical Report, RMRS-GTR-
87, U.S. Department of Agriculture, Forest Service, Rocky Mountain Research station, Fort Collins,
CO. 46 p.
Scott, J. H. 2003. Canopy fuel treatment standards for the wildland-urban interface. In: " Fire, fuel
treatments, and ecological restoration: conference proceedings; 2002 April 16-18; Fort Collins, CO.
Omi, Philip N.; Joyce, Linda A., tech. eds. 2003. Proceedings RMRS-P -29. Fort Collins, CO: U.S.
Department of Agriculture, Forest Service, Rocky Mountain Research Station, pp. 29-37.
Scott, J. H. and R. E. Burgan. 2005. Standard fire behavior fuel models: a comprehensive set for use with
Rothermel’s surface fire spread model. Gen. Tech. Rep. RMRS-GTR-153.Fort Collins, CO: U.S.
Department of Agriculture, Forest Service, Rocky Mountain Research Station. 72 p.
Stratton, R. D. 2004. Assessing the Effectiveness of Landscape Fuel Treatments on Fire Growth and
Behavior. Journal of Forestry. 102 (7): 32-40.
Stocks, B. J., B. D. Lawson, M. E. Alexander, C. E. Van Wagner, R. S. McAlpine, T. J. Lynham, and D. E.
Dube. 1989. The Canadian forest fire danger rating system: an overview. The Forestry Chronicle
65:258- 265.
The Nature Conservancy, USDA Forest Service, and Department of the Interior. LANDFIRE Vegetation
Dynamics Modeling Manual, Version 4.1. March 2006. Boulder, CO. 71 pp
Page 27
27
LANDFIRE Product Descriptions with References
Toney, C., M. Rollins, K. Short, T. Frescino, R. Tymcio, and B. Peterson. 2007. Use of FIA plot data in
the LF Project. Pp. 309-319 in McRoberts, R. E., G. A. Reams, P. C. Van Deusen, and W. H.
McWilliams, eds. Proceedings of the seventh annual forest inventory and analysis symposium;
October 3-6, 2005; Portland, ME. Gen. Tech. Rep. WO-77. Washington, DC: U.S. Department of
Agriculture, Forest Service.
Toney, C., and M. C. Reeves. 2009. Equations to convert compacted crown ratio to uncompacted
crown ratio for trees in the Interior West. Western Journal of Applied Forestry 24: 76-82.
U.S. Department of Agriculture, Forest Service, Rocky Mountain Research Station.
U.S. Geological Survey (USGS). 2005a. Elevation derivatives for national applications.
http://edna.usgs.gov/. (1 October 2005).
U.S. Geological Survey, 2017, 1/3rd arc-second Digital Elevation Models (DEMs) - USGS National Map
3DEP Downloadable Data Collection: U.S. Geological Survey.
https://www.sciencebase.gov/catalog/item/4f70aa9fe4b058caae3f8de5
Van Wagner, C. E. 1977. Conditions for the start and spread of crownfire. Canadian Journal of Forest
Research. 7:23-24. Van Wagner, C. E. 1993. Prediction of crown fire behavior in two stands of
jack pine. Canadian Journal Forest Research 23:442-449.
Westoby, M., Walker, B. and Imanuel, N. 1989. Opportunistic management for rangelands not at
equilibrium. Journal of Range Management 42(4): 266-274.
Wildland Fire Communicator’s Guide, available online at:
https://www.nifc.gov/prevEdu/prevEdu_communicatorGuide.html