This paper presents an overview of the strengths and limitations of existing and emerging geophysical toolsfor landform studies. The objectives are to discuss recent technical developments and to provide a review ofrelevant recent literature, with a focus on propagating field methods with terrestrial applications. For variousmethods in this category, including ground-penetrating radar (GPR), electrical resistivity (ER), seismics, andelectromagnetic (EM) induction, the technical backgrounds are introduced, followed by section on noveldevelopments relevant to landform characterization. For several decades, GPR has been popular forcharacterization of the shallow subsurface and in particular sedimentary systems. Novel developments in GPRinclude the use of multi-offset systems to improve signal-to-noise ratios and data collection efficiency,amongst others, and the increased use of 3D data. Multi-electrode ER systems have become popular in recentyears as they allow for relatively fast and detailed mapping. Novel developments include time-lapsemonitoring of dynamic processes as well as the use of capacitively-coupled systems for fast, non-invasivesurveys. EM induction methods are especially popular for fast mapping of spatial variation, but can also beused to obtain information on the vertical variation in subsurface electrical conductivity. In recent yearsseveral examples of the use of plane wave EM for characterization of landforms have been published. Seismicmethods for landform characterization include seismic reflection and refraction techniques and the use ofsurface waves. A recent development is the use of passive sensing approaches. The use of multiple geophysicalmethods, which can benefit from the sensitivity to different subsurface parameters, is becoming morecommon. Strategies for coupled and joint inversion of complementary datasets will, once more widelyavailable, benefit the geophysical study of landforms.Three cases studies are presented on the use of electrical and GPR methods for characterization of landformsin the range of meters to 100 s of meters in dimension. In a study of polygonal patterned ground in theSaginaw Lowlands, Michigan, USA, electrical resistivity tomography was used to characterize differences insubsurface texture and water content associated with polygon-swale topography. Also, a sand-filledthermokarst feature was identified using electrical resistivity data. The second example is on the use ofconstant spread traversing (CST) for characterization of large-scale glaciotectonic deformation in theLudington Ridge, Michigan. Multiple CST surveys parallel to an ~60 m high cliff, where broad (~100 m)synclines and narrow clay-rich anticlines are visible, illustrated that at least one of the narrow structuresextended inland. A third case study discusses internal structures of an eolian dune on a coastal spit in NewZealand. Both 35 and 200 MHz GPR data, which clearly identified a paleosol and internal sedimentarystructures of the dune, were used to improve understanding of the development of the dune, which may shedlight on paleo-wind directions.
To understand processes of development and evolution of land-forms it is often critical to obtain information on the internalstructures, composition, and below-ground dimensions. Outcropsand boreholes provide the opportunity to obtain such information
with significant detail. Outcrops are usually limited, however, inspatial extent and coverage. Whereas boreholes can improve spatialcoverage of subsurface characterization, cost and time constraintsoften impose limits. Geophysical methods, on the other hand, areuniquely positioned to non-invasively characterize the internalproperties of a landform in multiple dimensions. The understandingof landform development can be even further improved by conduct-ing time-lapse measurement to monitor ongoing processes and bycombining geophysical imaging and characterization with historicalrecords (e.g., aerial photography) and methods for age dating (e.g.,
Pelpola and Hickin, 2004; Bristow and Pucillo, 2006). Recentdevelopments in data acquisition, processing, and interpretation,have changed the use of geophysics in landform studies andgeomorphology. Instead of simply providing complementary infor-mation to traditional methods of investigation, geophysical data arenow more frequently used as the primary source of evidence.
Landforms can be classified according to different criteria,including size, genetic origin, geographic or climatic position, basedon-landscape position, or whether they are accumulative or erosional.Geographic or climatic geomorphology is not specifically discussed inthis paper, although two of the case studies address periglacial andsubglacial landforms. Classes of landform sizes range from continentalscale to features with dimensions of meters and smaller. Geophysicalmethods can play a role in the study of all landforms, includingpotential field methods for the study of continental scale morphology,and high-resolution imaging tools for the smallest of features. In thispaper, the emphasis is on methods most applicable for characteriza-tion of landforms with spatial dimensions between meters and 10 s ofkilometers. Several case studies presented in this paper are at thelower end of this range (meters to 100 s of meters).
Classifications based on-landscape position include landforms onslopes or in plains, whereas classifications based on environmentinclude landforms in fluvial, coastal, eolian, glacial, and volcaniclandscapes. In addition, landforms may be related to tectonic or otherdeformation processes. In any of these environments and landscapepositions, landforms can form under the conditions of net accumu-lation or erosion, and under conditions that involve neither.Depending on the conditions and specific questions at hand, suitablegeophysical methods may be available for the study of any of theselandforms. Most of the examples presented in this paper addressconditions of net accumulation or neither accumulation nor erosion.Geophysical methods can also play a role, however, in characteriza-tion of processes related to weathering, erosion, and denudation, aswell as slope processes (e.g., Beylich et al., 2004; Leopold et al., 2008).Recent advances in remote and geophysical sensing of microbial andchemical processes in groundwater and at water-mineral interfaces(Snieder et al., 2007; Atekwana and Slater, 2009) may lead to new orimproved strategies for geophysics-assisted characterization ofbiochemical processes in the regolith.
Geophysical tools use variations in physical properties of Earthmaterial to characterize the subsurface (Knight and Endres, 2005); inthe case of landforms the information obtained can include the type ofmaterial, the internal structures, and the dimensions. The range ofgeophysical methods is very broad and can be categorized based onthe physical principles that govern a response, but also on whetherthe technique uses an active source or a passive one. No currentoverview exists of the state-of-the art or recent developments for awide range of geophysical techniques in the context of landforms.Other recent papers reviewing the use of geophysics for geomorphol-ogy have a different focus. Schrott and Sass (2008) describe asomewhat smaller number of methods, and do not discuss some of thenovel developments included here. Jongmans and Garambois (2007)discuss geophysical methods specifically for the characterization oflandslides, whereas Kneisel et al. (2008) review geophysical methodsfor the study of permafrost. This paper presents an overview of thetheory, strengths and limitations, and novel and future developmentsof selected geophysical tools in landform studies. Because the amountof specific geophysical tools and applications is significantly largerthan what can be discussed in a single manuscript, this paper focuseson those techniques best suited for geomorphological investigations,including methods with a proven track record and those for whichrecent advances suggest a more widespread use in the future.
In this paper, following a review of the different methods, recentadvances, and new developments, a few specific examples of the useof geophysical methods for landform studies are presented. Thesecase studies are followed by a summary of the methods including the
advantages and disadvantages of each. This manuscript gives anoverview of the issues and does not aim to be an exhaustive review ofall methods, applications, and published literature.
2. Methods
Traditionally, geophysical methods for subsurface characterizationare classified as either potential field methods, including gravity andmagnetics, or methods that use propagating fields, such as electric-electromagnetic and seismic methods (National Research Council,2000). For select methods, this section provides a brief technicalbackground, discusses strengths and limitations, and gives examplesfrom scientific literature of applications in landform characterizationand geomorphology. Following a brief description of potential fieldapproaches, methods that use propagating fields are addressed inmore detail. Also, a brief discussion is given on the joint use ofcomplimentary methods. This paper does not specifically discussborehole geophysics, including single-well geophysical boreholelogging (e.g., Dalan and Goodman, 2007) or cross-borehole tomog-raphy (Paillet and Ellefsen, 2005).
The emphasis of this paper is on terrestrial geophysical methods,although some examples given in the text use airborne and marineequipment platforms. Geophysical surveys from the air typically allowfor much faster spatial coverage than most terrestrial equivalents, butthe relatively high cost of data collection limits its widespread use.Nevertheless, this approach often yields results very useful for studiesof landforms and (buried) landscapes (e.g., Worrall et al. 1999;Gabriel et al., 2003). Similarly, marine geophysical platforms for use inoceans and lakes are not addressed separately in this paper, but mosttools available for terrestrial applications have offshore equivalents.Marine geophysical surveys are ideally suited to study drowned orburied paleo-landscapes and landforms (e.g., Amelio and Martorelli,2008).
2.1. Potential field methods
The gravity method uses small variations in the gravitational fieldof Earth caused by a non-homogeneous subsurface mass distributionto obtain information on the density, depth, and geometry ofsubsurface features. The magnetic method measures variations inthe magnetic field of Earth to obtain information on the depth andgeometry of subsurface bodies with anomalous magnetic character-istics. In the context of landform characterization and landscapeevolution, potential field measurements are useful for study ofintrusive bodies, karst and tectonic features, and buried topography,amongst others (e.g., Wu and Bruhn, 1994; Almeida-Filhoa et al.,2009; Casas-Sainza and de Vicente, 2009). A more thoroughdiscussion of the technical aspects of these and other geophysicalmethods can be found in literature and text books (e.g., Butler, 2005;and references therein).
2.2. Ground-penetrating radar
Ground-penetrating radar (GPR) has become widely used as a toolto study the shallow subsurface in a broad range of applications andsettings. GPR measures changes in the electromagnetic properties ofsubsurface features that cause reflection of transmitted electromag-netic waves, typically in the frequency range of 0.025–1 GHz. Thetechnique emerged in the 1940s but was first used for geotechnicalapplications in the 1970s. From the 1980s, when the first commercialsystems became available (Annan, 2002), the use and variety ofapplications of GPR has steadily increased. Since the middle of the1990s, the use of GPR in the field of Earth sciences has seen dramaticincreases because of significant advances in equipment functionalityand software for data processing and visualization. The use of GPR ingeomorphology started with work on deltaic deposits and eolian
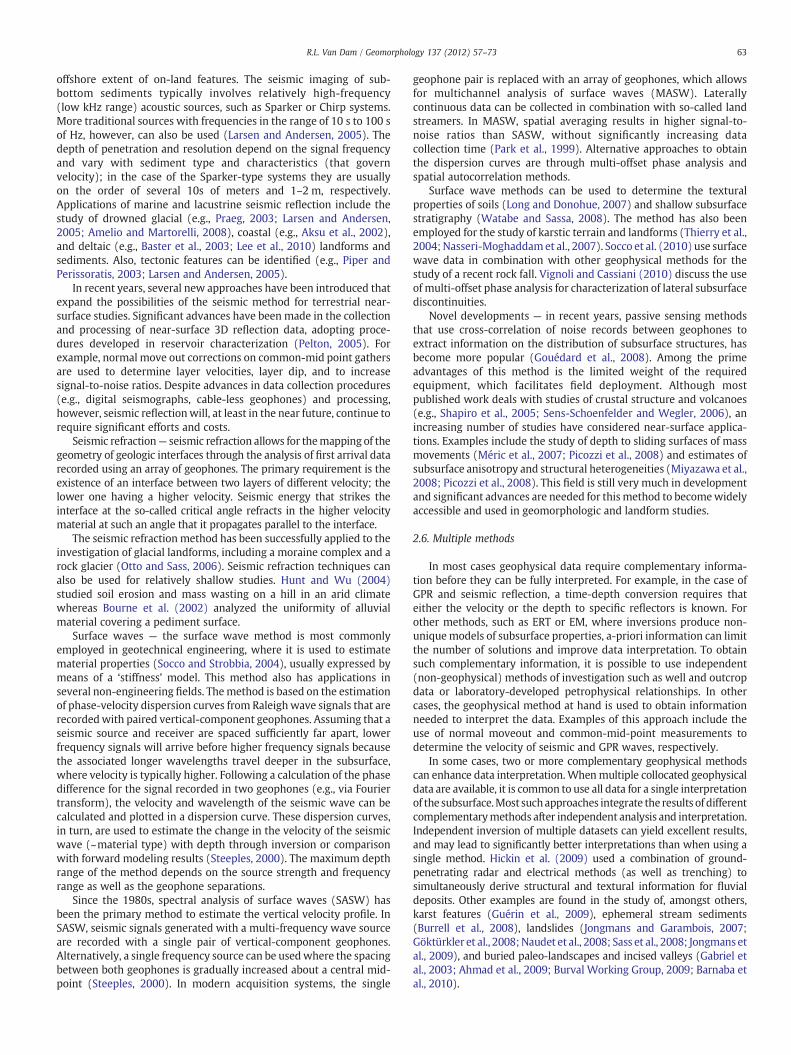
Fig. 2. GPR data of eolian sediment collected using (A) 100 and (B) 200 MHz antennae.Although wavelength and penetration depth are significantly different for both panels,the overall character of the first 4 m of the data is comparable. Several reflections arevisible at both frequencies, including a reflection from a soil with high impedancecontrast (①) and reflections from major sedimentary structures (② and③). Data werecollected using a Sensors and Software pulseEkko100 system with 400 V transmitter.Figure adapted from Van Dam and Schlager (2000).
59R.L. Van Dam / Geomorphology 137 (2012) 57–73
landforms (Jol and Smith, 1991; Schenk et al., 1993), but has spread toa much wider range of environments since then, including, amongstothers, glacial landforms such as eskers, kames, and kettles (e.g.,Busby and Merritt, 1999; Burke et al., 2008) and morphologyassociated with peat landscapes (e.g., Comas et al., 2004; Rosa et al.,2009).
The typical application of GPR involves a pair of transmitting andreceiving dipole antennas in common-offset mode that are movedacross the surface to generate 2D cross-sections of the subsurface(Fig. 1). Signal post processing is often limited to the removal of lowand high frequency content, a static shift to correct for first arrival driftand surface topography, and the application of a gain function tocorrect for signal attenuation with depth. More advanced processingsteps, however, can bring out additional data qualities (Cassidy,2009).
Radar reflections result from contrasts in dielectric propertiesbetween adjacent layers, which can be induced by, amongst others,changes in textural characteristics, water content and state (i.e.,liquid, frozen), and fluid conductivity. In unsaturated conditions of thenear-surface, typical for many landform studies, the most prominentcause for GPR reflections is variations in water content, which can beattributed to differences in water-retention capacity. Such differencesresult from textural variations (e.g., porosity, grain-size distribution)or the presence of material that prevents interstitial water fromdraining (Van Dam and Schlager, 2000; Neal, 2004). In exceptionalcases reflections can be caused bymineralogical changes (Moore et al.,2004; Buynevich et al., 2007; Girardi and Davis, 2010).
Among the most significant drawbacks of GPR is the usually poorperformance in electrically conductive material, causing signalattenuation. An additional consideration is the tradeoff betweenpenetration depth and resolution for different antenna frequencies.Although in many cases a change in frequency will not significantlyalter the character of the imaged structures (Fig. 2), in situations withonly small variations in the dielectric contrast parameter, constructiveand destructive interference may lead to ‘phantom’ reflections(Fig. 3).
Novel developments — in recent years, GPR has seen severaldevelopments and advances in equipment, novel surveying methods,and processing that have the potential to have an impact on how GPRis used for landform studies. Most major equipment manufacturersnow offer multi-channel systems that can be used for a range of
Fig. 1. GPR data collection using (A) traditional common-offset arrangement with onetransmitter (Tx) and one receiver (Rx) antenna, (B) dual-channel configuration (e.g.,Gerhards et al., 2008), and (C) multiple-receiver setup (e.g., Bradford, 2006). Both (B)and (C) allow for multi-offset or multi-fold data collection. The diagonal lines representtravel paths for energy from transmitter to receiver that reflects off a horizontalinterface.
purposes including the collection of continuous multi-offsetsurveys (Bradford, 2006) and data collection using multiple antennafrequencies and/or antenna polarizations (Streich et al., 2006)simultaneously (Fig. 1B, C).
Although standard in seismic data acquisition and processing,multi-offset surveys are still a novelty for GPR users, despite that suchdata can significantly enhance signal-to-noise ratios (Turesson, 2007).Multi-channel systems add material costs and require substantiallymore processing efforts, but may reduce the operation costs. Theacquisition of multi-offset data using multi-channel systems has thepotential to enhance data quality without significantly increasing dataacquisition time (Bradford, 2006). Several publications in the last fewyears show how continuous multi-offset data collection can improvecharacterization of near-surface heterogeneities and permafrostconditions (Bradford, 2008; Gerhards et al., 2008).
Full-resolution data with un-aliased reflections in three dimen-sions can dramatically increase the resolution of complex stratigraph-ic information over conventional 2D and pseudo-3D data (Grasmuecket al., 2005). Such full-resolution 3D data acquisition requires quarter-wavelength (1/4λ) spatial sampling in both inline and crosslinedirections (Fig. 4). Using traditional approaches, 3D data are very timeconsuming to collect. In recent years, however, researchers haveexperimented with different approaches to increase positioningaccuracy, including prism tracking (Heincke et al., 2005) and rotarylaser systems (Grasmueck and Viggiano, 2007). To highlight thebenefit of 3D GPR data for characterization of complex subsurfacestructures, a full-resolution dataset of a heterogeneous braided riverdeposit (Dogan et al., in review) was artificially downsampled. Torepresent typical pseudo-3D data (coarsely spaced parallel lines orgrids), this full-resolution cube was resampled to include only linesspaced 50 cm and 1 m apart. The results illustrate that coarsersampling has relatively little effect on subhorizontal reflections(Fig. 4C, E), but strongly impacts the quality of angled reflections invertical cuts (Fig. 4D, F) and time slices.
Fig. 3. (A) Models of relative permittivity (i.e., dielectric constant) and reflection coefficient for thinly laminated sediment, based on data from Van Dam et al. (2003b). The dielectricimpedance model used for synthetic modeling assumes a 1 m thick homogeneous unit (relative permittivity=4) before the first measurement and sedimentary layers with athickness of 1 mm. Radar response was modeled for (B) 200 and (C) 900 MHz antenna frequencies, including energy losses due to spherical spreading. Traces are plotted withconstant multiplier gains of 50 and 25, respectively. The dissimilarity between the two sections is an indication for the strong effect of signal interference. Only the topmost reflectorthat corresponds to the initial change in dielectric impedance is similar for both panels.
60 R.L. Van Dam / Geomorphology 137 (2012) 57–73
2.3. Electrical resistivity
Active electrical methods for subsurface characterization arenumerous, but can generally be divided into those that inducecurrents into the ground through direct coupling or throughcapacitively-induced coupling. In the typically used direct couplingmethod, also called the galvanic source method, low-frequencyalternating current is applied to the earth using a pair of electrodesthat have been inserted into the ground. Two separate electrodes areused to measure the potential difference over the circuit. Using Ohm'sLaw and the geometry of the used electrode configuration, theresistivity (or in the case of non-homogeneous material, apparentresistivity) can then be calculated. The electrical resistivity of amaterial is a measure of the difficulty of conducting electrical current,and is a complex function of textural properties, surface conductanceeffects of clays, water saturation, fluid conductance (~salinity), andtemperature (Revil and Glover, 1998; Knight and Endres, 2005; Reyand Jongmans, 2007; Jayawickreme et al., 2010). Examples of the useof electrical methods in geomorphology can be found in the study oflandslides (Naudet et al., 2008), sedimentary environments (Baines etal., 2002; Maillet et al., 2005), glacial landforms (Parkes et al., 2009),and karst and caves (Roth et al., 2002; Zhou et al., 2002; Pánek et al., Inpress).
An alternative galvanic-source resistivity method is inducedpolarization (IP). The IP method uses frequency-domain phase shiftsto estimate the chargeability of amedium. The capability to store energyis particularly present in certain metals, clay minerals, and fluids withhigh ionic content. The IP method is popular for study of, amongstothers, geothermal areas. The IP chargeability can be characterized insounding and mapping modes and provides complementary informa-tion to regular resistivity surveys; many modern instruments allow forcollection of both types of data in conjunction. More details about bothIP and passive methods using spontaneous potential (SP) effects andtelluric currents can be found in Zonge et al. (2005).
Electrical methods have been used in Earth sciences for more thana century. Originally, the resistivity method was primarily used for
depth sounding and lateral profiling, or so-called constant spreadtraversing (CST). Electrical resistivity electrodes can be deployed in alarge number of ways, but data are often collected using standardconfigurations, such as wenner and dipole–dipole (Fig. 5). Modernelectrical resistivity tomography (ERT) equipment, which uses multi-plexers or electronically switching (active) electrodes and sometimesmulti-channel receivers, collects data for numerous electrode combi-nations along arrays of electrodes to generate tomographic images ormaps of subsurface electrical properties (Dahlin and Zhou, 2004). ERTdata collected along 2D transects are typically plotted in pseudosec-tions, where image points correspond to the lateral position of theelectrodes and to the approximate depth of investigation (Fig. 5). Thedepth of investigation of the various array types is related to electrodeseparation and configuration and also to the distribution of subsurfaceresistivity. Resolution decreases with increasing depth of exploration(Szalai et al., 2009).
Interpretation of ERT data requires inversion of the apparentresistivities, where through an iterative process a model is calculatedthat best fits the measurements (Pelton et al., 1978; Loke and Barker,1996). Typical inversion procedures use a finite difference mesh witha starting model that can be based on the average apparent resistivityin the data set or use a-priori information, such as obtained fromborehole or other geophysical data. To choose between multiplemodels that fit the data it is common to use smoothness constraints.Such constraints ensure that the resulting model explains theobserved values to a level that is acceptable, while simultaneouslyavoiding large spikes in the modeled resistivity values. Constraintscan also be placed on the ‘hardness’ of a-priori information. Tointerpret the final model in terms of the properties of interest, site-specific petrophysical relationships may need to be developed in thelaboratory.
Novel developments — in recent years, capacitively-coupledresistivity (CCR) systems have seen increased use. A notable benefitof this inductive-source method is the elimination of electrodes,because currents are induced into the ground using coils that do notneed to make physical contact with the ground (Christensen and
Fig. 4. (A) Full-resolution, un-interpolated GPR data cube with clearly visible sedimentary structures in the vertical cuts and in the depth slice. Time-to-depth conversion used avelocity of 0.058 m/ns. The data shown are part of a larger 3D dataset that was collected using a Sensors and Software pulseEkko100 system with 1000 V transmitter and 100 MHzantennas at the Columbus Air Force Base in Mississippi in water-saturated channel deposits (Dogan et al., in review). Data were processed using ReflexW and plotted using MATLAB.(B) Survey grid consisting of 31×31=961 measurement locations. The bin size of 10×10 cm ensures full-resolution (b1/4 wavelength in both inline and crossline directions) datacollection for 100 MHz antennas in saturated sediment. Data were collected along inlines; arrows indicate the start of the first three survey lines. The full-resolution data in (A) wereresampled to highlight the effect of lower data density on quality of imaged sedimentary structures. Data resampled to 50 cm distance for (C) crosslines and (D) inlines and to100 cm separation for (E) crosslines and (F) inlines.
61R.L. Van Dam / Geomorphology 137 (2012) 57–73
Sorensen, 2001). This can lead to a significant increase in surveyflexibility and speed of data collection, although production increasescan also be achieved by innovative electrode designs (Panissod et al.,1997). The CCR may be hindered by lower reproducibility thangalvanic source methods. Also, CCR systems commonly use arelatively small number of electrode pairs, which limits the depthcoverage. Examples of the use of CCR for geomorphology can be foundin permafrost detection and mapping (Hauck and Kneisel, 2006; DePascale et al., 2008) and characterization of fluvial and coastaldeposits and landforms (Hickin et al., 2009; Ziekur and Grelle, 2009).
A second novel development is the use of electricalmethods for themonitoring of dynamic processes, which has become possible as aresult in recent advances in equipment and software. Althoughsuccessful examples exist of time-lapse data collection using various
types of geophysical equipment, electrical resistivity methods areparticularly suited for this task because permanent field installationscan be achieved at relatively low cost and with minimal disturbance(e.g., Jayawickreme et al., 2010). Time-lapse monitoring of dynamicprocesses requires that the change in electrical properties over thetime period of interest is sufficiently large, which is not always thecase. Nevertheless, numerous potential applications exist for thisapproach. For example, time-lapse ERT was successfully used tomonitor the dynamics of permafrost in rock walls (Krautblatter andHauck, 2007; Krautblatter et al., 2010). Hilbich et al. (2008) includedtime-lapse ERT in a study of short- to long-term freeze–thawprocessesinmountain permafrost. Time-lapse ERT has also been used tomonitorresistivity distribution in landslides caused by changes in fluidsaturation and hydrostatic pressure (Lebourg et al., 2010).
Fig. 5. Principle of multi-electrode resistivity data collection for (A) dipole–dipole and(B) wenner arrays. The current (I) and potential (V) electrode pairs for selectconfigurations are shown. The two current electrodes are typically denoted A and B; thetwo potential electrodes are M and N. A dipole–dipole configuration with n=1 is alsoknown as wenner-beta. Reversing electrode order (e.g., from AMNB to BNMA in awenner array) constitutes a reciprocal measurement and is used to check dataconsistency. Image points are plotted as a function of electrode separation and position.The apparent resistivity pseudosections are converted into resistivity models throughinversion.
62 R.L. Van Dam / Geomorphology 137 (2012) 57–73
2.4. Electromagnetic induction
Electromagnetic (EM) methods for near-surface applicationsinclude several active and passive source methods that are verysuitable for rapid mapping of electrical conductivity, magneticsusceptibility, or magnetic permeability variations, either in hand-held, on the-ground, or airborne modes (Tezkan, 1999; Auken et al.,2006). The measured quantity can be related to various properties ofinterest, including texture and fluid content. Because EMmethods areespecially sensitive to conductive bodies, variations in clay content,water saturation, and fluid salinity are good targets. The majority ofapplications of EM methods are in hydrology and mineral prospect-ing; its use in landform studies is still relatively rare. Electromagneticmethods can be categorized as controlled-source frequency-domainmethods (FDEM) and transient or time-domain methods (TEM/TDEM). All EM data collection can be strongly impacted by nearbymetal structures, such as underground cables, fences, and power lines.
Most controlled-source FDEM methods use a transmitter coil orloop to generate a continuous, sinusoidal field that interacts with theground and with individual conductors. The secondary field, mea-sured as a vectoral summation with the primary field in a receivingcoil/loop, is used to obtain information about subsurface conductivity.The ability of FDEM systems to detect weak secondary responsesrequires removal of the primary field, which is difficult for systemswith separate transmitter and receiver coils. Smaller systems withboth coils in a rigid configuration do not have this limitation and areeffective for near-surface investigations. FDEMmethods are primarilyused for lateral profiling, without quantitative interpretation of depthand true conductivity. The depth sensitivity and range of FDEMsystems, however, can be varied in a number of ways, including bychanging the spacing distance between transmitter and receiver coils,changing the signal frequency, and changing the coil orientation orinstrument height. Inversion can then be used to infer verticalsubsurface electrical conductivity structure (e.g., Hendrickx et al.,2003; Christensen et al., 2010).
Transient electromagnetic systems use a primary field that ispulsed instead of continuous as in FDEM systems. TEM is typicallyused for mapping of depth and spatial extent of conductive subsurfacefeatures. After the primary field in the transmitter coil has beenturned off, a receiver coil or loop measures the time-decay of thesecondary EM field. The measured response depends on the depth toand conductive properties of the target. TEM systems come in a
variety of designs that all have tradeoffs between near-surfaceresolution and depth of investigation.
Typically, EM data are invertedwith 1Dmodels (Farquharson et al.,1999; Vallée and Smith, 2009), which benefits from a relatively smallcomputational effort and has been demonstrated to work well whenthe subsurface is layered. Multi-dimensional approaches for theinversion of spatial data, which may be required in case of morecomplex subsurface structures, are only useful when the depthcoverage is significant and station spacing sufficiently small. In recentyears there has been a push for laterally constrained as well as full 2Dand 3D inversion codes (e.g., Wisén and Christiansen, 2005), whichwillmake EMmethodsmore attractive for geomorphological research.
Examples of the use of FDEM methods for geomorphology includethe study of frost wedges (Cockx et al., 2006) and sediment anisotropy(Sutinen et al., 2009). Based on the observation that a preferredorientation of (magnetic) particles and the clast fabric of tills can leadto electrical micro-anisotropy, Sutinen et al. (2009) used azimuthalmeasurements to determine the orientation of depositional features.Such measurements are easy to perform using most FDEM systemswith fixed coil distance (as well as with electrical resistivity arrays)and can serve as complementary information to surface mapping.Airborne FDEM and TEM techniques have been used to reconstructlarge-scale landscape evolution (Wilford, 2009) and to map buriedonshore and offshore paleo-channels (Evans et al., 2000; Bosch et al.,2009; Steuer et al., 2009). For a 150 km2 area in Denmark, Jorgensenet al. (2010) used airborne TEM data in combination with boreholedata to develop a series of models of tunnel valleys.
In recent years, planewavemethods, which use signal propagationon a wave front without curvature, have been applied occasionally fornear-surface and landform studies. The method, which in itself is notnew, requires an EM source located at a significant distance (at least10 times longer than the wavelength) and measures orthogonalcomponents of the magnetic field to locate anomalies (Auken et al.,2006). The EM source can be a dedicated antenna, but exists morecommonly of existing transmitters in the frequency range of interest.Measurement equipment is sometimes augmented with galvanic orcapacitive electrodes to measure electrical field components. Signalpenetration is a function of the frequency and material conductivity.For the purpose of landform studies, anthropogenic sources thatoperate at radio frequencies (radiomagnetotellurics, RMT) or only inthe very low frequency (VLF) range of radio signals (Beamish, 2000),are most relevant. At these frequencies depths of penetration aretypically on the order of meters to several 10s of meters.
Multi-frequency VLF and RMT equipment is relatively small andallows for rapid on the-ground or airborne profiling. An additionaladvantage is the availability of inversion codes to obtain 2Dsubsurface models (Auken et al., 2006). Examples of recent studiesusing RMT have delineated structural features (Carvalho Dill et al.,2009) and subsurface stratigraphy (Seher and Tezkan, 2007). Beylichet al. (2004) used RMT in combination with water discharge andwater chemistry data to characterize regolith thickness in a study ofchemical denudation in an arctic-alpine drainage basin. VLF was usedto characterize the internal structure of a mud volcano (Lin and Jeng,2010) and for the study of faults (Gürer et al., 2009).
2.5. Seismics
Seismic methods have long been used in Earth science research,but applications in geomorphology and landform studies have beensomewhat limited. The most commonly used seismic methods areseismic reflection, seismic refraction and the seismic surface wavemethod. A useful summary of the theory and methods is found inSteeples (2000).
Seismic reflection — seismic reflection images of landforms havemostly been obtained from submarine and lacustrine features. Forgeomorphologists, such studies provide invaluable information on the
offshore extent of on-land features. The seismic imaging of sub-bottom sediments typically involves relatively high-frequency(low kHz range) acoustic sources, such as Sparker or Chirp systems.More traditional sources with frequencies in the range of 10 s to 100 sof Hz, however, can also be used (Larsen and Andersen, 2005). Thedepth of penetration and resolution depend on the signal frequencyand vary with sediment type and characteristics (that governvelocity); in the case of the Sparker-type systems they are usuallyon the order of several 10s of meters and 1–2 m, respectively.Applications of marine and lacustrine seismic reflection include thestudy of drowned glacial (e.g., Praeg, 2003; Larsen and Andersen,2005; Amelio and Martorelli, 2008), coastal (e.g., Aksu et al., 2002),and deltaic (e.g., Baster et al., 2003; Lee et al., 2010) landforms andsediments. Also, tectonic features can be identified (e.g., Piper andPerissoratis, 2003; Larsen and Andersen, 2005).
In recent years, several new approaches have been introduced thatexpand the possibilities of the seismic method for terrestrial near-surface studies. Significant advances have been made in the collectionand processing of near-surface 3D reflection data, adopting proce-dures developed in reservoir characterization (Pelton, 2005). Forexample, normal move out corrections on common-mid point gathersare used to determine layer velocities, layer dip, and to increasesignal-to-noise ratios. Despite advances in data collection procedures(e.g., digital seismographs, cable-less geophones) and processing,however, seismic reflectionwill, at least in the near future, continue torequire significant efforts and costs.
Seismic refraction— seismic refraction allows for themapping of thegeometry of geologic interfaces through the analysis of first arrival datarecorded using an array of geophones. The primary requirement is theexistence of an interface between two layers of different velocity; thelower one having a higher velocity. Seismic energy that strikes theinterface at the so-called critical angle refracts in the higher velocitymaterial at such an angle that it propagates parallel to the interface.
The seismic refraction method has been successfully applied to theinvestigation of glacial landforms, including a moraine complex and arock glacier (Otto and Sass, 2006). Seismic refraction techniques canalso be used for relatively shallow studies. Hunt and Wu (2004)studied soil erosion and mass wasting on a hill in an arid climatewhereas Bourne et al. (2002) analyzed the uniformity of alluvialmaterial covering a pediment surface.
Surface waves — the surface wave method is most commonlyemployed in geotechnical engineering, where it is used to estimatematerial properties (Socco and Strobbia, 2004), usually expressed bymeans of a ‘stiffness’ model. This method also has applications inseveral non-engineering fields. Themethod is based on the estimationof phase-velocity dispersion curves from Raleighwave signals that arerecordedwith paired vertical-component geophones. Assuming that aseismic source and receiver are spaced sufficiently far apart, lowerfrequency signals will arrive before higher frequency signals becausethe associated longer wavelengths travel deeper in the subsurface,where velocity is typically higher. Following a calculation of the phasedifference for the signal recorded in two geophones (e.g., via Fouriertransform), the velocity and wavelength of the seismic wave can becalculated and plotted in a dispersion curve. These dispersion curves,in turn, are used to estimate the change in the velocity of the seismicwave (~material type) with depth through inversion or comparisonwith forward modeling results (Steeples, 2000). The maximum depthrange of the method depends on the source strength and frequencyrange as well as the geophone separations.
Since the 1980s, spectral analysis of surface waves (SASW) hasbeen the primary method to estimate the vertical velocity profile. InSASW, seismic signals generated with a multi-frequency wave sourceare recorded with a single pair of vertical-component geophones.Alternatively, a single frequency source can be usedwhere the spacingbetween both geophones is gradually increased about a central mid-point (Steeples, 2000). In modern acquisition systems, the single
geophone pair is replaced with an array of geophones, which allowsfor multichannel analysis of surface waves (MASW). Laterallycontinuous data can be collected in combination with so-called landstreamers. In MASW, spatial averaging results in higher signal-to-noise ratios than SASW, without significantly increasing datacollection time (Park et al., 1999). Alternative approaches to obtainthe dispersion curves are through multi-offset phase analysis andspatial autocorrelation methods.
Surface wave methods can be used to determine the texturalproperties of soils (Long and Donohue, 2007) and shallow subsurfacestratigraphy (Watabe and Sassa, 2008). The method has also beenemployed for the study of karstic terrain and landforms (Thierry et al.,2004; Nasseri-Moghaddamet al., 2007). Socco et al. (2010) use surfacewave data in combination with other geophysical methods for thestudy of a recent rock fall. Vignoli and Cassiani (2010) discuss the useof multi-offset phase analysis for characterization of lateral subsurfacediscontinuities.
Novel developments — in recent years, passive sensing methodsthat use cross-correlation of noise records between geophones toextract information on the distribution of subsurface structures, hasbecome more popular (Gouédard et al., 2008). Among the primeadvantages of this method is the limited weight of the requiredequipment, which facilitates field deployment. Although mostpublished work deals with studies of crustal structure and volcanoes(e.g., Shapiro et al., 2005; Sens-Schoenfelder and Wegler, 2006), anincreasing number of studies have considered near-surface applica-tions. Examples include the study of depth to sliding surfaces of massmovements (Méric et al., 2007; Picozzi et al., 2008) and estimates ofsubsurface anisotropy and structural heterogeneities (Miyazawa et al.,2008; Picozzi et al., 2008). This field is still very much in developmentand significant advances are needed for this method to becomewidelyaccessible and used in geomorphologic and landform studies.
2.6. Multiple methods
In most cases geophysical data require complementary informa-tion before they can be fully interpreted. For example, in the case ofGPR and seismic reflection, a time-depth conversion requires thateither the velocity or the depth to specific reflectors is known. Forother methods, such as ERT or EM, where inversions produce non-uniquemodels of subsurface properties, a-priori information can limitthe number of solutions and improve data interpretation. To obtainsuch complementary information, it is possible to use independent(non-geophysical) methods of investigation such as well and outcropdata or laboratory-developed petrophysical relationships. In othercases, the geophysical method at hand is used to obtain informationneeded to interpret the data. Examples of this approach include theuse of normal moveout and common-mid-point measurements todetermine the velocity of seismic and GPR waves, respectively.
In some cases, two or more complementary geophysical methodscan enhance data interpretation.Whenmultiple collocated geophysicaldata are available, it is common to use all data for a single interpretationof the subsurface.Most suchapproaches integrate the results of differentcomplementarymethods after independent analysis and interpretation.Independent inversion of multiple datasets can yield excellent results,and may lead to significantly better interpretations than when using asingle method. Hickin et al. (2009) used a combination of ground-penetrating radar and electrical methods (as well as trenching) tosimultaneously derive structural and textural information for fluvialdeposits. Other examples are found in the study of, amongst others,karst features (Guérin et al., 2009), ephemeral stream sediments(Burrell et al., 2008), landslides (Jongmans and Garambois, 2007;Göktürkler et al., 2008;Naudet et al., 2008; Sass et al., 2008; Jongmansetal., 2009), and buried paleo-landscapes and incised valleys (Gabriel etal., 2003; Ahmad et al., 2009; Burval Working Group, 2009; Barnaba etal., 2010).
64 R.L. Van Dam / Geomorphology 137 (2012) 57–73
Alternative approaches to combine geophysical data are con-strained or coupled inversion and joint inversion. In joint inversion, acommon objective function is minimized to obtain a single inversemodel (Christiansen et al., 2007). Geophysical methods are governed,however, by different physical properties of Earth material, and thesensitivity to specific subsurface features is often different. Therefore,joint inversions can result in large data misfits. An alternative andsimpler approach is the use of mutually constrained inversion ofgeophysical data (Wisén and Christiansen, 2005), who discuss thisapproach for resistivity and surface wave seismic data. Examples ofjoint inversion of geophysical datasets is found in a paper by Schmutzet al. (2000), who used TEM and electrical resistivity sounding data toimprove understanding of an earthflow in the French Alps (Schmutzet al., 2009). Gallardo and Meju (2003) use a cross-gradient criterionto jointly invert resistivity and seismic refraction data. It is likely thatwhen joint and coupled inversion approaches become more widelyaccepted and available, they will provide benefits for high-resolutioncharacterization of landforms.
3. Example applications
In this section three case studies are discussed that represent asmall cross-section of the possible applications of geophysical tools forlandform characterization and geomorphology. The emphasis of thesecase studies is on the use of electrical resistivity methods and ground-penetrating radar in the study of two types of (peri)glacial landformsand one sedimentary landform. These studies are all limited tolandforms smaller than a few 100s of meters. The examples are placedin the context of relevant other research, including those that study asimilar type of landform using a different geophysical method andvice versa. The first example discusses a study of ERT imaging ofpatterned ground, a feature common in permafrost landscapes. Thesecond example is of the use of CST for characterization of large-scaleglaciotectonic deformation structures. The third example covers GPRmethods to study the development of an eolian dune on a coastal spit.
This section is not intended to cover all geophysical methods or alltypes of landforms covered earlier. For example, this section does notdiscuss several genetic classes of landforms, including volcanic,marine, and fluvial landforms and peat landscapes, as well as erosiveand buried landscapes and regolith processes. As much as possible,the previous sections have identified published research on the use ofgeophysical methods for those types of landforms. Some of theapproaches andmethods discussed for the presented case studiesmaybe applicable to other types of landforms.
3.1. ERT imaging of patterned ground
Non-sorted polygonal patterned ground is often an indicator ofcurrent or past permafrost conditions. The genesis of such features is notalways clear, however, because different processes can result in similarforms of patterned ground and different forms of patterned ground canresult from a single process. One of several genetic processes that havebeen proposed for the development of patterned ground is the thermalcontraction-fissuring of seasonally frozen ground or permafrost. Duringthermal degradation of permafrost (or seasonally frozen ground), icewedges that formed during contraction-fissuring will thaw, and can bereplaced by allochthonous material (Murton and French, 1993).Patterned ground has been characterized by traditional approachessuch as surface mapping and trenching, but also by geophysicalmethods, including GPR (Hinkel et al., 2001; Moorman et al., 2003;Munroe et al., 2007;Doolittle andNelson, 2009), EM induction (Cockx etal., 2006), electrical resistivity (Greenhouse and Morgan, 1977), or acombination of methods (Fortier and Allard, 2004; Godfrey, 2008).
In a recent study in the Saginaw Lowlands in Michigan, USA,polygonal patterned ground, attributed to paleo-permafrost, wascharacterized by mapping with aerial photographs, GIS and statistical
methods, soils characterization, and geophysics (Lusch et al., 2009).Strongly patterned groundwas found in approximately 5% (~1000 km2)of the total study area, bounded by paleo-shorelines of Glacial LakesElkton andWarren (Fig. 6). This constrains the formation to a period ofapproximately 500 years between 14.8 to 14.3 thousand calendar yearsbefore present. The majority of polygons in the study area are about 1hectare in size, with a long axis that is, on average, double the short axis.Most polygons are oriented roughly north–south and are formed inloamy soil texture classes (Lusch et al., 2009). Sites for detailed fieldinvestigations were chosen based on aerial photographs and werelocated in forested areas to minimize disturbance from farmingactivities (Fig. 6). Soil-boring transects were completed betweenpolygon centers, crossing at least one low-lying inter-polygon swale;the elevation differences between the polygon interiors and swalesare up to 1.5 m. For each 1–2 m deep boring, soil texture, color, gravelcontent and sediment type was recorded. Along these transects,electrical resistivity was used to identify lateral and vertical variationsin textural properties and water content, using the assumption oflimited variation in the fluid conductivity of the pore water, which isreasonable for Michigan conditions (Jayawickreme et al., 2010).
ER data collected at sites A–C showed higher resistivity in thepolygon centers than in the polygon swale (Fig. 7). At sites A and B,this difference in resistivity is related to a sand cap (thin at A, ~80 cmthick at B) that was located above dense till in the polygon centers.The thick sand cap at B resulted in substantially higher values ofresistivity than at site A or C. Because no significant textural differencebetween polygon centers and swale was detected in soil borings atsite C (silt-loam till extended to the surface), the difference inresistivity there is interpreted to result from a contrast in moisturecontent. At sites B and C, the values of resistivity are markedlydifferent on opposite sides of the swale (for both, the values arehighest on the left of the swale). This difference is likely a result oftopography, with the driest conditions and, thus, highest values ofresistivity for the highest elevation.
At site D, constant spread electrical resistivity profiling wassuccessfully used to locate a high resistivity anomaly in a swale verynear the location of an apparent sand-wedge cast (Lusch, 1982; Luschet al., 2009). Fig. 8 shows the results of two parallel CST profiles; testborings prior to opening the soil pit confirmed that at a position ofx=0 m, where values of resistivity where highest, sand was present.This anomaly was excavated and confirmed to be a bowl-shaped,laterally continuous, body of sandy loam, interpreted as a thermokarstchannel (Lusch et al., 2009). In this study, ERT and CST providedcomplementary information to mapping from aerial photos andtraditionalmethods for characterizing soils. The datawere collected inlate fall, post harvest, to ensure access for fieldwork to agriculturalplots. Better results could likely be achieved during the summermonths, when the contrast in water content, and, thus, electricalresistivity, between polygons and swales would be larger.
3.2. CST characterization of large-scale glaciotectonic deformation
Traditional methods for characterizing glaciotectonic deformationinclude outcrop and aerial mapping (Boulton, 1999; Arnaud, 2008), aswell as coring, borehole logging, and cone penetration tests (Bakker,2004). Outcrop mapping can provide excellent two-dimensionalinformation on the distribution of grain sizes, stratigraphy, andstructural features, but is limited to available exposures. Remotesensing data, including satellite images, aerial photos, and derivedproducts such as digital elevation models, have been extensively usedto characterize glacial deformation structures (Smith et al., 2006).Whereas remotely sensed data allow for large spatial coverage, it doesnot provide direct subsurface information. Borehole methods are veryuseful for gathering high-vertical-resolution data on textural proper-ties, and subsurface stratigraphy. Cone penetration tests (CPT) anddirect-push measurements can be used to obtain geotechnical and
Fig. 6. (A) Regional map of the Saginaw Lowlands with locations of mapped patterned ground. (B) Aerial photo showing field sites (picture from National Aerial PhotographyProgram DOQs, which were taken in Spring of 1997 to 2000 for this region). Figure adapted from Lusch et al. (2009).
65R.L. Van Dam / Geomorphology 137 (2012) 57–73
hydrological properties of the subsurface at a fairly rapid pace (Bakkerand Van Der Meer, 2003; Liu et al., 2009). All borehole methods,however, are limited by the spatial distribution.
Geophysical methods that have been used for the study ofglaciotectonic features include GPR (Lønne and Lauritsen, 1996;Busby and Merritt, 1999; Jakobsen and Overgaard, 2002; Bakker andVan Der Meer, 2003; Bennett et al., 2004; Sadura et al., 2006) andseismic methods (Williams et al., 2001; Larsen and Andersen, 2005).Of these, GPR may have a small penetration depth compared to thedimensions of the deformation, whereas seismic data collection canbe cumbersome on-land and is, therefore, often limited to offshoretransects. Electrical resistivity studies offer the opportunity topenetrate deeper than most GPR surveys, but are likely to havelower resolution. Because of its governing principles, electricalresistivity will be most useful to delineate glaciotectonic featuresthat are associated with large textural or water content changes.Examples in the literature of the use of electrical resistivity for theimaging of glaciotectonic deformation are rare.
The work presented here focuses on an area known as theLudington Ridge, south of the town of Ludington, Michigan, whereLarson et al. (2003) described several large-scale deformationstructures in a steep cliff bordering Lake Michigan. Throughout theLudington ridge, and particularly in the cliff area, springs and gulliesindicate a preferred pattern of groundwater drainage and pastlandslides related to this deformation. The Ludington Ridge is anelongated NW–SE extending landform of considerable height (Fig. 9).Stratigraphic units in the ridge include glaciolacustrine sediments aswell as glacial re-advance tills and young eolian dune sand. Thesediment below the area of interest is entirely comprised of the“lower stratified sand” unit, which reaches a thickness of over 35 m.The unit consist primarily of horizontally and cross-bedded sands, butis locally interbedded by finer units up to several meters thick.Evidence for a subaqueous origin of the unit includes drop stones andload structures, amongst others (Larson et al., 2003).
This study focuses on an area of deformation characterized byseveral broad synclines and narrow anticlines (Fig. 9C), which werelikely formed as a result of differential loading during an ice readvanceassociated with the Port Huron moraine system. The anticlinal
structures in the cliff face observed during this study (Fig. 9B)match those mapped previously (Fig. 9C), when lake levels where~1 m higher and the cliff face was largely devoid of vegetation.Although primary sedimentary structures pre-dating the deformationare present in most of the folded units, they are largely absent in thecenter of the narrow anticlinal structures. Although Larson et al.(2003) observed that crests of the anticlines trend east-northeast andappear to form wall-like bodies that separate several broad structuraldepressions, it is currently unknown whether the deformationstructures observed in the outcrop are isolated or continuous features,and if the latter, what is the length and orientation.
Electrical resistivity data were collected along several 2D profilesparallel to the cliff face, with the objective to exploit the largeresistivity contrast between the two primary textural units in thedeposit (Fig. 10). Field data were collected in electrical sounding,constant spread traverse (CST), and multi-electrode tomographymodes (Aylsworth, 2008), all in Wenner configuration (Fig. 5B). Thefocus in this paper is on the CST data. CST data were collected using 25and 75 m a-spacings on the beach (CST1) and 30 and 90 m a-spacingsfor the profiles on the top of the cliff (CST2-5); the larger a-spacingson top of the cliff were necessary to characterize deeper deformationstructures. After each measurement, which consisted of reciprocalmeasurements (Fig. 5), the array was moved by 45 m increments(25 m on the beach); the station spacing was reduced to 15 m in areasof particular interest. The values of apparent resistivity were thenplotted as a function of distance along the profile (Fig. 11). Despitehigh contact resistances, the collected resistivity data were of highoverall quality, as indicated by generally small differences betweenreciprocal values and small repeat errors. An AGI Supersting Earthresistivity system (Advanced Geosciences, Inc., Austin, TX, USA) wasused for data collection in the laboratory (Fig. 10) and field (Fig. 11).
The beach profile, CST1, has lowest overall apparent resistivity,reflecting the subsurface glaciolacustrine clays (Fig. 11). The smalllateral variability indicates absence of any major textural differences.The profiles on top of the cliff (CST2-5) show much more spatialvariation in apparent resistivity, related to the presence of deformedclay structures or other heterogeneities. The results indicate that atleast one of the narrow anticlinal structures observed in the cliff has
Fig. 7. Resistivity models obtained through inversion of multi-electrode resistivity data at sites A–C; see Fig. 6 for locations. Interpretations from hand augering are overlain oninversions results for (B) and (C). An AGI Supersting eight-channel earth resistivity system (Advanced Geosciences, Inc., Austin, TX, USA), with multicore cables and electrodes,spaced at 1 m, was used for data collection. At site (A) data were collected using dipole–dipole configuration. At (B) and (C) dipole–dipole and wenner data were collected andmerged prior to inversion.
Fig. 8. (A) Pit face at Site D (see Fig. 6 for location), showing a bowl-shaped feature,filled with sandy loam, embedded in a silt-loammatrix. A plow layer is present between0 and 30 cm; a dense till horizon starts at 80 cm; picture by R. Schaetzl. (B) Results oftwo parallel (1 m separation) CST profiles used to locate the feature. Data werecollected in dipole–dipole configuration with a=1 m and n=1 (Fig. 5).
66 R.L. Van Dam / Geomorphology 137 (2012) 57–73
an inland extent; for the structure at 600 m north of Chauvez Road, aWSW to ENE orientation of the deformation structure can beinterpreted from the CST data by following the lowest apparentresistivity data from the cliff to inland (indicated with arrows inFig. 11). The large-amplitude anomaly observed in CST2 coincideswith the northernmost cliff structure, but its inland extent (profileCST5) is less evident. This suggests that the structure pinches out orchanges in character or dimensions. Overall, the measurements ofelectrical resistivity contributed to amuch improved understanding ofthe subsurface structures.
3.3. GPR imaging of an eolian dune
GPR is probably the most commonly used geophysical method tocharacterize near-surface sedimentary landforms, particularly in theabsence of significant amounts of clayey material. The signal responsedepends on variations in water content or porosity. In combinationwith dating techniques, such as optically stimulated luminescence(OSL) or 14C, GPR imaging has been used to help unravel thedepositional record of depositional systems. Examples include studiesof, amongst others, eolian dunes (Bristow et al., 2010), coastalsediments (Van Heteren et al., 1998; Nielsen et al., 2009; Johnston etal., 2007), river deltas and fans (Pelpola and Hickin, 2004;Winsemannet al., 2009), fluvial deposits (Bridge et al., 1998; Vandenberghe andVan Overmeeren, 1999; Wooldridge and Hickin, 2005; SambrookSmith et al., 2009) and glaciofluvial material (Fisher et al., 2003).
Here, the results of a GPR study into the stratigraphy anddevelopment of a large active solitary dune on a coastal sandspit inNew Zealand are presented (Fig. 12). Interdune flats make up about70% of the total area, which is characterized by outcrops of a LatePleistocene paleosol that underlies the dunes and interdunal areas(Van Dam et al., 2003a). Organic material in the paleosol suggests thatthe spitwas densely vegetated at the time of formation. The now semi-consolidated paleosol formed in a sequence of beach and dune
Fig. 10. Lab-derived petrophysical relationships between volumetric water content andelectrical resistivity for sandy and clay-rich units in the outcrop. For description of theprocedure, see Jayawickreme et al. (2010).
67R.L. Van Dam / Geomorphology 137 (2012) 57–73
sediments. Subaerial exposure of the paleosol has led to an irregularweathered surface, which causes signal diffraction of the higherfrequency GPR signals. A couple of hyperbolic reflections associatedwith this feature are identified in Fig. 13. The clastic sedimentarymaterial on the spit consists primarily of fine sandy quartz. Thedominant wind direction in the region is from the southwest with animportant component of secondary winds from the northeast tosoutheast (Van Dam et al., 2003a). Detailed sediment transportdynamics on the spit, however, are not known. Unusually high quality(deep penetration, lownoise) GPR datawere collected using a GSSI SIR2000 system with 200 MHz bistatic antennas triggered by anodometer wheel and a manually triggered 35 MHz monostaticantenna. The 200 MHz data were minimally processed in RADAN-NT(Geophysical Software Systems, Inc.) with a time-zero correction,horizontal stacking, distance normalization, and gain. The 35-MHzdata were further processed using a high- and low-pass filter andmigration.
The GPR images reveal three phases of dune development. Theoldest part of the dune (the core) below the small plateau at ~90 m ischaracterized by cross-strata sets of maximum 1.5 m thickness(Fig. 13). These cross-strata sets are separated by gently dippingbounding surfaces with concave-upward shapes. The cross-beddingappears to be mostly eastward dipping at varying degrees ofsteepness. Foreset dip direction, however, could be oriented at anangle to the GPR survey line. Because of this uncertainty it isrecommend that GPR data is collected in perpendicular lines or in agrid pattern (e.g., Van Dam, 2002). The sediment body between 0 and70 m forms the main part of the dune. This section contains largecross-strata sets with thicknesses of up to 5 m. Cross-bedding ismostly westward dipping at or near the angle of repose. This apparentwestward migration of the dune is still active (Fig. 14), while somereactivation has occurred near the small plateau at ~90 m. Lateralexpansion to the north and south was observed in a perpendicularGPR survey line near the dune crest (Van Dam et al., 2003a), whichindicates a possible change in dominant wind direction.
4. Conclusions
In this paper, an overview of the use of geophysics for landformcharacterization is given. This summary should benefit the
Fig. 9. (A) Setting of the Ludington Ridge along Lake Michigan. Elevations are given inmeters above 2000–2009 average lake level, which was 176 m above the InternationalGreat Lakes Datum (IGLD 1985), at the Ludington NOAA gauge #9087023. (B) Aerialphoto showing locations of narrow anticlinal clay structures and geophysical surveytransects; CST labels refer to Fig. 11. (C) Cross-section illustrating large-scaleglaciotectonic deformation observed in the ~60 m high cliff face; see (B) for location.The vertical axis gives height in meters above lake level. (D) Photographs highlightingdifferential weathering of the cliff face associated with clay-rich anticlinal features.Panels (A) and (C) adapted from Larson et al. (2003).
Fig. 11. Apparent resistivity data collected in constant spread traverse (CST) mode for five transects across the Ludington Ridge; the transect positions are given in meters north ofChauvez road (see Fig. 8 for locations). The resistivity values above 2000 Ωm in CST2 are likely influenced by the close proximity to the cliff face. Note the different vertical scale forCST1. Surface topography is given for all transects, except CST1, which was flat.
68 R.L. Van Dam / Geomorphology 137 (2012) 57–73
geomorphological research community because in recent years rapiddevelopments in hardware and software have resulted in new andimproved acquisition techniques, data processing strategies, andmethods for visualization and interpretation of results. The paperpresents an introduction to a range of different methods and includesbasic theory and applications, literature examples on the use of thesemethods in geomorphological research, and novel developments. Inaddition to an introduction to the variousmethods, this paper presentsthree case studies. Geophysical methods are typically classified aseither potential or propagating field methods. Potential field methodsare not a focus of this paper, although several possible applicationsexist in landform studies for gravity and magnetics. Examples of thisinclude, amongst others, the study of buried valleys, karst, and fault-related landforms. Geophysical tools that have been discussed in detailin this paper are GPR, electrical resistivity, electromagnetic induction,and seismic methods, which are all propagating field methods. Theprevious sections allow for some discussion of the possibilities andlimitations of different geophysical methods for landform studies.
Ground-penetrating radar has become a popular method for studyof the shallow subsurface in a wide range of areas, and is especiallysuccessful in resistive sediments. Advantages of GPR are the relativeease of use and the limited processing that is required for basic datainterpretation. A potential drawback of GPR is the sometimes limitedsignal penetration, particularly in conductive sediments; a lowerfrequency can increase penetration but results in a lower resolution.Recent advances of GPR include the use of multi-offset systems toimprove signal-to-noise ratios, collect continuous common-shotgathers, or increase data collection efficiency. Another recent
development is the increased use of 3D data to image complexsubsurface environments. A case study was presented that used GPRto image internal structures of an eolian dune on a coastal spit in NewZealand. The GPR data clearly identified a paleosol below more than10 m of sediment at the dune base and found evidence for its subaerialweathering prior to the existence of the dune at that location. Internalsedimentary structures, including foresets and bounding surfaces thatwere imaged in great detail, were used to trace back the developmentof the dune.
Electrical resistivity methods have been part of the geophysicaltoolset for a long time. Recent advances, including the availability ofmulti-electrode systems and easy-access data processing softwarehave made electrical resistivity tomography a popular tool forsubsurface imaging studies. In the context of landforms, ER methodscan provide important information when substantial variation inelectrical conductivity exists in the subsurface related to, for example,deformation and transition from sediments to bedrock. A recentadvance is the development of novel approaches (equipment,software) to monitor dynamic processes through time-lapse mea-surements. Although not in all dynamic systems sufficient change inelectrical properties occurs in the time period of interest, numerouspotential applications exist for this approach. Another recent advanceis the use of capacitively-coupled resistivity systems that do notrequire electrodes to be planted in the ground, as in the morecommon galvanic source method. Although the method has a fewdrawbacks, including potentially poor reproducibility and a morelimited depth of investigation than traditional ER, it allows for muchfaster spatial coverage. Two case studies from field sites in Michigan
Fig. 12. (A) Map of Parengarenga Harbour and sandspit, Northland, New Zealand.(B) Aerial photo of the sandspit showing a row of foredune and several large solitarydunes. The material in interdune flats has higher moisture content than the dunes, andare, therefore, of darker color. (C) Topographical survey across the sandspit; see (B) forlocation. The studied dune is located at x=0 m, with maximum height ~20 m abovechart datum (CD).
69R.L. Van Dam / Geomorphology 137 (2012) 57–73
were presented. In a study of patterned ground, ER tomography wasused to characterize subsurface textural andwater content differencesbelow polygons and the adjacent swales. At a site with large-scaleglaciotectonic deformation, constant spread traversing was success-fully used to map the spatial extent and orientation of narrow clay-rich anticlines.
Whereas electromagnetic induction methods have been used for along time for environmental studies, examples from landform studiesare relatively sparse. Controlled-source EM methods are very wellsuited for fast spatial mapping of variation in subsurface electricalconductivity. Frequency and time-domain equipment can also be used,however, to obtain information on the vertical variation conductiveproperties. Vertical resolution and detail is typically less than withother geophysical methods. EM data collection is fast, but data qualitycan be hampered by the presence of power sources and nearby metal.Examples of the use of EM induction methods for landform-relatedresearch include the mapping of buried paleo-drainage, the charac-terization of sediment anisotropy, and the identification of subsurfacediscontinuities such as faults. In recent years, several novel uses ofplane wave EM have been developed for the study of landforms andlandform processes. To estimate variations in resistivity with depth,plane wave EM methods record signals from distant sources, such asmilitary VLF transmitters or AM radio antennas, at different frequencies.Although this method has drawbacks, plane wave EM data collection isrelatively cheap and equipment can be lightweight.
Seismic methods for landform characterization include seismicreflection and refraction techniques and the use of surface waves. Astrong benefit of seismic methods over other geophysical methods isthe penetration depth. As a ray-based method, similar to GPR, thereduction in resolution with depth is much smaller than compared toER and EM methods. Because on-land data collection of high-resolution seismic data is time consuming and costly, the majorityof landform studies using seismic reflection methods are found inoffshore settings. Nevertheless, work is ongoing to make high-resolution 2- and 3D seismic reflection more accessible. Seismicrefraction is ideal for the spatial (horizontal and vertical) mapping oflayer interfaces and has, for example, been used to study the slidingsurface below mass movements. Seismic surface waves havetraditionally been used as a tool to estimate subsurface engineeringproperties, which are related to the texture. Typically, seismic surfacewave data collection is simpler than seismic reflection, and examplesillustrate successful applications in landform-related studies. A recentdevelopment in seismics is the use of passive sensing approaches,which benefit from the limited equipment weight, facilitating fielddeployment. Near-surface applications are still sparse, but recentresearch indicates the applicability of the method for depth to-interface and subsurface anisotropy and heterogeneities studies.
Geophysical tools have proven to be of value over decades, forindependent studies of the subsurface and in conjunction withcomplementary approaches and techniques. Despite all technicalprogress, however, geophysical methodswill not be able to provide alldesired information in all circumstances. Therefore, the search fornew strategies that maximize the information from geophysical dataneeds to continue. One of these areas is use of multiple complemen-tary geophysical methods, which can benefit from the sensitivity todifferent subsurface parameters. In addition to separate interpretationof multiple datasets, increased research into coupled and jointinversion strategies has shown promising results that, if more widelyavailable, will be of benefit in the study of landforms.
Acknowledgements
Many colleagues and students from the VU University Amsterdam,the University of Auckland, and Michigan State University, helpedcollect and process data. Data for case study 1 were collected during aseminar led by Randall Schaetzl and David Lusch at MSU. Case study 2
Fig. 13. (A) Results and (B) interpretation for a 200 MHz GPR survey of the stoss-side of the studied dune. Time-to-depth conversion was performed using a velocity of 0.11 m/ns;vertical exaggeration is 2.1 times. See Fig. 12 for location.
Fig. 14. GPR survey results of the lee-side of the studied dune. The GPR data werecollected using a GSSI SIR 2000 with 35 MHz monostatic antenna. Time-to-depthconversion was performed using a velocity of 0.11 m/ns. See Fig. 12 for location.
70 R.L. Van Dam / Geomorphology 137 (2012) 57–73
was supported by theWarren and AnnelieseWood Foundation; RobertAylsworth was instrumental in data collection. Case study 3 wassupported by a fellowship from the Van Coeverden Adriani Foundation.The data in Fig. 4 were collected during NSF-funded research (EAR-0738955) and processed by Mine Dogan, who also commented on anearlier draft of the text. Ulrich Asprion and Allan James are acknowl-edged for their constructive reviews of the manuscript.
Aksu, A.E., Hiscott, R.N., Yasar, D., Isler, F.I., Marsh, S., 2002. Seismic stratigraphy of LateQuaternary deposits from the southwestern Black Sea shelf: evidence for non-catastrophic variations in sea-level during the last 10,000 yr. Marine Geology 190(1–2), 61–94.
Almeida-Filhoa, R., Rossettia, D.F., Mirandab, F.P., Ferreirac, F.J., Silvad, C., Beisl, C., 2009.Quaternary reactivation of a basement structure in the Barreirinhas Basin, BrazilianEquatorial Margin. Quaternary Research 72, 103–110.
Amelio, M., Martorelli, E., 2008. Seismo-stratigraphic characters of paleocontouritesalong the Calabro-Tyrrhenian margin (Southern Tyrrhenian Sea). Marine Geology252 (3–4), 141–149.
Annan, A.P., 2002. The history of ground penetrating radar. Subsurface SensingTechnologies and Applications 3, 303–320.
Arnaud, E., 2008. Deformation in the Neoproterozoic Smalfjord Formation, northernNorway: an indicator of glacial depositional conditions? Sedimentology 55 (2),335–356.
Atekwana, E.A., Slater, L.D., 2009. Biogeophysics: a new frontier in earth scienceresearch. Reviews of Geophysics 47, RG4004.
Auken, E., Pellerin, L., Christensen, N.B., Sorensen, K., 2006. A survey of current trends innear-surface electrical and electromagneticmethods. Geophysics 71 (5), G249–G260.
Aylsworth, R.L., 2008. A geophysical investigation of large-scale glaciotectonic deformation,Ludington Ridge, Michigan. M.Sc. Thesis, Michigan State University, USA.
Baines, D., Smith, D.G., Froese, D.G., Bauman, P., Nimeck, G., 2002. Electrical resistivityground imaging (ERGI): a new tool for mapping the lithology and geometry ofchannel-belts and valley-fills. Sedimentology 49 (2), 441–449.
Bakker,M.A., 2004. The internal structure of Pleistocenepushmoraines—amultidisciplinaryapproach with emphasis on ground-penetrating radar. Ph.D. Thesis, University ofLondon, UK.
Bakker, M.A., Van Der Meer, J.J., 2003. Structure of a Pleistocene push moraine revealedby GPR: the eastern Veluwe Ridge, The Netherlands. In: Bristow, C.S., Jol, H.M.(Eds.), Ground Penetrating Radar in Sediments. The Geological Society of London,London, UK, pp. 143–151.
Barnaba, C., Marello, L., Vuan, A., Palmieri, F., Romanelli, M., Priolo, E., Braitenberg, C.,2010. The buried shape of an alpine valley from gravity surveys, seismic andambient noise analysis. Geophysical Journal International 180, 715–733.
Baster, I., Girardclos, S., Pugin, A., Wildi, W., 2003. High-resolution seismic stratigraphyof an Holocene lacustrine delta in western Lake Geneva (Switzerland). EclogaeGeologicae Helvetiae 96 (Supplement 1), S11–S20.
Beamish, D., 2000. Quantitative 2D VLF data interpretation. Journal of AppliedGeophysics 45, 33–47.
Bennett, M.R., Huddart, D., Waller, R.I., Tomio, A., Midgley, N., Cassidy, N., Zukowskyj, P.,Cook, S.J., Gonzalez, S., Glasser, N.F., 2004. Sedimentary and tectonic architecture ofa large push moraine: a case study from Hagafellsjokull-Eystri, Iceland. Sedimen-tary Geology 172 (3–4), 269–292.
Beylich, A.A., Kolstrup, E., Thyrsted, T., Linde, N., Pedersen, L.B., Dynesius, L., 2004.Chemical denudation in arctic-alpine Latnjavagge (Swedish Lapland) in relation toregolith as assessed by radio magnetotelluric-geophysical profiles. Geomorphology57 (3–4), 303–319.
Bosch, J.H.A., Bakker, M.A.J., Gunnink, J.L., Paap, B.F., 2009. Airborne electromagneticmeasurements as basis for a 3D geological model of an Elsterian incision. Zeitschriftder Deutschen Gesellschaft für Geowissenschaften 160 (3), 249–258.
Boulton, G., 1999. The sedimentary and structural evolution of a recent push morainecomplex: Holmstrømbreen, Spitsbergen. Quaternary Science Reviews 18 (3),339–371.
Bourne, J.A., Hillis, R., Rutty, M., 2002. Fan, fill or covered pediment? Seismic investigationof alluvial cover thickness, Hayward ‘Pediment’, Flinders Ranges, South Australia.Zeitschrift für Geomorphologie 46 (2), 193–201.
Bradford, J.H., 2006. Applying reflection tomography in the postmigration domain tomultifold ground-penetrating radar data. Geophysics 71, K1–K8.
Bradford, J.H., 2008. Measuring water content heterogeneity using multifold GPR withreflection tomography. Vadose Zone Journal 7, 184–193.
Bridge, J.S., Collier, R., Alexander, J., 1998. Large-scale structure of Calamus Riverdeposits (Nebraska, USA) revealed using ground-penetrating radar. Sedimentology45, 977–986.
Bristow, C.S., Pucillo, K., 2006. Quantifying rates of coastal progradation from sedimentvolume using GPR and OSL: the Holocene fill of Guichen Bay, south-east SouthAustralia. Sedimentology 53 (4), 769–788.
Bristow, C.S., Jol, H.M., Augustinus, P., Wallis, I., 2010. Slipfaceless ‘whaleback’ dunes in apolar desert, Victoria Valley, Antarctica: Insights from ground penetrating radar.Geomorphology 114 (3), 361–372.
Burke, M.J., Woodward, J., Russell, A.J., Fleisher, P.J., Bailey, P.K., 2008. Controls on thesedimentary architecture of a single event englacial esker: Skeiðarárjökull, Iceland.Quaternary Science Reviews 27 (19–20), 1829–1847.
Burrell, J., Gurrola, H., Mickus, K., 2008. Frequency domain electromagnetic and groundpenetrating radar investigation of ephemeral streams: case study near the SouthernHigh Plains, Texas. Environmental Geology 55 (6), 1169–1179.
BURVAL Working Group, 2009. Buried Quaternary valleys — a geophysical approach.Zeitschrift der Deutschen Gesellschaft für Geowissenschaften 160 (3), 237–247.
Butler, D.K. (Ed.), 2005. Near-Surface Geophysics. Society of Exploration Geophysicists,Tulsa, USA, p. 732.
Buynevich, I.V., Bitinas, A., Pupienis, D., 2007. Lithological anomalies in a relict coastaldune: geophysical and paleoenvironmental markers. Geophysical Research Letters34 (9), L09707.
Carvalho Dill, A., Turberg, P., Müller, I., Parriauz, A., 2009. The combined use of radio-frequency electromagnetics and radiomagnetotellurics methods in non-ideal fieldconditions for delineating hydrogeological boundaries and for environmentalproblems. Environmental Geology 56, 1071–1091.
Casas-Sainza, A.M., de Vicente, G., 2009. On the tectonic origin of Iberian topography.Tectonophysics 474 (1–2), 214–235.
Cassidy, N.J., 2009. Ground Penetrating Radar Data Processing, Modelling and Analysis.In: Jol, H.M. (Ed.), Ground Penetrating Radar Theory and Applications. Elsevier.Amsterdam, The Netherlands, pp. 141–176.
Christensen, N.B., Sorensen, K., 2001. Pulled array continuous electrical sounding with anadditional inductive source: an experimental design study. Geophysical Prospecting49 (2), 241–254.
Christensen, N.B., Fitzpatrick, A., Munday, T., 2010. Fast approximate 1D inversion offrequency domain electromagnetic data. Near Surface Geophysics 8 (1), 1–15.
Christiansen, A.V., Auken, E., Foged,N., Sørensen, K.I., 2007.Mutually and laterally constrainedinversion of CVES and TEM data: a case study. Near Surface Geophysics 5, 115–124.
Cockx, L., Ghysels, G., Van Meirvenne, M., 2006. Prospecting frost-wedge pseudomorphsand their polygonal network using the electromagnetic induction sensor EM38DD.Permafrost and Periglacial Processes 168, 163–168.
Comas, X., Slater, L., Reeve, A., 2004. Geophysical evidence for peat basin morphologyand stratigraphic controls on vegetation observed in a northern peatland. Journal ofHydrology 295 (1–4), 173–184.
Dahlin, T., Zhou, B., 2004. A numerical comparison of 2D resistivity imaging with 10electrode arrays. Geophysical Prospecting 52 (5), 379–398.
Dalan, R.A., Goodman, D., 2007. Imaging buried landforms using down-hole susceptibilitydata and three-dimensional GPR visualization software. Archaeological Prospection14 (4), 273–280.
De Pascale, G.P., Pollard, W.H., Williams, K.K., 2008. Geophysical mapping of ground iceusing a combination of capacitive coupled resistivity and ground-penetratingradar, Northwest Territories, Canada. Journal of Geophysical Research 113, F02S90.
Dogan, M., Van Dam, R.L., Butler, J.J., Bohling, G.C., Hyndman, D.W., In review.Hydrostratigraphic analysis of the MADE site: Integration of full-resolution GPRand direct-push hydraulic conductivity data. Geophysical Research Letters.
Doolittle, J., Nelson, F., 2009. Characterising relict cryogenicmacrostructures inmid-latitudeareas of the USA with three-dimensional ground-penetrating radar. Permafrost andPeriglacial Processes 20, 257–268.
Evans, R.L., Law, L.K., St. Louis, B., Cheesman, S., 2000. Buried paleo-channels on the NewJersey continental margin: channel porosity structures from electromagneticsurveying. Marine Geology 170 (3–4), 381–394.
Fisher, T.G., Taylor, L.D., Jol, H.M., 2003. Boulder-gravel hummocks and wavy basal tillcontacts: products of subglacial meltwater flow beneath the Saginaw Lobe, south-central Michigan, USA. Boreas 32, 328–336.
Fortier, D., Allard, M., 2004. Late Holocene syngenetic ice wedge polygons development,Bylot Island, Canadian Arctic Archipelago. Canadian Journal of Earth Sciences 41 (8),997–1012.
Gabriel, G., Kirsch, R., Siemon, B., Wiederhold, H., 2003. Geophysical investigation ofburied Pleistocene subglacial valleys in Northern Germany. Journal of AppliedGeophysics 53 (4), 159–180.
Gallardo, L.A., Meju, M.A., 2003. Characterization of heterogeneous near-surfacematerials by joint 2-D inversion of DC resistivity and seismic data. GeophysicalResearch Letters 30 (13), 1658–1661.
Gerhards, H., Wollschläger, U., Yu, Q., Schiwek, P., Pan, X., Roth, K., 2008. Continuousand simultaneous measurement of reflector depth and average soil–water contentwith multichannel ground-penetrating radar. Geophysics 73 (4), J15–J23.
Girardi, J.D., Davis, D.M., 2010. Parabolic dune reactivation and migration at Napeague,NY, USA: insights from aerial and GPR imagery. Geomorphology 114 (4), 530–541.
Godfrey, M.J., 2008. 2D and 3D Geophysical Imaging of Polygonal Patterned Ground inthe McMurdo Dry Valleys, Antarctica. M.Sc. Thesis, University of Canterbury.
Gouédard, P., Stehly, L., Brenguier, F., Campillo, M., Colin De Verdière, Y., Larose, E.,Margerin, L., Roux, P., Sánchez-Sesma, F.J., Shapiro, N.M., Weaver, R.L., 2008. Cross-Correlation of random fields: mathematical approach and applications. GeophysicalProspecting 56 (3), 375–393.
Grasmueck, M., Viggiano, D.A., 2007. Integration of ground-penetrating radar and laserposition sensors for real-time 3-D data fusion. IEEE Transactions on Geoscience andRemote Sensing 45 (1), 130–137.
Grasmueck, M., Weger, R., Horstmeyer, H., 2005. Full-resolution 3-D GPR imaging.Geophysics 70 (1), K12–K19.
Greenhouse, J.P., Morgan, A.V., 1977. Resistivity mapping of fossil permafrost patternsin southwestern Ontario. Canadian Journal of Earth Sciences 14, 496–500.
Guérin, R., Baltassat, J., Boucher, M., Chalikakis, K., Galibert, P., Girard, J., Plagnes, V.,Valois, R., 2009. Geophysical characterisation of karstic networks — applicationto the Ouysse system (Poumeyssen, France). Comptes Rendus Geosciences 341(10–11), 810–817.
Göktürkler, G., Balkaya, C., Erhan, Z., 2008. Geophysical investigation of a landslide: TheAltındağ landslide site, İzmir (western Turkey). Journal of Applied Geophysics 65 (2),84–96.
Gürer, A., Bayrak, M., Gürer, Ö.F., 2009. A VLF survey using current gatheringphenomena for tracing buried faults of Fethiye–Burdur Fault Zone, Turkey. Journalof Applied Geophysics 68, 437–447.
Hauck, C., Kneisel, C., 2006. Application of capacitively-coupled and DC electricalresistivity imaging for mountain permafrost studies. Permafrost and PeriglacialProcesses 17 (2), 169–177.
Heincke, B., Green, A.G., Van Der Kruk, J., Horstmeyer, H., 2005. Acquisition andprocessing strategies for 3D georadar surveying a region characterized by ruggedtopography. Geophysics 70 (6), K53–K61.
Hendrickx, J.M.H., Borchers, B., Corwin, D.L., Lesch, S.M., Hilgendorf, A.C., Schlue, J.,2003. Inversion of soil conductivity profiles from electromagnetic inductionmeasurements: theory and experimental verification. Soil Science Society ofAmerica Journal 66 (3), 673–685.
Hickin, A.S., Kerr, B., Barchyn, T.E., Paulen, R.C., 2009. Using ground-penetrating radarand capacitively coupled resistivity to investigate 3-D fluvial architecture andgrain-size distribution of a gravel floodplain in northeast British Columbia, Canada.Journal of Sedimentary Research 79 (6), 457–477.
Hilbich, C., Hauck, C., Hoelzle, M., Scherler, M., Schudel, L., Voelksch, I., Muehll, D.V.,Maeusbacher, R., 2008. Monitoring mountain permafrost evolution using electricalresistivity tomography: a 7-year study of seasonal, annual, and long-termvariations at Schilthorn, Swiss Alps. Journal of Geophysical Research 113, F01S90.
Hinkel, K.M., Doolittle, J.A., Bockheim, J.G., Nelson, F.E., Paetzold, R., Kimble, J.M., Travis,R., 2001. Detection of subsurface permafrost features with ground-penetratingradar, Barrow, Alaska. Permafrost and Periglacial Processes 12 (2), 179–190.
Hunt, A.G., Wu, J.Q., 2004. Climatic influences on Holocene variations in soil erosionrates on a small hill in the Mojave Desert. Geomorphology 58 (1–4), 263–289.
Jayawickreme, D.H., Van Dam, R.L., Hyndman, D.W., 2010. Hydrological consequencesof land-cover change: Quantifying the influence of plants on soil moisture withtime-lapse electrical resistivity. Geophysics 75 (4), WA43–WA50.
Johnston, J.W., Thompson, T.A., Baedke, S.J., 2007. Systematic pattern of beach-ridgedevelopment and preservation: conceptual model and evidence from groundpenetrating radar. In: Baker, G.S., Jol, H.M. (Eds.), Stratigraphic Analyses Using GPR.Geological Society of America Special Paper 432, pp. 47–58.
Jol, H.M., Smith, D.G., 1991. Ground penetrating radar of northern lacustrine deltas.Canadian Journal of Earth Sciences 28 (12), 1939–1947.
Jongmans, D., Garambois, S., 2007. Geophysical investigation of landslides: a review.Bulletin de la Societe Geologique de France 178 (2), 101–112.
Jongmans,D., Bièvre, G., Renalier, F., Schwartz, S., Beaurez,N.,Orengo, Y., 2009.Geophysicalinvestigation of a large landslide in glaciolacustrine clays in the Trièves area (FrenchAlps). Engineering Geology 109 (1–2), 45–56.
Jorgensen, F., Møller, R.R., Sandersen, P.B.E., Nebel, L., 2010. 3-D geological modelling ofthe Egebjerg area, Denmark, based on hydrogeophysical data. Geological Survey ofDenmark and Greenland Bulletin 20, 27–30.
Kneisel, C., Hauck, C., Fortier, R., Moorman, B., 2008. Advances in geophysicalmethods for permafrost investigations. Permafrost and Periglacial Processes 19,157–178.
Knight, R.J., Endres, A.L., 2005. An Introduction to Rock Physics Principles for Near-Surface Geophysics. In: Butler, D.K. (Ed.), Near-Surface Geophysics. Society ofExploration Geophysicists, Tulsa, USA, pp. 31–70.
Krautblatter, M., Hauck, C., 2007. Electrical resistivity tomography monitoring ofpermafrost in solid rock walls. Journal of Geophysical Research 112, F02S20.
Krautblatter, M., Verleysdonk, S., Flores-Orozco, A., Kemna, A., 2010. Temperature-calibrated imaging of seasonal changes in permafrost rock walls by quantitativeelectrical resistivity tomography (Zugspitze, German/Austrian Alps). Journal ofGeophysical Research 115, F02003.
Larsen, B., Andersen, L.T., 2005. Late Quaternary stratigraphy and morphogenesis in theDanish eastern North Sea and its relation to onshore geology. Netherlands Journalof Geosciences 84 (2), 113–128.
Lebourg, T., Hernandez, M., Zerathe, S., El Bedoui, S., Jomard, H., Fresia, B., 2010.Landslides triggered factors analysed by time lapse electrical survey andmultidimensional statistical approach. Engineering Geology 114 (3–4), 238–250.
Lee, G.H., Kim, D.C., Park, M.K., Park, S.C., Kim, H.J., Jou, H.T., Khim, B.K., 2010. Internalreflection pattern of Korea Strait shelf mud (Nakdong River subaqueous delta) offsoutheast Korea and implications for Holocene relative base-level change. IslandArc 19, 71–85.
Leopold, M., Dethier, D., Völkel, J., Raab, T., Corson Rikert, T., Caine, N., 2008. Usinggeophysical methods to study the shallow subsurface of a sensitive alpineenvironment, Niwot Ridge, Colorado Front Range, U.S.A. Arctic, Antarctic, andAlpine Research 40 (3), 519–530.
Lin, M.-J., Jeng, Y., 2010. Application of the VLF-EMmethod with EEMD to the study of amud volcano in southern Taiwan. Geomorphology 119, 97–110.
Liu, G.S., Butler, J.J., Bohling, G.C., Reboulet, E., Knobbe, S., Hyndman, D.W., 2009. A newmethod for high-resolution characterization of hydraulic conductivity. WaterResources Research 45, W08202.
72 R.L. Van Dam / Geomorphology 137 (2012) 57–73
Loke, M.H., Barker, R.D., 1996. Rapid least-squares inversion of apparent resistivitypseudosections by a quasi-Newton method. Geophysical Prospecting 44 (1),131–152.
Long, M., Donohue, S., 2007. In situ shear wave velocity from multichannel analysis ofsurface waves (MASW) tests at eight Norwegian research sites. CanadianGeotechnical Journal 44 (5), 533–544.
Lusch, D. P., 1982. The origin andmorphogenetic significance of patterned ground in theSaginaw Lowland of Michigan. Ph.D. Thesis, Michigan State University, USA.
Lusch, D.P., Stanley, K.E., Schaetzl, R.J., Kendall, A.D., Van Dam, R.L., Nielsen, A., Blumer,B.E., Hobbs, T.C., Archer, J.K., Holmstadt, J.L.F., May, C.L., 2009. Characterization andmapping of patterned ground in the Saginaw Lowlands, Michigan: Possibleevidence for Late–Wisconsin permafrost. Annals of the Association of AmericanGeographers 99 (3), 1–22.
Lønne, I., Lauritsen, T., 1996. The architecture of a modern push-moraine at Svalbard asinferred from ground-penetrating radar measurements. Arctic and Alpine Research28 (4), 488–495.
Maillet, G.M., Rizzo, E., Revil, A., 2005. High resolution electrical resistivity tomography(ERT) in a transition zone environment: Application for detailed internalarchitecture and infilling processes study of a Rhone River paleo-channel. MarineGeophysical Researches 26 (2–4), 317–328.
Méric, O., Garambois, S., Malet, J.P., Cadet, H., Guéguen, P., Jongmans, D., 2007. Seismicnoise-based methods for soft-rock landslide characterization. Bulletin de la SocieteGeologique de France 178 (2), 137–148.
Miyazawa, M., Snieder, R., Venkataraman, A., 2008. Application of seismic interferom-etry to extract P- and S-wave propagation and observation of shear-wave splittingfrom noise data at Cold Lake, Alberta, Canada. Geophysics 73 (4), D35–D40.
Moore, L.J., Jol, H.M., Kruse, S., Vanderburgh, S., Kaminsky, G.M., 2004. Annual layersrevealed by GPR in the subsurface of a prograding coastal barrier, southwestWashington, USA. Journal of Sedimentary Research 74 (5), 690–696.
Munroe, J.S., Doolittle, J.A., Kanevskiy, M.Z., Hinkel, K.M., Nelson, F.E., Jones, B.M., Shur,Y., Kimble, J.M., 2007. Application of ground-penetrating radar imagery for three-dimensional visualisation of near-surface structures in ice-rich permafrost, Barrow,Alaska. Permafrost and Periglacial Processes 18, 309–321.
Murton, J.B., French, H.M., 1993. Thaw modification of frost-fissure wedges, RichardsIsland, Pleistocene Mackenzie Delta, western Arctic Canada. Journal of QuaternaryScience 8 (3), 185–196.
Nasseri-Moghaddam, A., Cascante, G., Phillips, C., Hutchinson, D.J., 2007. Effects ofunderground cavities on Rayleigh waves — field and numerical experiments. SoilDynamics and Earthquake Engineering 27 (4), 300–313.
National Research Council, 2000. Seeing Into the Earth: Noninvasive Characterization ofthe Shallow Subsurface for Environmental and Engineering Applications. NationalAcademy Press, p. 148.
Naudet, V., Lazzari, M., Perrone, A., Loperte, A., Piscitelli, S., Lapenna, V., 2008. Integratedgeophysical and geomorphological approach to investigate the snowmelt-triggered landslide of Bosco Piccolo village (Basilicata, southern Italy). EngineeringGeology 98 (3–4), 156–167.
Neal, A., 2004. Ground-penetrating radar and its use in sedimentology: principles,problems and progress. Earth-Science Reviews 66 (3–4), 261–330.
Nielsen, L., Møller, I., Nielsen, L.H., Johannessen, P.N., Pejrup, M., Andersen, T., Korshøj, J.S.,2009. Integrating ground-penetrating radar and borehole data from a Wadden Seabarrier island. Journal of Applied Geophysics 68 (1), 47–59.
Otto, J.C., Sass, O., 2006. Comparing geophysical methods for talus slope investigationsin the Turtmann valley (Swiss Alps). Geomorphology 76, 257–272.
Paillet, F.L., Ellefsen, K.J., 2005. Downhole Applications of Geophysics. In: Butler, D.K.(Ed.), Near-Surface Geophysics. Society of Exploration Geophysicists, Tulsa, USA,pp. 439–471.
Pánek, T., Margielewski, W., Tábořík, P., Urban, J., Hradecký, J., Szura, C., In press.Gravitationally-induced caves and other discontinuities detected by 2D electricalresistivity tomography:Case studies fromthePolishFlyschCarpathians.Geomorphology.
Panissod, C., Dabas, M., Jolivet, A., Tabbagh, A., 1997. A novel mobile multipole system(MUCEP) for shallow (0–3 m) geoelectrical investigation: the ‘Vol-de-canards’array. Geophysical Prospecting 45 (6), 983–1002.
Park, C.B., Miller, R.D., Xia, J.H., 1999. Multichannel analysis of surface waves. Geophysics 64(3), 800–808.
Parkes, A.A., Waller, R.I., Knight, P.G., Stimpson, I.G., Schofield, D.I., Mason, K.T., 2009. Amorphological, sedimentological and geophysical investigation of the WooreMoraine, Shropshire, England. Proceedings of the Geologists Association 120,233–244.
Pelpola, C.P., Hickin, E.J., 2004. Long-term bed load transport rate based on aerial-photoand ground penetrating radar surveys of fan-delta growth, Coast Mountains, BritishColumbia. Geomorphology 57 (3–4), 169–181.
Pelton, J.R., 2005. Near-Surface Seismology: Wave Propagation. In: Butler, D.K.(Ed.), Near-Surface Geophysics. Society of Exploration Geophysicists, Tulsa,USA, pp. 219–263.
Picozzi, M., Parolai, S., Bindi, D., Strollo, A., 2008. Characterization of shallow geology byhigh frequency seismic noise tomography. Geophysical Journal International 176,164–174.
Piper, D.J.W., Perissoratis, C., 2003. Quaternary neotectonics of the South Aegean arc.Marine Geology 198 (3–4), 259–288.
Praeg, D., 2003. Seismic imaging of mid-Pleistocene tunnel-valleys in the North SeaBasin-high resolution from low frequencies. Journal of Applied Geophysics 53 (4),273–298.
Revil, A., Glover, P.W., 1998. Nature of surface electrical conductivity in natural sands,sandstones, and clays. Geophysical Research Letters 25 (5), 691–694.
Rey, E., Jongmans, D., 2007. A 2D numerical study of the effect of particle shape andorientation on resistivity in shallow formations. Geophysics 72 (1), F9–F17.
Rosa, E., Larocque, M., Pellerin, S., Gagné, S., Fournier, B., 2009. Determining the numberof manual measurements required to improve peat thickness estimations byground penetrating radar. Earth Surface Processes and Landforms 34 (3), 377–383.
Roth, M., Mackey, J., Mackey, C., Nyquist, J., 2002. A case study of the reliability ofmultielectrode earth resistivity testing for geotechnical investigations in karstterrains. Engineering Geology 65 (2–3), 225–232.
Sadura, S., Endres, A.L., Martini, I.P., Wolf, K., 2006. Morphology and GPR stratigraphy ofa frontal part of an end moraine of the Laurentide Ice Sheet: Paris Moraine nearGuelph, ON, Canada. Geomorphology 75 (1–2), 212–225.
Sambrook Smith, G.H., Ashworth, P.J., Best, J.L., Lunt, I.A., Orfeo, O., Parsons, D.R., 2009.The sedimentology and alluvial architecture of a large braid bar, Río Paraná,Argentina. Journal of Sedimentary Research 79 (8), 629–642.
Sass, O., Bell, R., Glade, T., 2008. Comparison of GPR, 2D-resistivity and traditionaltechniques for the subsurface exploration of the Öschingen landslide, Swabian Alb(Germany). Geomorphology 93 (1–2), 89–103.
Schenk, C.J., Gautier, D.L., Olhoeft, G.R., Lucius, J.E., 1993. Internal structure of an eolian duneusing ground-penetrating radar. Special Publications International Association ofSedimentology 16, 61–69.
Schmutz,M., Albouy, Y., Guérin, R.,Maquaire, O., Vassal, J., Schott, J.-J., Descloîtres,M., 2000.Joint electrical and time domain electromagnetism (TDEM) data inversion applied tothe Super Sauze earthflow (France). Surveys in Geophysics 21 (4), 371–390.
Schmutz, M., Guérin, R., Andrieux, P., Maquaire, O., 2009. Determination of the 3Dstructure of an earthflow by geophysical methods: the case of Super Sauze, in theFrench southern Alps. Journal of Applied Geophysics 68 (4), 500–507.
Schrott, L., Sass, O., 2008. Application of field geophysics in geomorphology: advancesand limitations exemplified by case studies. Geomorphology 93 (1–2), 55–73.
Seher, T., Tezkan, B., 2007. Radiomagnetotelluric and direct current resistivitymeasurements for the characterization of conducting soils. Journal of AppliedGeophysics 63, 35–45.
Sens-Schoenfelder, C., Wegler, U., 2006. Passive image interferometry and seasonalvariations of seismic velocities at Merapi Volcano, Indonesia. Geophysical ResearchLetters 33 (21), L21302.
Shapiro, N.M., Campillo, M., Stehly, L., Ritzwoller, M.H., 2005. High-resolution surface-wave tomography from ambient seismic noise. Science 307 (5715), 1615–1618.
Smith, M., Rose, J., Booth, S., 2006. Geomorphological mapping of glacial landforms fromremotely sensed data: an evaluation of the principal data sources and anassessment of their quality. Geomorphology 76 (1–2), 148–165.
Snieder, R., Hubbard, S., Haney, M., Bawden, G., Hatchell, P., Revil, A., DOE GeophysicalMonitoringWorking Group, 2007. Advanced noninvasive geophysical monitoringtechniques. Annual Review of Earth and Planetary Sciences 35, 653–683.
Socco, L.V., Strobbia, C., 2004. Surface-wave method for near-surface characterization: atutorial. Near Surface Geophysics 2 (4), 165–185.
Socco, L.V., Jongmans, D., Boiero, D., Stocco, S., Maraschini, M., Tokeshi, K., Hantz, D.,2010. Geophysical investigation of the Sandalp rock avalanche deposits. Journal ofApplied Geophysics 70 (4), 277–291.
Steeples, D.W., 2000. A review of shallow seismic methods. Annali di Geofisica 43 (6),1021–1044.
Steuer, A., Siemon, B., Auken, E., 2009. A comparison of helicopter-borne electro-magnetics in frequency- and time-domain at the Cuxhaven valley in NorthernGermany. Journal of Applied Geophysics 67 (3), 194–205.
Streich, R., Van Der Kruk, J., Green, A.G., 2006. Three-dimensional multicomponentgeoradar imaging of sedimentary structures. Near Surface Geophysics 4, 39–48.
Sutinen, R., Middleton, M., Liwata, P., Piekkari, M., Hyvönen, E., 2009. Sedimentanisotropy coincides with moraine ridge trend in south-central Finnish Lapland.Boreas 38 (3), 638–646.
Szalai, S., Novak, A., Szarka, L., 2009.Depthof investigation andvertical resolutionof surfacegeoelectric arrays. Journal of Environmental & Engineering Geophysics 14, 15–23.
Tezkan, B., 1999. A review of environmental applications of quasi-stationaryelectromagnetic techniques. Surveys in Geophysics 20 (3–4), 279–308.
Thierry, P., Debeblia, N., Bitri, A., 2004. Geophysical and geological characterisation ofkarst hazards in urban environments: application to Orléans (France). Bulletin ofEngineering Geology and the Environment 64 (2), 139–150.
Turesson, A., 2007. Comparative analysis of the multi-offset ground-penetrating radarand shear-wave reflection methods. Journal of Environmental and EngineeringGeophysics 12 (2), 163–171.
Vallée, M.A., Smith, R.S., 2009. Application of Occam's inversion to airborne time-domain electromagnetics. The Leading Edge 28 (3), 284–287.
Van Dam, R.L., 2002. Internal structure and development of an aeolian river dune in TheNetherlands, using 3-D interpretation of ground-penetrating radar data. NetherlandsJournal of Geosciences 81 (1), 27–37.
Van Dam, R.L., Schlager, W., 2000. Identifying causes of ground-penetrating radarreflections using time-domain reflectometry and sedimentological analyses.Sedimentology 47 (2), 435–449.
Van Dam, R.L., Nichol, S.L., Augustinus, P.C., Parnell, K.E., Hosking, P.L., McLean, R.F.,2003a. GPR stratigraphy of a large active dune on Parengarenga Sandspit, NewZealand. The Leading Edge 22 (9), 865–870.
Van Dam, R.L., Van Den Berg, E.H., Schaap, M.G., Broekema, L.H., Schlager, W., 2003b.Radar Reflections from Sedimentary Structures in the Vadose Zone. In: Bristow, C.S.,Jol, H.M. (Eds.), Ground Penetrating Radar in Sediments. The Geological Society ofLondon, London, UK, pp. 257–273.
Van Heteren, S., Fitzgerald, D.M., Mckinlay, P.A., Buynevich, I.V., 1998. Radar facies ofparaglacial barrier systems: coastal New England, USA. Sedimentology 45 (1), 181–200.
73R.L. Van Dam / Geomorphology 137 (2012) 57–73
Vandenberghe, J., Van Overmeeren, R.A., 1999. Ground penetrating radar images ofselected fluvial deposits in the Netherlands. Sedimentary Geology 128, 245–270.
Vignoli, G., Cassiani, G., 2010. Identification of lateral discontinuities via multi-offsetphase analysis of surface wave data. Geophysical Prospecting 58, 389–413.
Watabe, Y., Sassa, S., 2008. Application of MASW technology to identification of tidal flatstratigraphyand its geoenvironmental interpretation.MarineGeology252 (3–4), 79–88.
Wilford, J., 2009. Using airborne geophysics to define the 3D distribution and landscapeevolution of Quaternary valley-fill deposits around the Jamestown area, SouthAustralia. Australian Journal of Earth Sciences 56 (Suppl. 1), 67–88.
Williams, G.D., Brabham, P.J., Eaton, G.P., 2001. Late Devensian glaciotectonicdeformation at St Bees, Cumbria: a critical wedge model. Journal of the GeologicalSociety 158, 125–135.
Winsemann, J., Hornung, J.J., Meinsen, J., Asprion, U., Polom, U., Brandes, C., Bußmann,M., Weber, C., 2009. Anatomy of a subaqueous ice-contact fan and delta complex,Middle Pleistocene, North-west Germany. Sedimentology 56 (4), 1041–1076.
Wisén, R., Christiansen, A.V., 2005. Laterally and mutually constrained inversion ofsurface wave seismic data and resistivity data. Journal of Environmental andEngineering Geophysics 10 (3), 251–262.
Wooldridge, C.L., Hickin, E.J., 2005. Radar architecture and evolution of channel bars inwandering bravel-bed rivers: Fraser and Squamish rivers, British Columbia,Canada. Journal of Sedimentary Research 75 (5), 844–860.
Worrall, L., Munday, T.J., Green, A.A., 1999. Airborne electromagnetics— providing newperspectives on geomorphic process and landscape development in regolith-dominated terrains. Physics and Chemistry of the Earth Part A—Solid Earth andGeodesy 24 (10), 855–860.
Wu, D., Bruhn, R.L., 1994. Geometry and kinematics of active normal faults, SouthOquirrh Mountains, Utah: implication for fault growth. Journal of StructuralGeology 16 (8), 1061–1075.
Zhou, W., Beck, B., Adams, A., 2002. Effective electrode array in mapping karst hazardsin electrical resistivity tomography. Environmental Geology 42 (8), 922–928.
Ziekur, R., Grelle, T., 2009. Applications of capacitive resistivity measurements with theOhmMapper. Zeitschrift der Deutschen Gesellschaft für Geowissenschaften 160(4), 391–402.
Zonge, K., Wynn, J., Urquhart, S., 2005. Resistivity, Induced Polarization and ComplexResistivity. In: Butler, D.K. (Ed.), Near-Surface Geophysics. Society of ExplorationGeophysicists, Tulsa, USA, pp. 265–300.