15
Landsat Goings-On at the National Agriculture Statistics Service David M. Johnson [email protected] Landsat Science Team Meeting Corvallis, Oregon July 23, 2014

Landsat Goings-On at the
National Agriculture Statistics Service
David M. Johnson [email protected]
Landsat Science Team Meeting
Corvallis, Oregon July 23, 2014

Cropland Data Layer (CDL) Crop specific land cover classification for the USA
2
Complete for 2008-2013
Can expect 2014 as well

Research
Education
Agribusiness Land Cover Modeling
Mapping
Land Use
Crop Rotation
Pesticides
Water Use Soil and Water
Watersheds
Carbon
Crop Protection Disaster Assessment
Epidemiology
Crop Production
Yield
Fertilizer
Transportation
Ethanol
Irrigation Climate
Fertilizer Usage
Biofuel
Erosion
Data Mining
Environmental Risk
Planning
Commodity
CRP
Forest
Change Detection
Crop Intensity
Ecosystem
Land Management
Ecology
Pest Control
Soil Utilization
Acreage Estimates
Biodiesel
Water Quality
Urban Growth
Wildlife Habitat
Condition Assessment
NASS Cropland Data Layer known applications

L8 & DMC collects May 5, 2014

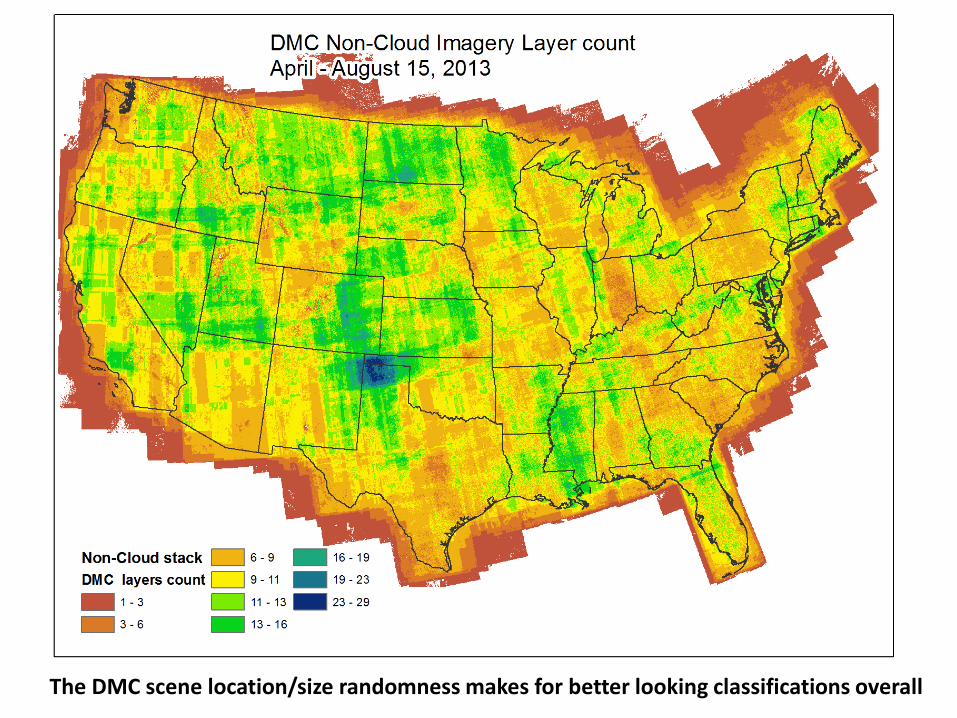
The DMC scene location/size randomness makes for better looking classifications overall
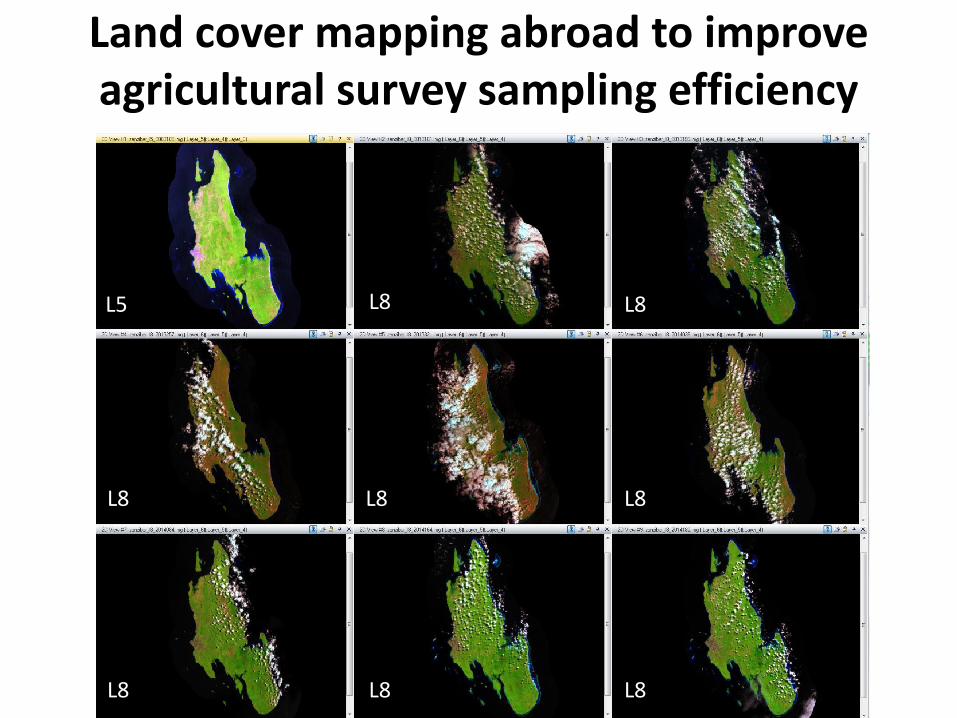
Land cover mapping abroad to improve agricultural survey sampling efficiency
L5 L8 L8
L8 L8 L8
L8 L8 L8
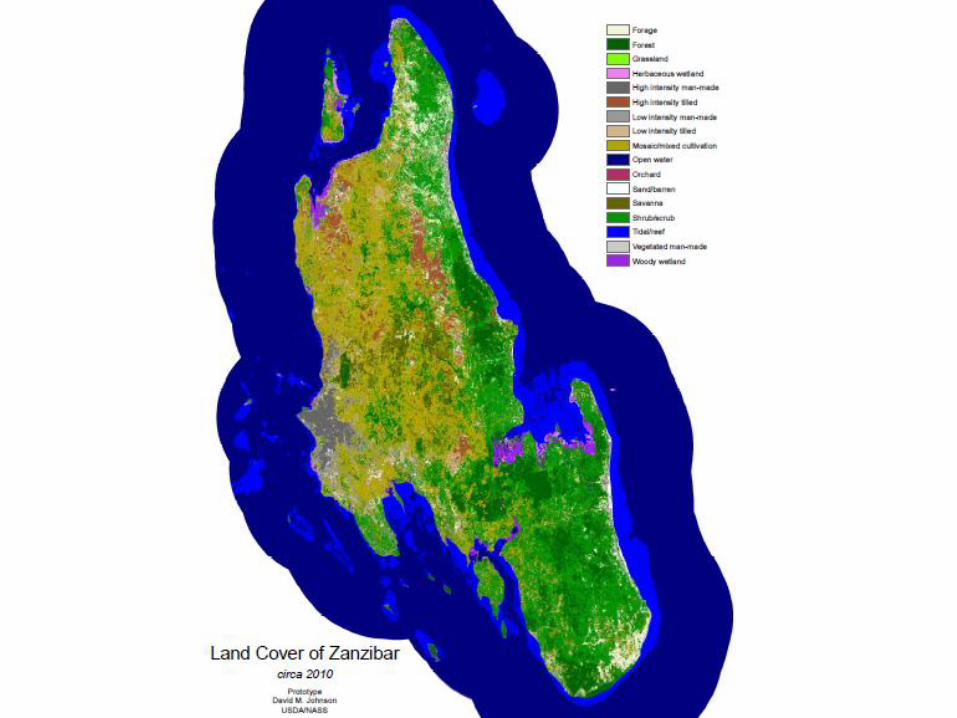

Landsat 8 could finally make agricultural related land cover work in the developing countries a pragmatic option

0.2
0.3
0.4
0.5
0.6
0.7
0.8
0.9
No
rmal
ized
Dif
fere
nce
Veg
etat
ion
In
dex
(N
DV
I)
Date
Typical MODIS Observed Phenologies
Barley
Canola
Corn
Cotton
Potatoes
Rice
Sorghum
Soybeans
Sugarbeets
Wheat
Terra
Aqua
Barley A
Corn A
Canola A
Cotton A
Potatoes A
Rice A
Sorghum A
Soybeans A
Sugarbeets A
Wheat A
Satellite
Crop
0
5
10
15
20
25
30
35
40
45
Day
tim
e La
nd
Su
rfac
e T
emp
erat
ure
(°C
)
Date
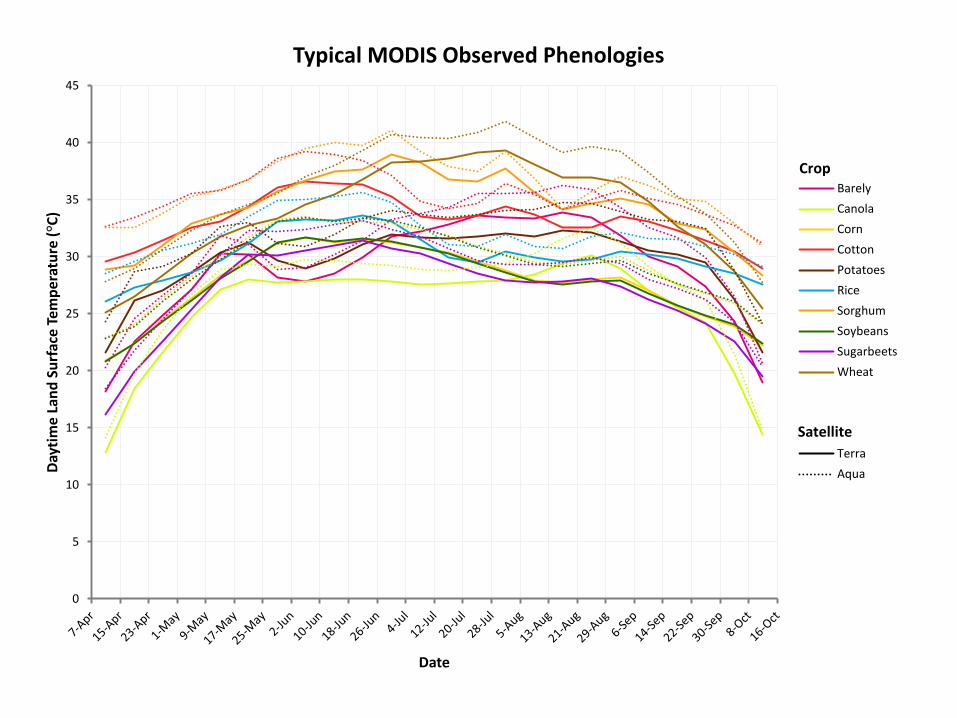
Typical MODIS Observed Phenologies
Barely
Canola
Corn
Cotton
Potatoes
Rice
Sorghum
Soybeans
Sugarbeets
Wheat
Terra
Aqua
Barley A
Canola A
Corn A
Cotton A
Potatoes A
Rice A
Sorghum A
Soybeans A
Sugarbeets A
Wheat A
Satellite
Crop

The relationships (mid summer) to crop yields

-0.9
-0.8
-0.7
-0.6
-0.5
-0.4
-0.3
-0.2
-0.1
0.0
0.1
0.2
0.3
0.4
0.5
0.6
0.7
0.8
0.9C
orr
elat
ion
Co
effi
cien
t (r
)
Date
NDVI vs Yield Dependence
Barley
Canola
Corn
Cotton
Potatoes
Rice
Sorghum
Soybeans
Sugarbeets
Wheat
Terra
Aqua
Barley A
Canola A
Corn A
Cotton A
Potatoes A
Rice A
Sorghum A
Soybeans A
Wheat A
Sugarbeets A
Satellite
Crop
Fairly strong positive relationship at some point during the growing season for most crops
-0.9
-0.8
-0.7
-0.6
-0.5
-0.4
-0.3
-0.2
-0.1
0.0
0.1
0.2
0.3
0.4
0.5
0.6
0.7
0.8
0.9
Co
rrel
atio
n C
oef
fici
ent
(r)
Date
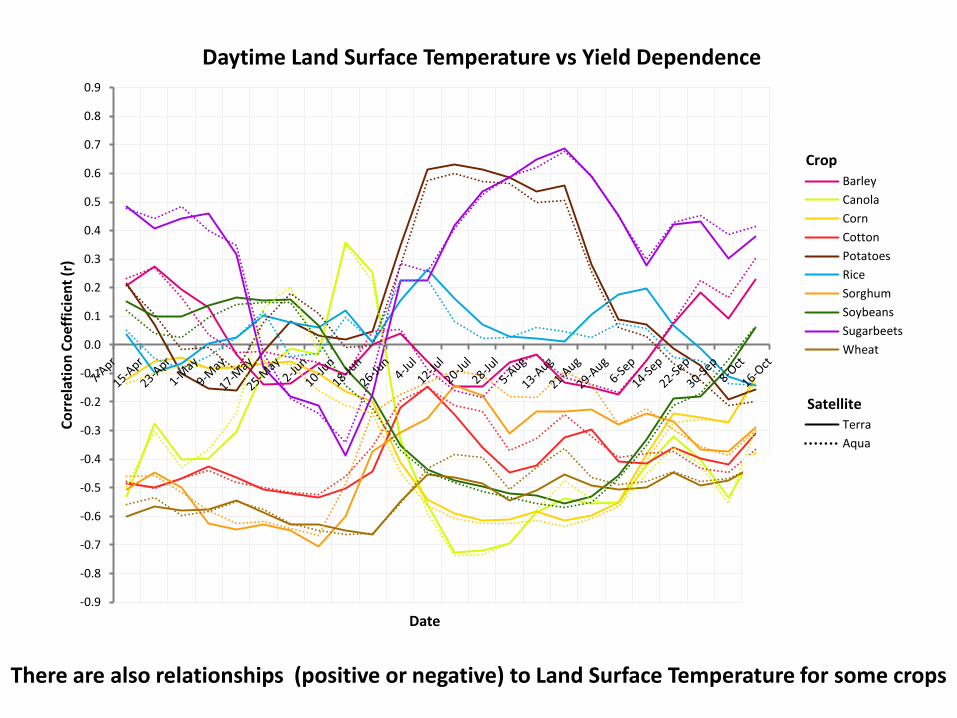
Daytime Land Surface Temperature vs Yield Dependence
Barley
Canola
Corn
Cotton
Potatoes
Rice
Sorghum
Soybeans
Sugarbeets
Wheat
Terra
Aqua
Barley A
Canola A
Corn A
Cotton A
Potatoes A
Rice A
Sorghum A
Soybeans A
Sugarbeets A
Wheat A
Satellite
Crop
There are also relationships (positive or negative) to Land Surface Temperature for some crops
4’ 59.37”
Thanks


