144
Landscape Survey to Support Flood Apex National Flood Decision Support Toolbox Definitions and Existing Tools Aaron Strong, Debra Knopman C O R P O R A T I O N

Landscape Survey to Support Flood Apex National Flood Decision Support ToolboxDefinitions and Existing Tools
Aaron Strong, Debra Knopman
C O R P O R A T I O N

Limited Print and Electronic Distribution Rights
This document and trademark(s) contained herein are protected by law. This representation of RAND intellectual property is provided for noncommercial use only. Unauthorized posting of this publication online is prohibited. Permission is given to duplicate this document for personal use only, as long as it is unaltered and complete. Permission is required from RAND to reproduce, or reuse in another form, any of its research documents for commercial use. For information on reprint and linking permissions, please visit www.rand.org/pubs/permissions.
The RAND Corporation is a research organization that develops solutions to public policy challenges to help make communities throughout the world safer and more secure, healthier and more prosperous. RAND is nonprofit, nonpartisan, and committed to the public interest.
RAND’s publications do not necessarily reflect the opinions of its research clients and sponsors.
Support RANDMake a tax-deductible charitable contribution at
www.rand.org/giving/contribute
www.rand.org
For more information on this publication, visit www.rand.org/t/RR1933
This material is based on work supported by the U.S. Department of Homeland Security under grant award 2015-ST-061-ND0001-01. The views and conclusions contained in this document are those of the authors and should not be interpreted as necessarily representing
the official policies, either expressed or implied, of the U.S. Department of Homeland Security.
Library of Congress Cataloging-in-Publication Data is available for this publication.
ISBN: 978-0-8330-9921-1
Published by the RAND Corporation, Santa Monica, Calif.
© Copyright 2017 RAND Corporation
R® is a registered trademark.
Cover: Jayshrp/Getty Images
iii
Preface
This literature review was initiated to inform the design and development of the Flood Apex National Flood Decision Support Toolbox, a suite of decision support tools for use by the Federal Emergency Management Agency (FEMA), states, communities, and individuals as they assess flood-related risks and plan and implement strategies for risk reduction and resil-ience. The U.S. Department of Homeland Security (DHS) Science and Technology Director-ate’s First Responders Group asked the RAND Corporation to conduct this landscape survey of relevant academic, government, and other literatures, working in collaboration with the Coastal Resilience Center of Excellence at the University of North Carolina, a DHS Center of Excellence.
Risk assessment, risk management, and resilience-building draw on methods of analysis from across the physical, social, and behavioral sciences. The scholarly literature is growing by the day on these topics. In this report, we first summarize definitions of resilience found in the peer-reviewed literature and government and other organizations’ reports. Second, we sum-marize the literature on conceptual frameworks to guide understanding and actions to build resilience and cope with flood disasters, indicator systems for resilience to flooding, and the translation of resilience into actions. Finally, we highlight a suite of practical and broadly appli-cable decision support tools that DHS, FEMA, and state and local officials can use.
The audience for this review is the First Responders Group at DHS, members of the Flood Apex Research Review Board, FEMA officials, state and local officials, and planners and engineers. The content of this survey could inform, for instance, how data are used to improve the disaster declaration process and how to set priorities for expenditure of hazard mitigation funds. The landscape survey could also inform state actions, such as how to target capacity-building efforts to assist communities that face significant risk but have limited capabilities to address these risks.
RAND Justice, Infrastructure, and Environment
The research reported here was conducted in the RAND Justice, Infrastructure, and Environ-ment unit, a division of the RAND Corporation dedicated to improving policy- and decision-making in a wide range of policy domains, including civil and criminal justice, infrastructure development and financing, environmental policy, transportation planning and technology, immigration and border protection, public and occupational safety, energy policy, science and innovation policy, space, and telecommunications.

iv Landscape Survey to Support Flood Apex National Flood Decision Support Toolbox
Questions or comments about this report should be sent to the project leader, Aaron Strong ([email protected]). For more information about JIE, see www.rand.org/jie.
v
Contents
Preface . . . . . . . . . . . . . . . . . . . . . . . . . . . . . . . . . . . . . . . . . . . . . . . . . . . . . . . . . . . . . . . . . . . . . . . . . . . . . . . . . . . . . . . . . . . . . . . . . . . . . . . . . . . iiiFigures and Tables . . . . . . . . . . . . . . . . . . . . . . . . . . . . . . . . . . . . . . . . . . . . . . . . . . . . . . . . . . . . . . . . . . . . . . . . . . . . . . . . . . . . . . . . . . . . . viiSummary . . . . . . . . . . . . . . . . . . . . . . . . . . . . . . . . . . . . . . . . . . . . . . . . . . . . . . . . . . . . . . . . . . . . . . . . . . . . . . . . . . . . . . . . . . . . . . . . . . . . . . . . ixAcknowledgments . . . . . . . . . . . . . . . . . . . . . . . . . . . . . . . . . . . . . . . . . . . . . . . . . . . . . . . . . . . . . . . . . . . . . . . . . . . . . . . . . . . . . . . . . . . . . xvAbbreviations . . . . . . . . . . . . . . . . . . . . . . . . . . . . . . . . . . . . . . . . . . . . . . . . . . . . . . . . . . . . . . . . . . . . . . . . . . . . . . . . . . . . . . . . . . . . . . . . . xvii
CHAPTER ONE
Introduction . . . . . . . . . . . . . . . . . . . . . . . . . . . . . . . . . . . . . . . . . . . . . . . . . . . . . . . . . . . . . . . . . . . . . . . . . . . . . . . . . . . . . . . . . . . . . . . . . . . . . 1Approach to the Literature Review . . . . . . . . . . . . . . . . . . . . . . . . . . . . . . . . . . . . . . . . . . . . . . . . . . . . . . . . . . . . . . . . . . . . . . . . . . . . 2Approach to Identifying Decision Support Tools . . . . . . . . . . . . . . . . . . . . . . . . . . . . . . . . . . . . . . . . . . . . . . . . . . . . . . . . . . . . 3How This Report Is Organized . . . . . . . . . . . . . . . . . . . . . . . . . . . . . . . . . . . . . . . . . . . . . . . . . . . . . . . . . . . . . . . . . . . . . . . . . . . . . . . . . 5
CHAPTER TWO
Definitions of Terms . . . . . . . . . . . . . . . . . . . . . . . . . . . . . . . . . . . . . . . . . . . . . . . . . . . . . . . . . . . . . . . . . . . . . . . . . . . . . . . . . . . . . . . . . . . 7Foundations of Resilience . . . . . . . . . . . . . . . . . . . . . . . . . . . . . . . . . . . . . . . . . . . . . . . . . . . . . . . . . . . . . . . . . . . . . . . . . . . . . . . . . . . . . . . 7Definition of Decision Support. . . . . . . . . . . . . . . . . . . . . . . . . . . . . . . . . . . . . . . . . . . . . . . . . . . . . . . . . . . . . . . . . . . . . . . . . . . . . . . . 12Summary . . . . . . . . . . . . . . . . . . . . . . . . . . . . . . . . . . . . . . . . . . . . . . . . . . . . . . . . . . . . . . . . . . . . . . . . . . . . . . . . . . . . . . . . . . . . . . . . . . . . . . . . . 12
CHAPTER THREE
System-of-Systems Conceptual Frameworks for Resilience Decisionmaking . . . . . . . . . . . . . . . . . . . . . . 13Resilience Frameworks . . . . . . . . . . . . . . . . . . . . . . . . . . . . . . . . . . . . . . . . . . . . . . . . . . . . . . . . . . . . . . . . . . . . . . . . . . . . . . . . . . . . . . . . . 13Structuring Decisions and Understanding Trade-Offs . . . . . . . . . . . . . . . . . . . . . . . . . . . . . . . . . . . . . . . . . . . . . . . . . . . . 22Summary . . . . . . . . . . . . . . . . . . . . . . . . . . . . . . . . . . . . . . . . . . . . . . . . . . . . . . . . . . . . . . . . . . . . . . . . . . . . . . . . . . . . . . . . . . . . . . . . . . . . . . . . 24
CHAPTER FOUR
Indicators and Metric Systems . . . . . . . . . . . . . . . . . . . . . . . . . . . . . . . . . . . . . . . . . . . . . . . . . . . . . . . . . . . . . . . . . . . . . . . . . . . . . 27The Cutter, 2016, Review . . . . . . . . . . . . . . . . . . . . . . . . . . . . . . . . . . . . . . . . . . . . . . . . . . . . . . . . . . . . . . . . . . . . . . . . . . . . . . . . . . . . . 27Indicator Systems Not Considered in Cutter, 2016 . . . . . . . . . . . . . . . . . . . . . . . . . . . . . . . . . . . . . . . . . . . . . . . . . . . . . . . . 30Critique of the Indicator Literature . . . . . . . . . . . . . . . . . . . . . . . . . . . . . . . . . . . . . . . . . . . . . . . . . . . . . . . . . . . . . . . . . . . . . . . . . . 30
CHAPTER FIVE
Resilience in Practice . . . . . . . . . . . . . . . . . . . . . . . . . . . . . . . . . . . . . . . . . . . . . . . . . . . . . . . . . . . . . . . . . . . . . . . . . . . . . . . . . . . . . . . . . 33The Challenge of Translating Ideas into Practice . . . . . . . . . . . . . . . . . . . . . . . . . . . . . . . . . . . . . . . . . . . . . . . . . . . . . . . . . . . 33Top-Down Implementation Efforts . . . . . . . . . . . . . . . . . . . . . . . . . . . . . . . . . . . . . . . . . . . . . . . . . . . . . . . . . . . . . . . . . . . . . . . . . . . 35Bottom-Up Resilience Implementation Efforts . . . . . . . . . . . . . . . . . . . . . . . . . . . . . . . . . . . . . . . . . . . . . . . . . . . . . . . . . . . . . 36Hybrid Approach . . . . . . . . . . . . . . . . . . . . . . . . . . . . . . . . . . . . . . . . . . . . . . . . . . . . . . . . . . . . . . . . . . . . . . . . . . . . . . . . . . . . . . . . . . . . . . . . 37

vi Landscape Survey to Support Flood Apex National Flood Decision Support Toolbox
Urban Resilience Planning . . . . . . . . . . . . . . . . . . . . . . . . . . . . . . . . . . . . . . . . . . . . . . . . . . . . . . . . . . . . . . . . . . . . . . . . . . . . . . . . . . . . 38Implementation of Resilience Measures by the Private Sector . . . . . . . . . . . . . . . . . . . . . . . . . . . . . . . . . . . . . . . . . . . . . 41Summary . . . . . . . . . . . . . . . . . . . . . . . . . . . . . . . . . . . . . . . . . . . . . . . . . . . . . . . . . . . . . . . . . . . . . . . . . . . . . . . . . . . . . . . . . . . . . . . . . . . . . . . . 42
CHAPTER SIX
Decision Support Tools . . . . . . . . . . . . . . . . . . . . . . . . . . . . . . . . . . . . . . . . . . . . . . . . . . . . . . . . . . . . . . . . . . . . . . . . . . . . . . . . . . . . . . . 45Approach to Identifying Decision Support Tools . . . . . . . . . . . . . . . . . . . . . . . . . . . . . . . . . . . . . . . . . . . . . . . . . . . . . . . . . . . 45Risk Identification and Assessment . . . . . . . . . . . . . . . . . . . . . . . . . . . . . . . . . . . . . . . . . . . . . . . . . . . . . . . . . . . . . . . . . . . . . . . . . . . 47Vulnerability Assessment . . . . . . . . . . . . . . . . . . . . . . . . . . . . . . . . . . . . . . . . . . . . . . . . . . . . . . . . . . . . . . . . . . . . . . . . . . . . . . . . . . . . . . 48Environmental Assessment . . . . . . . . . . . . . . . . . . . . . . . . . . . . . . . . . . . . . . . . . . . . . . . . . . . . . . . . . . . . . . . . . . . . . . . . . . . . . . . . . . . . . 49Emergency Management . . . . . . . . . . . . . . . . . . . . . . . . . . . . . . . . . . . . . . . . . . . . . . . . . . . . . . . . . . . . . . . . . . . . . . . . . . . . . . . . . . . . . . 50Project Evaluation Tools . . . . . . . . . . . . . . . . . . . . . . . . . . . . . . . . . . . . . . . . . . . . . . . . . . . . . . . . . . . . . . . . . . . . . . . . . . . . . . . . . . . . . . . . 51Integrated Decision Support Tools . . . . . . . . . . . . . . . . . . . . . . . . . . . . . . . . . . . . . . . . . . . . . . . . . . . . . . . . . . . . . . . . . . . . . . . . . . . . 52Process Support . . . . . . . . . . . . . . . . . . . . . . . . . . . . . . . . . . . . . . . . . . . . . . . . . . . . . . . . . . . . . . . . . . . . . . . . . . . . . . . . . . . . . . . . . . . . . . . . . 54Summary of Findings. . . . . . . . . . . . . . . . . . . . . . . . . . . . . . . . . . . . . . . . . . . . . . . . . . . . . . . . . . . . . . . . . . . . . . . . . . . . . . . . . . . . . . . . . . . 55
CHAPTER SEVEN
Case Studies of Decision Support Tool Implementation for Flooding . . . . . . . . . . . . . . . . . . . . . . . . . . . . . . 57Marin County, California . . . . . . . . . . . . . . . . . . . . . . . . . . . . . . . . . . . . . . . . . . . . . . . . . . . . . . . . . . . . . . . . . . . . . . . . . . . . . . . . . . . . . . 57New York City Hazard Mitigation Plan . . . . . . . . . . . . . . . . . . . . . . . . . . . . . . . . . . . . . . . . . . . . . . . . . . . . . . . . . . . . . . . . . . . . . 572012 Comprehensive Master Plan for a Sustainable Coast . . . . . . . . . . . . . . . . . . . . . . . . . . . . . . . . . . . . . . . . . . . . . . . . 58
CHAPTER EIGHT
Summary of Findings . . . . . . . . . . . . . . . . . . . . . . . . . . . . . . . . . . . . . . . . . . . . . . . . . . . . . . . . . . . . . . . . . . . . . . . . . . . . . . . . . . . . . . . . . 61Conceptual Frameworks . . . . . . . . . . . . . . . . . . . . . . . . . . . . . . . . . . . . . . . . . . . . . . . . . . . . . . . . . . . . . . . . . . . . . . . . . . . . . . . . . . . . . . . 61Indicator and Metric Systems . . . . . . . . . . . . . . . . . . . . . . . . . . . . . . . . . . . . . . . . . . . . . . . . . . . . . . . . . . . . . . . . . . . . . . . . . . . . . . . . . . 62Resilience in Action . . . . . . . . . . . . . . . . . . . . . . . . . . . . . . . . . . . . . . . . . . . . . . . . . . . . . . . . . . . . . . . . . . . . . . . . . . . . . . . . . . . . . . . . . . . . . 62Decision Support Tools . . . . . . . . . . . . . . . . . . . . . . . . . . . . . . . . . . . . . . . . . . . . . . . . . . . . . . . . . . . . . . . . . . . . . . . . . . . . . . . . . . . . . . . . . 63
APPENDIX
Summary Tables . . . . . . . . . . . . . . . . . . . . . . . . . . . . . . . . . . . . . . . . . . . . . . . . . . . . . . . . . . . . . . . . . . . . . . . . . . . . . . . . . . . . . . . . . . . . . . . 65
References . . . . . . . . . . . . . . . . . . . . . . . . . . . . . . . . . . . . . . . . . . . . . . . . . . . . . . . . . . . . . . . . . . . . . . . . . . . . . . . . . . . . . . . . . . . . . . . . . . . . . 113

vii
Figures and Tables
Figures
2.1. Community Functioning Following an Event . . . . . . . . . . . . . . . . . . . . . . . . . . . . . . . . . . . . . . . . . . . . . . . . . 10 3.1. City Resilience Framework . . . . . . . . . . . . . . . . . . . . . . . . . . . . . . . . . . . . . . . . . . . . . . . . . . . . . . . . . . . . . . . . . . . . . . . 15 3.2. Norris et al., 2008, Definition of Resilience . . . . . . . . . . . . . . . . . . . . . . . . . . . . . . . . . . . . . . . . . . . . . . . . . . . . 16 3.3. Rose, 2004b, Framework . . . . . . . . . . . . . . . . . . . . . . . . . . . . . . . . . . . . . . . . . . . . . . . . . . . . . . . . . . . . . . . . . . . . . . . . . 18 3.4. Francis and Bekera, 2014, Framework . . . . . . . . . . . . . . . . . . . . . . . . . . . . . . . . . . . . . . . . . . . . . . . . . . . . . . . . . . 19 3.5. Bruneau et al., 2003, Technical, Organizational, Social, and Economic Framework . . . . 20 3.6. Bruneau et al., 2003, Subsystem Analysis . . . . . . . . . . . . . . . . . . . . . . . . . . . . . . . . . . . . . . . . . . . . . . . . . . . . . . 21 7.1. A Schematic Representation of the Robust Decisionmaking Approach . . . . . . . . . . . . . . . . . . . . 58
Tables
2.1. Representative Definitions of Resilience . . . . . . . . . . . . . . . . . . . . . . . . . . . . . . . . . . . . . . . . . . . . . . . . . . . . . . . . . 8 4.1. Indicator Systems Reviewed in Cutter, 2016 . . . . . . . . . . . . . . . . . . . . . . . . . . . . . . . . . . . . . . . . . . . . . . . . . . 28 6.1. Risk Assessment Tools. . . . . . . . . . . . . . . . . . . . . . . . . . . . . . . . . . . . . . . . . . . . . . . . . . . . . . . . . . . . . . . . . . . . . . . . . . . . 48 6.2. Summary of Vulnerability Assessment Tools . . . . . . . . . . . . . . . . . . . . . . . . . . . . . . . . . . . . . . . . . . . . . . . . . . . 49 6.3. Environmental Assessment Tools . . . . . . . . . . . . . . . . . . . . . . . . . . . . . . . . . . . . . . . . . . . . . . . . . . . . . . . . . . . . . . . 50 6.4. Emergency Management Tools . . . . . . . . . . . . . . . . . . . . . . . . . . . . . . . . . . . . . . . . . . . . . . . . . . . . . . . . . . . . . . . . . . 51 6.5. Project Evaluation Tools . . . . . . . . . . . . . . . . . . . . . . . . . . . . . . . . . . . . . . . . . . . . . . . . . . . . . . . . . . . . . . . . . . . . . . . . . . 52 6.6. Integrated Decision Support Tools . . . . . . . . . . . . . . . . . . . . . . . . . . . . . . . . . . . . . . . . . . . . . . . . . . . . . . . . . . . . . 54 A.1. MIKE FLOOD . . . . . . . . . . . . . . . . . . . . . . . . . . . . . . . . . . . . . . . . . . . . . . . . . . . . . . . . . . . . . . . . . . . . . . . . . . . . . . . . . . . 66 A.2. Decision Support System for Water Infrastructural Security . . . . . . . . . . . . . . . . . . . . . . . . . . . . . . . . . 67 A.3. German Bight Risk Analysis Tool . . . . . . . . . . . . . . . . . . . . . . . . . . . . . . . . . . . . . . . . . . . . . . . . . . . . . . . . . . . . . . 68 A.4. Simplified Flood Risk Assessment Tool . . . . . . . . . . . . . . . . . . . . . . . . . . . . . . . . . . . . . . . . . . . . . . . . . . . . . . . . . 69 A.5. Flood Risk Tools for New Jersey and New York Communities . . . . . . . . . . . . . . . . . . . . . . . . . . . . . . 70 A.6. Hydrologic Engineering Center’s River Analysis System . . . . . . . . . . . . . . . . . . . . . . . . . . . . . . . . . . . . . 71 A.7. West Virginia Flood Tool . . . . . . . . . . . . . . . . . . . . . . . . . . . . . . . . . . . . . . . . . . . . . . . . . . . . . . . . . . . . . . . . . . . . . . . . . 72 A.8. Local Flood Risk Assessment Prototype Tool . . . . . . . . . . . . . . . . . . . . . . . . . . . . . . . . . . . . . . . . . . . . . . . . . . 73 A.9. LATIS . . . . . . . . . . . . . . . . . . . . . . . . . . . . . . . . . . . . . . . . . . . . . . . . . . . . . . . . . . . . . . . . . . . . . . . . . . . . . . . . . . . . . . . . . . . . . . . 74 A.10. Risk and Vulnerability Assessment Tool Florida Pilot . . . . . . . . . . . . . . . . . . . . . . . . . . . . . . . . . . . . . . . . 75 A.11. Flood Risk Information System . . . . . . . . . . . . . . . . . . . . . . . . . . . . . . . . . . . . . . . . . . . . . . . . . . . . . . . . . . . . . . . . . . 76 A.12. North Carolina Floodplain Mapping Program . . . . . . . . . . . . . . . . . . . . . . . . . . . . . . . . . . . . . . . . . . . . . . . 77 A.13. Advanced Circulation . . . . . . . . . . . . . . . . . . . . . . . . . . . . . . . . . . . . . . . . . . . . . . . . . . . . . . . . . . . . . . . . . . . . . . . . . . . . . 78 A.14. CommunityViz and weTable . . . . . . . . . . . . . . . . . . . . . . . . . . . . . . . . . . . . . . . . . . . . . . . . . . . . . . . . . . . . . . . . . . . . . 79 A.15. Mississippi River Delta Flood Risk and Resilience Viewer . . . . . . . . . . . . . . . . . . . . . . . . . . . . . . . . . . 80 A.16. New Jersey Flood Mapper . . . . . . . . . . . . . . . . . . . . . . . . . . . . . . . . . . . . . . . . . . . . . . . . . . . . . . . . . . . . . . . . . . . . . . . . 81

viii Landscape Survey to Support Flood Apex National Flood Decision Support Toolbox
A.17. National Oceanic and Atmospheric Administration Sea Level Rise Viewer . . . . . . . . . . . . . . . 82 A.18. National Oceanic and Atmospheric Administration Sea Level Rise Planning Tool . . . . . . . 83 A.19. National Oceanic and Atmospheric Administration’s Coastal Flood Exposure
Mapper . . . . . . . . . . . . . . . . . . . . . . . . . . . . . . . . . . . . . . . . . . . . . . . . . . . . . . . . . . . . . . . . . . . . . . . . . . . . . . . . . . . . . . . . . . . . . 84 A.20. STORMTOOLS . . . . . . . . . . . . . . . . . . . . . . . . . . . . . . . . . . . . . . . . . . . . . . . . . . . . . . . . . . . . . . . . . . . . . . . . . . . . . . . . . . 85 A.21. Risk Assessment for Systems Planning Decision Support . . . . . . . . . . . . . . . . . . . . . . . . . . . . . . . . . . . 86 A.22. Natural Capital Project InVEST . . . . . . . . . . . . . . . . . . . . . . . . . . . . . . . . . . . . . . . . . . . . . . . . . . . . . . . . . . . . . . . . 87 A.23. The Nature Conservancy Coastal Resilience . . . . . . . . . . . . . . . . . . . . . . . . . . . . . . . . . . . . . . . . . . . . . . . . . . 88 A.24. Land Utilisation and Capability Indicator . . . . . . . . . . . . . . . . . . . . . . . . . . . . . . . . . . . . . . . . . . . . . . . . . . . . . . 89 A.25. New Hampshire Department of Environmental Services Wetland Restoration
Assessment Model . . . . . . . . . . . . . . . . . . . . . . . . . . . . . . . . . . . . . . . . . . . . . . . . . . . . . . . . . . . . . . . . . . . . . . . . . . . . . . . . 90 A.26. Watershed Resources Registry Riparian Zone Restoration Suitability Model . . . . . . . . . . . . . 91 A.27. HURREVAC. . . . . . . . . . . . . . . . . . . . . . . . . . . . . . . . . . . . . . . . . . . . . . . . . . . . . . . . . . . . . . . . . . . . . . . . . . . . . . . . . . . . . . 92 A.28. Open Flood Risk Map . . . . . . . . . . . . . . . . . . . . . . . . . . . . . . . . . . . . . . . . . . . . . . . . . . . . . . . . . . . . . . . . . . . . . . . . . . . . 93 A.29. Deltares Flood Early Warning System . . . . . . . . . . . . . . . . . . . . . . . . . . . . . . . . . . . . . . . . . . . . . . . . . . . . . . . . . 94 A.30. Quanzhou Flood Prevention Information System . . . . . . . . . . . . . . . . . . . . . . . . . . . . . . . . . . . . . . . . . . . . . 95 A.31. U.S. Army Corps of Engineers Water Management System . . . . . . . . . . . . . . . . . . . . . . . . . . . . . . . . 96 A.32. Colorado Flood Decision Support System . . . . . . . . . . . . . . . . . . . . . . . . . . . . . . . . . . . . . . . . . . . . . . . . . . . . . 97 A.33. Flood Integrated Decision Support System, Melbourne . . . . . . . . . . . . . . . . . . . . . . . . . . . . . . . . . . . . . 98 A.34. Munsan City, Korea, Decision Support System . . . . . . . . . . . . . . . . . . . . . . . . . . . . . . . . . . . . . . . . . . . . . . . 99 A.35. Coastal Louisiana Risk Assessment Model . . . . . . . . . . . . . . . . . . . . . . . . . . . . . . . . . . . . . . . . . . . . . . . . . . . 100 A.36. Autocase . . . . . . . . . . . . . . . . . . . . . . . . . . . . . . . . . . . . . . . . . . . . . . . . . . . . . . . . . . . . . . . . . . . . . . . . . . . . . . . . . . . . . . . . . . . 101 A.37. Beach-fx . . . . . . . . . . . . . . . . . . . . . . . . . . . . . . . . . . . . . . . . . . . . . . . . . . . . . . . . . . . . . . . . . . . . . . . . . . . . . . . . . . . . . . . . . . . 102 A.38. Hydrologic Engineering Center’s Flood Damage Reduction Analysis . . . . . . . . . . . . . . . . . . . . 103 A.39. DHI Flood Toolbox . . . . . . . . . . . . . . . . . . . . . . . . . . . . . . . . . . . . . . . . . . . . . . . . . . . . . . . . . . . . . . . . . . . . . . . . . . . . . 104 A.40. Elbe River Decision Support Tool Part of FLOODsite . . . . . . . . . . . . . . . . . . . . . . . . . . . . . . . . . . . . . 105 A.41. THESEUS Decision Support System Software Tool . . . . . . . . . . . . . . . . . . . . . . . . . . . . . . . . . . . . . . . . 106 A.42. Modelling and Decision Support Framework 2 . . . . . . . . . . . . . . . . . . . . . . . . . . . . . . . . . . . . . . . . . . . . . . 107 A.43. Watershed Management Optimization Support Tool . . . . . . . . . . . . . . . . . . . . . . . . . . . . . . . . . . . . . . . 108 A.44. Ho Chi Minh City Robust Decisionmaking . . . . . . . . . . . . . . . . . . . . . . . . . . . . . . . . . . . . . . . . . . . . . . . . . 109 A.45. Coastal Protection and Restoration Authority Planning Tool . . . . . . . . . . . . . . . . . . . . . . . . . . . . . 110 A.46. Risk Mapping, Assessment and Planning . . . . . . . . . . . . . . . . . . . . . . . . . . . . . . . . . . . . . . . . . . . . . . . . . . . . . 111 A.47. Georgetown Adaptation Tool Kit . . . . . . . . . . . . . . . . . . . . . . . . . . . . . . . . . . . . . . . . . . . . . . . . . . . . . . . . . . . . . . 112

ix
Summary
This literature review was initiated to inform the design and development of the Flood Apex National Flood Decision Support Toolbox, a suite of decision support tools (DSTs) for use by the Federal Emergency Management Agency, states, communities, and individuals as they assess flood-related risks and plan and implement strategies for risk reduction and resilience. The U.S. Department of Homeland Security (DHS) Science and Technology Directorate’s First Responders Group asked RAND to conduct this landscape survey of relevant academic, government, and other literatures, working in collaboration with the Coastal Resilience Center of Excellence at the University of North Carolina, a DHS Center of Excellence.
Without the benefit of settled theory or practice in resilience, many communities have embarked on planning processes that relate in some way to coastal storm surge, tidal and riv-erine flood risk reduction, storm water management, integrated water resource management, and reassessment of land use and transportation infrastructure, as well as better approaches to recovery if an adverse event happens. These communities are improvising with existing flood risk assessment models but often finding it difficult to link output from these models to broader community goals and other tools in common use for land use, transportation, water resources, and other infrastructure planning. Further, different institutional and governance structures impose different constraints on solutions to flood risk and resilience, complicating communities’ ability to borrow from one another.
The challenge to many communities is to identify the most appropriate analytical approach and identify actions that fit their needs, financial resources, and technical and insti-tutional capacities. The Flood Apex National Flood Decision Support Toolbox aims to facili-tate this process for most, if not all, communities. The toolbox will need to have the scope and flexibility to accommodate a wide range of local conditions, with respect not only to flooding but also to financing and financial sustainability, governance, and other important goals and values within the community.
We structure the literature review around two main questions: (1) What is resilience, and how have communities incorporated resilience into decisionmaking? And (2) what is the state of analytic modeling for decision support for flood hazard mitigation? We divide the report into two major components corresponding to these broad questions and the tasks that DHS asked RAND to address. The first component is focused on resilience. In particular, the topic areas included (1) various definitions of resilience, (2) system-of-systems frameworks for con-ceptualizing resilience, (3) indicator and metric systems for resilience, and (4) examples of how resilience has been used in practice. We provide a separate overview for each of these aspects. The second component catalogs DSTs for flood risk assessment that form a range of tools that federal, state, and local governments could use. Additionally, the second component discusses

x Landscape Survey to Support Flood Apex National Flood Decision Support Toolbox
how DSTs have been used in selected cases. Because few DSTs focus on resilience, we could not establish definitive links between the two components.
We use decision support to mean a two-way process of communication between the pro-ducers of flood-relevant data and information and the users of this information in service to a process of analyzing and choosing a course of action from among a set of alternatives. We reviewed models and tools for flood risk management and present a structure for thinking about decision support in the context of flood risk reduction, management, and resilience; pro-vide a brief overview of each of the tools that meet our criteria for decision support; use several examples to illustrate how these tools have been used in different settings; and make recom-mendations to DHS about whether further investigation into the models is warranted.
Approach to the Literature Review
Our overall approach for each of the literature reviews was to develop a library of resources based on searches of major databases of published literature and keywords relevant to each of the topic areas. Additionally, we used a database of literature developed at RAND on commu-nity response to climate change. Using these two sets of resources, we first looked for relevant review articles. For the first three topics—definition of resilience, conceptual frameworks for resilience, and indicator systems for resilience—we identified recent literature reviews. From these previous literature reviews, we expanded the library of articles to include forward and backward searches of cited or citing material using Google Scholar and Web of Science.
Search and Screening Process for Decision Support Tools
We searched the literature for models and tools whose authors or organizations self-identified them as DSTs for flood risk management. Our search included the following tools: Google Search, Google Scholar, Web of Science, and JSTOR. We sought to cast a wide net of self-identified methods and products and therefore used the following search terms: decision sup-port flood, decision support tools flood, flood tools, decision support system flood, and flood decision making. Our initial search resulted in a list of approximately 100 models and tools. In screen-ing the many self-identified DSTs, we applied several criteria to reduce the number to a man-ageable set and focus our efforts on those that had the potential of mattering most to the Flood Apex program:
• field application: Was the DST implemented in the field at least once?• documentation: Does any website or readily available English-language source document
explain the DST’s essential features?• validation: Has the DST been subjected to any type of validation process that provides
evidence that model results under historical conditions bear a close relationship to actual field observations, excluding those used in model calibration?
The last criterion, validation, proved to be insurmountable for all of the DSTs that turned up in our search, therefore limiting us to the first two—less stringent—criteria for inclusion.

Summary xi
As our broad definition implies, DSTs can serve many purposes. What matters in this survey is their relevance to the DHS Flood Apex program and its intended purpose to identify and potentially promote among communities a useful, accessible set of DSTs that could be tai-lored to their specific needs. We therefore defined the following suitability criteria to provide the basis for our judgments:
• uncertainty: Does the DST incorporate uncertainty with respect to a changing climate, land use, demographics, or other key drivers of system performance?
• transferability: Can the DST be used for applications in places other than the one for which it was originally designed?
• U.S. application: Has the DST been implemented in the United States?• usability and transparency: Could well-trained planners found in most communities use
the DST with minimal outside intervention, or would consultants most likely be needed?
We next divided DSTs into seven broad functional categories: risk identification and assessment, vulnerability assessment, environmental assessment, emergency management, project evaluation, integrated decision support, and process support. This categorization allows comparisons across different models and tools that have similar goals but is not meant to rank the DSTs, given the heterogeneity of their purposes and applications.
We developed a summary sheet for each DST to compare its characteristics with those of tools with similar purposes. These summary sheets address who developed the tool, where, and why; the tool’s functionality and the means of executing it; the tool’s data requirements, user interactions, and outputs; and the tool’s suitability for addressing climate change and uncer-tainty, its portability, and its practical value to communities that would warrant a recommen-dation to DHS to take a closer look.
Findings and Conclusions
Each individual community has its own goals of resilience, its own hazards, its own inter-dependencies that exist between subsystems, and its own economic composition and needs. As a result, decision analysis and support frameworks and indicators need to be tailored to each individual community. Resilience thus needs to be framed in terms of the particular circumstances of each individual community. Although some general frameworks and indica-tor systems are portable across communities, they must be adapted on a case-by-case basis to be useful. An infrastructure-centered framework might work well for one community, but a function-centered framework might work better for another. Given the diversity of communi-ties and the diversity of resilience goals, some frameworks work better in some contexts than in others.
In the past decade, resilience has become a major organizing principle in disaster plan-ning, mitigation, management, and recovery across all levels of government and in many non-governmental organizations (NGOs) and commercial enterprises. The degree to which it has been operationalized in practice is highly variable. The federal government has shown leader-ship in this movement toward resilience, with major programs coming out of DHS (including the Federal Emergency Management Agency) and the National Institute of Standards and Technology, among others. Major NGOs, including the American Red Cross and the Rocke-

xii Landscape Survey to Support Flood Apex National Flood Decision Support Toolbox
feller Foundation, have served a complementary role in building resilience from the bottom up in individual cities and communities. Many states, counties, and cities have produced detailed risk reduction, disaster mitigation, and disaster recovery plans that are built around the ideas of resilience science. These plans take their form from the guidelines that the federal government promulgates, the interventions that NGOs offer, and examples of comparable municipalities and governments. The work of the Rockefeller Foundation–sponsored 100 Resilient Cities pro-gram and the National Institute of Standards and Technology provide clear examples of how the ideas of resilience have modified urban planning and public works.
In parallel with the growth of the resilience paradigm, DSTs have moved from basic physical models, including maps and tabletop demonstrations and informed by historical flood patterns and basic geophysical measurements, to sophisticated hydrodynamic simulations that can produce detailed snapshots of expected property damage and infrastructure performance under thousands of futures that explore climate and other uncertainties. Thinking about the process of flood protection has also evolved. In the United States and in many other parts of the world, the idea that government experts should design and harden infrastructure to protect citizens from flooding has shifted to a model of resilience and robustness, based not just on hard infrastructure but also on investments in natural and social capital that enable communi-ties to mitigate impacts of flood events and recover more quickly.
At present, jurisdictions vary considerably in terms of adopting flood DSTs for use in preparing action plans and investment decisions. Best practices in this area are still emerging, but it is possible to identify some major patterns and trends. Flood risk visualization is com-monplace, and visualization tools are becoming increasingly capable. The use of visualization techniques plays a key role in helping both technical and nontechnical people understand information coming out of the models.
Contemporary work on resilience and stakeholder involvement points strongly toward the continued importance of deliberative process and community involvement in framing mitiga-tion alternatives and evaluating the trade-offs among them. Successful comprehensive DSTs can be expected to include aspects that explicitly support community-based efforts of this sort.
Deep uncertainty is increasingly appreciated as an important aspect of risk analysis and risk management. This is particularly true as we enter an era of changing rainfall patterns, storm intensities, and sea levels, wherein historical patterns are less reliable than ever as predic-tors of future conditions. Mitigation measures often display redundancies or synergies. Some tools can now seek out combinations of measures that produce the best results, by one metric or another, under a variety of future conditions.
Different communities with different goals, projects, and budget constraints require dif-ferent tools with different capabilities. Hence, any national effort focused on DSTs should con-sider the goal of building a toolbox rather than crafting a single tool that can fulfill all aspects for which communities might need decision support. A one-size-fits-all solution to this type of problem does not exist. DSTs need to be tailored to communities’ needs and technical abilities.
To better estimate the loss following an event, additional tools and models need to be developed to capture effects beyond structural damage. Structures are capital stocks that pro-duce flows of services, which might or might not be quantified. In contrast, business interrup-tions are flows. Thus, the two cannot be simply added when damage estimates are made; these are not apples-to-apples comparisons.
The focus of most of the tools is disaster risk reduction, not resilience. Moving from disas-ter risk reduction to resilience would require a greater consideration of the natural- and social-

Summary xiii
capital stocks in each community because they play an important role in a community’s ability to absorb a disaster’s effects and to recover from disaster. The interaction of capital stocks with physical infrastructure is not well understood and hence not captured in existing DSTs.
Finally, how DSTs are disseminated to communities needs particular attention. Com-munities need guidance through the decisionmaking process. The agricultural extension net-work and the National Oceanic and Atmospheric Administration Sea Grant extension pro-grams provide models whereby people with technical knowledge can transfer that knowledge to people making decisions to improve outcomes. The local context matters, especially when large investments are being considered in terms of flood damage mitigation.
The focus of the first portion of this literature survey was on definitions and frameworks for characterizing resilience, while the second focused on the availability of DSTs. An unex-pected result was not finding resilience tools that could be considered different from exist-ing flood damage mitigation tools. From our view of the literature, the interdependencies among environmental, social, and other systems have not as yet been considered explicitly. This appears to be an area ripe for advancement.


xv
Acknowledgments
We wish to thank Sandra K. Knight of the Center for Disaster Resilience in the Department of Civil Engineering at the University of Maryland A. James Clark School of Engineering, Tom Richardson of Jackson State University and the Coastal Resilience Center of Excellence at the University of North Carolina, and Gavin Smith of the Coastal Resilience Center of Excel-lence at the University of North Carolina for their help and support throughout this study. We have also benefited from a thorough review and constructive feedback by members of the Flood Apex Research Review Board and RAND senior economist Craig A. Bond, as well as our RAND colleagues Henry H. Willis, former director of the RAND Homeland Security and Defense Center and now deputy director of the RAND Homeland Security Operational Analysis Center, and Brian A. Jackson, director of the Security Studies Program in the RAND Homeland Security Operational Analysis Center. We also wish to acknowledge the research contributions of our RAND colleagues Timothy Gulden and Blake Cignarella.


xvii
Abbreviations
2D two dimensional
3D three dimensional
100RC 100 Resilient Cities
ADCIRC Advanced Circulation
ArcGIS Arc Geographic Information System
CLARA Coastal Louisiana Risk Assessment Model
CPRA Coastal Protection and Restoration Authority
CRO chief resilience officer
Delft FEWS Deltares Flood Early Warning System
DEM digital elevation map
DHS U.S. Department of Homeland Security
DSS decision support system
DST decision support tool
EPA U.S. Environmental Protection Agency
EU European Union
FEMA Federal Emergency Management Agency
FIRM flood insurance risk map
GIS geographic information system
GUI graphical user interface
Hazus-MH Hazards–United States Multi-Hazard
HEC-FDA Hydrologic Engineering Center’s Flood Damage Reduction Analysis
H&H hydrologic and hydraulic
HSDC RAND Homeland Security and Defense Center

xviii Landscape Survey to Support Flood Apex National Flood Decision Support Toolbox
IFRC International Federation of Red Cross and Red Crescent Societies
LUCI Land Utilisation and Capability Indicator
MDSF2 Modelling and Decision Support Framework 2
NFIP National Flood Insurance Program
NGO nongovernmental organization
NHDES New Hampshire Department of Environmental Services
NIST National Institute of Standards and Technology
NOAA National Oceanic and Atmospheric Administration
OSM OpenStreetMap
RDM robust decisionmaking
RVAT Risk and Vulnerability Assessment Tool
SLR sea-level rise
UI user interface
UK United Kingdom
UNISDR United Nations Office for Disaster Risk Reduction
USACE U.S. Army Corps of Engineers
WMOST Watershed Management Optimization Support Tool
WRAM Wetland Restoration Assessment Model
XLRM exogenous uncertainties, policy levers, relationships, and metrics

1
CHAPTER ONE
Introduction
This literature review was initiated to inform the design and development of the Flood Apex National Flood Decision Support Toolbox, a suite of decision support tools (DSTs) for the Federal Emergency Management Agency (FEMA), states, communities, and individuals to use as they assess flood-related risks and plan and implement strategies for risk reduction and resilience. The U.S. Department of Homeland Security (DHS) Science and Technology Direc-torate’s First Responders Group asked RAND to conduct this “landscape survey” of relevant academic, government, and other literatures, working in collaboration with the Coastal Resil-ience Center of Excellence at the University of North Carolina, a DHS Center of Excellence.
Risk assessment, risk management, and resilience-building draw on methods of analysis from across the physical, social, and behavioral sciences. The scholarly literature is growing by the day on these topics. In this report, we first summarize definitions of resilience found in the peer-reviewed literature and government and other organizations’ reports. Second, we summarize the literature on conceptual frameworks to guide understanding and actions to build resilience and cope with flood disasters, indicator systems for resilience to flooding, and the translation of resilience into actions. Finally, we highlight a suite of practical and broadly applicable DSTs that DHS, FEMA, and state and local officials can use, and we offer a few case studies for how decisionmakers have used DSTs.
Without the benefit of settled theory or practice in resilience, many communities have embarked on planning processes that relate in some way to coastal storm surge, tidal and river-ine flood risk reduction, storm water management, integrated water resource management, and reassessment of land use and transportation infrastructure. These communities are improvising with existing flood risk assessment models but often finding it difficult to link output from these models to broader community goals and other tools in common use for land use, trans-portation, water resources, and other infrastructure planning. Further, different institutional and governance structures impose different constraints on solutions to flood risk and resilience, complicating communities’ ability to borrow from one another.
The challenge to communities is to identify the most appropriate analytical approach and identify actions that fit their needs, financial resources, and technical and institutional capaci-ties. The Flood Apex National Flood Decision Support Toolbox aims to facilitate this process. The toolbox will need to have the scope and flexibility to accommodate a wide range of local conditions, with respect not only to flooding but also to financing and financial sustainability, governance, and other important goals and values within the community.
This report summarizes the literature that defines resilience, system-of-systems frame-works for resilience, indicator and metric systems for resilience that have actually been used, and the translation of resilience into practice. Our goal is not to provide an exhaustive list of

2 Landscape Survey to Support Flood Apex National Flood Decision Support Toolbox
citations but to highlight differences in interpretation of resilience across definitions, frame-works, and metric systems. We also review a select set of tools that have been developed and used productively to support one or more aspects of decisionmaking related to flooding. In the past two decades, as software applications and computing power have grown dramatically, planners, engineers, and scientists have been providing decisionmakers with a broader array of analytical tools to help inform choices about investments, strategies, and policies related to flood risk management.
Approach to the Literature Review
Our overall approach for each of the literature reviews was to develop a library of resources based on searches using widely available online databases and keywords relevant to each of the topic areas. Additionally, we used a database of literature developed at RAND on community response to climate change. Using these two sets of resources, we first looked for relevant lit-erature reviews. For the first three topics—definition of resilience, conceptual frameworks for resilience, and indicator systems for resilience—we identified recent literature reviews. From these previous literature reviews, we expanded the library of articles to include forward and backward searches of cited or citing material using Google Scholar and Web of Science.
Regarding resilience in practice, our approach was to identify a few key municipali-ties, nonprofits, and private-sector entities that have used the ideas of resilience to fundamen-tally change their approach to disaster management. Given the recent emphasis on resilience throughout the country, it is difficult to distinguish between simply using the term resilience to rename status quo behavior and a fundamental shift in action. We identify institutions that have altered their behavior through the ideas of resilience through interactions with mem-bers of the research review board for Flood Apex and leads from other experts in the field of resilience.1
For the definition of resilience, we built on the review in Norris et al., 2008. Our work-ing definition is in line with the National Academy of Sciences definition that appears in Disaster Resilience: A National Imperative (National Academies, 2012) because this is the defi-nition currently adopted by DHS. The broad overview of the resilience frameworks in the system-of-systems literature draws on Arup International Development, 2014, and National Institute of Standards and Technology, 2015a, as starting points, but we also considered more than 100 other papers to assess alternatives to the frameworks considered in Arup Interna-tional Development, 2014. Our intent is to provide an overview of frameworks that could be used in a decision support context, not to provide an exhaustive list of frameworks. Cutter, 2016, reviews the indicator systems, with a focus on systems that have been implemented. We include a larger discussion of indexes of interdependencies not present in the Cutter review that are directly related to the interdependencies that resilience is meant to capture. By provid-ing a metric for how interrelated the system components are, these indexes of interdependency provide a link between the frameworks considered and indicator systems that have been used.
1 A list of the members of the Flood Apex Research Review Board is available at DHS, undated.

Introduction 3
Approach to Identifying Decision Support Tools
DST refers to any of a range of analytical, computer-, or web-based products that might relate to some or all of the following functionality: environmental, vulnerability, damage, or risk assessment; evaluation of alternative projects, policies, or strategies; analysis of trade-offs across multiple community or regional objectives; and risk communication. Nearly every DST has a visualization component, typically in the form of a geographic information system mapping application, but some are capable of providing other graphical output. Most DSTs include one or more of these functions; very few include all of them.
Search and Screening Process
We searched the literature for models and tools whose authors or organizations self-identified them as DSTs for flood risk management. Our search included the following tools: Google Search, Google Scholar, Web of Science, and JSTOR. We sought to cast a wide net of self-identified methods and products and therefore used the following search terms: decision sup-port flood, decision support tools flood, flood tools, decision support system flood, and flood decision making. Our initial search resulted in a list of approximately 100 models and tools.
In screening the many self-identified DSTs that we found in our search of the literature, we applied several criteria to reduce the number to a manageable set and focus our efforts on those that had the potential of mattering most to the Flood Apex program:
• field application: Was the DST implemented in the field at least once?• documentation: Does any website or readily available English-language source document
explain the DST’s essential features?• validation: Has the DST been subjected to any type of validation process that provides
evidence that model results under historical conditions bear a close relationship to actual field observations, excluding those used in model calibration?
The last criterion, validation, proved to be insurmountable for all of the DSTs that turned up in our search, and therefore our screening relied on the first two—less stringent—screen-ing criteria.
We consciously made a decision not to include any hydrologic or hydraulic (H&H) model by itself in the absence of a well-documented field application that illustrated its use in real-world conditions. Additionally, we do not include benefit–cost, cost-effectiveness, or other eco-nomic concepts or tools. We view these methods of comparative analysis of individual projects in contrast to a higher-level community-based and multiobjective approach to decisionmak-ing. For this reason, we have not included FEMA’s Benefit–Cost Analysis tool in the analysis because we have taken a community perspective rather than a parcel-level view. Similarly, we have not included expert elicitation or Expert Choice as a tool because these are methods for gathering data (although they do support the decisionmaking process). We also exclude data-gathering tools. These include the FEMA flood maps and outputs from H&H models. We take these as inputs to the models considered here.
Criteria for Evaluating Decision Support Tools
DSTs can serve many purposes, as our broad definition of the term implies. What matters in this literature review of DSTs is their relevance to the DHS Flood Apex program and its

4 Landscape Survey to Support Flood Apex National Flood Decision Support Toolbox
intended purpose to identify and potentially promote among communities a useful, accessible set of DSTs that could be tailored to their specific needs. We therefore defined the following criteria to provide the basis for our judgments of the DSTs:
• uncertainty: Does the DST incorporate uncertainty with respect to a changing climate, land use, demographics, or other key drivers of system performance?
• transferability: Can the DST be used for applications in places other than the one for which it was originally designed?
• U.S. application: Has the DST been implemented in the United States, or could the tool be easily transported to a U.S. context?
• usability and transparency: Could well-trained planners found in most communities use the DST with minimal outside intervention, or would consultants most likely be needed?
The summary tables in the appendix provide information on the DSTs that met one or more of these suitability criteria.
Categorization of Decision Support Tools
After reviewing many of these DSTs, we made the choice to categorize by function because of their wide range of applications and their varying levels of focus on decisionmaking. This categorization allows for comparisons across different models and tools that have similar goals but is not intended to imply any ranking of the DSTs, given the heterogeneity of their purposes and applications. We divided DSTs into seven broad functional categories:
• risk identification and assessment• vulnerability assessment• environmental assessment• emergency management• project evaluation• integrated decision support• process support.
Many of these DSTs have a goal of visualizing vulnerability and risk information but not necessarily tying that information into a decisionmaking process or an analysis of alternative courses of action. For all but the last category (process support), nearly all tools can visualize outputs through mapping functions. Process support is meant to capture formal ways of think-ing about the means by which decisions are teed up and made, as opposed to computational or modeling methods used to support decisionmaking.
We developed a summary table for each DST to compare its characteristics with those of tools with similar purposes. Our goal for developing these summary tables was to provide DHS with a high-level classification and overview of a wide range of DSTs. These summary tables address several key features:
• by whom, where, and why the tool was developed• the tool’s functionality and its means of executing it• the tool’s data requirements, user interactions, and outputs

Introduction 5
• the tool’s suitability for handling climate change and uncertainty, its portability, and its practical value to communities that would warrant a recommendation to DHS to take a closer look.
How This Report Is Organized
In Chapter Two, we lay out the basic definitions of resilience that have been used across dis-ciplines and the major themes that arise. Our approach compares and contrasts the literature on vulnerabilities and risk assessment with that on resilience. Drawing on these definitions, Chapter Three considers alternative conceptual frameworks for analysis that differ according to the definition or perspective that is being employed. Many of the frameworks for analysis of resilience and risk assessment have an associated approach for measuring resilience or indi-cators of resilience, and many reviews exist of indicators and metrics of resilience. In Chapter Four, we focus on how these metrics relate to the frameworks and how they succeed or fail to meet the frameworks’ goals. Chapter Five describes resilience in practice. Chapter Six summa-rizes our findings with respect to the seven categories of DSTs. Chapter Seven provides a series of case studies. The first set of case studies revolves around the use of resilience as a decision-making construct, and the second set focuses on the use of specific DSTs and how different communities have used them. Finally, Chapter Eight presents a summary of our findings and conclusions. The appendix includes a one-page summary table for each of the DSTs considered in this analysis.

7
CHAPTER TWO
Definitions of Terms
The hazard and risk communities show growing interest in moving away from traditional risk assessment and vulnerability and toward the concept of resilience. Although the frameworks and analytic methods for traditional risk assessment are fairly mature, this is not necessarily the case for resilience. As a recent National Academies report on the topic states (National Academies, 2012, p. 150), “no systematic or evidence-based assessment has been conducted to identify which strategies are most effective in fostering local collaborations to build commu-nity resilience.” One of the main obstacles that stands in the way of progress to increase com-munity resilience is the lack of an agreed-upon definition of resilience and a common frame-work for assessing community resilience. This chapter summarizes those definitions relevant to flood risk. Our overall approach to building a database of definitions was to develop a library of resources using scholarly databases and structured searches, as described in Chapter One. Additionally, we used a database of literature developed at RAND on community response to climate change. Using these two sets of resources, we first looked for relevant literature reviews. From this, we identified a catalog of resilience definitions in Norris et al., 2008, that provides a starting point. From the Norris et al. work, we performed forward and backward citation searches in Google Scholar and Web of Science to identify additional resources.
Foundations of Resilience
Prior to its application to understanding individual and community dynamics stemming from stresses on individuals, resilience has its foundations in material science, mathematics, and physics. For example, Gardner and Ashby, 1970, considers a system’s complexity as not only the number of components and connections but also the strength of the linkages. The main focus of resilience in these areas has been on equilibrium analysis (Bodin and Wiman, 2004). There are two main considerations within this realm: (1) the magnitude of a stressor, as mea-sured by the system’s movement from one equilibrium state to another, and (2) the length of time it takes for the system to move into homeostasis once the stressor has been removed. These ideas were first transferred out of the physical sciences to the biological sciences with Holling, 1973. Holling’s distinction from the physical sciences is that there is a clear difference between resilience and stability. In particular, although an ecological system might fluctuate or have cycles and not be stable, it can be resilient to outside stressors. The difference between the phys-ical and ecological science views of resilience lies in the difference between an equilibrium and a basin of attraction. Holling’s view suggests that the main concern of resilience is how large a stress can be applied to the system and the system still maintain its integrity. Because this is

8 Landscape Survey to Support Flood Apex National Flood Decision Support Toolbox
not an equilibrium analysis and there might be cycles within the system, there is less focus on time than in definitions that consider the movement back to homeostasis.
Norris et al., 2008, provides a broad overview of the definitions that have transitioned the use of resilience from the physical and biological sciences to the social sciences, and Alex-ander, 2013, provides an etymological analysis of resilience. Table 2.1 lists the definitions from
Table 2.1Representative Definitions of Resilience
SourceLevel of Analysis Definition
Gordon, 1978 Physical “This quality of being able to store strain energy and deflect elastically under a load without breaking” (p. 90).
Bodin and Wiman, 2004
Physical “[T]he speed with which a system returns to equilibrium after displacement, irrespective of the number of oscillations required” (abstract).
Holling, 1973 Ecological system
“[T]he persistence of relationships within a system . . . a measure of the ability of these systems to absorb changes of state variables, driving variables, and parameters, and still persist” (p. 17).
Waller, 2001 Ecological system
“[P]ositive adaptation in response to adversity . . . not the absence of vulnerability . . . not an inherent characteristic . . . not static” (pp. 292–293).
Klein, Nicholls, and Thomalla, 2003
Ecological system
“The ability of a system to return to a state of equilibrium after a temporary disturbance . . . the amount of disturbance a system can absorb and still remain within the same state or domain of attraction; the degree to which the system is capable of self-organization” (pp. 39, 40; see also Carpenter et al., 2001).
Longstaff, 2005 Ecological system
“[A]n individual’s, group’s, or organization’s ability to continue its existence, or to remain more or less stable, in the face of a surprise . . . . [R]esilience is found in systems that have high uncertainty . . . (. . . not locked into specific strategies) that have diverse resources” (pp. 27, 28).
Resilience Alliance, undated
Ecological system
“[T]he capacity of a system to absorb disturbance and reorganize while undergoing change so as to still retain essentially the same function, structure and feedbacks—and therefore the same identity.”
Adger, 2000 Social “[T]he ability of communities to withstand external shocks to their social infrastructure” (p. 361).
Bruneau et al., 2003 Social “[T]he ability of social units . . . to mitigate hazards, contain the effects of disasters when they occur, and carry out recovery activities in ways that minimize social disruption and mitigate the effects of future earthquakes.”
Godschalk, 2003 City “[A] sustainable network of physical systems and human communities . . . capable of managing extreme events . . . . During a disaster . . . must be able to survive and function under extreme stress” (p. 137).
Brown and Kulig, 1997
Community “[T]he ability to recover from or adjust easily to misfortune or sustained life stress” (p. 31, quoting Rhoads, 1994, p. 51).
Sonn and Fisher, 1998
Community “[M]ediating structures (e.g., schools, peer groups, family) . . and activity settings . . . moderate the impact of oppressive systems” (p. 460).
Paton and Johnston, 2001
Community “The capability to bounce back and to use physical and economic resources effectively to aid recovery following exposure to hazards”
Ganor and Ben-Lavy, 2003
Community “[T]he ability of individuals and communities to deal with a state of continuous, long term stress . . . the ability to find unknown inner strengths and resources in order to cope effectively . . . the ultimate measure of adaptation and flexibility” (p. 106).

Definitions of Terms 9
a variety of disciplines and perspectives. The main commonalities with all of the community-level definitions of resilience are threefold. First, they describe how large a disaster or stress a community can absorb or resist and still maintain functioning in the pre-event mind-set. Some authors have described this as resistance or absorption capacity. Second, they indicate how adaptive the system is to stresses while still maintaining function. From an ecological per-spective, this is related to the redundancies within the system that ensure that the system con-tinues to function, although perhaps at a reduced capacity. This has been called the adaptive capacity of the system. Third, they state how restorative the system is once productive capacity has been reduced—specifically, how quickly the system can get back to normal functioning, where normal might be different between pre-event and postevent conditions. This is termed the restorative capacity of the system. These ideas are implicitly laid out in Francis and Bekera, 2014, and explicitly in Rose, 2004a.
In the disaster literature, the concept of resilience appears to stem from three separate concepts: vulnerability, risk assessment, and adaptive capacity. All of these ideas are linked to a common goal of reducing a community’s risk to external forces (Lei et al., 2014). As Miller et al., 2010, and others have noted, resilience and vulnerability should be viewed as complements rather than at odds with each other. The main distinguishing characteristic between these two perspectives is that vulnerability appears to focus on the system, whereas resilience focuses on the actors within the system. Cutter, Barnes, et al., 2008, notes that federal agencies’ move from vulnerability to resilience can be thought of as a move to be a “more proactive and posi-tive expression of community engagement with natural hazards reduction” (p. 598). Beatley, 2012, also distinguishes resilience from mitigation in that resilience has a focus on creating adaptation and learning, as well as building the underlying capacity.
SourceLevel of Analysis Definition
Ahmed et al., 2004 Community “[D]evelop different material, physical, socio-political, socio-cultural and psychological resources . . . promote the safety of its residents . . . buffer against injury and violence risks” (pp. 387, 391)
Kimhi and Shamai, 2004
Community “[I]ndividuals’ sense of the ability of their own community to deal successfully with the ongoing political violence” (p. 442).
Coles and Buckle, 2004
Community “[T]he affected community participates fully in the recovery process and where it has the capacity, skills and knowledge to make its participation meaningful” (abstract).
B. Pfefferbaum et al., 2006
Community “[T]he ability of community members to take meaningful, deliberate, collective action to remedy the effect of a problem, including the ability to interpret the environment, intervene, and move on” (p. 349)
Masten, Best, and Garmezy, 1990
Individual “[T]he process of, capacity for, or outcome of successful adaptation despite challenging or threatening circumstances” (p. 348).
Egeland, Carlson, and Sroufe, 1993
Individual “The capacity for successful adaptation, positive functioning, or competence . . . despite high-risk status, chronic stress, or following prolonged or severe trauma”
Butler, Morland, and Leskin, 2007
Individual “Good adaptation under extenuating circumstances; a recovery trajectory that returns to baseline functioning following a challenge”
SOURCE: Norris et al., 2008.
Table 2.1—Continued

10 Landscape Survey to Support Flood Apex National Flood Decision Support Toolbox
Three capacities of resilience can be visualized with a fairly simple depiction of what tran-spires following a disruption for any definition of area, from neighborhood to metropolitan region, as seen in Figure 2.1. The absorptive capacity can be described as simply the inverse distance between A and B. As the absorptive capacity increases, a specific type or magnitude of a stressor will reduce the distance between A and B. That is, the system has roughly the same functionality as it did prior to the disruption. The idea underlying absorptive capacity is that, if a community has made an effort to reduce the impact of a particular stressor, it will have to recover from small impacts, and the functioning of the system remains intact. This can include hardening of infrastructure or placing structures out of harm’s way. This absorptive capacity refers to both a community’s ability to absorb and its ability to keep events from taking place. This can be accomplished by hardening of the infrastructure via dams and levees or softening the infrastructure through land use changes. Absorptive capacity includes mitigation of the impacts.
The adaptive capacity describes the initial movement or slope of the curve between times C and D. If a system has sufficient adaptive capacity, the slope will become steeper. Adap-tive capacity refers to the system’s ability to change activities by individuals and businesses from pre-event functioning to another functional state through a different allocation of resources.
Figure 2.1Community Functioning Following an Event
NOTE: Community functioning during a disruption without resilience investments (solid line) and with resilience investments (dash line). With the resilience investments, the community increases its absorptive capacity by the distance between E and B, increases the speed at which it recovers (restorative capacity) as seen by the differences in slope between the two lines, and recovers to a higher level once recovered (adaptive capacity).RAND RR1933-2.1
A
B
C DTime
Disruption
Pre-eventfunctioning
Recovery
Adaptation
Functioning
Post event functioning
E

Definitions of Terms 11
That is, the recipe for how to do things changes because the underlying inputs might have changed or new methods to achieve similar outcomes are now available and used.
The restorative capacity can be thought of as the time it takes to move the system from B to E, or how long the system takes to recover to a new “normal,” which might be better or worse than the previous “normal” in terms of functioning. Additionally, different impact and recovery paths might transpire because of different capacities. The dashed line shows a more resilient system than the solid line in that it has a small drop in functioning following the disruption and recovers more quickly and to a higher level of functioning following recovery. As the entire system becomes more resilient in each of these three dimensions, the system can absorb larger shocks, adapt more quickly to shocks, and recover more quickly to a sense of nor-malcy. These three pillars of resilience (absorptive, adaptive, and restorative capacities) form the basis for how we consider resilience frameworks in Chapter Three and the resilience metrics and indicators in Chapter Four.
Additionally, there has been some emphasis on the role that resilience plays in the com-pression of the time to postevent functioning (Olshansky, Hopkins, and Johnson, 2012). From a practical standpoint, much of the funding and opportunities for building resilience to the next event occur after an event. There might be a strong desire to bring a community back to pre-event functioning after an event, but investments made in resilience after an event, through a deliberative process that is forward-looking, can enhance recovery the next time an event takes place. One of the main goals of resilience planning is to increase the speed of the recovery process in a manner similar to that described in Holling, 1973. Similarly, Olshansky, Hopkins, and Johnson, 2012, suggests that some of the aspects of resilience-building—in par-ticular, building adaptive capacity and social capital—might occur more quickly during times of community stress than under normal circumstances because funding is available at these times but that individual communities do not necessarily seize these opportunities. That is, the stress of recovery might create the condition, whereby adaptive capacity is built more easily. Olshansky, Hopkins, and Johnson, 2012, also suggests that, in order to create additional resil-ience in postdisaster recovery, it might be more practical to be deliberate than to be speedy in the recovery process. This can increase the ability to take into account future disasters, as well as social justice issues that affect subgroups and individuals that might have differential func-tioning postrecovery. Thus, recovery periods can be ideal times to build resilience.
The process and choices that individual communities make to increase resilience will vary by community. These differences arise because of differential geographies, community preferences, and prior investments. But, Godschalk, 2003, points out, a network of resilience-focused communities can learn from one another, especially following adverse events. Thus, best practices are formed for planning for and investing in resilience as more communities focus on building their resilience.
Recently, the definition of resilience has become more nuanced to reflect decisionmaking processes at the local, state, and federal levels. In particular, Presidential Policy Directive 21 defines resilience as “the ability to prepare for and adapt to changing conditions and withstand and recover rapidly from disruptions” (Obama, 2013). This policy directive provides the defi-nition of resilience that all federal agencies must use. The policy directive fits within the three broad ideas that are emerging as a consensus within the social science literature. Increasingly, there has been a movement toward redefining resilience in terms of self-sufficiency. In this defi-nition, resilient communities are communities that are self-sufficient in that they do not rely on external support after an event takes place (see, for example, Hall, 2014; Anh et al., 2013; and

12 Landscape Survey to Support Flood Apex National Flood Decision Support Toolbox
Organisation for Economic Co-operation and Development, 2014). This idea of self-sufficiency might not be practical and might be considered more aspirational: Godschalk, 2003, modi-fies this to “without a large amount of assistance from outside the community” (p. 137). In addition, larger jurisdictions can be resilient even when smaller jurisdictions within them are not. A scale needs to be recognized when considering any analysis of resilience explicitly. The idea of community resilience depends on the community under consideration, whether it be a household, neighborhood, county, state, or nation.
Definition of Decision Support
It is important to define what we mean by the terms decision support and decision support tools in the context of flood risk assessment, mitigation, resilience, and response. The Panel on Strat-egies and Methods for Climate-Related Decision Support, 2009, stated, “Decision support—that is, organized efforts to produce, disseminate, and facilitate use of data and information in order to improve the quality and efficacy of climate-related decisions—is essential to effective decision-making responses to climate change” (p. 22). This idea of decisionmaking responses to climate change is in line with decisionmaking regarding flooding. The panel’s definition of high-quality decisions consists of five general principles: problem definition, clear objec-tives, alternatives linked to objectives, assessment of consequences, and confronting trade-offs. Drawing on the National Academy of Sciences definition as our standard, we use decision support here to mean a two-way process of communication between the producers of flood-relevant data and information and the users of this information in service to a process of ana-lyzing and choosing a course of action from among a set of alternatives.
Summary
There is a growing convergence of the definitions of resilience used in disaster and risk plan-ning and mitigation that centers on the three principal components of absorption, adaptation, and restoration capacities. These three capacities are very much in tune with the three phases of disasters: preparedness and mitigation, response, and recovery, commonly considered in the disaster risk reduction literature. Although a large segment of the literature still distinguishes between hazard mitigation and resilience, these two concepts should be thought of as comple-ments. Distinguishing between hazard mitigation and the recovery process, as many authors have, might remove some responses to risk that could be beneficial. In particular, if the focus is solely on what happens after a disaster occurs, there is a risk that strategies or actions to reduce vulnerabilities will be undervalued or ignored entirely. Alternatively, if the focus is solely on hazard mitigation, important capacities for the recovery process might be ignored. A less vul-nerable community is a more resilient community because it faces fewer disasters from which it needs to recover.

13
CHAPTER THREE
System-of-Systems Conceptual Frameworks for Resilience Decisionmaking
Conceptual frameworks provide a means to simplify complex ideas or systems down to their principal components. They provide a means of articulating how decisions affect a system through causal linkages. Alternative conceptual frameworks arise from differences in defini-tions of underlying concepts or different perspectives on the structure of the system. In this work, DHS communicated its interest in better understanding system-of-systems frameworks for conceptualizing resilience. A system-of-systems approach disaggregates a system into its constituent parts. The premise is that the functionality of the system as a whole is more than the sum of the functionalities of its subsystems by virtue of its interdependencies but that the independent subsystems can be usefully analyzed as part of the larger, more complex system.
We based our overall approach to building a library of resources for conceptual frame-works for resilience on searches of scholarly databases using the keywords resilience frame-work, conceptual framework resilience, resilience concept, and resilience modeling. Additionally, we supplemented with a database of literature developed at RAND on community response to climate change. Using these two sets of resources, we first looked for relevant literature reviews. We identified two sources that are widely cited in the literature and that provide a particularly useful starting point: Arup International Development, 2014, and NIST, 2015a. Using these two sources, we conducted forward and backward citation searches in Google Scholar and Web of Science to identify additional references. In this chapter, we discuss several of the major frameworks. We then present a discussion of how to structure decisions and understanding trade-offs that are necessary in any decisionmaking process.
Resilience Frameworks
Our approach to considering the different frameworks built on the work of Arup Interna-tional Development, 2014, that was used to develop the City Resilience Framework and City Resilience Index for the Rockefeller Foundation. Additionally, NIST, 2015a, provides an over-view of the components of community resilience using a system-of-systems approach. As Arup International Development explicitly writes, “systems based approaches align more closely with the concept of resilience, and the long-standing notion of cities as ‘systems of systems’” (p. 4). However, Arup International Development focuses on subsystems rather than on the system as a whole. This leaves the interdependencies that arise mostly unconsidered. In contrast, NIST explicitly has a chapter on dependencies across systems.
From the Arup International Development review and other sources, we identified a series of other frameworks that merit consideration. Most of the frameworks considered

14 Landscape Survey to Support Flood Apex National Flood Decision Support Toolbox
here approach disasters as problems of risk management within a system-of-systems frame-work combined with some form of either risk management or resilience. The major difference between each of the frameworks is the detail and connections between different systems and subsystems.
There are, generally, two approaches to initially segmenting a community into systems. First, some frameworks (e.g., Ziyath, Teo, and Goonetilleke, 2013) distinguish among eco-logical, economic, infrastructural, institutional, and social systems. Alternatively, some frame-works (e.g., Bruneau et al., 2003) distinguish between the different infrastructural systems: hospital, electrical, water, local emergency management, and other systems. As discussed in Homeland Security Studies and Analysis Institute, 2009, knowing the goals of the efforts to increase resilience are paramount in constructing a framework suitable for moving analysis and decisionmaking forward.
According to Arup International Development, 2014, resilient systems possess seven main qualities:
• reflective: Mechanisms continuously evolve.• robust: It anticipates potential failures; provisions to ensure failure are not disproportion-
ate to the cause.• redundant: It has spare capacity to accommodate disruption, pressure, and change.• flexible: The system can change, evolve, and adapt.• resourceful: People and institutions can rapidly find different ways to achieve their goals.• inclusive: The community is engaged.• integrated: Systems are integrated and aligned to promote consistency.
In a unifying framework that appears in Figure 3.1, Arup International Development, 2014, shows linkages across the various components of leadership and strategy, health and well-being, economy and society, and infrastructure and environment through the seven qualities of resilient cities.
According to the Rockefeller Foundation, there are five characteristics of resilient cities (Rodin, 2013):
• the capacity for robust feedback loops that sense and allow new options to be introduced quickly as conditions change
• the flexibility to change, and evolve, in the face of disaster• option for limited or “safe” failure, which prevents stressors from rippling across systems—
requiring islanding or denetworking at times• spare capacity, which ensures that there is a backup or alternative when a vital component
of a system fails• the ability for rapid rebound, to reestablish function quickly and avoid long-term disrup-
tions.
The Rockefeller and Arup International Development lists of characteristics are very much aligned. These characteristics provide a means of developing conceptual frameworks

System-of-Systems Conceptual Frameworks for Resilience Decisionmaking 15
and considering how disruptions affect different systems. Importantly, though, every context is different. Arup International Development, 2014, is explicit in saying,
Every city is unique. The way resilience manifests itself plays out differently in different places. The City Resilience Framework provides a lens through which the complexity of cities and the numerous factors that contribute to a city’s resilience can be understood. (p. 7)
Figure 3.1City Resilience Framework
Health & wellbeingLe
ader
ship
& strategy
Economy & so
cietyInfrastructure & ecosystems
Integrated
economy
Empo
wered
security & ru
le of
law
Effe
ctiv
e le
ader
ship
& co
mm
unity
sup
por t &
comm
unications
Effective safeguards to
of critical services
Diverse livelihoods
& fragility
Minimal human
development planning
Sustainable
stak
eh
olders
Comprehen
sive
& m
anag
emen
t
Colle
ctiv
e id
entit
y R
eliable mobility
human health & l ife
Effective provision
& employment
Reduced exposure
vulnerability
Flexible
RedundantRobust
Resourceful
Reflective
Inclusive
Integrated
SOURCE: Arup International Development, 2014. Used with permission.NOTE: Gray cells are categories and yellow ones are goals. The seven interior circle segments and their labels are qualities.RAND RR1933-3.1

16 Landscape Survey to Support Flood Apex National Flood Decision Support Toolbox
Norris et al., 2008, provides a useful starting point for discussing alternative frameworks that inherently consider resilience (see Figure 3.2). The distinguishing characteristic of the Norris et al. framework and that of Arup International Development is that, rather than focus-ing on the system properties, the frameworks focus on how different stressors propagate through the system and what effect they have on the functioning of the system. In essence, Norris et al. provide a high-level flow chart for how stressors affect the system. First, a stressor is applied to the system. This stressor can differ in severity, duration, and time to warning. Depending on the resilience of the system, either the stressor is absorbed (resisted) without creating a disrup-tion (crisis), although the system might be functioning in a slightly diminished capacity (poste-vent functioning adapted to the pre-event environment in Figure 3.2), or system functioning is disrupted (transient dysfunction in Figure 3.2). If the system has been disrupted, meaning that an impact drove the system from the pre-event environment, the system can traverse one of two paths: Either the system is functioning but at a significantly diminished capacity, using the pre-event techniques resulting in persistent dysfunction and vulnerability to future stress-ors, or the system adapts to an altered environment. This characterization of resilience shows that resilience enters not only in a system’s ability to absorb or resist a stressor during the time of the stressor but also through a system’s adaptation after a stressor has modified the system (although Norris et al., 2008, refers to resilience as only the adaptation component).
Figure 3.2Norris et al., 2008, Definition of Resilience
SOURCE: Norris et al., 2008, p. 130. Used with permission.NOTE: From Norris et al.: “Model of stress resistance and resilience over time: Resistance occurs when resources are suf�ciently robust, redundant, or rapid to buffer or counteract the immediate effects of the stressor such that no dysfunction occurs. Total resistance is hypothesized to be rare in the case of severe, enduring, or highly surprising events, making transient situational dysfunction the more likely and normative result in the immediate aftermath of disasters. Resilience occurs when resources are suf�ciently robust, redundant, or rapid to buffer or counteract the effects of the stressor such that a return to functioning, adapted to the altered environment, occurs. For human individuals and communities, this adaptation is manifest in wellness. Vulnerability occurs when resources were not suf�ciently robust, redundant, or rapid to create resistance or resilience, resulting in persistent dysfunction. The more severe, enduring, and surprising the stressor, the stronger the resources must be to create resistance or resilience.” The dotted boxes represent capacities that might be used to change the transition dynamics. Solid boxes represent states of the world and things forced on the system.RAND RR1933-3.2

System-of-Systems Conceptual Frameworks for Resilience Decisionmaking 17
Although the Norris et al., 2008, framework fails to account for the feedback once a dis-ruption has occurred whereby lack of one subsystem’s resilience might adversely affect other subsystems, it does takes into account the three major elements of resilience in its setup: adap-tation, absorption, and recovery. Additionally, Norris et al. does not recognize that poste-vent functioning from one event is the pre-event functioning for the next event. As discussed in Godschalk, 2003, as events occur in communities, learning takes places both within and across communities as to how better to prepare for and recover from events.
As an alternative to the basic framework developed in Norris et al., 2008, Rose, 2004b, develops a framework that is more detailed but has a similar structure, although it focuses primarily on the economic system. In it, Rose considers a disruption’s total regional economic impact without explicitly incorporating the broader social and natural environments (although the framework could easily be adapted to incorporate such considerations). In particular, Rose develops his framework with two questions in mind: (1) How can the economic system be modeled in order to predict potential impacts? And (2) what is the measure of resilience? The overarching theme within Rose’s framework is to minimize the total regional economic disruptions that are modeled using a general equilibrium model. The focus on the economic subsystem reveals a variety of different roles for adaptation that could be applied in a broader framework.
The key insight is that community resilience is a function of household resilience, firm resilience, and system resilience, but it is neither additive nor multiplicative. In particular, a mitigation strategy first affects an event’s direct impact (effects on individuals and firms) through changes in the probability that a disruption will take place and the changes in vul-nerability to the event. Vulnerability can be reduced if individuals and firms can adapt to a changed environment through various substitution patterns of inputs in production.1 The system’s flexibility and the availability of substitutes determines, in part, the inherent level of resilience of a system. Once this initial adaptation takes place, recovery begins through a reconstruction of capital that was lost to the disruption but also through alternative production functions that might be inherently more flexible and responsive to price signals that the system sends to firms and households.
When we view it in this fashion, we see mitigating activities that can affect the risk, the adaptability, and the recoverability of the individuals, firms, and system as a whole. Although Rose, 2004b, uses a different definition of resilience—namely, “the ability or capacity of a system to absorb or cushion against damage or loss” (p. 42)—the three major aspects of resil-ience are embedded in his ideas of inherent resilience and adaptive resilience. In this view, resilience is a property of the system that can be conceptualized at various spatial and organi-zational scales. Additionally, given the computable general equilibrium modeling tools used to model the system, linkages across sectors are also considered. For example, if infrastructure is damaged, it affects a variety of sectors and cascades through the system because of its effects on both upstream and downstream supply chains. Figure 3.3 provides a schematic of Rose’s approach.
Although it incorporates elements of the Rose, 2004b, and Norris et al., 2008, frame-works, Francis and Bekera, 2014, develops a framework focused on decisionmaking in the
1 Here, we refer to production not only in the usual firm sense but also in the household production of well-being.

18 Landscape Survey to Support Flood Apex National Flood Decision Support Toolbox
resilience context. There are five main components to the Francis and Bekera framework (see Figure 3.4):
1. system identification2. vulnerability analysis3. resilience objective-setting4. stakeholder engagement5. resilience capacities.
Two main pieces distinguish this framework from the other two previously considered. First, there is an explicit discussion of the objectives of increasing resilience (component 3). These objectives form the basis with which decisions can be compared. In addition, they help define the metrics that can be collected and used to judge whether an intervention has been successful. Second, stakeholder engagement is part of the framework (component 4), in that stakeholders provide input into both the identification of system and the objective-setting pro-cess. Stakeholders are not explicitly included in the other frameworks. Additionally, the three elements of resilience (absorptive, restorative, and adaptive capacities) are made explicit within the framework. These resilience capacities are embedded within the entire process. This frame-work incorporates risk governance explicitly through stakeholder engagement and objective-setting, as well as vulnerability analysis.
Figure 3.3Rose, 2004b, Framework
SOURCE: Rose, 2004b, p. 45. Used with permission.RAND RR1933-3.3
MicroeconomicAdaptive
Resilience(identify new
suppliers;conservation)
Meso & MicroAdaptive
Resilience(information
improvement;price controls)
InherentResilience
(inputsubstitution;
flexibletechnologies)
IndividualResilience
Enhancement
ReducedProbability
ofFailure
Direct(IndividualBusiness)Economic
Impact
InherentResilience
(priceadjustment;access toimports)
Mitigation
ImprovedResistance(reinforcedbuildings;zoning)
RecoveryManagement
MarketResilience
Enhancement
TotalRegionalEconomicImpacts
ReducedVulnerability

System-of-Systems Conceptual Frameworks for Resilience Decisionmaking 19
Another practical decisionmaking framework, Berke and Smith, 2009, provides ten prin-ciples of hazard mitigation plan quality that can guide resilience planning when moving from a conceptual idea to practical implementation:
• issue identification and vision• goals• fact base• policies• implementation• monitoring and evaluation• internal consistency• organization and presentation• interorganizational coordination• compliance.
The first six principles check for internal consistency, while the last four represent external consistency. Although both Francis and Bekera, 2014, and Berke and Smith, 2009, highlight goal-setting to make better decisions, the latter focuses on consistency across the community, as well as monitoring and evaluation toward the goals identified.
Unlike the previous frameworks, the framework that Bruneau et al., 2003, develops focuses on critical infrastructure systems as an organizational principle, as opposed to a struc-ture organized around social, economic, natural, and built systems (see Figure 3.5). The start-ing point for the Bruneau et al. analysis is that the four dimensions of resilience are technical (T), organizational (O), social (S), and economic (E). This framework places critical infrastruc-
Figure 3.4Francis and Bekera, 2014, Framework
SOURCE: Francis and Bekera, 2014, p. 95. Used with permission.RAND RR1933-3.4

20 Landscape Survey to Support Flood Apex National Flood Decision Support Toolbox
ture contributing to a community’s overall resilience through technical and organizational dimensions. The interdependencies within the critical infrastructure are key to understanding how events might cascade through the system that many of the other frameworks fail to recog-nize explicitly. These interdependencies are captured through the social and economic systems that overlay the critical infrastructure.
There are two large distinctions from the previous frameworks (see Figure 3.6). First, the individual infrastructure subsystems are analyzed. Then, these subsystem analyses are incor-porated into a larger, community-level analysis that considers the joint determination of the larger system. Second, the Bruneau et al., 2003, framework explicitly incorporates decision support as a subsystem within the larger system. Additionally, an inherently iterative pro-cess continues within the decision support subsystem to continually modify the system until an acceptable level of resilience is achieved. This iterative process, present in the Francis and Bekera, 2014, framework as well, provides a means to continually adapt the system to chang-ing environments.
Mayunga, 2007, proposes an alternative interpretation of resilience, different from the other approaches thus far discussed. Like others have with the economics of sustainability, he defines resilience in terms of capital rather than systems. Although there is an extensive litera-ture on social capital’s role in resilience, there is little to be found in the literature on the role of alternative forms of capital in resilience. Investments in resilience are investments in different capital stocks that combine together to increase resilience. This is the implicit view that most of
Figure 3.5Bruneau et al., 2003, Technical, Organizational, Social, and Economic Framework
SOURCE: Bruneau et al., 2003, p. 739. Used with permission.RAND RR1933-3.5
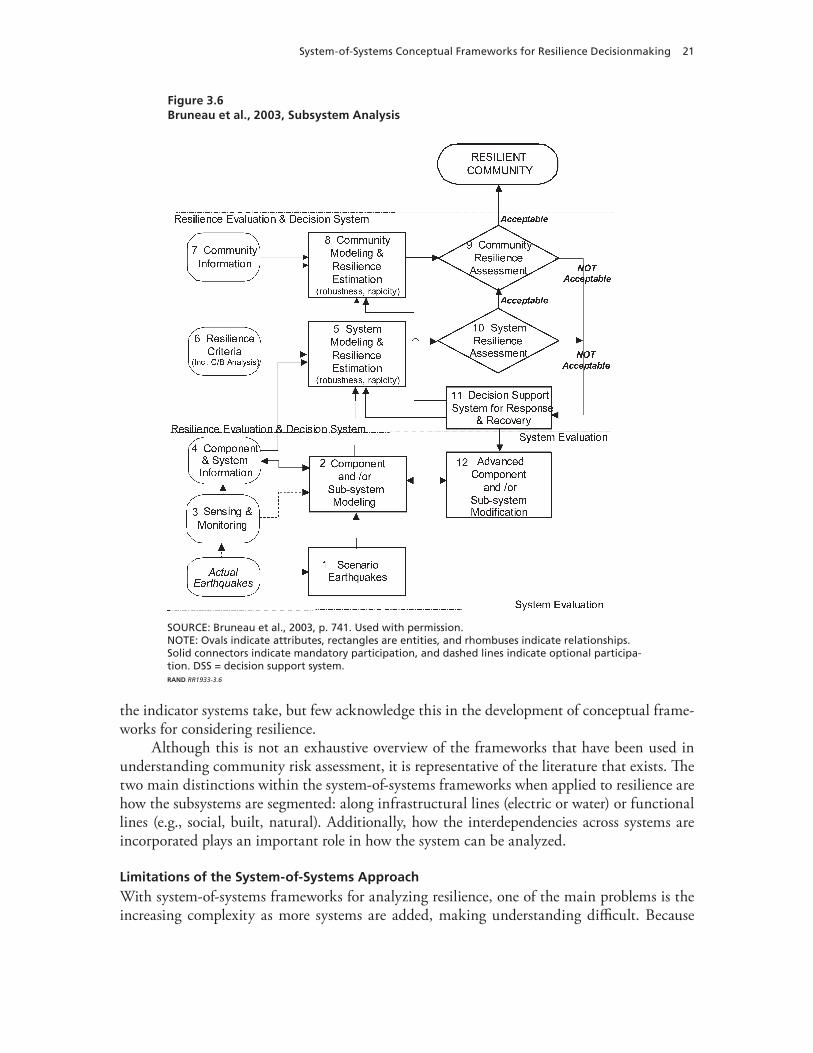
System-of-Systems Conceptual Frameworks for Resilience Decisionmaking 21
the indicator systems take, but few acknowledge this in the development of conceptual frame-works for considering resilience.
Although this is not an exhaustive overview of the frameworks that have been used in understanding community risk assessment, it is representative of the literature that exists. The two main distinctions within the system-of-systems frameworks when applied to resilience are how the subsystems are segmented: along infrastructural lines (electric or water) or functional lines (e.g., social, built, natural). Additionally, how the interdependencies across systems are incorporated plays an important role in how the system can be analyzed.
Limitations of the System-of-Systems Approach
With system-of-systems frameworks for analyzing resilience, one of the main problems is the increasing complexity as more systems are added, making understanding difficult. Because
Figure 3.6Bruneau et al., 2003, Subsystem Analysis
SOURCE: Bruneau et al., 2003, p. 741. Used with permission.NOTE: Ovals indicate attributes, rectangles are entities, and rhombuses indicate relationships. Solid connectors indicate mandatory participation, and dashed lines indicate optional participa-tion. DSS = decision support system.RAND RR1933-3.6

22 Landscape Survey to Support Flood Apex National Flood Decision Support Toolbox
every system affects every other system, some frameworks quickly become muddled when trying to move from a conceptual framework to actual implementation.
Additionally, Haimes, 2009, notes,
because of the probabilistic nature of threats, given the occurrence of a class of threat sce-narios, the outputs (consequences) are best represented with probability distribution func-tions. The resulting risks in terms of recovery time and composite costs can be calculated in a variety of ways . . . And ultimately, the tradeoffs among the various levels of risks and costs associated with each investment (e.g., through preparedness) in the system’s resilience can be evaluated. (p. 500)
In a manner similar to that of weak sustainability (Pearce and Atkinson, 1993), resilience represents an increase in total capital stock where the values of different capital stocks are inter-related, as opposed to separable, like they are in the sustainability literature. One could also view the use of absorptive, adaptive, and restorative capacities as simply a different segmenta-tion of capital stocks. Important substitution and complementary relationships affect resilience between and among capital stocks that arise from the interdependencies.
Structuring Decisions and Understanding Trade-Offs
An essential part of community-based decisionmaking is that, with multiple goals, inevitable trade-offs among these goals need to be considered when thinking about investments in resil-ience. Governance processes are the forum for making these kinds of trade-offs, with their attention to power structure. Given finite budgets that communities face, these trade-offs are one of the rationales for developing a DST to make sense of the complexities of investments in resilience. A good DST illuminates these trade-offs using credible analytics and metrics and thus provides a level playing field for all participants to engage in the decisionmaking process.
Interdependencies within a system can matter. To determine the total effect of invest-ments in resilience made in a subsystem, one needs to measure the direct value to that sub-system, as well as the indirect value of a reduction in the probability of disruption to other, interdependent systems. This idea is similar to that of Rose, 2004b, and others that have used input–output and computable general equilibrium–type models in which the interdependen-cies within the supply chain can be simulated. The NIST, 2015a, framework explicitly incor-porates interdependencies that affect the recovery process, for example, when systems are seg-mented by function, such as electrical, water, or wastewater, but not when segmentation of the system occurs across social, economic, and physical lines.
As such, DSTs in a resilience context should help illuminate the salient trade-offs that arise from competing options and be capable of representing the interdependencies within systems. As noted in the review of the resilience frameworks, the starting point is to frame the decision problem. Once the problem is formed, the analysis depends on data, analytic capabili-ties, and capacities.
A Framework for Uncertain Futures
One approach to decision structuring that has been used in a variety of instances to develop a well-posed question is the XLRM framework (Lempert, Groves, et al., 2006). The XLRM

System-of-Systems Conceptual Frameworks for Resilience Decisionmaking 23
framework provides a simple and intuitive approach to distinguishing among goals motivat-ing the decisions, uncertain and largely uncontrollable factors, factors that are within deci-sionmaker control, and the relationships among these factors. Thus, there are four main com-ponents to the XLRM framework: exogenous uncertain processes (X); levers, strategies, and policies that influence system performance (L); relationships, such as those captured in hydro-logic or other types of mathematical simulation models, between processes and levers (R); and metrics of performance that represent progress toward the goals driving the decisionmaking process (M). In this section, we explain these components briefly.
X: Uncertainties in Processes
Identifying the processes outside of decisionmakers’ control is an important step in character-izing the uncertainties that will affect the outcomes of plans and investments. Rising sea levels, increased storm intensity, and extended heat waves or droughts are all examples of physically based exogenous uncertainties that can affect outcomes and therefore should be incorporated into an analysis of options. Other uncertainties could include rates of population growth, growth in vulnerable assets, increasing exposure of assets to sea-level rise (SLR), or the avail-ability of future financing.
L: Levers
The levers are feasible actions or strategies that decisionmakers have available to reduce vul-nerabilities, increase resilience, or improve adaptive and other capacities. Decisionmakers can control levers, in contrast to the external uncertainties. The full range of levers might not be apparent at the beginning of a planning process, which is why a participatory adaptive plan-ning approach is advisable.2
M: Metrics of Performance
A community’s goals and objectives need to be explicit to develop the metrics of performance. From a community perspective, these might be set in law or regulations or determined by the decisionmakers. Decisionmakers use metrics associated with each goal to rank the desirability of various outcomes that the actions influence. In nearly all circumstances, communities have multiple goals. Whatever the number, objectives and the metrics associated with them must be explicitly stated at the outset of planning. For each objective, at least one indicator or metric for which data exist needs to be defined (Groves, Fischbach, et al., 2014).
R: Relationships
This might be the most difficult of all the components of the XLRM framework for the com-munity. The relationships link the choices of actions to the exogenous uncertain processes and the levers that influence the metrics. This is where simulation models of the underlying systems, perhaps reflecting elements of the resilience frameworks presented in the previous section, are usually applied. These relationships inform how actions can be represented in the models and associated with performance metrics under a range of future conditions.
The key to moving from this framework to analysis rests on the ability to identify mean-ingful relationships between the systems of interest and the external factors, such as climate change or insurance policies, that influence system outcomes. Frameworks and system models need not express all of the relationships but should focus on those with significant forward or
2 For further discussion of participatory planning, see Innes and Booher, 1999.
24 Landscape Survey to Support Flood Apex National Flood Decision Support Toolbox
backward linkage between and across different systems. The XLRM framework makes explicit that the performance metrics or indicators are a critical component in the development of a DST and that the indicators should be tied to goals rather than simply measuring innate prop-erties that are difficult to change on meaningful time scales of decisionmaking.
The Bennett, Cumming, and Peterson, 2005, Framework
Bennett, Cumming, and Peterson, 2005, provides a similar framework for scoping and identi-fying frameworks for use in management of complex, coupled social–ecological systems. The authors propose a four-step process that is similar to the XLRM framework but that might be useful in the development of DSTs:
1. Define the problem.2. Identify feedback.3. Develop the model.4. Perform a sensitivity analysis.
First, the problem needs to be assessed and identified. This can be accomplished by answering two questions: (1) What aspect of the system should be resilient? and (2) to what kinds of change would we like the system to be resilient? Second, after the problem is defined, the question is what important feedback processes need to be explored. These feedback pro-cesses can be identified by asking these questions: (1) What variables are changing? (2) what processes and drivers are producing these changes? and (3) what forces control the processes that are generating change? Answering these questions allows the key interdependencies to be identified. Third, once the key feedback has been identified, a system model can be developed that incorporates these key processes and feedback. Finally, the system model can help deci-sionmakers identify the systems or processes that most affect the system’s outcome. Identifying the key elements will allow decisionmakers to know which processes are most vulnerable to changes in the system and where additional resources might need to be spent.
Summary
In developing a conceptual framework for considering DSTs for flood risk management, the decision-framing approaches developed in Lempert, Groves, et al., 2006, and Bennett, Cumming, and Peterson, 2005, provide useful starting points to scope the problem. Both approaches require a conceptualization and explicit modeling of the system, paying attention to critical uncertainties and the relationships between model elements.
The system-of-systems literature provides different organizational approaches to develop-ing these relationships both within and between subsystems. These approaches are typically either through functional segmentation or infrastructural segmentation. Each framework sug-gests different types of analyses, as well as different views about the world. The Rose, 2004b, framework provides a useful starting point, if focused on only the economic system, for consid-ering the interactions that occur and how adaptation could be enhanced. Norris et al., 2008, provides an intuitive approach for how resilience can be explained across different stakehold-ers and how investments at different locations can enhance the outcome stemming from a disruption.

System-of-Systems Conceptual Frameworks for Resilience Decisionmaking 25
Although the conceptual frameworks reviewed in this chapter differ, there are common-alities: The resilience of the set of subsystems does not necessarily match the resilience of the entire system, and the interdependencies matter to the resilience of the whole. The key is find-ing a balance between detail and parsimony to understand how different investments and disruptions cascade through the entire system. The design of the framework should simplify its use and highlight where touch points between systems exist rather than focusing on all the potential relationships that can take place in a community.

27
CHAPTER FOUR
Indicators and Metric Systems
Many alternative indicator and metric systems have been used to measure resilience of com-munities. There are four main reasons that a community might want to develop or use a resil-ience indicator or metric system. First, such a system might help characterize the situation and bring awareness to the community of its shortcomings (Prior and Hagmann, 2014). Second, it might provide a means of developing baselines and assessing the community’s progress toward its goals. Third, it can provide a broader view of a system’s interdependencies and how the com-munity reacts to various stresses on the system (Linkov et al., 2014). Finally, metrics can be used in decision support and planning, but, as Cutter states,
While the arguments can be made on the importance of measuring resilience, the devil is always in the details. For example, there is no panacea or one size fits all tool to mea-sure resilience due to the range of actors, environments, purposes and disciplines involved. Instead, the landscape of resilience indicators is just as diverse as the systems, communities, or disasters that are studied. (Cutter, 2016, p. 743)
Indicator and metric systems are a bridge between the conceptual frameworks and the DSTs. In this chapter, we present an overview of the literature on resilience metrics, informed largely by the comprehensive review on the same subject in Cutter, 2016. In this chapter, we provide an overview of Cutter’s review, provide a discussion of other reviews and systems not considered in Cutter, and, finally, offer some concluding remarks about where we see potential problems with the literature, generally.
The Cutter, 2016, Review
Cutter, 2016, provides the most comprehensive overview of the wide variety of indicator sys-tems that have been used to date. The author considers 27 different approaches that have moved from conceptual systems to those being implemented by at least one community. Table 4.1 lists the systems she considers.
Cutter segmented these 27 systems along multiple different dimensions. First, she seg-mented them into three categories: indexes, scorecards, and tools. Indicators are often com-bined to create an index through statistical means and are designed to measure changes in the system over time or to compare different systems. Scorecards provide a means to evaluate progress toward a goal, usually through qualitative rather than quantitative scoring methods. Tools provide a means of collecting data on different indicators. Indexes and scorecards allow for simple summaries, whereas tools simply list the indicators. Additionally, Cutter considered

28 Landscape Survey to Support Flood Apex National Flood Decision Support Toolbox
Table 4.1Indicator Systems Reviewed in Cutter, 2016
Measure and Source Typea Spatial Unitb Focusc Domaind Methode
Atlas of Social Protection: Indicators of Resilience and Equity (World Bank, 2017)
Tool Country Baseline Foundational Top down
Baseline resilience indicator for communities (Cutter, Burton, and Emrich, 2010; Cutter, Ash, and Emrich, 2014)
Index U.S. counties Baseline Characteristics Top down
Communities Advancing Resilience Toolkit (R. Pfefferbaum, Pfefferbaum, and Van Horn, 2011; R. Pfefferbaum, Pfefferbaum, Van Horn, et al., 2013)
Tool Community Baseline Capacities Bottom up
Conjoint Community Resilience Assessment Measure (Cohen et al., 2013)
Tool Community Baseline Capacities Bottom up
Community Disaster Resilience Index (Peacock, 2010)
Index U.S. coastal counties
Baseline Characteristics Top down
Coastal Resilience Index (Sempier et al., 2010)
Scorecard Community Baseline Capacities Bottom up
Community-Based Resilience Analysis (Way, 2014)
Tool Community Baseline Capacities and characteristics
Bottom up
Community Resilience System (Community and Regional Resilience Institute, 2013; White et al., 2015)
Tool Community Baseline Capacities Bottom up
Community Resilience index (Sherrieb, Norris, and Galea, 2010)
Index Community Baseline Characteristics Top down
Climate Resilience Evaluation and Awareness Tool (U.S. Environmental Protection Agency [EPA], 2013)
Tool Infrastructure Asset Characteristics Top down
UK Department for International Development resilience (Twigg, 2009)
Tool Country Baseline Characteristics Bottom up
Food and Agriculture Organization of the United Nations livelihoods (Alinovi et al., 2010)
Index Community Baseline Characteristics Bottom up
Financial System Resilience (Berry, Ryan-Collins, and Greenham, 2015)
Index Infrastructure Asset Characteristics Top down
FM Global Resilience Index (Oxford Metrica, 2015)
Index Infrastructure Asset Characteristics Top down
NIST Resilience Planning Guide (NIST, 2015b)
Tool Infrastructure Baseline Characteristics Top down
Oxfam GB Resilience Index (Hughes and Bushell, 2013)
Index Community Baseline Capacity Bottom up
Population and Demographics, Environmental/Ecosystem, Organized Governmental Services, Physical Infrastructure, Lifestyle and Community Competence, Economic Development, and Social–Cultural Capital (Renschler et al., 2010)
Tool Community Baseline Capacity Top down
Resilience Capacity Index (Pendall, Foster, and Cowell, 2010)
Index U.S. metropolitan
areas
Baseline Characteristics Top down
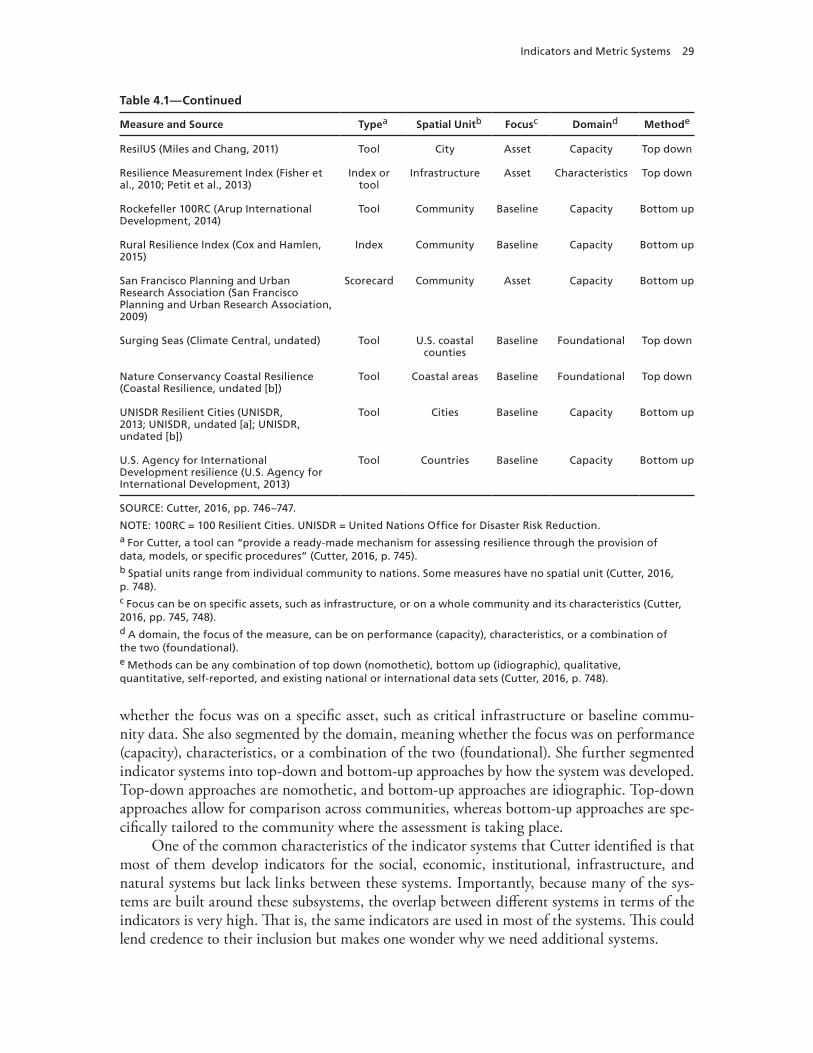
Indicators and Metric Systems 29
whether the focus was on a specific asset, such as critical infrastructure or baseline commu-nity data. She also segmented by the domain, meaning whether the focus was on performance (capacity), characteristics, or a combination of the two (foundational). She further segmented indicator systems into top-down and bottom-up approaches by how the system was developed. Top-down approaches are nomothetic, and bottom-up approaches are idiographic. Top-down approaches allow for comparison across communities, whereas bottom-up approaches are spe-cifically tailored to the community where the assessment is taking place.
One of the common characteristics of the indicator systems that Cutter identified is that most of them develop indicators for the social, economic, institutional, infrastructure, and natural systems but lack links between these systems. Importantly, because many of the sys-tems are built around these subsystems, the overlap between different systems in terms of the indicators is very high. That is, the same indicators are used in most of the systems. This could lend credence to their inclusion but makes one wonder why we need additional systems.
Measure and Source Typea Spatial Unitb Focusc Domaind Methode
ResilUS (Miles and Chang, 2011) Tool City Asset Capacity Top down
Resilience Measurement Index (Fisher et al., 2010; Petit et al., 2013)
Index or tool
Infrastructure Asset Characteristics Top down
Rockefeller 100RC (Arup International Development, 2014)
Tool Community Baseline Capacity Bottom up
Rural Resilience Index (Cox and Hamlen, 2015)
Index Community Baseline Capacity Bottom up
San Francisco Planning and Urban Research Association (San Francisco Planning and Urban Research Association, 2009)
Scorecard Community Asset Capacity Bottom up
Surging Seas (Climate Central, undated) Tool U.S. coastal counties
Baseline Foundational Top down
Nature Conservancy Coastal Resilience (Coastal Resilience, undated [b])
Tool Coastal areas Baseline Foundational Top down
UNISDR Resilient Cities (UNISDR, 2013; UNISDR, undated [a]; UNISDR, undated [b])
Tool Cities Baseline Capacity Bottom up
U.S. Agency for International Development resilience (U.S. Agency for International Development, 2013)
Tool Countries Baseline Capacity Bottom up
SOURCE: Cutter, 2016, pp. 746–747.
NOTE: 100RC = 100 Resilient Cities. UNISDR = United Nations Office for Disaster Risk Reduction.a For Cutter, a tool can “provide a ready-made mechanism for assessing resilience through the provision of data, models, or specific procedures” (Cutter, 2016, p. 745).b Spatial units range from individual community to nations. Some measures have no spatial unit (Cutter, 2016, p. 748).c Focus can be on specific assets, such as infrastructure, or on a whole community and its characteristics (Cutter, 2016, pp. 745, 748).d A domain, the focus of the measure, can be on performance (capacity), characteristics, or a combination of the two (foundational).e Methods can be any combination of top down (nomothetic), bottom up (idiographic), qualitative, quantitative, self-reported, and existing national or international data sets (Cutter, 2016, p. 748).
Table 4.1—Continued

30 Landscape Survey to Support Flood Apex National Flood Decision Support Toolbox
Indicator Systems Not Considered in Cutter, 2016
In addition to Cutter, 2016, there are several other reviews, including Brooks, Aure, and Whiteside, 2014; Link et al., 2015; and Winderl, 2014. Brooks, Aure, and Whiteside, 2014, notes that indicator systems are themselves conceptual frameworks. The focus of Link et al., 2015, is on developing a national-level resilience scorecard, and it reviews many of the same sets of systems as Cutter, 2016. The Winderl, 2014, findings, similar to those in Cutter, 2016, focus on measuring the resilience of subsystems rather than of the larger community level. In work sponsored by DHS, Homeland Security Systems Engineering and Development Insti-tute, 2016, catalogs indicators of resilience that have been used in many applications and seg-ments them according to the economic, social, infrastructure, institutional, community capi-tal, environmental, educational, and health systems that Cutter, 2016, identifies.
In addition to the indicator systems discussed in the reviews above, different resilience indexes have also been considered. Rose, 2007, considers an economic system’s resilience to shocks. Rather than focus on the individual systems that make up an economy, Rose focused on the aggregate outcomes of production. Focusing on production allows the supply chain networks within an economy to be captured in a relatively straightforward manner. Rose cal-culated the difference between how the system would react with and without accounting for interdependencies. Importantly, this metric was developed in conjunction with the framework discussed in Chapter Three.1 This approach has been used to estimate the impact of water dis-tribution system disruptions (Rose and Liao, 2005), electric power disruptions from terrorist attacks (Rose, Oladosu, and Liao, 2007), and an analysis of the ARkStorm scenario (Wing, Rose, and Wein, 2016). This method could be further expanded by adding components to a general equilibrium model, incorporating environmental outcomes, and using models of the built environment to estimate capital impacts.
Critique of the Indicator Literature
As discussed previously, one of the main problems that we see with the current systems of indicators, with the exception of Rose, 2004b, is that they do not take into consideration the interdependencies in the system. Although they might follow a conceptual framework in iden-tifying the subsystems that are important, the relationships between the subsystems do not appear in the indicator system.
One of the overriding themes of the indicator systems is that, if the subsystems are resil-ient, the system is resilient. This is a significant assumption and one that misses a point often made in the resilience literature that there are cascading consequences across the system. This is a flaw also found in the vulnerability literature that measures a system’s vulnerability in the absence of considerations about exposure and hazards. A community might be vulnerable when measured using the Social Vulnerability Index (Cutter, Boruff, and Shirley, 2003), but, if it does not face any hazards, is it really vulnerable? Similarly, one subsystem might not be very resilient, but it might also not be an integral part of the community, so it does not affect
1 Rose’s index of economic resilience is not an index in the usual sense of summing weighted indicators but uses the struc-ture of the system to determine how the system would react under alternative scenarios such that the index of economic resilience can be compared across communities and across time.

Indicators and Metric Systems 31
the community’s overall resilience to a great extent. We must view the resilience of a system as more than the sum of its parts. Through better understanding of the interdependencies and metrics associated with those interdependencies, a more thorough understanding of a commu-nity’s resilience can be had. The indicator systems and indexes need to better incorporate the frameworks that they are trying to measure rather than simply focus on the components that make up the system.
Importantly, none of the indicator systems has ever been validated with respect to the resilience property. That is, we have not identified a study that estimates whether communi-ties that have higher measured resilience indexes are actually more resilient following an event. The variables that are included in indicator systems have theoretical justification but might not explain resilience in practice. There has been considerable discussion about using the recovery process from Hurricanes Katrina and Sandy as natural experiments to compare across com-munities, but little to no work has been done to see whether communities that have higher levels of resilience based on any resilience metric recover more quickly or to a higher level of functioning.
Finally, with respect to indexes, the weights assigned to different components of the index are arbitrary. In most cases, the variables are normalized so that they have the same scale and then simply added or averaged. This assumes that each of the variables measured contributes equally to resilience, which might not be the case. As a result, resilience indexes should be interpreted with caution.
The Rose approach for measuring economic resilience incorporates the system inter-dependencies in the construction of the measure. This approach could be expanded to the greater system and would appropriately assign weights to the various components of resilience as well as, potentially, nonlinear interactions that might occur. For example, Gao, Barzel, and Barabási, 2016, develops a method to collapse many dimensional complex networks into a single summary metric of resilience. Rather than relying on simple averaging or factor analysis to provide weights, the system’s actual characteristics and network could be used to form an index of resilience.

33
CHAPTER FIVE
Resilience in Practice
This chapter reviews some contemporary efforts to promote risk reduction and community resilience by developing and applying management strategies and policies that are consistent with the frameworks and indicators discussed in the previous chapters. Conceptual frame-works and reliable indicators are essential for progress in building community resilience, but they are useful only if communities can implement them. Translating concepts from resilience science and engineering into positive, community-level changes can be remarkably challenging for a host of reasons. Although agreement on the importance of funding reconstruction after a disaster is often obtainable, it is harder to develop political consensus toward building resil-ience to disasters that have not yet happened. It is also easier to raise money and commit funds toward well-defined projects with tangible results. This biases predisaster spending toward discrete infrastructure projects and programs targeted at specific systems while deemphasiz-ing cross-linking projects, social-capital investments, and other forms of community-building.
The Challenge of Translating Ideas into Practice
Communication of resilience ideas is central to translating academic work to actionable plan-ning decisions. The ideas expressed in the frameworks surveyed above, although coherent and useful, are necessarily abstract. Turning these ideas into strategies and policies that communi-ties can actually adopt requires a different kind of thinking and communication. Although some of the required innovation can be expected to come directly from communities interact-ing with the published frameworks, adoption is easier when concrete, applicable steps can be identified along with criteria for evaluating their utility so that communities can examine and adopt particular measures that might aid resilience in the face of disasters.
The National Research Council took an important step toward moving resilience science into the realm of application with its 2012 report Disaster Resilience: A National Imperative (National Academies, 2012). The National Academies process brought together a collection of leading academics and practitioners to assess the state of resilience science, provide an outline of how these ideas can be applied, and underscore the importance of applying them. Their
34 Landscape Survey to Support Flood Apex National Flood Decision Support Toolbox
report called for a paradigm shift toward a new national “culture of resilience” that includes components of
• taking responsibility for disaster risk• addressing the challenge of establishing the core value of resilience in communities,
including the use of disaster-loss data to foster long-term commitments to enhancing resilience
• developing and deploying tools or metrics for monitoring progress toward resilience• building local, community capacity because decisions and the ultimate resilience of a
community are driven from the bottom up• understanding the landscape of government policies and practices to help communities
increase resilience• identifying and communicating the roles and responsibilities of communities and all
levels of government in building resilience.
This new paradigm builds on contemporary ideas about social capital and differs mark-edly from traditional approaches to risk management that focus on hardening individual system elements with respect to various hazards and funding recovery after a disaster takes place.
The National Academies report underscores the importance of good information on his-torical patterns of disaster for decisionmaking and points out the lack of a consistent national repository for all-hazard event and loss data. Relatedly, the report discusses the lack of con-sistent metrics and indicators of resilience—particularly as they relate to social capital and preparedness. It goes on to recommend a resilience scorecard approach to help communities develop a systematic understanding of the risks that they face and the areas in which they can improve their resilience. This score could be developed using one of the conceptual frameworks.
The report further recognizes the diversity of communities, in terms of both hazards and capabilities, and suggests both bottom-up and top-down approaches to building resilience. To promote bottom-up capacity-building, it offers concrete steps that can be taken to build com-munity coalitions of leaders from the public and private sectors. Examples of universally appli-cable, bottom-up resilience-building measures include the following:
• engaging the whole community in disaster policymaking and planning• linking public and private infrastructure performance and interests to resilience goals• improving public and private infrastructure and essential services (such as health and
education)• communicating risks, connecting community networks, and promoting a culture of resil-
ience• organizing communities, neighborhoods, and families to prepare for disasters• adopting sound land-use planning practices• adopting and enforcing building codes and standards appropriate to existing hazards.
Although it emphasizes the importance of community-based decisionmaking and invest-ment, the National Academies report also recognizes the importance of top-down policies beginning at the national level. Given the complex nature of governance in the United States, communities are subject to policies that are funded, implemented, and enforced by various

Resilience in Practice 35
levels of government and by firms, such as utilities and telecommunication companies. Even within the federal government, responsibilities are sufficiently distributed that fully centralized rulemaking for resilience is impractical. The report notes, however, that the federal and state governments can and should play major roles in communicating and coordinating resilience-oriented policies by “infusing the principles of resilience into all the routine functions of the government at all levels and through a national vision” (p. 7).
Top-Down Implementation Efforts
The National Academies report has given rise to a host of efforts at the national and interna-tional scales to define and implement disaster resilience using both top-down and bottom-up approaches. Recent efforts are summarized in a report from the Coastal Hazards Center of DHS titled Building Blocks for a National Resilience Assessment (Link et al., 2015). That report focuses on emerging efforts to implement the resilience scorecard approach recommended in the National Academies report and, in doing so, surveys the major systematic efforts aimed at building disaster resilience.
Many of the surveyed programs are oriented toward improving the resilience of the built environment, particularly buildings and critical infrastructure features. This includes efforts by DHS under its High Performance and Integrated Design Resilience Program that includes (1) publications aimed at strengthening buildings and critical infrastructure; (2) databases and tools to aid robust design of structures; (3) building and infrastructure protection workshops designed for architects, engineers, building operators, and government officials; and (4) a col-lection of flyers and webinars aimed at disseminating resilience information to relevant parties.
NIST is also active in this area with its Community Resilience Program and Community Resilience Panel for Buildings and Infrastructure Systems. NIST initiated this panel “to enable collaborative efforts needed to provide practical support and guidance to communities as they plan and carry out efforts to improve resilience, which may span decades” (NIST, 2015c). The panel will also be tasked with informing updates to NIST’s Community Resilience Planning Guide for Buildings and Infrastructure Systems (NIST, 2015b).
FEMA is involved with various resilience implementation activities, and risk reduction is one of the five major priorities identified in the FEMA Strategic Plan 2014–2018 (FEMA, 2014). Within this priority, the strategic plan identifies several key objectives:
• Provide credible and actionable data and tools to support risk-informed decisionmaking.• Incentivize and facilitate investments to manage current and future risk.• Enhance the effectiveness, financial stability, and affordability of the National Flood
Insurance Program (NFIP).
The first objective is critical to ensure that, to inform their investment decisions, local decisionmakers have as much information as possible about the risks they face. This effort is explicitly intended to incorporate future risks influenced by climate change. The second objec-tive is aimed at ensuring that individuals and communities have a clear stake in managing their risk. This includes the promotion of policy frameworks, financing structures, and account-ability systems that support risk-informed investment, as well as better coordination of hazard mitigation efforts and improved, risk-informed building codes and standards. The third objec-
36 Landscape Survey to Support Flood Apex National Flood Decision Support Toolbox
tive, to enhance the NFIP, aims both to ensure the financial viability of this program (which has been an essential element of national flood resilience since its inception) and to improve the accuracy of the flood risk assessments that underlie the program, thus providing clearer risk information to policyholders and incentivizing better building practices and siting decisions. These objectives are pursued through a host of programs and publications, including planning documents, such as the National Disaster Recovery Framework (FEMA, 2011a). This framework is intended to help inform state and local recovery planning. Although various other federal programs aim more and less directly at developing disaster resilience, these programs are par-ticularly comprehensive and implementation oriented.
Bottom-Up Resilience Implementation Efforts
Although federal programs generally have a top-down, coordinating emphasis, nongovern-mental organizations (NGOs) have tended to lead bottom-up efforts. Although many organi-zations contribute to resilience-building in various (sometimes indirect) ways, both the Ameri-can Red Cross and the Rockefeller Foundation have large programs that are specifically aimed at increasing disaster resilience starting at the community level. These programs tend to focus on social capital and community-building efforts, rather than on built environment and infra-structure improvements.
In the past decade, the American Red Cross, as an affiliate of the International Federation of Red Cross and Red Crescent Societies (IFRC), has begun to shift its emphasis from being almost exclusively on humanitarian disaster preparedness and response toward risk reduction, disaster resilience, and community-building (IFRC, 2014). Much of the loss of life in the 2010 Haiti earthquake can be attributed to a major lack of resilience, both in terms of building prac-tices and in terms of poverty, governance, and societal capabilities. This has led the ARC to emphasize resilience-building in its longer-term response to this devastating disaster.
At the same time, the American Red Cross has increased its emphasis on preparedness and resilience in the United States. In 2012, the Red Cross undertook major community resil-ience pilot efforts in New Orleans, Mississippi, Miami, San Francisco, and Denver, followed by similar programs in smaller localities, such as Onondaga County, New York. Although the Red Cross convened these pilot efforts, they were designed to be led by community stakehold-ers. Richard Reed, Red Cross vice president for preparedness and resilience strategy, character-ized the evolution as being from traditional preparedness centered on preparedness education, health and safety classes, information, and programming with a focus on individuals and households in which the Red Cross informs and instructs, to community preparedness and resilience centered on community engagement for preparedness and resilience across the disas-ter cycle with a focus on individuals, organizations, and communities in which the Red Cross facilitates community interaction around preparedness and resilience (Reed, 2012).
Also in the NGO realm, the Rockefeller Foundation has become a leader in bottom-up, community-based resilience-building. Although resilience is a theme that runs through mul-tiple Rockefeller Foundation programs, its flagship is the 100RC program (100RC, undated). This program approaches resilience very broadly, supporting programs that build resilience not only to shocks and disasters, such as earthquakes, fires, and floods, but also to stresses, such as high unemployment, inadequate public transportation, endemic violence, and chronic

Resilience in Practice 37
resource shortages. The emphasis here is not on buildings and infrastructure, but rather on human capital and capability-building.
This program includes the development of frameworks and indicators but is fundamen-tally centered on funding and supporting a chief resilience officer (CRO) in each of 100 cities located throughout the world. The CRO generally reports directly to the city’s chief executive and is responsible for using a resilience-oriented lens to coordinate the activities of the various governmental, nonprofit, commercial, and cultural entities that make up the city. The CRO is tasked with bringing together a wide range of stakeholders to develop a city resilience strategy that identifies the city’s specific resilience challenges, particular capabilities, gaps between the two, and cooperative strategies for closing those gaps. In this way, the program, although cen-trally funded, proceeds in a strongly bottom-up fashion.
The 100RC program is also designed to produce a network of cities that communicate regularly with regard to resilience challenges and approaches, thus allowing lessons learned to propagate in a peer-to-peer manner. 100RC directly promotes connections between the par-ticipating cities but ultimately aims to see the approaches and programs developed within the network be adopted as common practice in a much larger number of cities and other contexts.
Although the 100RC program has global scope, it has a strong presence in the United States. Its first two cohorts of cities (composed of 33 and 42 cities, respectively) include 15 U.S. cities, including Berkeley, Boston, Boulder, Chicago, Dallas, El Paso, Los Angeles, New Orleans, New York City, Norfolk, Oakland, Pittsburgh, San Francisco, St. Louis, and Tulsa. Of these, seven have identified flooding as one of their major risks.
Because of the bottom-up, site-specific, and often uncoordinated nature of local resilience-building efforts, it is not possible to characterize the nature of resilience implementation across all U.S. cities. A growing number of cities have addressed resilience in one form or another and generated public plans for disaster-related resilience-building. We can get a sense of what is being done by sampling what has been done in several major cities.
Hybrid Approach
Although most of the discussion within communities could be characterized as bottom up, they take, in practice, a hybrid approach that responds to local needs and state and federal incentives. The higher-level incentives play a crucial role in how resilience is ultimately imple-mented; it does not occur in isolation, although different communities will develop plans for resilience in different manners (Burby and May, 2009). In this hybrid approach, the higher level (federal or state) provides the incentives to invest in resilience rather than the command to invest in specific areas. The decision on what to invest in is largely driven by local conditions and needs. As an example of the distinction, commanding individual communities to remove and ban development in the floodplain would be the top-down approach, whereas requiring plans that limit floodplain losses contingent on future aid would be the hybrid approach. It is not the specific actions that matter at the top but the overall increase in resilience and thus reduction in potential future aid.
Project Impact, developed by FEMA, could be seen as a hybrid approach to resilience, although it was considered a mitigation strategy. The goal of Project Impact was to encourage communities to develop mitigation strategies on their own rather than have them imposed by

38 Landscape Survey to Support Flood Apex National Flood Decision Support Toolbox
FEMA while providing some funding for these communities to develop a strategy. There are four main phases for Project Impact:
• building community partnerships• identifying hazard and community vulnerability• prioritizing hazard risk reduction actions• communicating success.
Project Impact focuses on methods to develop public–private partnerships in order to bring about more-successful implementation of mitigation strategies. Although this project has been discontinued, many of the ideas can be seen in the Rockefeller approach to 100RC.
Urban Resilience Planning
To understand how the ideas and theory of resilience have been brought to bear on practice and planning, we provide a series of case studies from communities from around the United States. Our choice of case studies was driven by suggestions from the research review board for Flood Apex, as well as our own effort to identify communities that had significant, publicly available documentation to understand how resilience thinking drove community efforts.
Resilience in Los Angeles
Los Angeles, as part of its planning process and as a participant in the Rockefeller Foundation 100RC program, examined its various risks and found that the city is more vulnerable to earth-quakes than many residents had thought. Although San Francisco has seen genuinely large earthquakes since it became a large city, Los Angeles has experienced more modest quakes, and the city’s buildings and infrastructure would not fare well in the kind of large earthquake that is consistent with the city’s position relative to the San Andreas Fault. Although the plan-ning process identified numerous things that the city could be doing to reduce its vulnerability, addressing all of them would be prohibitively expensive and disruptive. The city has instead adopted a strategy of urban disaster resilience that focuses on preserving or quickly recovering systems that are essential to its functioning (Cardno, 2015).
Although Los Angeles building codes are designed to prevent major loss of life in the immediate aftermath of a major quake, many of the city’s buildings would be damaged beyond use—leading to sustained disruption of urban function. This is being addressed both by requir-ing upgrades to types of buildings that are deemed unsafe and by a voluntary seismic rating system that will add value to strongly built buildings by certifying them as being more resistant to seismic damage than building codes require (Mayoral Seismic Safety Task Force, 2014). The long-term aim of this program is to ensure that the city has enough usable buildings in the days and months after a major earthquake that it can continue to function until repairs can be made to more–seriously damaged structures.
The city also identified water supply as a critical vulnerability, given that virtually all of the city’s water comes from the western side of the San Andreas Fault and all of the aqueducts that carry that water might be severed in a single event, leaving the city with a six-month supply of water, at best, while repairs might take considerably longer. Weaknesses were also found in other parts of the water supply system that would be critical for both firefighting in the imme-
Resilience in Practice 39
diate aftermath of a quake and for the city’s functioning in the postdisaster period. Addressing these problems requires money and engineering but also close cooperation and coordination between the many agencies and private firms that are involved in one way or another with the Los Angeles water supply. The report also identifies ways to fortify telecommunications and, to a lesser degree, electricity infrastructure that would be a critical component of recovery opera-tions (Mayoral Seismic Safety Task Force, 2014).
It is worth underscoring here that the priorities identified in this report represented a sig-nificant shift from previous risk-management planning and that this shift resulted from exam-ining the city’s risk profile through the lens of urban disaster resilience.
Resilience in New York City
New York City has also engaged in extensive formal disaster planning and mitigation efforts. New York prepared its New York City Natural Hazard Mitigation Plan in 2009 (New York City Office of Emergency Management, 2009) that was designed to be updated every five years. Hurricane Sandy, in October 2012, with its extensive flooding damage in various parts of the city and region, prompted the development of a long-term, comprehensive climate resil-ience plan, PlaNYC: A Stronger, More Resilient New York (New York City Special Initiative for Rebuilding and Resiliency, 2013), which provides recommendations for rebuilding com-munities and increasing the resilience of infrastructure and buildings. These documents were brought together in The City of New York Hazard Mitigation Plan 2014 (New York City Office of Emergency Management, New York City Department of City Planning, and Mayor’s Office of Long-Term Planning and Sustainability, 2014), which updates the 2009 plan in various ways and expands its scope to include nonnatural hazards and to address the effects that cli-mate change could have on the hazard environment.
The preparation and update of this plan was heavily process oriented and was guided by the FEMA Local Mitigation Plan Review Guide (FEMA, 2011b)—involving a core group of 13 New York City agencies and a total of 41 agencies, public authorities, nonprofit orga-nizations, and private utility providers. The process also involved an extensive community involvement strategy that reached out to “neighboring communities, community board offices, borough presidents’ offices, the private sector, professional organizations, regional partners, non-profit organizations, and academics” (New York City Office of Emergency Management, New York City Department of City Planning, and Mayor’s Office of Long-Term Planning and Sustainability, 2014, p. 11). This process produced a large number of public meetings, partner meetings, webinars, and similar engagements, as well as extensive public comment on the plan draft. Chapter Two of that final report documents the planning process, including its commu-nity engagement efforts, in some detail.
The report identifies multiple classes of hazards and assesses the city’s vulnerability to each. Assessed hazards include coastal erosion; coastal storms; disease outbreaks; drought; earthquakes; extreme temperatures; flooding; severe weather (thunderstorms, tornadoes, and windstorms); wildfires; winter storms; chemical, biological, radiological, and nuclear threats; cyber threats; and infrastructure failures.
The planning process went on to solicit proposed mitigation actions from the 41 Miti-gation Planning Council member organizations and proceeded to categorize these proposed actions according to categories, goals, and objectives developed earlier in the planning process. This resulted in 662 proposed mitigation actions that were then scored and evaluated using the FEMA-developed social, technical, administrative, political, legal, economic, and envi-

40 Landscape Survey to Support Flood Apex National Flood Decision Support Toolbox
ronmental review criteria, along with additional criteria concerning project timelines, project costs, and the number of planning objectives that the project met. The resulting prioritization serves as a basis for objective decisions for project funding given the individual costs and ben-efits of each proposed project.
The plan also identified a large set of capabilities that the city possesses that are relevant for implementing mitigation measures. These are grouped into categories of planning and regulatory, administrative and technical, financial, and education and outreach.
The New York City hazard mitigation planning process is remarkable with regard to both its scope and its inclusive process. These features are both in line with current best practices for resilience-building as identified by the National Academies study (National Academies, 2012). High-scoring projects spanned a wide range of project types, from infrastructure improvement to education and outreach.
Resilience in Seattle
Seattle, Washington, along with King County, of which it is a major part, is a smaller city that has also engaged in formal disaster resilience planning. King County has produced an interlocking set of planning documents in the past five years, including the King County Stra-tegic Plan 2010–2014: Working Together for One King County (King County, 2010), 2012 King County Comprehensive Plan (King County, 2012b), 2013 King County Flood Hazard Manage-ment Plan Update (King County, 2013), and Strategic Climate Action Plan (King County, 2012a). The City of Seattle has produced some relevant planning documents, including Com-prehensive Emergency Management Plan: Base Plan and ESF Annexes (Seattle Office of Emer-gency Management, 2015a) and City of Seattle Disaster Recovery Framework (Seattle Office of Emergency Management, 2015b), which focuses on integrated community response to disas-ters. The Seattle postdisaster recovery framework emphasizes the difference between initial disaster response, which focuses on command and control issues and is often government-led, and disaster recovery, which is an inherently bottom-up, collective project that includes gov-ernment, commercial, nonprofit, and individual efforts to put the community back together.
Because the plan is tightly focused on recovery rather than risk assessment and mitiga-tion, it gives considerable attention to community organization and social-capital consider-ations. For example, the plan lays out a decisionmaking process involving a mayor-appointed recovery director who will be advised by and work with a community recovery task force com-posed of a broad representation of key stakeholders in the city. The recovery director would serve as a central hub for government, nonprofit, and commercial efforts but would also have access to a nonprofit entity empowered to receive and distribute recovery funds from private and foundation sources.
An earlier version of this plan (CollinsWoerman, 2013) also emphasizes the importance of building multiscale resilience into centralized systems, such as water, power, and telecommu-nications, as well as other features of the built environment. Multiscale resilience is a concept taken from ecology and encourages design for variability in conditions, rather than designing for an assumed case based on historical conditions. Although some of these ideas appear in the final plan and find limited expression in the city’s Seattle All-Hazards Mitigation Plan (Seattle Office of Emergency Management, 2009), these ideas play a much smaller role than they did in in the initial document.

Resilience in Practice 41
Resilience in Boulder
The city of Boulder, Colorado, with a population of around 100,000, is considerably smaller than the other cities examined here, yet it has also engaged in comprehensive disaster plan-ning and has done so with emphasis on disaster resilience in part because of its participation in the 100RC program discussed above. Along with City of Boulder Colorado Multi-Hazard Mitigation Plan: Comprehensive Update (City of Boulder Department of Public Works, 2012), All-Hazards Recovery Plan (Boulder Office of Emergency Management, 2013) is an impor-tant part of this effort. This report presents a plan for disaster recovery based on “the Whole Community concept . . . All aspects of a community (e.g., volunteer, faith and community-based organizations; other non-governmental organizations [NGOs]; the private sector, and the public) . . . work together” (Boulder Office of Emergency Management, 2013, p. 27). This approach is intended to develop “collective, mutually supporting local capabilities to withstand the potential initial impacts of these incidents, respond quickly, and recover . . . in a way that sustains or improves the community’s overall well-being” (Boulder Office of Emergency Man-agement, 2013, p. 27).
The plan centralizes coordination during the recovery phase with a recovery coordinator, who is part of the staff of the Boulder Office of Emergency Management. As the city transi-tions from the response to the recovery phase, this recovery coordinator works with others to establish a recovery coordination group that is composed of city and county agencies, as well as community stakeholders. The report details a set of recovery support functions at the regional, state, and federal levels and works out a set of considerations and assumptions about each of these functions for short-, intermediate-, and long-term recovery.
This base recovery plan outlines a multi-entity organizational structure that can be made relevant in a wide range of disasters. Additional plan annexes provide specific details on recov-ering from particular sorts of natural, technological, and human-caused disasters.
Each of these communities provides a means to understanding how different communi-ties have approached the ideas of resilience within their planning process. In particular, there is no “right” way to incorporate resilience. Although many communities are embracing the ideas of resilience, especially through the work of 100RC, it is too early to tell whether this lens for planning has had a measurable impact on outcomes.
Implementation of Resilience Measures by the Private Sector
Utilities have also been a major area of application for resilience science and provide a good example of public–private partnership. Water, electricity, and telecommunications are essen-tial infrastructure elements, and the resilience of these systems is intimately tied to the resil-ience of the communities that they serve. Although government regulates these utilities closely, they have considerable autonomy in determining their technology investments and operational strategies. Electric utilities in particular have been facing a set of changes in the nature of their grids and the technologies available for managing them that have led to improved resilience in their systems and promise greater gains as resilience-oriented technologies continue to be adopted.
Smart metering technology, although initially installed to improve load management and offer more-flexible billing, has allowed utilities to respond more quickly and efficiently to out-

42 Landscape Survey to Support Flood Apex National Flood Decision Support Toolbox
ages after storms. Hurricane Sandy recovery, for example, was significantly enhanced in areas where smart metering technology had been installed (Lacey, 2014).
Smart meters are one of a set of emerging technologies for electric grid management that promise improved reliability and resilience in a changing grid. Other important technolo-gies include Supervisory Control and Data Acquisition tools, geographic information system (GIS)–based data management systems, outage management systems, distribution manage-ment systems, mobile workforce management systems, and modern business analytics tools. These are being integrated into overarching advanced distribution management systems, which promise to make the grid both more resilient in the face of disasters and better able to handle the distributed generation loads that come with many new renewable energy supply systems, such as residential photovoltaic and wind power (Lacey, 2014).
Utilities are also increasingly experimenting with microgrid technology. Microgrids are local electric grids that contain both energy sources and loads and can operate as part of the larger grid system or independently. Microgrids can be a key element of community resilience because they can provide power for crucial facilities and infrastructure elements even when other parts of the distribution grid are out of service (Office of Electricity Delivery and Energy Reliability, undated). Although the distribution sections of a traditional electric grid have lim-ited or no redundancy and subject large areas to power disruption due to a single point of fail-ure, microgrids (and nested microgrids) allow a system with distributed production to work as a system of systems, with the inherent robustness and resilience that such systems embody.
The recent Department of Energy Partnership for Energy Sector Climate Resilience pro-vides an example of how individual companies are working together to create a more resil-ient energy infrastructure through cooperation with each other, as well as the Department of Energy.
Summary
In this chapter, we reviewed a range of programs aimed at putting the ideas of flood disaster resilience into practice in communities. We have grouped these programs into three broad categories: top-down, bottom-up, and location-specific. Generally, top-down programs are led by federal and state agencies and affiliated organizations, including the National Academies, DHS, NIST, and FEMA (which is part of DHS). The bottom-up efforts are largely led by NGOs and often have international scope. Major parties here include the American Red Cross and the Rockefeller Foundation.
Actual implementation of these programs frequently takes place at the city level, with many cities and localities benefiting simultaneously from both top-down and bottom-up pro-grams. To get a sense of how these programs are blending, we have briefly reviewed disaster resilience efforts in the large cities of Los Angeles and New York, the mid-sized city of Seattle (and its surrounding county), and the relatively small city of Boulder, Colorado.
We have also explored the resilience-related actions that have come out of the electric util-ity industry, for two reasons. First, electricity is essential to the functioning and recovery of a modern city; second, it is illustrative of a class of cross-jurisdiction networked infrastructure systems, including telecommunications and water supply, that are often owned and operated by private-sector firms to supply goods and services that function as public goods in times of crisis.
Resilience in Practice 43
In looking across these programs and places, we note that resilience ideas have been applied in very different ways. Although all of these places have used the ideas of resilience across the full spectrum of its usage in this report, the emphasis has varied enormously. Los Angeles has used the ideas of resilience to focus infrastructure investment on systems that would be critical to recovering from its greatest hazards. New York placed major emphasis on involving a large and diverse collection of stakeholders to identify and prioritize infrastruc-ture investments. Although The City of New York Hazard Mitigation Plan 2014 does not place large emphasis on social capital–building, it does seem that the inclusive planning process that has produced the plan has this as an aim to at least some degree. Seattle and Boulder, in contrast, focus directly on community-building and on designing structures that will maxi-mize the utility of existing community organizations in a disaster situation. It is plausible that such efforts are more practical in smaller cities, but a formal statement about the relationship between city size and the effectiveness of social capital–building efforts for resilience is beyond the scope of this study.
Electric utilities (such as telecommunication providers and private water companies) pre-sent a different set of challenges because they represent large, highly integrated networks that are critical to virtually all aspects of community resilience but are not necessarily government run (although they are government regulated to one degree or another). Communities can increase their ability to function without grid power but have limited means to increase the resilience of the grid itself. Utilities and regulators are finding ways to work together to produce a more resilient electrical system, and it is essential that this cooperation continue. Utilities need to be incentivized to provide a level of resilience beyond what might be profitable in the short term while being given the freedom to innovate and make use of emerging technologies to provide the efficient, robust, and resilient grid that society needs.
There might be greater gains from taking a hybrid approach to resilience whereby the federal and state governments provide the incentives for communities to act within their local contexts. This would allow communities to develop on their own under the guiding principles and incentives provided by a higher level that might be more concerned with a regional focus rather than individual community. At present, perverse incentives might exist that stem from the way that funding occurs in such programs as the Hazard Mitigation Grant Program and the NFIP. The incentives that communities face provide an understanding of why communi-ties make the decisions that they do.


45
CHAPTER SIX
Decision Support Tools
In this chapter, we catalog DSTs that have been developed and implemented specifically for decisionmaking for flood risk management, not the entire universe of DSTs. We categorize DSTs based on their function. For each category, we highlight one or more tools that might be of particular interest to DHS, based on that tool’s functionality and ease in applying it in other jurisdictions.
Approach to Identifying Decision Support Tools
DST refers to a range of analytical, computer-, or web-based products that might relate to some or all of the following functionality: environmental, vulnerability, damage, or risk assessment; evaluation of alternative projects, policies, or strategies; analysis of trade-offs across multiple community or regional objectives; and risk communication. Nearly every DST has a visualiza-tion component, typically in the form of a GIS mapping application, but sometimes they are capable of providing other graphical output. Most DSTs include one or more of these func-tions; very few include all of them.
Search and Screening Process
We searched the literature for models and tools whose authors or organizations identified them as DSTs for flood risk management. Our search included the following tools: Google Search, Google Scholar, Web of Science, and JSTOR. We sought to cast a wide net of self-identified methods and products and therefore used the following search terms: decision support flood, decision support tools flood, flood tools, decision support system flood, and flood decision making. Our initial search resulted in a list of approximately 100 models and tools.
In screening the many self-identified DSTs that we found in our search of the literature, we applied several criteria to reduce the number to a manageable set and focus our efforts on those that had the potential of mattering most to the Flood Apex program:
• field application: Was the DST implemented in the field at least once?• documentation: Does any website or readily available English-language source document
explain the DST’s essential features?• validation: Has the DST been subjected to any type of validation process that provides
evidence that model results under historical conditions bear a close relationship to actual field observations, excluding those used in model calibration?

46 Landscape Survey to Support Flood Apex National Flood Decision Support Toolbox
The last criterion of validation proved to be insurmountable for all of the DSTs that turned up in our search, so our screening relied on the first two—less stringent—screening criteria.
We consciously made a decision not to include any H&H model by itself in the absence of a well-documented field application that illustrated its use in real-world conditions. Addition-ally, we do not include benefit–cost, cost-effectiveness, and other economic concepts and tools. We view these methods of comparative analysis of individual projects in contrast to a higher-level community-based and multiobjective approach to decisionmaking. For this reason, we have not included FEMA’s Benefit–Cost Analysis tool in the analysis: We have taken a com-munity perspective rather than a parcel-level view. Similarly, we have not included expert elici-tation and Expert Choice as tools because these are methods for gathering data (although they do support the decisionmaking process). We have excluded data-gathering tools as well. This includes the FEMA flood maps and outputs from H&H models. We take these as inputs to the models considered here.
Criteria for Evaluating Decision Support Tools
DSTs can serve many purposes, as our broad definition of the term implies. What matters in this survey of DSTs is their relevance to the DHS Flood Apex program and its intended pur-pose to identify and potentially promote among communities a useful, accessible set of DSTs that could be tailored to their specific needs. We therefore defined the following criteria to provide the basis for our judgments of the DSTs:
• uncertainty: Does the DST incorporate uncertainty with respect to a changing climate, land use, demographics, or other key drivers of system performance?
• transferability: Can the DST be used for applications in other places than the one for which it was originally designed?
• U.S. application: Has the DST been implemented in the United States, or could the tool be easily transported to a U.S. context?
• usability and transparency: Could well-trained planners found in most communities use the DST with minimal outside intervention, or would consultants most likely be needed?
Categorization of Decision Support Tools
After reviewing many of these DSTs, we made the choice to categorize by function because of their wide range of applications and their varying focus on decisionmaking. This categori-zation allows comparisons across different models and tools that have similar goals but is not intended to imply any ranking of the DSTs, given the heterogeneity of their purposes and applications. Many of these DSTs have a more modest goal of visualizing vulnerability and risk information but not necessarily tying that information into a decisionmaking process or an analysis of alternative courses of action. For all but the last category (process support), nearly all tools have the capability of visualizing outputs through mapping functions. Process support is meant to capture formal ways of thinking about the means by which decisions are teed up and made, as opposed to computational or modeling methods used to support decisionmaking.
Our goal in segmenting the DSTs by function is to show the breadth of tools that deci-sionmakers have used. Because each of the tools has actually been implemented and used in a decisionmaking process rather than simply an academic exercise, the tools in each of these categories has a place in the decisionmaking process.
Decision Support Tools 47
We divided DSTs into seven broad functional categories:
• risk identification and assessment• vulnerability assessment• environmental assessment• emergency management• project evaluation• integrated decision support• process support.
We developed a summary table for each DST to compare its characteristics with those of tools with similar purposes. Our goal for developing these summary tables was to provide DHS with some detail while still being able to quickly digest a wide range of DSTs. These summary tables address several key features:
• by whom, where, and why the tool was developed• the tool’s functionality and its means of executing it• data requirements, user interactions, and outputs of the tool• the tool’s suitability for handling climate change and uncertainty, its portability, and its
practical value to communities that would warrant a recommendation to DHS to take a closer look.
These summary tables are available in the appendix.
Risk Identification and Assessment
Risk assessment tools are designed to translate inundation and flood depth maps into esti-mated damage. The prototypical example of such a tool is Hazards–United States (Hazus) Multi-Hazard (MH) (FEMA, 2017a). An “out-of-the-box” Hazus level 1 analysis uses default inventories of existing structures and coarse inundation maps to produce estimates of damage. Many of the risk assessment tools use either Hazus directly or a similar damage estimator but substitute detailed structural inventories and finer inundation maps that might either be spe-cific to an event or represent an average 100-year event. These are commonly referred to as level 2 Hazus analyses, in contrast to those using the default data sets.
Most importantly, Hazus analyses are based on historical data to generate future flood events. Hazus and its variants are mostly web-based tools that provide visual information about inundation and flood depth, as well as estimated damage, by either census regions or individual parcels. Most of these tools do not allow the user to change the terms of analysis by disasters considered. They use historical data to predict the future. These tools, however, can be coupled with hydrologic models to estimate the damage from different storm events. They do not include the option to alter parameters or other features of the hydrologic model in ways that would enable evaluation of structural interventions. Other than Hazus, the most commonly used risk assessment tool is MIKE FLOOD, which is already part of DHI’s flood toolbox (DHI MATLAB Toolbox). Table 6.1 provides a summary of risk assessment tools.
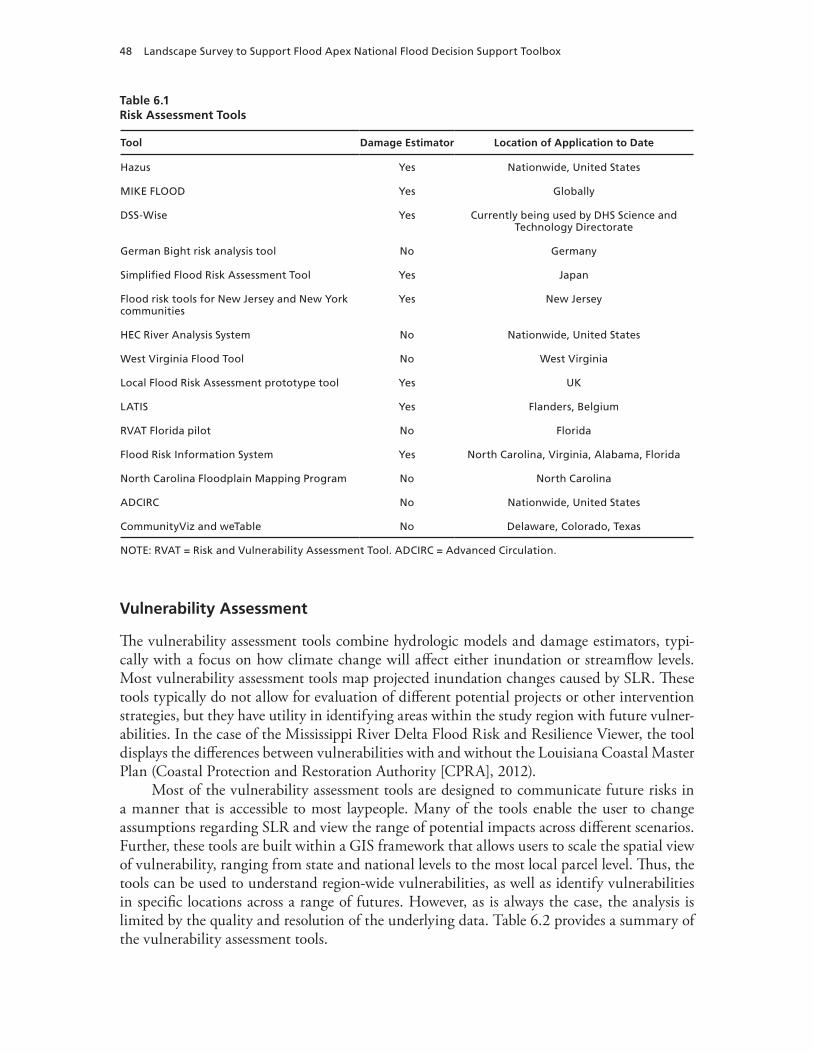
48 Landscape Survey to Support Flood Apex National Flood Decision Support Toolbox
Vulnerability Assessment
The vulnerability assessment tools combine hydrologic models and damage estimators, typi-cally with a focus on how climate change will affect either inundation or streamflow levels. Most vulnerability assessment tools map projected inundation changes caused by SLR. These tools typically do not allow for evaluation of different potential projects or other intervention strategies, but they have utility in identifying areas within the study region with future vulner-abilities. In the case of the Mississippi River Delta Flood Risk and Resilience Viewer, the tool displays the differences between vulnerabilities with and without the Louisiana Coastal Master Plan (Coastal Protection and Restoration Authority [CPRA], 2012).
Most of the vulnerability assessment tools are designed to communicate future risks in a manner that is accessible to most laypeople. Many of the tools enable the user to change assumptions regarding SLR and view the range of potential impacts across different scenarios. Further, these tools are built within a GIS framework that allows users to scale the spatial view of vulnerability, ranging from state and national levels to the most local parcel level. Thus, the tools can be used to understand region-wide vulnerabilities, as well as identify vulnerabilities in specific locations across a range of futures. However, as is always the case, the analysis is limited by the quality and resolution of the underlying data. Table 6.2 provides a summary of the vulnerability assessment tools.
Table 6.1Risk Assessment Tools
Tool Damage Estimator Location of Application to Date
Hazus Yes Nationwide, United States
MIKE FLOOD Yes Globally
DSS-Wise Yes Currently being used by DHS Science and Technology Directorate
German Bight risk analysis tool No Germany
Simplified Flood Risk Assessment Tool Yes Japan
Flood risk tools for New Jersey and New York communities
Yes New Jersey
HEC River Analysis System No Nationwide, United States
West Virginia Flood Tool No West Virginia
Local Flood Risk Assessment prototype tool Yes UK
LATIS Yes Flanders, Belgium
RVAT Florida pilot No Florida
Flood Risk Information System Yes North Carolina, Virginia, Alabama, Florida
North Carolina Floodplain Mapping Program No North Carolina
ADCIRC No Nationwide, United States
CommunityViz and weTable No Delaware, Colorado, Texas
NOTE: RVAT = Risk and Vulnerability Assessment Tool. ADCIRC = Advanced Circulation.

Decision Support Tools 49
Environmental Assessment
Although many risk analysis tools focus on flooding’s impact on people, infrastructure, and other physical assets, other tools focus on its effects on natural systems and ecosystem services. Human and natural systems are intimately linked, so this distinction in categorization is a matter of emphasis and framing. These tools are often not well-integrated with DSTs intended to directly support infrastructure investment choices. However, understanding the interplay between infrastructure and ecosystem services is critical to building flood-resilient systems, and the absence of more of these tools in an integrated modeling framework is noteworthy.
It is also worth noting that the relationship between flooding and ecosystem services (particularly those provided by wetlands) goes both ways. Although flooding can have an impact on wetlands (particularly frequent saltwater flooding caused by SLR), wetlands also can reduce impacts of flooding. Indeed, modeling of flood dynamics to include feedbacks between inundation levels and patterns and wetlands is essential for evaluating the mitigation benefits of green infrastructure.
Our survey found five tools that typify work in this area, summarized in Table 6.3. The Natural Capital Project’s InVEST (Natural Capital Project, undated) provides a modular structure to better understand the broad set of ecosystem services affected by different invest-ments. The tool set currently has 18 different ecosystem service models across terrestrial, fresh-water, marine, and coastal ecosystems, as well as a set of tools to help process data and visualize outcomes.
Table 6.2Summary of Vulnerability Assessment Tools
Tool Source of Vulnerability Location of Application to Date
Mississippi River Delta Flood Risk and Resilience Viewer
Flood risk under the Louisiana Coastal Master Plan
Louisiana
New Jersey Flood Mapper SLR and flooding New Jersey
NOAA SLR Viewer SLR U.S. coastal areas
NOAA SLR planning tool SLR New York, post–Hurricane Sandy
NOAA Coastal Flood Exposure Mapper
SLR East Coast and Gulf of Mexico
STORMTOOLS SLR Rhode Island
Risk Assessment for Systems Planning Decision Support
Scenarios based on downscaled climate modeling
Europe
NOTE: NOAA = National Oceanic and Atmospheric Administration.

50 Landscape Survey to Support Flood Apex National Flood Decision Support Toolbox
Emergency Management
Effective emergency management in anticipation of and during flooding events is another essential part of flood resilience. Although this was not a focus of this study, we include two examples of tools that are specifically designed to support decisions related to flood emergency management planning and operations. Such tools often address specific types of flooding and specific management needs.
HURREVAC, for example, is a product of the National Hurricane Program that is administered by FEMA, the U.S. Army Corps of Engineers (USACE), and the NOAA National Hurricane Center. It is a storm-tracking tool and DST that helps to identify evacua-tion decision times and the potential for significant storm effects, such as wind and storm surge. HURREVAC translates live-forecast track and wind extent information into interactive maps and reports designed to help officials make decisions about evacuation timing and urgency. Although it is undoubtedly useful for supporting decisions related to hurricane-related flood-ing and wind damage, this tool is not designed to do advance planning or to deal with floods that are not caused by hurricanes.
Open Flood Risk Map (Institute of Geography, 2016), in contrast, is a more general-purpose tool that has been developed in Europe to support flood-related emergency response planning. It has been used in various European settings and in Nepal. It is designed to fuse official flood maps with open-source data, including the OpenStreetMap (OSM) database to identify critical infrastructure at risk and to develop alternative plans and routing to ensure the delivery of essential services in a flood situation.
There is also a well-developed industry of emergency management software systems that provide more-comprehensive disaster planning and emergency response decision support. These systems include flooding, but as only one part of the full range of potential disasters and emergencies. These tools are widely used by state and local governments as a routine part of their emergency preparedness; for example, HURREVAC was used to forecast evacuation needs from Hurricane Matthew. This class of tools was beyond the scope of the current study. A summary of the emergency management tools appears in Table 6.4.
Table 6.3Environmental Assessment Tools
Tool Output Location of Application to Date
InVEST Modular structure, broad ecosystem service coverage, limited flood-
specific capability
Global, requiring user data; user base unclear
Nature Conservancy Coastal Resilience
Coastal habitat, coastal defense North America, Caribbean
LUCI Land use–relevant indicators; good flood feedbacks
England, Wales, Scotland, New Zealand
NHDES WRAM Wetland restoration New Hampshire
Watershed Resources Registry Limited feedback to flood risk Maryland, no specific user
NOTE: LUCI = Land Utilisation and Capability Indicator. NHDES = New Hampshire Department of Environmental Services. WRAM = Wetland Restoration Assessment Model.

Decision Support Tools 51
Project Evaluation Tools
Tools in this category are similar in technical specification to the risk and vulnerability assess-ment tools but allow for the consideration of alternative structural and nonstructural inter-ventions within a hydrologic model. These project evaluation tools allow the consideration of different projects and how much and where damage occurs. They combine detailed hydrologic models that allow changes from the current situation together with either climate scenarios or simulations of synthetic storms to better understand the impacts of specific projects or suites of projects. Most importantly, when multiple projects are considered, these tools allow a better understanding of the trade-offs that the decisionmakers would be making rather than simply considering a world without action, as with the risk and vulnerability assessment tools.
The Coastal Louisiana Risk Assessment Model (CLARA) uses a bathtub hydrologic model at the census-block level that allows for evaluation of flood elevations under different assumptions about storm intensity and frequency and different flood risk reduction strategies (Fischbach et al., 2012). Damage is estimated at the census-block level, and uncertainty is handled through Monte Carlo simulation of storm frequency, intensity, and duration. Finally, an infrastructure failure module is incorporated to account for the chance that hurricane pro-tection structures could fail under some storm conditions.
In contrast, Autocase from Impact Infrastructure provides a project-oriented model struc-ture. Autocase provides a direct link between a project and building design within AutoCAD to estimate the return on investment in mitigation through a sustainability lens. This allows the consideration of not only infrastructure projects but also building designs in early stages of development when detailed construction parameters are still unknown. Autocase also allows decisionmakers to better understand and consider the effects that some ecosystem services for
Table 6.4Emergency Management Tools
Tool Objective Location of Application to Date
HURREVAC Estimate the warning time for evacuation from hurricane.
Coastal United States
Open Flood Risk Map Find a route during times of inundation, with a focus on critical infrastructure.
Europe, Nepal
Delft-FEWS Forecast flooding in real time. England, Wales
Quanzhou flood prevention information system
Forecast flooding in real time China
Corps Water Management System Predict the effects of reservoir release.
35 different districts and division of USACE
Colorado’s DSSs Forecast flooding in real time. Colorado
Flood Integrated DSS Forecast flooding in real time. Melbourne, Australia
Munsan City, Korea, DSS Determine routes to shelters and critical infrastructure during flooding.
Munsan City, Korea
NOTE: Delft-FEWS = Deltares Flood Early Warning System.

52 Landscape Survey to Support Flood Apex National Flood Decision Support Toolbox
green infrastructure projects can have on sustainability. This project-centric approach might be appealing to communities or individuals who have known project concepts but still lack details.
The distinguishing characteristic of project evaluation tools is that they allow changes to the hydrologic model through interventions aimed at flood damage mitigation. CLARA and Autocase are specifically designed to allow the consideration of alternative projects or project parameters. Many of the modeling approaches in the risk assessment category could be modi-fied to evaluate projects. Table 6.5 lists project evaluation tools.
Integrated Decision Support Tools
Tools in this class go beyond flood risk estimation and damage assessment by providing com-prehensive flood-related planning and decision support. These tools encompass hydrologic modeling, visualization, and damage estimation within the context of many potentially inte-grated investment and management decisions. Some of the tools represent certain aspects of the problem in more detail than others do, but they all share this comprehensive approach.
The DHI Flood Toolbox (DHI, undated) builds on the MIKE FLOOD tool that we reviewed in the risk assessment section. Its authors describe it as a “one-stop-shopping solu-tion for the EU [European Union] Flood Directive” (DHI, 2011, p. 1). The package consists of “5 modules including flood estimation, risk and damage assessment as well as map generation” (DHI, 2011, p. 1). The DHI Flood Toolbox is integrated with ArcGIS (Arc Geographic Infor-mation System), an industry-standard GIS package (DHI, undated). The DHI Flood Toolbox package wraps MIKE FLOOD in other analytical layers that allow a more comprehensive approach to flood planning and decisionmaking. The DHI Flood Toolbox is widely used in Europe and has been implanted in U.S. locations. It appears to be well suited to flood-related decision support, including the ability to explore various climate-driven scenarios.
The EU Floods Directive has produced a large number of relevant tools, many of which are grouped together under the FLOODsite project (FLOODsite, undated [b]). These tools build on the risk and vulnerability tools to create more-elaborate comprehensive flood DSTs. The Elba River DST is one such tool (FLOODsite, undated [d]). It combines established cli-mate, rainfall-runoff, river channel, inundation, and damage models in an interactive website that produces maps of flood inundation and damage for different, preselected strategic alterna-tive management scenarios. Not all of the functionality of the tool is exposed to the end user. Nonetheless, the tool as presented on the website is capable of informing flood-related invest-
Table 6.5Project Evaluation Tools
Tool Location of Application to Date
CLARA Louisiana
Autocase Tucson, Fort Worth, Toronto
Beach-fx Florida, Mississippi
HEC-FDA Sacramento, Louisville, worldwide
NOTE: HEC-FDA = HEC Flood Damage Reduction Analysis.
Decision Support Tools 53
ment decisions in a reasonably holistic manner—taking into account concepts of resilience and sustainability. Although the DST has sophisticated models on its back end, it does not allow users to develop detailed management plans or portfolios of potential strategies and invest-ments. Given its architecture, it is likely that this tool could be adapted to explore site-specific alternatives, but it does not appear to have been used in this manner to date.
THESEUS DSS (THESEUS, undated [a]) represents yet another European entry in the space of comprehensive DSTs. The THESEUS consortium is an EU effort that has produced a tool for
supporting decision makers and practitioners to develop sustainable coastlines by help-ing them assess risk, select appropriate mitigation options in an integrated way taking into account all technical, social, economic, and environmental aspects while considering short, mid, and long-term scenarios and the issues posed by climate change. (THESEUS, undated [a])
The tool is part of a larger project by the EU to develop best practices to mitigate coastal flood-ing under climate change. It uses a complex, GIS-based flooding model aimed at assessing particular mitigation measures taken alone or in combination and is designed around the ideas of probabilistic, multiscenario analysis. It produces various sorts of vulnerability maps, includ-ing flooding, economic loss, loss of life, and coastal erosion, over a wide range of climate and management possibilities.
The Modelling and Decision Support Framework 2 (MDSF2) is a large model used through the United Kingdom to prepare national flood risk maps and to assess flood risk (United Kingdom [UK] Environment Agency, 2015). MDSF2 has the capability of assessing different combinations of management strategies and thus enables managers to understand the contributions of various packages of investments and practices to flood risk mitigation.
In the United States, EPA developed the Watershed Management Optimization Support Tool (WMOST) to serve somewhat similar needs (EPA, 2017a). WMOST is used nationwide by “local water resources managers and planners to screen a wide range of potential water resources management options across their jurisdiction for cost-effectiveness and environmen-tal and economic sustainability” (EPA, 2015, p. ii). This tool uses linear programming–based optimization to examine possible flood and water management–related investments. This model has some limitations in terms of spatial and temporal granularity but has the benefit of a reasonably simple user interface (UI). WMOST is not designed to replace the more sophisti-cated hydrologic modeling packages discussed previously but does place those more-sophisti-cated analyses within a more comprehensive management context.
Lastly, the approach of robust decisionmaking (RDM) pioneered by RAND combines modeling of whatever the system of interest might be and consequence or damage assess-ment together with multicriterion decisionmaking and a deliberative planning process to assist communities with the decisionmaking process. For a list of publications and applications, see RAND Corporation, undated (b). This decisionmaking framework uses the XLRM frame-work discussed in Chapter Three to help frame the decision problem and then uses hydro-logic modeling, in the case of flood-related applications, together with uncertainty analysis (not dependent on probability distributions) to better understand where potential portfolios of project options fail or fall short under a wide range of possible future conditions. The aim is to

54 Landscape Survey to Support Flood Apex National Flood Decision Support Toolbox
identify key trade-offs that decisionmakers and stakeholders should consider in their choices of strategies and projects when facing a deeply uncertain future across multiple dimensions.
The RDM framework has been applied in a variety of areas, including flood and coastal protection, as well as water scarcity issues and military strategies (RAND Corporation, undated [b]). In Louisiana, the RDM approach was augmented with the CPRA Planning Tool to directly show decisionmakers what is possible given different budget constraints in terms of two outcome variables: reduced damage and land-building (Groves and Sharon, 2013). Table 6.6 lists the integrated DSTs we reviewed.
Process Support
Although not in the same spirit or kind as the other tools identified, there are other strategies in support of flood risk management and adaptation to climate change. We call these strate-gies process support rather than DSTs. The Georgetown Adaptation Tool Kit (Grannis, 2011) includes decisionmaking processes but does not include the specific modeling that might be necessary to generate the analysis to inform decisions about investments in flood risk reduc-tion. Most communities lack awareness of what has been used in other areas and what con-stitutes “best practices” under differing community contexts. The Georgetown tool provides a menu of options that have been used to consider adaptation to climate change in the United States and elsewhere. The XLRM approach discussed in component 1 combined with RDM supports problem scoping, selection of indicators, and decisionmaking within a community (Knopman and Lempert, 2016). Additionally, the social, technical, administrative, political, legal, economic, environmental approach developed by FEMA might provide communities with a framework for evaluating alternative investment strategies. The approach involves con-sidering the social, technical, administrative, political, legal, economic, and environmental constraints and opportunities of implementing alternative mitigation activities (FEMA, 2003).
Table 6.6Integrated Decision Support Tools
Tool Developer Location of Application to Date
DHI Flood Toolbox DHI, Denmark Worldwide with European focus
FLOODsite EU Consortium Europe
THESEUS DSS THESEUS project consortium Europe
MDSF2 UK Environment Agency UK
WMOST EPA Nationwide, United States
RDM RAND Ho Chi Minh City, Louisiana, New York, Colorado River Basin
CPRA Planning Tool RAND Louisiana
Risk Mapping, Assessment and Planning
FEMA Nationwide, United States

Decision Support Tools 55
Summary of Findings
Risk Identification and Assessment
The first set of models and methods focuses on risk assessment. Nearly all of these tools focus on taking flood inundation maps or 100-year flood zone maps and translating them into damage estimates using historical hydrologic and existing asset data. Many of these are compa-rable to Hazus-MH, which is FEMA’s national methodology for estimating potential damage arising from a variety of hazards, including earthquakes, hurricanes, and floods. Hazus uses a GIS interface to estimate the impact that different hazards would have on structures in the area. The default setting uses census-level data to estimate the impact but can be tailored with greater information about structures and potential hazard characteristics, including flood depth inundation maps to better estimate structural damage (FEMA, 2017a).
Vulnerability Assessment
Vulnerability assessment models consider how changing climatic conditions affect coastal or tidal inundation, usually focused on SLR but often not including estimates of damage or impact of alternative projects. Vulnerability assessments are intended to shine a light on a future without further action to mitigate the flood hazard. Use of extreme precipitation sce-narios is less common (but no less important).
Environmental Assessment
The third set of DSTs focuses on mapping environmental assets, such as wetlands and habitat quality, that might be important goals of decisionmaking in addition to flood risk mitigation. The main focus of these tools is to integrate consideration of ecosystem services associated with natural capital as a means of understanding the cobenefits of green infrastructure that might be employed in flood damage mitigation.
Emergency Management
The fourth set of DSTs includes analytical tools that could be used to allocate resources during an emergency. In contrast to the other categories, this set focuses on support for management of emergency response rather than mitigation.
Project Evaluation
The project evaluation category links a hydrologic model with a damage assessment but, in contrast to the first category of risk assessment, goes one step further by enabling the hydro-logic model to be modified for the purpose of assessing the risk reduction potential of differ-ent projects. These tools allow decisionmakers to understand the impacts of different potential projects in terms of damage from a range of potential storms and consequent streamflow and inundation pathways.
Integrated Decision Support
Integrated decision support provides a means to assess the outcomes from alternative projects or suites of projects in a structured and systematic manner. That is, these kinds of tools are designed to illuminate the trade-offs that decisionmakers face and combinations of interven-tions that might best achieve progress toward multiple public goals in the presence of a budget-ary constraint.

56 Landscape Survey to Support Flood Apex National Flood Decision Support Toolbox
Process Support
These tools support the processes of planning and decisionmaking. Their focus is typically on participatory planning processes that enable decisionmakers and stakeholders to develop fair and equitable plans in an efficient and effective manner.
A wide variety of tools can be considered DSTs. Each of the tools discussed above has a place in the decisionmaking process. The risk, vulnerability, and environmental assessment tools provide decisionmakers and community members with a means of understanding the problem as it currently exists and as it might evolve in the future. The visualization capabili-ties built into these tools provide a means of communicating complex ideas into more–easily understandable maps. Knowing where risk and vulnerabilities exist in terms of both physical damage and environmental services is a critical step in problem definition within the decision-making process.
Most importantly, few DSTs rise to the level of integrated decision support in which an analytical platform enables analysis of vulnerability and risk to economic, environmental, and social well-being but also enables analysis of alternative courses of action and their trade-offs across public goals. By necessity, these kinds of analytical tools must be flexible enough to be customized to a given place and problem context. The challenge is moving this ideal from the realm of consultant-dependent customization to a more widely available set of tools that could be adapted by communities of all sizes and technical and fiscal capacities. A conceptual frame-work from Chapter Three can be used as a modeling framework for DSTs and could be cali-brated using a specific indicator system that can be drawn from those considered in Chapter Four. This might allow for the further development of a DST that is based on resilience rather than simply disaster risk reduction.

57
CHAPTER SEVEN
Case Studies of Decision Support Tool Implementation for Flooding
The set of flood-related DSTs is increasingly rich, but these tools are not often integrated into the decisionmaking processes that they are designed to support. The tools surveyed in Chapter Six have all found use of one sort or another, and many of them have been reflected in planning documents and investment decisions. It is useful to look at the ways in which they are used and to identify trends in the way in which such tools might increasingly be used to inform plan-ning and investment decisions in the future.
Marin County, California
A DST that is capable of estimating both costs and benefits provides a structured way to develop and evaluate alternatives. Many jurisdictions engage specialized engineering firms to help with the development of flood damage mitigation plans using DSSs of this sort. The Marin County (California) Flood Control and Water Conservation District, for example, engaged Stetson Engineers to produce Capital Improvement Plan Study for Flood Damage Reduction and Creek Management in Flood Zone 9/Ross Valley (Stetson Engineers, 2011). This plan makes extensive use of the MIKE FLOOD package developed by DHI to perform hydrologic analysis, to esti-mate physical damage, and to provide critical input to an economic cost–benefit analysis that was used to evaluate and refine the resulting capital investment strategy. The Marin County capital improvement plan does not appear to have been highly deliberative in its scoping and construction, but the use of the DSS made for a reasonably transparent decisionmaking process that could be subjected to public scrutiny and feedback. The plan does not appear to include significant analysis of uncertainty with regard either to future climate conditions, future land use development, or the effectiveness of mitigation measures (Stetson Engineers, 2011).
New York City Hazard Mitigation Plan
The City of New York Hazard Mitigation Plan 2014 represents a vastly greater level of project complexity.1 This plan addressed all hazards facing the New York City metropolitan area, not just flooding, and sought to do so in a way that was both systematic and highly deliberative. The process was led by a mitigation planning council with 13 core city agencies and a total
1 For more details on the planning process and the use of Hazus, see New York City Office of Emergency Management, New York City Department of City Planning, and Mayor’s Office of Long-Term Planning and Sustainability, 2014.

58 Landscape Survey to Support Flood Apex National Flood Decision Support Toolbox
of 41 agencies, public authorities, nonprofit organizations, and private utility providers, along with extensive outreach to community groups and neighboring jurisdictions. After extensive consultation, the 41 members of the mitigation council generated a list of 662 proposed miti-gation actions that were then scored according to an enhanced version of a FEMA-developed process. Various tools, including Hazus-MH, were used to develop damage estimates for vari-ous scenarios, and extensive GIS analysis supported this procedure. The projects were scored in a purpose-built database application and various web data-visualization tools were used both to inform the production of the plan and to distribute its findings.
Because of its size and multihazard scope, the plan was not built around a single DST but made fluid use of various tools—both standardized tools, such as Hazus-MH, and custom ones, such as the mitigation action database and scoring system. Although the approach was systematic, it focused strongly on its deliberative process, using computerized tools to assist with various parts of the process. The result has been well received, but the professional exper-tise and focus required to organize and conduct an effort of this scale is beyond the abilities of any but the largest of jurisdictions.
2012 Comprehensive Master Plan for a Sustainable Coast
The framework of RDM embeds advanced analytics within a deliberative process, as shown in Figure 7.1. The aim is to build confidence in the decision framing and modeling and to enable stakeholders and decisionmakers to understand the underlying trade-offs among their key objectives. RDM integrates quantitative models into a planning process, leading to the identification of strategies that are most likely to meet competing and interdependent commu-nity needs. RAND has implemented RDM in multiple flood-related contexts, yielding fully implemented tools. These include a World Bank–sponsored project for Ho Chi Minh City in Vietnam (Lempert, Kalra, et al., 2013) and the development of Louisiana’s Comprehensive Master Plan for a Sustainable Coast (Groves and Sharon, 2013). RDM is currently being used in a Rockefeller Foundation–funded project for Jamaica Bay, New York. Here, we focus on the Louisiana application.
Figure 7.1A Schematic Representation of the Robust Decisionmaking Approach
1. Decision structuring
4. Trade-off analysis 2. Case generation
New options
Robuststrategy
Scenarios that illuminatevulnerabilities
Deliberation
Analysis
Deliberationwith analysis
3. Scenario discovery
RAND RR1933-7.1

Case Studies of Decision Support Tool Implementation for Flooding 59
The RDM approach has been applied to the Louisiana coast. Seven physical process models, including CLARA, were run in an integrated manner, and their output then moved into a planning tool. The object of the CLARA model was
to facilitate comparisons of current and future flood risk under a variety of protection system configurations in a wide range of environmental, operational, and economic uncer-tainties . . . incorporating system fragility and a larger number of future scenarios than previously analyzed. (Johnson, Fischbach, and Ortiz, 2013, abstract)
The model estimates flood depth with high spatial resolution for 50-, 100-, and 500-year expected return times along with expected damage to structures, infrastructure, and other economic assets with a rigorous treatment of the various uncertainties involved both 25 and 50 years into the future.
The planning tool was used to examine a large portfolio of projects that were under con-sideration for flood risk mitigation in coastal Louisiana and helped to elucidate the trade-offs and synergies between them. Various combinations of projects were examined repeatedly in the face of thousands of potential storm events to build up a detailed statistical portrait of which combinations were likely to be most in line with community goals and, often more importantly, which combinations were least likely to produce catastrophic failures to meet community goals. The results of this deliberatively developed modeling exercise formed a core part of the 2012 Louisiana Coastal Master Plan, and a revised version of CLARA is currently being used in the development of the 2017 Coastal Master Plan. These are the major guiding documents for state and federal efforts to build and ensure the resilience of coastal Louisiana in the face of the various forces (e.g., SLR, coastal land loss, land subsidence, increased hur-ricane intensity) that place it at such high risk from flooding (Groves, Fischbach, et al., 2014).

61
CHAPTER EIGHT
Summary of Findings
The concept of resilience has been gaining wide recognition throughout the policy and plan-ning areas. The hazards that communities face, interdependencies that exist between subsys-tems, and economic composition shape choices of a decisionmaking framework, modeling tools, and indicator set for each individual community. These choices depend on the individual characteristics of communities. An infrastructure-centered framework might work well for one community, but a function-centered framework might be better suited in another, depending on its particular goals and challenges.
Conceptual Frameworks
In developing a conceptual framework for considering DSTs for flood risk management, the decision-framing approaches developed in Lempert, Groves, et al., 2006, and Bennett, Cumming, and Peterson, 2005, provide useful starting points to scope the problem. Both approaches require a conceptualization and explicit modeling of the system, paying attention to critical uncertainties and the relationships between model elements.
The system-of-systems literature provides different organizational approaches to develop-ing these relationships both within and between subsystems. These approaches are typically either through functional segmentation or infrastructural segmentation. Each framework sug-gests different types of analyses, as well as different views about the world. The Rose, 2004b, framework provides a useful starting point, if only focused on the economic system, for consid-ering the interactions that occur and how adaptation could be enhanced. Norris et al., 2008, provides an intuitive approach for how resilience can be explained across different stakehold-ers and how investments at different locations can enhance the outcome stemming from a disruption.
Although the conceptual frameworks reviewed in this chapter differ, there are common-alities in that the resilience of the set of subsystems does not imply the resilience of the entire system and that the interdependencies matter to the resilience of the whole. The key is finding a balance between detail and parsimony to understand how different investments and dis-ruptions cascade through the entire system. The design of the framework should simplify its use and highlight where “touch points” between systems exist rather than focusing on all the potential relationships that can take place in a community.

62 Landscape Survey to Support Flood Apex National Flood Decision Support Toolbox
Indicator and Metric Systems
We have identified a series of problems with the current suite of indicator and metric systems. These problems stem mainly from the lack of consideration of the conceptual framework. By failing to incorporate the interdependencies that exist in all conceptual frameworks of resil-ience, the systems implicitly assume that resilience of the subsystems implies the resilience of the larger system. This is not necessarily the case. Additionally, no one has ever verified that any of the indicator systems is actually measuring resilience. Each of the systems assumes that the system’s characteristics matter for resilience but have never tested this hypothesis.
Resilience in Action
In the past decade, resilience has become a major organizing principle in disaster planning, mitigation, management, and recovery across all levels of government and in many NGOs and commercial enterprises. The degree to which it has been operationalized in practice is highly variable. It is increasingly recognized that preventing or otherwise mitigating the impact of all catastrophic events is not possible but that putting in place a range of systems, both social and engineered, that can reduce the damage and aid in recovery from even the most unforeseen events is possible. The federal government has shown leadership in this movement toward resil-ience with major programs coming out of DHS (including FEMA and NIST). Major NGOs, including the American Red Cross and the Rockefeller Foundation, have served a complemen-tary role in building resilience from the bottom up in individual cities and communities. Many states, counties, and cities have produced detailed risk reduction, disaster mitigation, and disas-ter recovery plans that are built around the ideas of resilience science and take their form from the guidelines promulgated from the federal government, the interventions offered by NGOs, and the example of comparable municipalities and governments. The work of the Rockefeller-sponsored 100RC provides clear examples of how the ideas of resilience have modified city planning and public works. But Berke, Smith, and Lyles, 2012, shows that state hazard mitiga-tion plans developed under the Disaster Mitigation Act of 2000 (Pub. L. 106-390) are quite weak but have been improving since 1999. Critical infrastructure providers, particularly elec-tric utilities, are taking advantage of advances in information technology and control systems to build more-resilient networks that are capable of handling the extremely dynamic loads and potentially larger storms that the coming decades might bring.
The larger perspective provided by framing decisions in terms of resilience might allow cities to develop better-integrated plans and to prioritize measures in a way that will not only minimize total losses but also maximize the functioning of systems in the immediate after-math of a disaster and increase the speed with which the city can recover and adapt to the postdisaster environment. For example, the work in New York City following Hurricane Sandy provides insights into how the ideas of resilience can be implemented, although we do not have a definitive answer about how these investments and changes in process will affect the long term. It is an open question whether the incentives that federal and state governments provide to develop such plans are actually being implemented consistently with these objectives. The shift in day-to-day thinking offered by the 100RC approach might provide additional lessons to be learned as these activities are ramped up.
Summary of Findings 63
It should be noted, however, that not all aspects of resilience implementation are equally well understood. The engineering aspects of resilience are often reasonably understandable and, to an extent, predictable. A system that requires grid power will work only if the electric grid is working. A city cannot function well without potable, piped water. The social-capital aspects of resilience, on the other hand, although generally agreed to be important, are much less well understood. Most major disaster resilience planning efforts involve broad community involvement in risk identification and mitigation planning. Many also provide designs for organizational structures to harness and coordinate community groups in disaster recovery. It is hoped that these efforts are also producing stronger ties within and between communities—ties that can be relied on when disaster strikes. Unlike for engineering, natural, physical, and economic aspects, clear policy levers are not available for social capital–building. The relation-ships between social capital and the rest of the larger system are less well understood than the interactions between natural, physical, and economic capital. Additionally, the metrics used to measure social capital cannot be changed on meaningful timescales.
Finally, it needs to be acknowledged that communities and individuals respond to the incentives provided to them. When postdisaster funding does not depend on predisaster invest-ments or standards, there will be little incentive for predisaster investments. Aligning federal incentives to reflect this is a large policy challenge that does not have a clear solution.
Decision Support Tools
In recent decades, DSTs have moved from basic physical models, including maps and table-top demonstrations, and informed by historical flood patterns and basic geophysical mea-surements, to sophisticated hydrodynamic simulations that can produce detailed snapshots of expected property damage and infrastructure performance under thousands of futures that explore climate and other uncertainties. These trends pull in opposite directions. Whereas maps and historical knowledge of flood patterns are reasonably easy for laypeople to under-stand and use, modern hydrodynamic models are complex and directly usable only by highly trained professionals.
Thinking about the process of flood protection has also evolved. In the United States and in many other parts of the world, the idea that government experts should design and harden infrastructure to protect people from flooding has shifted to a model of resilience and robust-ness, based not just on hard infrastructure but also on investments in natural and social capital that enable communities to mitigate impacts of flood events and recover more quickly. This change has complicated the process of evaluating potential projects for consideration. As we move to distributed mitigation efforts that incorporate green infrastructure, the complemen-tary or substitution relationships, across a range of potential projects, become much more dif-ficult to understand.
At present, there is considerable variation from one jurisdiction to the next with regard to the adoption of flood DSTs for use in the preparation of action plans and investment deci-sions. Data-visualization tools are in widespread use, with basic flood risk information avail-able nationwide and more-sophisticated, model-based data available for many states and juris-dictions. Other plans rely on integrated DSTs to model flood risk, estimate potential damage, evaluate the effectiveness of mitigation measures, and produce a coherent decisionmaking pro-cess using cost–benefit or related techniques. Plans of this sort can present a highly polished
64 Landscape Survey to Support Flood Apex National Flood Decision Support Toolbox
look but might still suffer from a lack of broad stakeholder input or buy-in and might make it difficult to understand the uncertainties that are inherent in flood-related decisionmaking.
Best practices in this area are still emerging, but it is possible to identify some major patterns and trends. Flood risk visualization is commonplace, and visualization tools are becoming increasingly capable. The use of visualization techniques plays a key role in helping both technical and nontechnical people understand information coming out of the models. Although some viewers provide more than basic flood risk contours, the simple and accessible nature of these tools is lost when the interface becomes sufficiently complex to allow for deep exploration of flooding scenarios and uncertainty. For this reason, flood risk viewers are likely to remain fundamental tools for building risk literacy among decisionmakers and community members alike. In more-sophisticated integrated DSTs, visualizations allows decisionmakers and stakeholders to understand trade-offs across time and space that otherwise might be dif-ficult to observe from raw model output.
Contemporary work on resilience and stakeholder involvement points strongly toward the continued importance of deliberative process and community involvement in framing mitiga-tion alternatives and evaluating the trade-offs among them. Successful comprehensive DSTs can be expected to include aspects that explicitly support community-based efforts of this sort.
Uncertainty is increasingly appreciated as an important aspect of risk analysis. This is particularly true as we enter an era of changing rainfall patterns, storm intensities, and sea levels, wherein historical patterns are less reliable as predictors of future conditions. The field of weather forecasting is making concerted efforts to quantify the uncertainty in forecasts and to develop methods for conveying that uncertainty to the public in ways that are intui-tive and clear. Flood models that are used in critical decisionmaking should also provide clear, evidence-based measures of their confidence and uncertainty. This could also include temporal uncertainty, in which it might be best to take some steps now and see what happens before making further decisions—few, if any, contemporary flood DSTs support this kind of deci-sionmaking smoothly.
Mitigation measures often display redundancies or synergies. Some tools are now capa-ble of seeking out combinations of measures that produce the best results, by one metric or another, under a variety of future conditions.
Of course, “best” in this case is strongly place and community dependent and might be defined in terms of maximum safety at a given cost, maximum cost-effectiveness, maximum return on investment within likely parameters, highest minimum return on investment (least bad outcome) within broader parameters, most-equitable distribution of risk among residents, or a host of other possible metrics. It seems unlikely that a technical consensus will emerge on the proper metric of decision quality. This is bound to remain in the realm of the sociopo-litical, and this fact will make social process a key part of the flood decisionmaking process indefinitely.
65
APPENDIX
Summary Tables
This appendix provides brief overviews of the DSTs listed in Chapter Six, organized in the same manner as discussed.

66 Landscape Survey to Support Flood Apex National Flood Decision Support Toolbox
Risk Assessment Tools
Table A.1MIKE FLOOD
Aspect Description
Lead organization or author MIKE Powered by DHI
Locations where applied Greece, Thailand, worldwide
Motivation for development • “Reliable flood modelling tools . . . enable us to analyse flood events and develop flood protection measures or flood mitigation strate-gies in the attempt to prevent the losses of human lives and property, as well as to minimise significant destruction of infrastructure and landscape.”
• “MIKE FLOOD [is] especially relevant for floodplain, storm surge and urban flood applications . . . .”
Functionality • “MIKE FLOOD is a unique, integrated modelling package, which is specifically developed and tailored towards market requirements . . . .”
• “MIKE FLOOD enables you to model virtually any flood problem—whether it involves rivers, floodplains, flooding in streets, drainage networks, coastal areas, dam or levee breaches or any combination of these.”
• “The core elements in MIKE FLOOD are our well-proven models, MIKE 11 for rivers, MIKE URBAN for collection systems and MIKE 21 for 2D surface flow. These are dynamically coupled to form a unique and trend-setting three-way coupled modelling tool.”
Input data requirements • Package in both one-dimensional and 2D models• Flood hydrographs• High-resolution elevation maps (LIDAR is best)
Outputs • Flood damage analysis• Robust solutions
User interface “Integrated flood modelling comprising dynamic coastal, urban, river and floodplains interactions”
Suitability for DHS and Flood APEX
Uncertainty and climate change Unknown
Portability
Potentially valuable to DHS? • Looks to be a straightforward tool for assessing impacts of floods; worth a look
• “Well-proven technology and simulation engines, which have been applied successfully in numerous projects globally”
SOURCE: MIKE Powered by DHI, undated.
NOTE: 2D = two dimensional. LIDAR = light detection and ranging.

Summary Tables 67
Table A.2Decision Support System for Water Infrastructural Security
Aspect Description
Lead organization or author National Center for Computational Hydroscience and Engineering, University of Mississippi
Locations where applied Used by• DHS Dams Sector branch• USACE• Mississippi Department of Environmental Quality• 36 users in 23 states
Motivation for development “The [Decision Support System for Water Infrastructural Security] was designed to facilitate problem definition and scenario set-up for large scale dam/levee break/breaching studies . . . .”
Functionality • ArcGIS GUI interaction• Flood model: CCHE2D-FLOOD• Postprocessor with Monte Carlo capabilities
Input data requirements Minimum inputs:• DEM• Features• Simulation parameters• Data that can be ported from Hazus-MH
Outputs • Agriculture damage• Urban damage• Flood mapping
User interface ArcGIS GUI interaction
Suitability for DHS and Flood APEX
Uncertainty and climate change Developed through scenario and simulation setup and Monte Carlo simulation
Portability Used across a variety of jurisdictions and agencies already
Potentially valuable to DHS? Currently being used by DHS Science and Technology Directorate
SOURCES: National Center for Computational Hydroscience and Engineering, undated; National Center for Computational Hydroscience and Engineering, 2011.
NOTE: GUI = graphical UI. DEM = digital elevation map.

68 Landscape Survey to Support Flood Apex National Flood Decision Support Toolbox
Table A.3German Bight Risk Analysis Tool
Aspect Description
Lead organization or author FLOODsite
Locations where applied St. Oeter Ording on the German Bight coast
Motivation for development “A micro-scale (detailed) approach for risk assessment is essential for useful planning/measures, but such detailed risk analysis is extremely costly and time consuming. Thus, a transferable method which still meets the detailed information requirements has to be developed.”
Functionality • Prototype micro-scale risk assessment tool (for small community). It is part of seven pilot studies performed by FLOODsite and its affiliates.
• “[C]ombine the calculation of failure probability for coastal defences with evaluations of socio-economic damages”
Input data requirements Inputs include water level and type of dike failure at a specific dike section. Impact is assessed based on studies of the local population density, economic assets, and ecological conditions. Assets are assigned values and totaled based on zones.
Outputs Risk analysis (rating) by zone, including hazard probabilities, vulnerability analysis (buildings, private inventory, fixed assets, people at risk, ecological impacts on biotopes), and flood scenarios
User interface
Suitability for DHS and Flood APEX
Uncertainty and climate change • Uncertainty does not appear to be taken into account.• The model incorporates flood scenarios.
Portability The tool is designed to be transferable to various communities, balancing the detailed data required for useful risk mitigation planning with low analysis cost and time.
Potentially valuable to DHS? Looks to be a straightforward tool for assessing impacts of floods; worth a look
SOURCE: FLOODsite, undated (c).
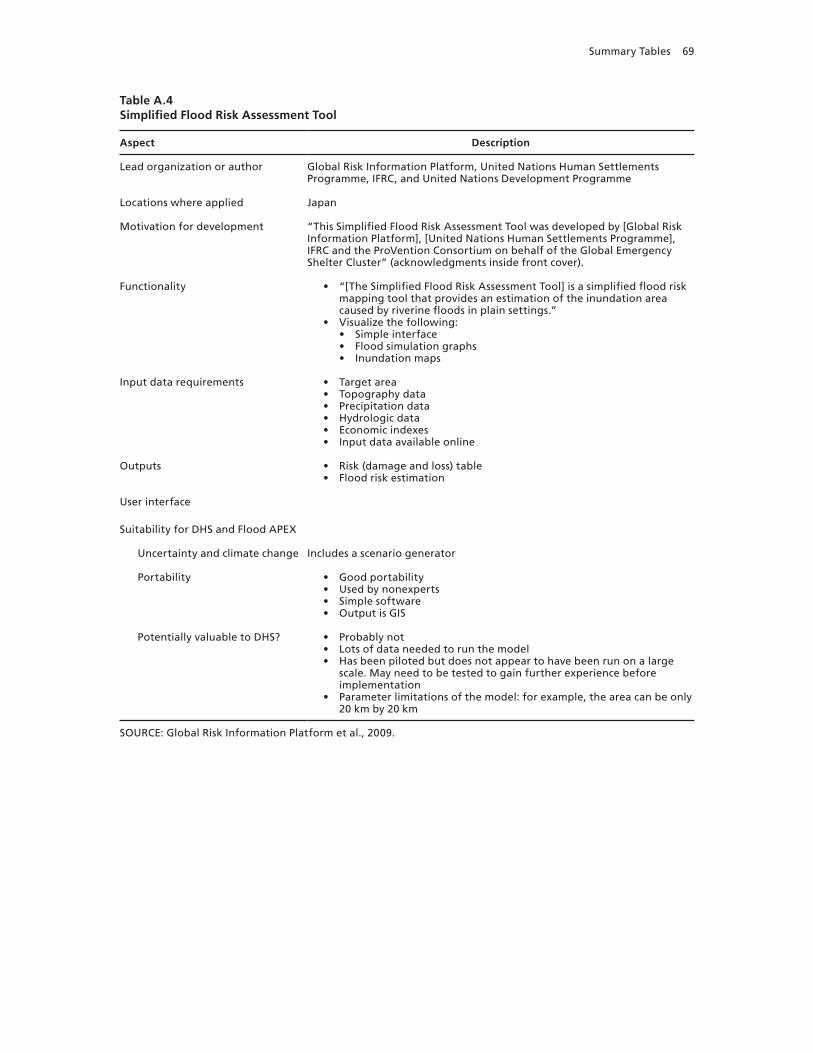
Summary Tables 69
Table A.4Simplified Flood Risk Assessment Tool
Aspect Description
Lead organization or author Global Risk Information Platform, United Nations Human Settlements Programme, IFRC, and United Nations Development Programme
Locations where applied Japan
Motivation for development “This Simplified Flood Risk Assessment Tool was developed by [Global Risk Information Platform], [United Nations Human Settlements Programme], IFRC and the ProVention Consortium on behalf of the Global Emergency Shelter Cluster” (acknowledgments inside front cover).
Functionality • “[The Simplified Flood Risk Assessment Tool] is a simplified flood risk mapping tool that provides an estimation of the inundation area caused by riverine floods in plain settings.”
• Visualize the following:• Simple interface• Flood simulation graphs• Inundation maps
Input data requirements • Target area• Topography data• Precipitation data• Hydrologic data• Economic indexes• Input data available online
Outputs • Risk (damage and loss) table• Flood risk estimation
User interface
Suitability for DHS and Flood APEX
Uncertainty and climate change Includes a scenario generator
Portability • Good portability• Used by nonexperts• Simple software• Output is GIS
Potentially valuable to DHS? • Probably not• Lots of data needed to run the model• Has been piloted but does not appear to have been run on a large
scale. May need to be tested to gain further experience before implementation
• Parameter limitations of the model: for example, the area can be only 20 km by 20 km
SOURCE: Global Risk Information Platform et al., 2009.
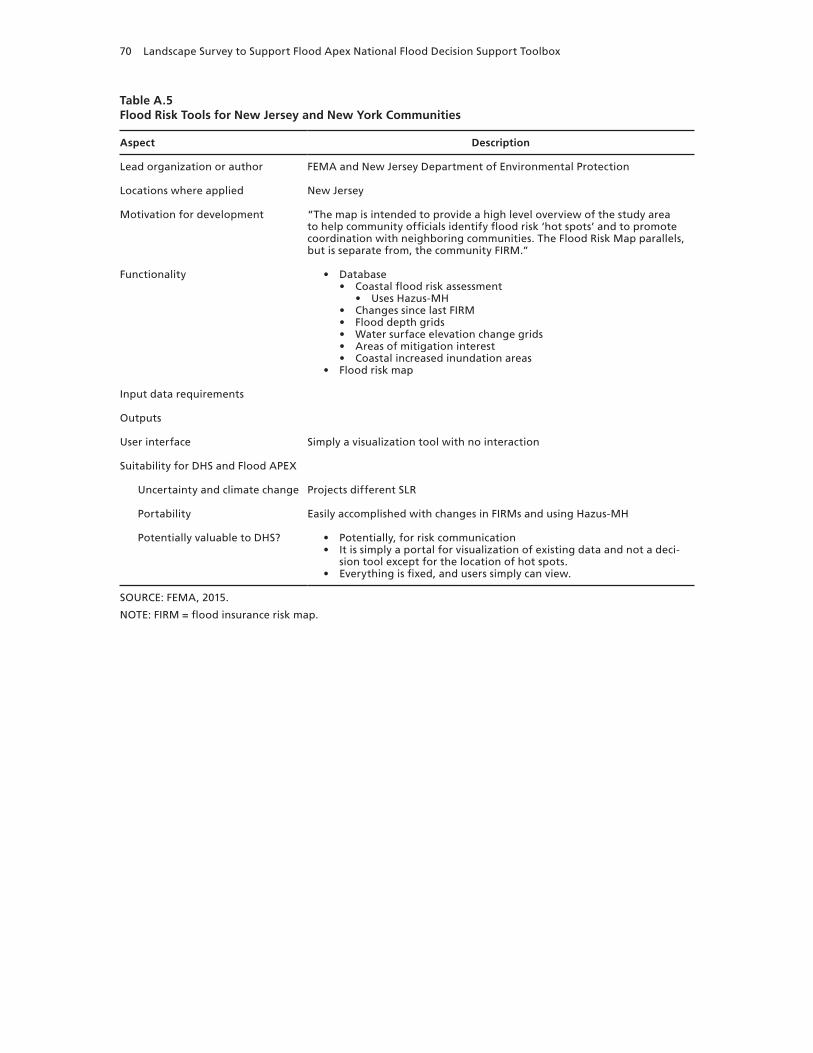
70 Landscape Survey to Support Flood Apex National Flood Decision Support Toolbox
Table A.5Flood Risk Tools for New Jersey and New York Communities
Aspect Description
Lead organization or author FEMA and New Jersey Department of Environmental Protection
Locations where applied New Jersey
Motivation for development “The map is intended to provide a high level overview of the study area to help community officials identify flood risk ‘hot spots’ and to promote coordination with neighboring communities. The Flood Risk Map parallels, but is separate from, the community FIRM.”
Functionality • Database• Coastal flood risk assessment
• Uses Hazus-MH• Changes since last FIRM• Flood depth grids• Water surface elevation change grids• Areas of mitigation interest• Coastal increased inundation areas
• Flood risk map
Input data requirements
Outputs
User interface Simply a visualization tool with no interaction
Suitability for DHS and Flood APEX
Uncertainty and climate change Projects different SLR
Portability Easily accomplished with changes in FIRMs and using Hazus-MH
Potentially valuable to DHS? • Potentially, for risk communication• It is simply a portal for visualization of existing data and not a deci-
sion tool except for the location of hot spots.• Everything is fixed, and users simply can view.
SOURCE: FEMA, 2015.
NOTE: FIRM = flood insurance risk map.

Summary Tables 71
Table A.6Hydrologic Engineering Center’s River Analysis System
Aspect Description
Lead organization or author HEC
Locations where applied Nationwide
Motivation for development “This software allows the user to perform one-dimensional steady flow, one and two-dimensional unsteady flow calculations, sediment transport/mobile bed computations, and water temperature/water quality modeling.”
Functionality Advanced hydrologic modeling package• Handles a full network of open channels, floodplains, and alluvial
fans• Models subcritical, supercritical, and mixed-flow regimes. Steady and
unsteady flows.• Unsteady-flow module handles hydraulic structures, including dam-
break analysis, levee breaching and overtopping, pumping stations, navigation dam operations, and pressurized pipe systems.
Input data requirements • Desktop tool• GUI for data handling and analysis
Outputs • River system schematics, cross-sections, profiles, rating curves, and inundation maps
• 3D mapping of multiple cross-sections• Animated inundation maps• Velocity, shear stress, ice thickness, and floodway encroachment
User interface
Suitability for DHS and Flood APEX
Uncertainty and climate change Quantification of uncertainty and climate change are not central to design.
Portability Excellent, designed for reuse
Potentially valuable to DHS? • No• This is a fine hydrologic engineering tool but is not designed to
address planning, investment, or damage questions. It is designed to explore very specific scenarios in great detail.
SOURCE: HEC, undated (c).
NOTE: 3D = three dimensional.
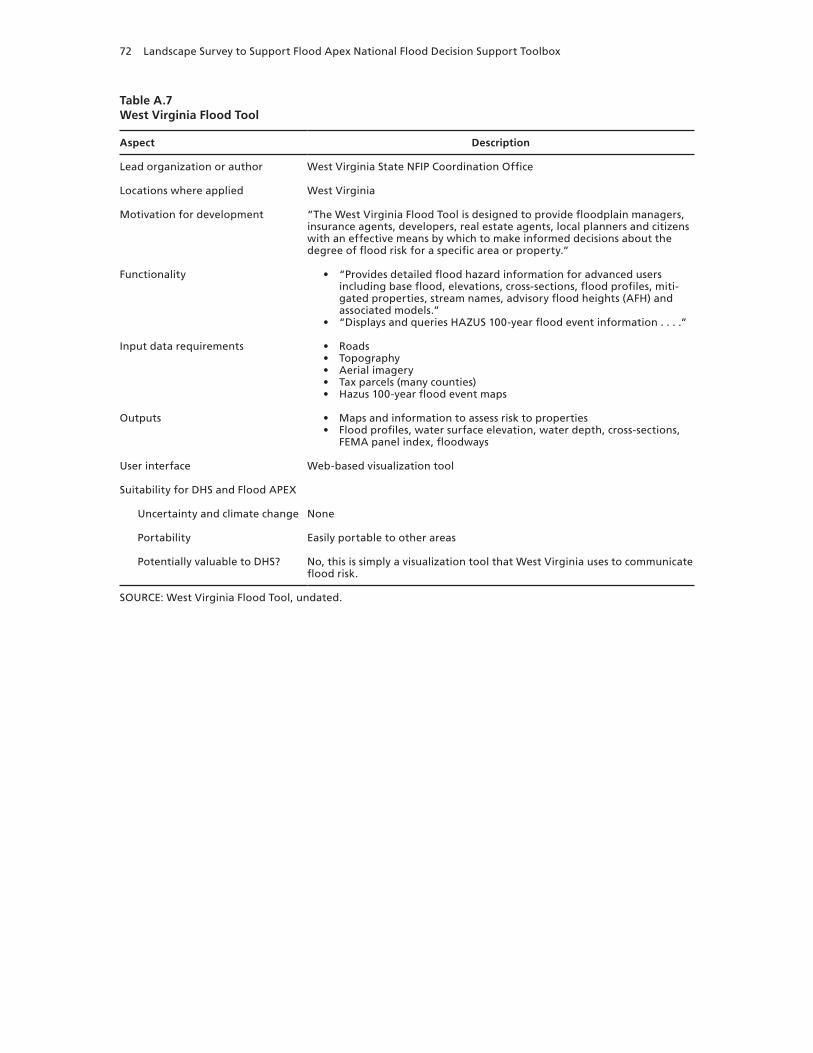
72 Landscape Survey to Support Flood Apex National Flood Decision Support Toolbox
Table A.7West Virginia Flood Tool
Aspect Description
Lead organization or author West Virginia State NFIP Coordination Office
Locations where applied West Virginia
Motivation for development “The West Virginia Flood Tool is designed to provide floodplain managers, insurance agents, developers, real estate agents, local planners and citizens with an effective means by which to make informed decisions about the degree of flood risk for a specific area or property.”
Functionality • “Provides detailed flood hazard information for advanced users including base flood, elevations, cross-sections, flood profiles, miti-gated properties, stream names, advisory flood heights (AFH) and associated models.”
• “Displays and queries HAZUS 100-year flood event information . . . .”
Input data requirements • Roads• Topography• Aerial imagery• Tax parcels (many counties)• Hazus 100-year flood event maps
Outputs • Maps and information to assess risk to properties• Flood profiles, water surface elevation, water depth, cross-sections,
FEMA panel index, floodways
User interface Web-based visualization tool
Suitability for DHS and Flood APEX
Uncertainty and climate change None
Portability Easily portable to other areas
Potentially valuable to DHS? No, this is simply a visualization tool that West Virginia uses to communicate flood risk.
SOURCE: West Virginia Flood Tool, undated.

Summary Tables 73
Table A.8Local Flood Risk Assessment Prototype Tool
Aspect Description
Lead organization or author UK Environment Agency
Locations where applied UK-wide
Motivation for development “The [Local Flood Risk Assessment] Calculator, even in prototype form, provides a powerful, flexible means of implementing the risk assessment methods outlined in SC070059/R3” (p. 5).
Functionality • ArcGIS extension• Requires Spatial Analyst extension• Provides tools for visualization and risk compilation from various
flood projection data sets• Uses existing government flood data sets• Tool modeling is limited to combining these to produce weighted
values.
Input data requirements • Desktop tool built on ArcGIS• Good documentation, straightforward UI
Outputs • Spatial query of flood outlines• Coding of individual properties with flood risk• Combine flood metrics from different data sets and different
probabilities• Risk probability charts• Risk and damage maps
User interface
Suitability for DHS and Flood APEX
Uncertainty and climate change Not designed to quantify uncertainty or explicitly represent climate change
Portability Moderate within UK. International translation would require adaptation to new data.
Potentially valuable to DHS? • No• This is a fairly basic prototype aimed at combining, visualizing, and
assessing existing flood data.
SOURCE: UK Environment Agency, 2014.

74 Landscape Survey to Support Flood Apex National Flood Decision Support Toolbox
Table A.9LATIS
Aspect Description
Lead organization or author Flanders Hydraulics Research and University of Ghent
Locations where applied Flanders, Belgium
Motivation for development To estimate economic and human risk of flooding under a range of scenarios
Functionality • Estimates flood depth• Various return periods
• Detailed land use maps• Parcel and building levels
• Population and socioeconomic data• Damage functions based on literature• Casualty estimates based on depth, rise velocity, and flow velocity
Input data requirements Requires excellent land use data
Outputs • Risk maps• Economic damage maps• Human loss maps
User interface • Desktop tool• Implemented in Idrisi and C#.NET
• Significant configurability
Suitability for DHS and Flood APEX
Uncertainty and climate change • Can explore different climate-driven scenarios• Does not seem to explicitly represent uncertainty
Portability • Data compatibility issues could present difficulty• Infrastructure and costs differ from those in the United States
Potentially valuable to DHS? Yes, straightforward tool for assessing impacts of flood scenarios
SOURCE: Waterbouwkundig Laboratorium, undated.

Summary Tables 75
Table A.10Risk and Vulnerability Assessment Tool Florida Pilot
Aspect Description
Lead organization or author EBM Tools Network (part of the EBM Tools Database)
Locations where applied Florida and coastal areas
Motivation for development “Assist emergency managers, planners, the public, and others in their efforts to reduce hazard . . . .”
Functionality • RVAT• Specific assessments or analyses include
• Hazards• Critical facilities• Societal, economic, environmental, and mitigation opportunities
• Allows users to dynamically link to real-time and near-real-time atmo-spheric, oceanic, and hydrologic information on the Internet
Input data requirements • Meteorological, oceanographic, and hydrologic observing station data
• Critical facilities• Demographic and business data from
• National Weather Service data, including forecast zones, buoys, METAR stations
• U.S. Geological Survey river gages• National Ocean Service tide gages
Outputs Spatial data layers used in the Coastal Storms Initiative RVAT Arc Internet Map Server (ArcIMS) tools
User interface
Suitability for DHS and Flood APEX
Uncertainty and climate change Uncertainty does not appear to be taken into account
Portability • Pilot tool specific to several Florida counties• Might be expandable to additional locations
Potentially valuable to DHS? • Looks to be a straightforward tool for assessing impacts of floods; worth a look
• Generalization will require work.
SOURCE: EBM Tools Network, 2010.
NOTE: EBM = Ecosystem-Based Management.

76 Landscape Survey to Support Flood Apex National Flood Decision Support Toolbox
Table A.11Flood Risk Information System
Aspect Description
Lead organization or author State of North Carolina
Locations where applied North Carolina, Virginia, Alabama, Florida
Motivation for development • Flood risk information• Flood insurance premiums• Information generally
Functionality Provides detailed information on the flood risk, flood insurance premiums, financial vulnerability, and data available for export, including flood maps
Input data requirements • Flood maps• Insurance rate tables• Structure data
Outputs Flood insurance rate maps
User interface Website that allows people to go to specific properties and obtain detailed estimates of flood risk together with flood insurance premiums that the user can modify for specific structural attributes in areas in the special flood-hazard area
Suitability for DHS and Flood APEX
Uncertainty and climate change None, based on historical data
Portability Seems easily portable to other areas
Potentially valuable to DHS? Yes, especially with regard to flood insurance
SOURCE: Flood Risk Information System, undated.

Summary Tables 77
Table A.12North Carolina Floodplain Mapping Program
Aspect Description
Lead organization or author State of North Carolina
Locations where applied North Carolina
Motivation for development Better flood mapping for the NFIP through FEMA
Functionality Flood risk maps
Input data requirements • DEMs• LIDAR first-floor elevation of structures
Outputs Flood risk maps
User interface Website of maps
Suitability for DHS and Flood APEX
Uncertainty and climate change None, based on past data
Portability Relatively portable
Potentially valuable to DHS? Great potential for risk communication
SOURCE: North Carolina Floodplain Mapping Program, undated.
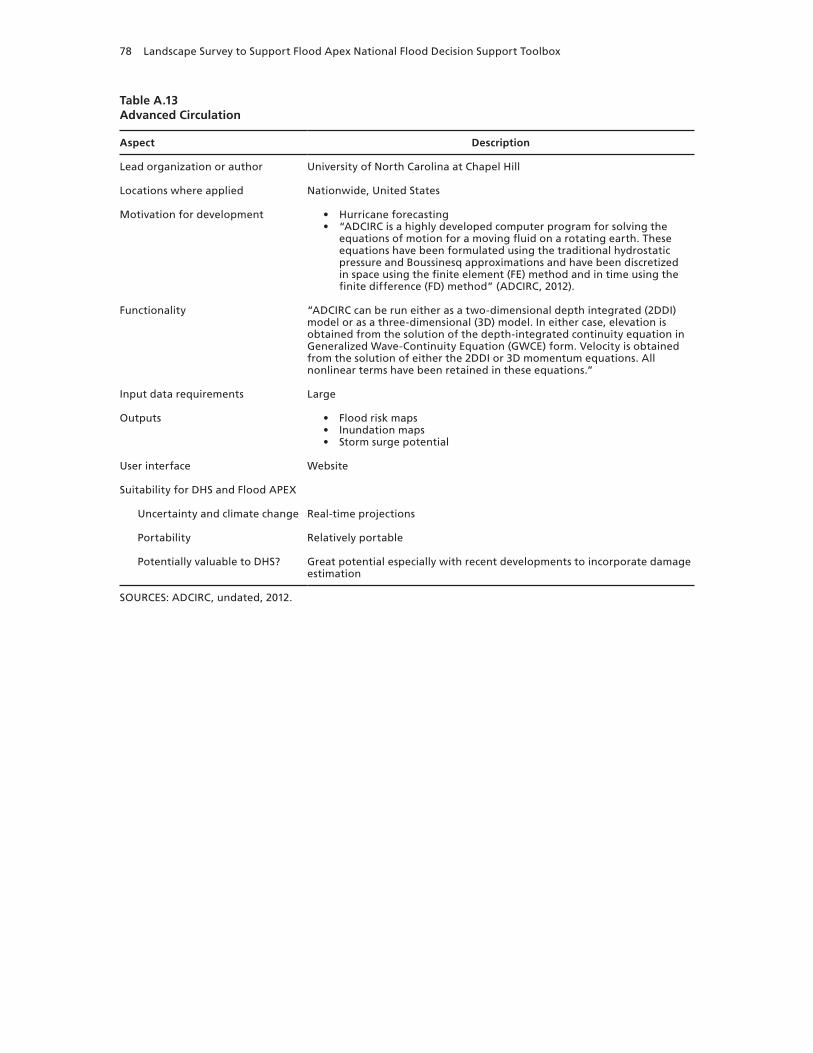
78 Landscape Survey to Support Flood Apex National Flood Decision Support Toolbox
Table A.13Advanced Circulation
Aspect Description
Lead organization or author University of North Carolina at Chapel Hill
Locations where applied Nationwide, United States
Motivation for development • Hurricane forecasting• “ADCIRC is a highly developed computer program for solving the
equations of motion for a moving fluid on a rotating earth. These equations have been formulated using the traditional hydrostatic pressure and Boussinesq approximations and have been discretized in space using the finite element (FE) method and in time using the finite difference (FD) method” (ADCIRC, 2012).
Functionality “ADCIRC can be run either as a two-dimensional depth integrated (2DDI) model or as a three-dimensional (3D) model. In either case, elevation is obtained from the solution of the depth-integrated continuity equation in Generalized Wave-Continuity Equation (GWCE) form. Velocity is obtained from the solution of either the 2DDI or 3D momentum equations. All nonlinear terms have been retained in these equations.”
Input data requirements Large
Outputs • Flood risk maps• Inundation maps• Storm surge potential
User interface Website
Suitability for DHS and Flood APEX
Uncertainty and climate change Real-time projections
Portability Relatively portable
Potentially valuable to DHS? Great potential especially with recent developments to incorporate damage estimation
SOURCES: ADCIRC, undated, 2012.

Summary Tables 79
Table A.14CommunityViz and weTable
Aspect Description
Lead organization or author University of Delaware, Sustainable Coastal Communities
Locations where applied Rehoboth Beach, Delaware; Sussex County, Delaware; Texas; Colorado
Motivation for development • “CommunityViz adds interactive analysis tools and a decision-mak-ing framework to ArcGIS. It works as an extension to ArcMap. Sce-nario 360 helps you view, project, analyze, and understand potential alternatives and impacts via visual exploration and alternative sce-nario construction and analysis” (Sustainable Coastal Communities, undated).
• “The weTable is a powerful and simple public workshop tool that turns any table-top into a functioning computer interface. It allows participants to gather around a table in a workshop setting to explore and interact with digital data, maps, and online resources. The tool allows for a whole new level of collaboration and public interaction that is impossible to do with laptops, desktops, and screen presenta-tions. Its use is highly applicable for public engagement and could inspire new ways of sharing data and conducting planning efforts. To date, the weTable has been used in a handful of geographic settings, such as Texas, Colorado, and Delaware, just to name a few. However, use of this innovative technology is expanding rapidly and practitio-ners are continuing to develop new strategies for public participa-tion” (Sustainable Coastal Communities, undated).
Functionality “CommunityViz offers many ways to present the analysis including real time demonstrations, Internet reports, and WebShots (a dynamic presentation tool). Google Earth and SiteBuilder3D provide 3D visualization tools” (Sustainable Coastal Communities, undated).
Input data requirements • Land use characteristics• Scenario development• Parcel maps
Outputs Visualization of scenarios used
User interface ArcGIS interface
Suitability for DHS and Flood APEX
Uncertainty and climate change Can be embedded within scenarios
Portability Very portable as long as data inputs are available
Potentially valuable to DHS? Yes, means to take scenario planning to visualization of alternatives
SOURCE: Sustainable Coastal Communities, undated.

80 Landscape Survey to Support Flood Apex National Flood Decision Support Toolbox
Vulnerability Assessment
Table A.15Mississippi River Delta Flood Risk and Resilience Viewer
Aspect Description
Lead organization or author CPRA
Locations where applied Mississippi River Delta of Louisiana
Motivation for development “The easy-to-use viewer displays information on coastal land change, flood risk and impacts to communities. This innovative, online tool provides residents with access to the state’s best information about how Louisiana’s coast may change in the future, as well as resources to make communities and properties safer.”
Functionality • Interactive website that allows users to understand the impact of future flood risk under the Louisiana Coastal Master Plan under alternative assumptions about SLR, different storms, and at different times in the future
• Visualizes output from the 2012 Louisiana’s Comprehensive Master Plan for a Sustainable Coast
Input data requirements Visualizes extensive data from the master plan
Outputs • Locations and links for proposed projects• Inundation maps• Differences in inundation with and without the master plan
User interface Interactive website
Suitability for DHS and Flood APEX
Uncertainty and climate change Displays projected impact of potential storms and SLR that are considered in the master plan
Portability • GIS layers over satellite imagery• Good tool for community engagement once a plan has been
developed
Potentially valuable to DHS? • Yes, though limited decision support• Strong visualization tools for displaying a plan’s effects at macro and
micro scales
SOURCES: CPRA, undated; McCalla, 2016.

Summary Tables 81
Table A.16New Jersey Flood Mapper
Aspect Description
Lead organization or author Rutgers University
Locations where applied State of New Jersey
Motivation for development “This interactive mapping website was designed and created to provide a user-friendly visualization tool that will help get information into the hands of local communities who need to make decisions concerning flooding hazards and sea level rise. This website should be used to promote enhanced preparedness and land use planning decisions with considerations for possible future conditions.”
Functionality Visualization of• SLR (bathtub model, 0 to 6 ft.)• Confidence of SLR predictions• Marsh status• Human and economic vulnerability• Preliminary FIRMs—not displaying at time of survey• Storm surge (Sea, Lake, and Overland Surges from Hurricanes)—not
displaying• FEMA 2050 special flood-hazard areas• Critical community facilities
Input data requirements • Uses data from commonly available sources• Intergovernmental Panel on Climate Change, FEMA, Census Bureau
Outputs
User interface • Interactive website• Simple interface• Overlays various maps on imagery, street map, or topographic base• Provides links to additional information
Suitability for DHS and Flood APEX
Uncertainty and climate change Limited to two categories with respect to SLR (high and low confidence)
Portability • Good portability• Based mostly on nationally available data
Potentially valuable to DHS? • Useful tool for visualizing commonly available data• Little functionality beyond this
SOURCE: “NJ Flood Mapper,” undated.

82 Landscape Survey to Support Flood Apex National Flood Decision Support Toolbox
Table A.17National Oceanic and Atmospheric Administration Sea Level Rise Viewer
Aspect Description
Lead organization or author NOAA
Locations where applied U.S. coastal regions
Motivation for development “[W]eb mapping tool to visualize community-level impacts from coastal flooding or sea level rise (up to 6 feet above average high tides). Photo simulations of how future flooding might impact local landmarks are also provided, as well as data related to water depth, connectivity, flood frequency, socio-economic vulnerability, wetland loss and migration, and mapping confidence.”
Functionality Interactive maps visualize:• Impact of SLR up to 6 ft.• Confidence level for SLR estimates• SLR’s impact on marshes• SLR’s impact on socially vulnerable populations• SLR’s impact on coastal flooding
Input data requirements • “Photo simulations of how future flooding might impact local land-marks are also provided, as well as data related to water depth, con-nectivity, flood frequency, socio-economic vulnerability, wetland loss and migration, and mapping confidence.”
• “The viewer is a screening-level tool that uses nationally consistent data sets and analyses” (Environmental Dataset Gateway, 2012).
Outputs Outputs maps:• Vulnerability zones (high, medium, low)• Flood frequency• SLR• Marsh intensity zones
User interface Interactive website
Suitability for DHS and Flood APEX
Uncertainty and climate change • Scenario-based planning for climate change• Gives confidence levels
Portability Applicable in all U.S. coastal areas
Potentially valuable to DHS? Useful visualization but limited decision support
SOURCES: Office for Coastal Management, 2017b; Environmental Dataset Gateway, 2012.

Summary Tables 83
Table A.18National Oceanic and Atmospheric Administration Sea Level Rise Planning Tool
Aspect Description
Lead organization or author NOAA, FEMA, and USACE
Locations where applied
Motivation for development • “[T]o help areas affected by Hurricane Sandy prepare for future sea level rise. The set of maps and the sea level rise calculator are intended to guide reconstruction planning for state and local offi-cials, community planners, and infrastructure managers” (Adaptation Clearinghouse, 2013).
• “[N]ot intended to support regulatory flood hazard zone designation, insurance ratings, or other legal or regulatory constraints” (Adapta-tion Clearinghouse, 2013).
Functionality • DEMs and SLR calculator• Visualizes risk given different scientific assumptions• Calculates areas with 1% annual risk of coastal flooding for 5-year
periods from 2010 to 2100 given different climate models
Input data requirements • High-resolution elevation data• FEMA flood maps• SLR based on Global Sea Level Rise Scenarios for the United States
National Climate Assessment (Parris et al., 2012)• New York City data from a 2013 New York City panel on climate
change
Outputs • Risk maps• 5- to 10-year time increments from 2010 to 2100
User interface Unclear whether desktop or web-based
Suitability for DHS and Flood APEX
Uncertainty and climate change • Five climate change scenarios• Represents 1% flood probability areas• Does not include confidence bounds
Portability • Specific to the New York and New Jersey area• Could be generalized to rest of U.S. coastal regions
Potentially valuable to DHS? • Yes, useful long-term planning tool for coastal areas
SOURCES: U.S. Global Change Research Program, undated; Adaptation Clearinghouse, 2013.
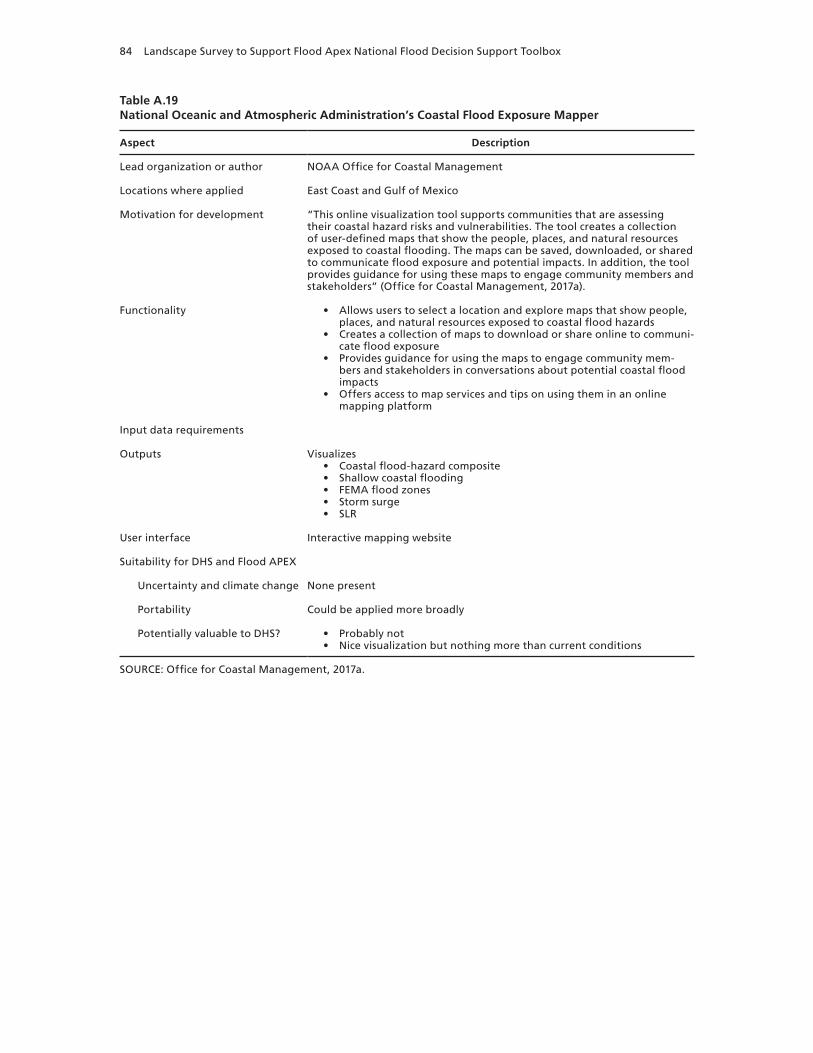
84 Landscape Survey to Support Flood Apex National Flood Decision Support Toolbox
Table A.19National Oceanic and Atmospheric Administration’s Coastal Flood Exposure Mapper
Aspect Description
Lead organization or author NOAA Office for Coastal Management
Locations where applied East Coast and Gulf of Mexico
Motivation for development “This online visualization tool supports communities that are assessing their coastal hazard risks and vulnerabilities. The tool creates a collection of user-defined maps that show the people, places, and natural resources exposed to coastal flooding. The maps can be saved, downloaded, or shared to communicate flood exposure and potential impacts. In addition, the tool provides guidance for using these maps to engage community members and stakeholders” (Office for Coastal Management, 2017a).
Functionality • Allows users to select a location and explore maps that show people, places, and natural resources exposed to coastal flood hazards
• Creates a collection of maps to download or share online to communi-cate flood exposure
• Provides guidance for using the maps to engage community mem-bers and stakeholders in conversations about potential coastal flood impacts
• Offers access to map services and tips on using them in an online mapping platform
Input data requirements
Outputs Visualizes• Coastal flood-hazard composite• Shallow coastal flooding• FEMA flood zones• Storm surge• SLR
User interface Interactive mapping website
Suitability for DHS and Flood APEX
Uncertainty and climate change None present
Portability Could be applied more broadly
Potentially valuable to DHS? • Probably not• Nice visualization but nothing more than current conditions
SOURCE: Office for Coastal Management, 2017a.

Summary Tables 85
Table A.20STORMTOOLS
Aspect Description
Lead organization or author Rhode Island Shoreline Change Special Area Management Plan, Rhode Island Coastal Resources Management Council, URI, Rhode Island Sea Grant, Rhode Island GIS
Locations where applied Rhode Island
Motivation for development • “STORMTOOLS for beginners is a one-map stop for all residents of Rhode Island to better understand their risk from coastal inundation.”
• “STORMTOOLS for Municipalities is a one-map stop for Rhode Island’s municipal officials and decision makers of Rhode Island to better understand their risk from coastal inundation. This map provides information on flooding impacts from storms and sea level rise, as well as information on the location of critical infrastructure, coastal structures and population density” (Rhode Island Coastal Resources Management Council, undated).
Functionality Visualization of• SLR projections• Location-of-rise projections• Confidence of SLR predictions• Critical community facilities
Input data requirements • Uses data from sources• URI, Narragansett, Rhode Island Coastal Resources Center; URI, Narra-
gansett, Environmental Data Center; and more
Outputs
User interface • Interactive website• Simple interface• Overlays various maps on imagery, street map, or topographic base• Provides links to additional information
Suitability for DHS and Flood APEX
Uncertainty and climate change • Limited to 7 categories with respect to SLR• Population density graphics
Portability Obtaining data could present difficulty
Potentially valuable to DHS? • Potentially for communication• Useful tool for visualizing commonly available data• Little functionality beyond this
SOURCES: Rhode Island Shoreline Change Special Area Management Plan, undated; Rhode Island Coastal Resources Management Council, undated.
NOTE: URI = University of Rhode Island.

86 Landscape Survey to Support Flood Apex National Flood Decision Support Toolbox
Table A.21Risk Assessment for Systems Planning Decision Support
Aspect Description
Lead organization or author FLOODsite
Locations where applied Europe
Motivation for development “[E]nables decision makers to integrate multiple and complex relationships between natural hazards, social and economic vulnerability, the impact of measures and instruments for risk mitigation (infrastructure provision, vulnerability reduction) in support of planning risk management in the long term).”
Functionality • “The frameworks are enacted within a prototype decision support tool . . . .”
• Gives “strategic alternatives,” including• Do nothing• Resistant• Resilient• Highly resilient
• Provides scenarios, including• Socioeconomic conditions• Climate based
Input data requirements Inputs are based on user input to a database
Outputs • Able to look at flood risk areas• Flood defenses• Flood control gates
User interface • Interactive website• Simple interface• Overlays information on satellite map; includes streets, topography
Suitability for DHS and Flood APEX
Uncertainty and climate change Changes to the sources of risk• Climate change• SLR• population growth• “[M]acro-economic developments”
Portability Data used are not clearly available by source.
Potentially valuable to DHS? • Potentially for framing a problem• Useful for framing risk in a social, economic, or ecological context• Little functionality beyond this
SOURCE: FLOODsite, undated (b).

Summary Tables 87
Environmental Assessment
Table A.22Natural Capital Project InVEST
Aspect Description
Lead organization or author Natural Capital Project of Stanford University and the University of Minnesota
Locations where applied
Motivation for development • “Governments, non-profits, international lending institutions, and corporations all manage natural resources for multiple uses and inevi-tably must evaluate tradeoffs among them. The multi-service, modu-lar design of InVEST provides an effective tool for balancing the envi-ronmental and economic goals of these diverse entities.”
• “InVEST enables decision makers to assess quantified tradeoffs asso-ciated with alternative management choices and to identify areas where investment in natural capital can enhance human development and conservation.”
Functionality • “The toolset currently includes eighteen distinct ecosystem service models designed for terrestrial, freshwater, marine, and coastal eco-systems, as well as a number of ‘helper tools’ to assist with locating and processing input data and with understanding and visualizing outputs.”
• Visualize the following:• Fisheries• Coastal protection• Coastal vulnerabilities• Nearshore waves and erosion• Sediment retention
Input data requirements “Based on production functions that define how changes in an ecosystem’s structure and function are likely to affect the flows and values of ecosystem services across a land- or a seascape.”
Outputs “Outputs can help decision-makers weigh potential conflicts among spatially-explicit management options that involve new activities or new infrastructure.”
User interface • Interactive website• Simple interface• Overlays various basic boundary maps• “[S]patially-explicit, using maps as information sources and producing
maps as outputs.”
Suitability for DHS and Flood APEX
Uncertainty and climate change • Includes a scenario generator• Sediment and nutrient model parameters• Deterministic spatial data inputs provided• Does not seem to explicitly represent uncertainty
Portability Data availability issues could present difficulty.
Potentially valuable to DHS? Yes, useful tool for visualizing data
SOURCE: Natural Capital Project, undated.
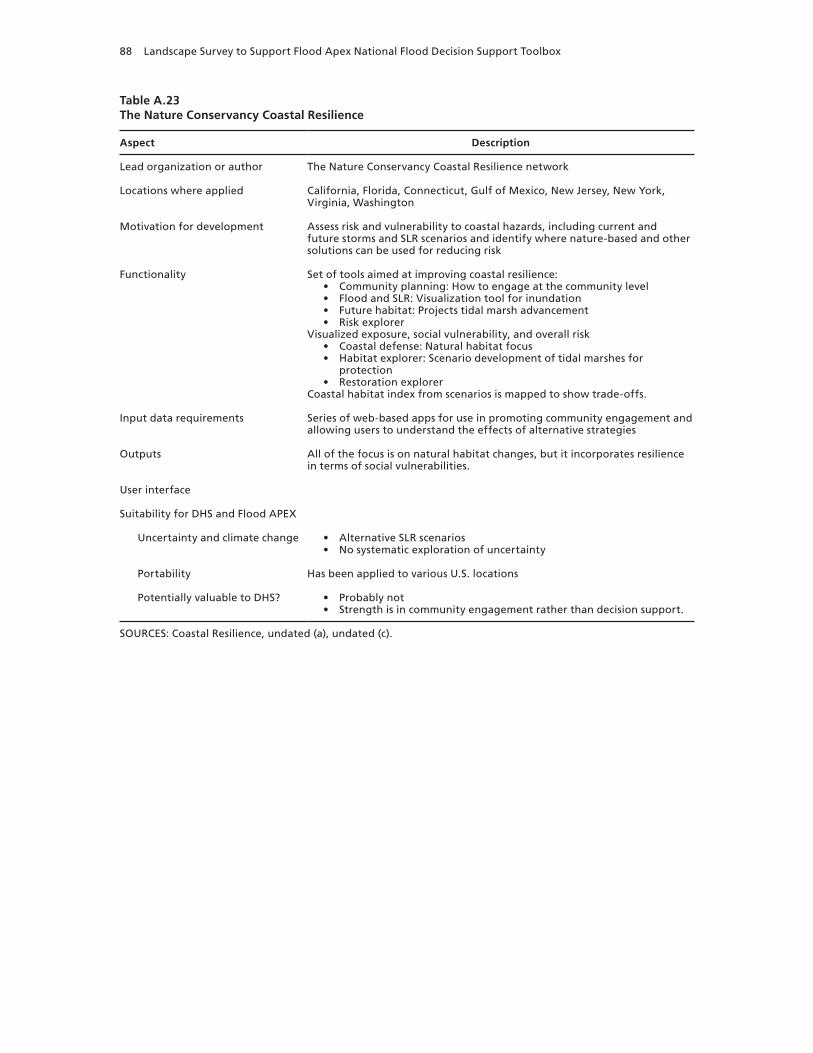
88 Landscape Survey to Support Flood Apex National Flood Decision Support Toolbox
Table A.23The Nature Conservancy Coastal Resilience
Aspect Description
Lead organization or author The Nature Conservancy Coastal Resilience network
Locations where applied California, Florida, Connecticut, Gulf of Mexico, New Jersey, New York, Virginia, Washington
Motivation for development Assess risk and vulnerability to coastal hazards, including current and future storms and SLR scenarios and identify where nature-based and other solutions can be used for reducing risk
Functionality Set of tools aimed at improving coastal resilience:• Community planning: How to engage at the community level• Flood and SLR: Visualization tool for inundation• Future habitat: Projects tidal marsh advancement• Risk explorer
Visualized exposure, social vulnerability, and overall risk• Coastal defense: Natural habitat focus• Habitat explorer: Scenario development of tidal marshes for
protection• Restoration explorer
Coastal habitat index from scenarios is mapped to show trade-offs.
Input data requirements Series of web-based apps for use in promoting community engagement and allowing users to understand the effects of alternative strategies
Outputs All of the focus is on natural habitat changes, but it incorporates resilience in terms of social vulnerabilities.
User interface
Suitability for DHS and Flood APEX
Uncertainty and climate change • Alternative SLR scenarios• No systematic exploration of uncertainty
Portability Has been applied to various U.S. locations
Potentially valuable to DHS? • Probably not• Strength is in community engagement rather than decision support.
SOURCES: Coastal Resilience, undated (a), undated (c).
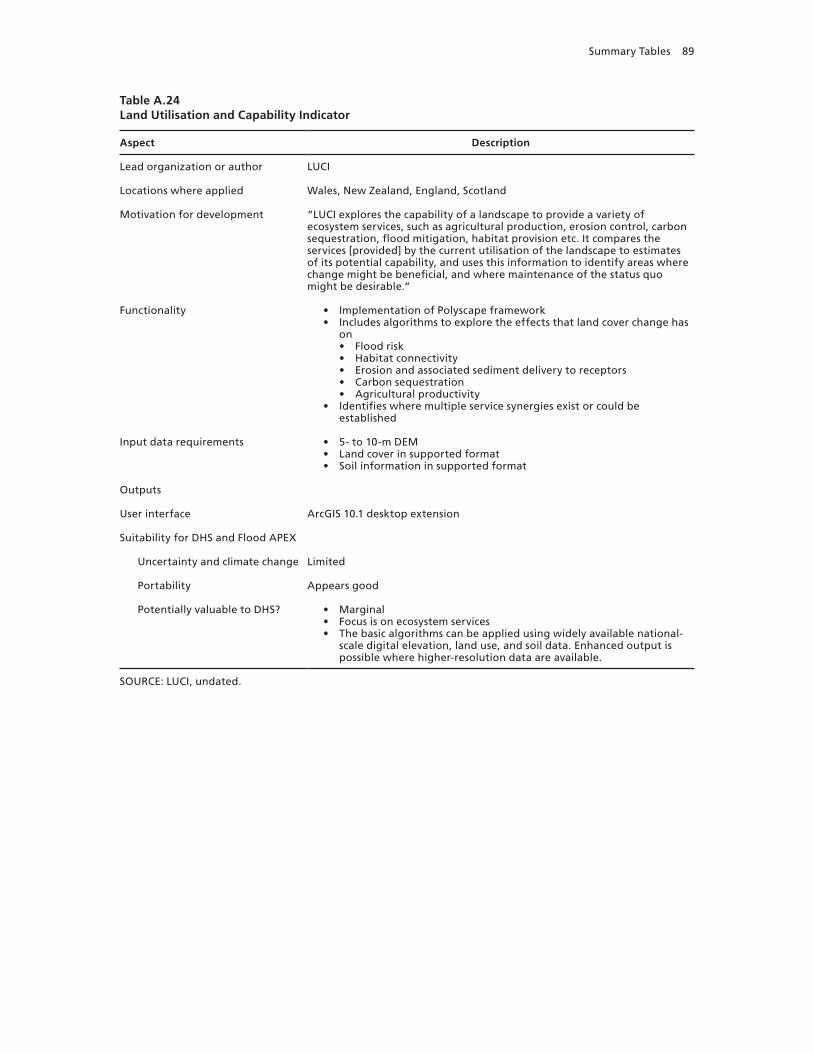
Summary Tables 89
Table A.24Land Utilisation and Capability Indicator
Aspect Description
Lead organization or author LUCI
Locations where applied Wales, New Zealand, England, Scotland
Motivation for development “LUCI explores the capability of a landscape to provide a variety of ecosystem services, such as agricultural production, erosion control, carbon sequestration, flood mitigation, habitat provision etc. It compares the services [provided] by the current utilisation of the landscape to estimates of its potential capability, and uses this information to identify areas where change might be beneficial, and where maintenance of the status quo might be desirable.”
Functionality • Implementation of Polyscape framework• Includes algorithms to explore the effects that land cover change has
on• Flood risk• Habitat connectivity• Erosion and associated sediment delivery to receptors• Carbon sequestration• Agricultural productivity
• Identifies where multiple service synergies exist or could be established
Input data requirements • 5- to 10-m DEM• Land cover in supported format• Soil information in supported format
Outputs
User interface ArcGIS 10.1 desktop extension
Suitability for DHS and Flood APEX
Uncertainty and climate change Limited
Portability Appears good
Potentially valuable to DHS? • Marginal• Focus is on ecosystem services• The basic algorithms can be applied using widely available national-
scale digital elevation, land use, and soil data. Enhanced output is possible where higher-resolution data are available.
SOURCE: LUCI, undated.

90 Landscape Survey to Support Flood Apex National Flood Decision Support Toolbox
Table A.25New Hampshire Department of Environmental Services Wetland Restoration Assessment Model
Aspect Description
Lead organization or author NHDES
Locations where applied New Hampshire
Motivation for development • “The WRAM tool serves as a model approach for wetland programs seeking a low-cost GIS-based method for prioritizing compensatory mitigation sites due to its emphasis on achieving functional uplift and sustainability at restoration sites.”
• “Of these 14 functions and values, the [technical advisory group] selected those that could be readily measured using available GIS data to obtain five total parameters for this Net Functional Benefit analysis.”
Functionality Prioritize based on• Habitat quality• Flood damage mitigation• Groundwater supply• Water quality
“Net Functional Benefit score was calculated based on the ‘NH Method,’ a well-established tool used to evaluate 14 functions and values based on a set of parameters for each.”
Input data requirements • “GIS data of known origin”• National Wetlands Inventory• New Hampshire Land Cover Assessment data
Outputs • Restorative condition score• Site prioritization
User interface
Suitability for DHS and Flood APEX
Uncertainty and climate change • Uncertainty does not appear to be taken into account• Acknowledgment that estimates link directly to data taken, which
might have errors
Portability Specific to the landscapes of New Hampshire
Potentially valuable to DHS? • Probably not• Methodology can be followed by DHS but would have to be manipu-
lated for each region.• Lot of effort to change the model into a widely applicable tool• Uses widely used GIS tools
SOURCE: NHDES, 2012.

Summary Tables 91
Table A.26Watershed Resources Registry Riparian Zone Restoration Suitability Model
Aspect Description
Lead organization or author Maryland Watershed Resources Registry
Locations where applied Maryland
Motivation for development • Natural stormwater infrastructure preservation tool• “[R]ates the suitability of each 30m2 area throughout the state for
riparian zone restoration by scoring and combining data layers rep-resenting a variety [of] relevant features (e.g., ‘in a Biological Restor-ative Initiative watershed’)” (Environmental Law Institute and Nature Conservancy, 2014, p. 116).
Functionality • Prioritizes• Groundwater supply• Flood damage mitigation
• Multiobjective tool• Aimed primarily at wetland preservation and reconstruction
• Flood damage mitigation is a benefit of this.
Input data requirements • Digital FIRMs• Maryland Department of the Environment data• Maryland Department of Natural Resources data• 2010 Integrated Report of Surface Water Quality in Maryland (Mary-
land Department of the Environment, 2010)
Outputs “This final score for the model is converted to a ranking of 1–5, which can be queried as part of an interactive map” (Environmental Law Institute and Nature Conservancy, 2014, p. 116).
User interface
Suitability for DHS and Flood APEX
Uncertainty and climate change Uncertainty does not appear to be taken into account.
Portability Specific to the landscapes of Maryland
Potentially valuable to DHS? • Potentially• Methodology can be followed by DHS but would have to be manipu-
lated for each region.• Lot of effort to change the model into a widely applicable tool
SOURCES: Watershed Resources Registry, undated; Environmental Law Institute and Nature Conservancy, 2014.

92 Landscape Survey to Support Flood Apex National Flood Decision Support Toolbox
Emergency Management
Table A.27HURREVAC
Aspect Description
Lead organization or author National Hurricane Program, administered by FEMA, USACE, and the NOAA National Hurricane Center
Locations where applied
Motivation for development “HURREVAC (short for Hurricane Evacuation) is a storm tracking and decision support tool. The program combines live feeds of tropical cyclone forecast information with data from various state Hurricane Evacuation Studies (HES) to assist the local emergency manager in determining the most prudent evacuation decision time and the potential for significant storm effects such as wind and storm surge” (HURREVAC, undated [b]).
Functionality • Inland Flood Planning and Response Tool• Tracks hurricanes using National Hurricane Center’s forecast
advisories• HURREVAC translates forecast track and wind extent information into
interactive maps and reports.• Combines live feeds of tropical cyclone forecast information with
data from various state and local sources to assist the local emergency manager
Input data requirements • National Hurricane Center’s forecast advisories• Hurricane evacuation study for the county or parish of interest
Outputs • Warning time for evacuation• Last possible time by which an evacuation could be initiated
User interface
Suitability for DHS and Flood APEX
Uncertainty and climate change Possible uncertainties incorporated in National Hurricane Center forecast
Portability • Widely applied to relevant areas• Program access restricted to officials in government emergency
management
Potentially valuable to DHS? Yes, useful only in hurricane context
SOURCES: HURREVAC, undated (a), undated (b).

Summary Tables 93
Table A.28Open Flood Risk Map
Aspect Description
Lead organization or author Institute of Geography, Universität Heidelberg
Locations where applied Europe, Nepal
Motivation for development “The aim of this project is to support municipalities in developing local flood emergency response plans with the aid of freely available spatial data from OpenStreetmapMap [sic] (OSM). This approach will help to facilitate and implement the integration of engaged citizens. Within the project, a process model and a technical implementation shall be developed and put into effect. This will allow it to blend official flood hazard maps with free geodata (OSM)[;] thus local authorities and civil advocates are provided with an efficient means of identifying critical infrastructure within the meaning of the Europen [sic] Flood Risk Management Directive.”
Functionality • Focused on emergency management• Identification of critical infrastructure and dynamic maps based on
open-source geospatial data• Routing for access to and from critical infrastructure
Input data requirements Geospatial mapping of critical infrastructure
Outputs Route finding for point-to-point trips
User interface
Suitability for DHS and Flood APEX
Uncertainty and climate change None, emergency management during event
Portability Seems to be portable given data and OSM availability for location
Potentially valuable to DHS? Yes, for emergency management of transportation to and from critical infrastructure
SOURCE: Institute of Geography, 2016.

94 Landscape Survey to Support Flood Apex National Flood Decision Support Toolbox
Table A.29Deltares Flood Early Warning System
Aspect Description
Lead organization or author Deltares
Locations where applied Numerous locations worldwide
Motivation for development “Delft-FEWS is an open data handling platform initially developed as a hydrological forecasting and warning system. Essentially it is a sophisticated collection of modules designed for building a hydrological forecasting system customised to the specific requirements of an individual organisation. Because of its unique characteristics concerning data importing and processing and model connections, Delft-FEWS has also been applied in a wide range of different operational situations. Examples are water quality forecasting, reservoir management, operational sewer management optimization, and even peat fire prediction” (Deltares, undated [a]).
Functionality • Data management• Open architecture allows for swapping of models and forecasts• Built on extensible markup language architecture
Input data requirements • Meteorological and hydrologic• Weather predictions• Can develop input scenarios
Outputs Mostly used as a means of real-time flood forecasting
User interface
Suitability for DHS and Flood APEX
Uncertainty and climate change Has been used to quantify uncertainty of impacts in England and Wales
Portability Designed to be used everywhere
Potentially valuable to DHS? Yes, a great starting point for construction in terms of swappable models and modules
SOURCES: Deltares, undated (a), undated (b).

Summary Tables 95
Table A.30Quanzhou Flood Prevention Information System
Aspect Description
Lead organization or author Huang, Lin, and Zheng, 2013
Locations where applied Quanzhou City, China
Motivation for development “A DSS based on GIS is designed to satisfy the need of flood control in Quanzhou. This system utilizes GIS, [remote sensing], artificial intelligence and computer network technique. And it is a comprehensive system including precipitation, flow and engineering information. This system integrates disaster forecast, visual meeting of flood control, and damage evaluation together” (p. 51).
Functionality Published documentation describes a large, integrated DSS.• Field sensors for weather and streamflow• 2D flood prediction model• Flood control strategy• Evacuation model• Loss evaluation
Description is brief and incomplete.• Difficult to evaluate scope of actual system from published accounts
Input data requirements • Real-time sensor data• Hydraulic database (various water features)• Social and economic database (e.g., population demographics, land
use, communal facilities)
Outputs • Maps, predictions, warnings• Not clearly specified in available documentation
User interface Appears to be a large, networked system
Suitability for DHS and Flood APEX
Uncertainty and climate change • Focused on short-term prediction and response• Focused on current situation• Limited handling of uncertainty
Portability Limited
Potentially valuable to DHS? • Probably not• Very limited documentation written with limited English skills make it
difficult to learn from this.• Full scope of system is hard to glean from published documents.
SOURCE: Huang, Lin, and Zheng, 2013.

96 Landscape Survey to Support Flood Apex National Flood Decision Support Toolbox
Table A.31U.S. Army Corps of Engineers Water Management System
Aspect Description
Lead organization or author USACE’s 35 corps district and division offices
Locations where applied
Motivation for development “This mission encompasses the regulation of river flow through more than 700 reservoirs, locks, and other water control structures located throughout the Nation.”
Functionality Integrated system of hardware and software• Begins with hydromet, watershed, and project status data• Data processed, stored, and made available through a user-friendly
interface to the water manager to evaluate and model the watershedModel and processed data can be displayed and disseminated in tabular, graphical, or geospatial form, resulting in an effective DSS.
Input data requirements Real-time input data include• river stage, reservoir elevation, gage precipitation, Weather Surveil-
lance Radar 88 Doppler spatial precipitation, quantitative precipita-tion forecasts, and other hydrometeorological parameters
Outputs Derived outputs:• Hydrologic response throughout a watershed area, including short-
term future reservoir inflows and local uncontrolled downstream flows.
• Proposed releases to meet reservoir and downstream operation goals• River profiles• Inundated area maps• Analysis of flood impacts
User interface
Suitability for DHS and Flood APEX
Uncertainty and climate change Real time
Portability Used in more than 35 different districts and divisions
Potentially valuable to DHS? • Yes• From an emergency management perspective, might be valuable, and
architecture allows for experimentation to come to a decision• Idea is good and could be modified to other situations
SOURCE: HEC, undated (a).

Summary Tables 97
Table A.32Colorado Flood Decision Support System
Aspect Description
Lead organization or author NOAA Office for Coastal Management
Locations where applied Colorado
Motivation for development In 2006, the Colorado Water Conservation Board and Riverside Technology developed a prototype flood DSS. As a result of this successful implementation, the Colorado Water Conservation Board has now moved forward with developing a statewide flood DSS to serve as a clearinghouse of flood information for a variety of users.
Functionality • Statewide clearinghouse of flood-hazard and related information• Flood mapping viewer• Daily assessment of flood potential around the state
Input data requirements
Outputs • Real-time snowpack and streamflow• Data are all historical, not forward looking.
User interface Website that contains flood mapping and historical flood materials in addition to mapping
Suitability for DHS and Flood APEX
Uncertainty and climate change None, historical
Portability Extremely portable to other locations
Potentially valuable to DHS? • Potentially• Has no spatial data access to give context and pictures to past floods• Could be good as a risk communication tool
SOURCE: Colorado’s Flood Decision Support System, undated.

98 Landscape Survey to Support Flood Apex National Flood Decision Support Toolbox
Table A.33Flood Integrated Decision Support System, Melbourne
Aspect Description
Lead organization or author Flood Integrated DSS
Locations where applied Melbourne Water, Melbourne, Australia
Motivation for development “[T]o integrate [Melbourne Water]’s telemetry systems, [Unified River Basin Simulator] hydrologic models, and flood maps with the latest Nowcast Products from the Bureau of Meteorology (BoM). The benefits [of] real-time flood predictions . . . enable [Melbourne Water] to raise faster, more precise flood warnings via the [Bureau of Meteorology] and FloodZoom, which will allow the State Emergency Services and flood prone residents to take early action to mitigate the impacts of flooding.”
Functionality • Integrated weather, hydrologic, and damage prediction system• Aimed at flood warning and response, rather than long-term
planning.• Based on Delft-FEWS hydrologic forecasting system from Netherlands
Input data requirements • Real-time sensor data• Weather forecast data• Extensive GIS data• Population and demographic data• Land use data
Outputs • Flood prediction maps• Flood alerts and warnings
User interface Large, networked system
Suitability for DHS and Flood APEX
Uncertainty and climate change Focused on short-term prediction and response
Portability Moderate
Potentially valuable to DHS? • Potentially• Good example of highly integrated flood forecasting and response
tool• Not aimed at planning and investment decision support
SOURCE: Kirby, 2015.

Summary Tables 99
Table A.34Munsan City, Korea, Decision Support System
Aspect Description
Lead organization or author Climate Change Research, National Disaster Management Institute, Korea
Locations where applied Munsan City, Korea
Motivation for development “The Munsan City area, where there were three big inundation damages in 1996, 1998 and 1999, respectively, is selected to test the developed decision model” (p. 198).
Functionality • Inundation, discharge, and velocity modeled together with damage• 3D hydrodynamic model from Reynolds-averaged form of Navier–
Stokes equations
Input data requirements Meteorological, hydrologic, land use, and buildings
Outputs • Inundation, discharge, velocity, and damage from particular storms and discharge
• Routes to shelters and critical infrastructure for disaster management
User interface Little interaction other than scenario development
Suitability for DHS and Flood APEX
Uncertainty and climate change Developed through scenarios about the future in both discharge or precipitation and development
Portability Relatively portable given the minimal data requirements and a general hydrologic model
Potentially valuable to DHS? Nothing very different from other tools for visualization and damage modeling
SOURCE: Cheong, 2012.

100 Landscape Survey to Support Flood Apex National Flood Decision Support Toolbox
Project Evaluation
Table A.35Coastal Louisiana Risk Assessment Model
Aspect Description
Lead organization or author RAND Corporation
Locations where applied Coastal Louisiana
Motivation for development “[T]o facilitate comparisons of current and future flood risk under a variety of protection system configurations in a wide range of environmental, operational, and economic uncertainties. . . . incorporating system fragility and a larger number of future scenarios than previously analyzed” (Johnson, Fischbach, and Ortiz, 2013, p. 109).
Functionality • Large, integrated research model aimed at exploring flood risk, damage, and uncertainty in the present environment as well as 25 and 50 years in the future
• Translates storm surge scenarios into flooding depth and damage maps and estimates
• Uses series of modules and methods• Storm surge, wave overtopping, protection system fragility, interior
drainage• Asset inventory, valuation, and damage assessment; demographic and
land use change
Input data requirements
Outputs • Flood depth• 50-, 100-, and 500-year flood areas at the census-block level• Damage to structures, infrastructure, and other economic assets
User interface • Model not as yet designed for distribution to end users• Robust ability to explore alternative risk scenarios and management
approaches
Suitability for DHS and Flood APEX
Uncertainty and climate change • 25- and 50-year projections of climate change• Couples with planning tool for extremely robust treatment of uncer-
tainty over hundreds of scenarios
Portability Moderate; would require considerable data collection, but much of model would port
Potentially valuable to DHS? • Yes• Model and associated planning tool allow in-depth analysis of scenar-
ios and alternatives to identify robust management options.
SOURCE: Fischbach et al., 2012.

Summary Tables 101
Table A.36Autocase
Aspect Description
Lead organization or author Impact Infrastructure
Locations where applied Tucson, Fort Worth, Toronto
Motivation for development “AutoCASE is a web-based valuation tool with the primary purpose of producing risk-adjusted, dollar-based metrics for infrastructure projects and buildings based on their costs, benefits, and sustainable design features. It is designed to be run early and often through the feasibility, planning, design, and construction stages of a project, and it can be used with minimal information, drawing on standard, regionally-specific inputs and best practice data” (Impact Infrastructure, undated).
Functionality • Sustainable return-on-investment calculator• Integration with AutoCAD Civil 3D
Input data requirements Either rough outline of project or full project design
Outputs • Sustainable return on investment• Sustainable net present value• Recreational value
User interface Web based
Suitability for DHS and Flood APEX
Uncertainty and climate change Full risk analysis
Portability Designed to be used around the world
Potentially valuable to DHS? Might be difficult for communities to use the tool to consider trade-offs but provides a different picture from that of many of the other tools, including a greater focus on sustainability
SOURCES: Parker, 2016; Autocase, undated; Impact Infrastructure, undated.
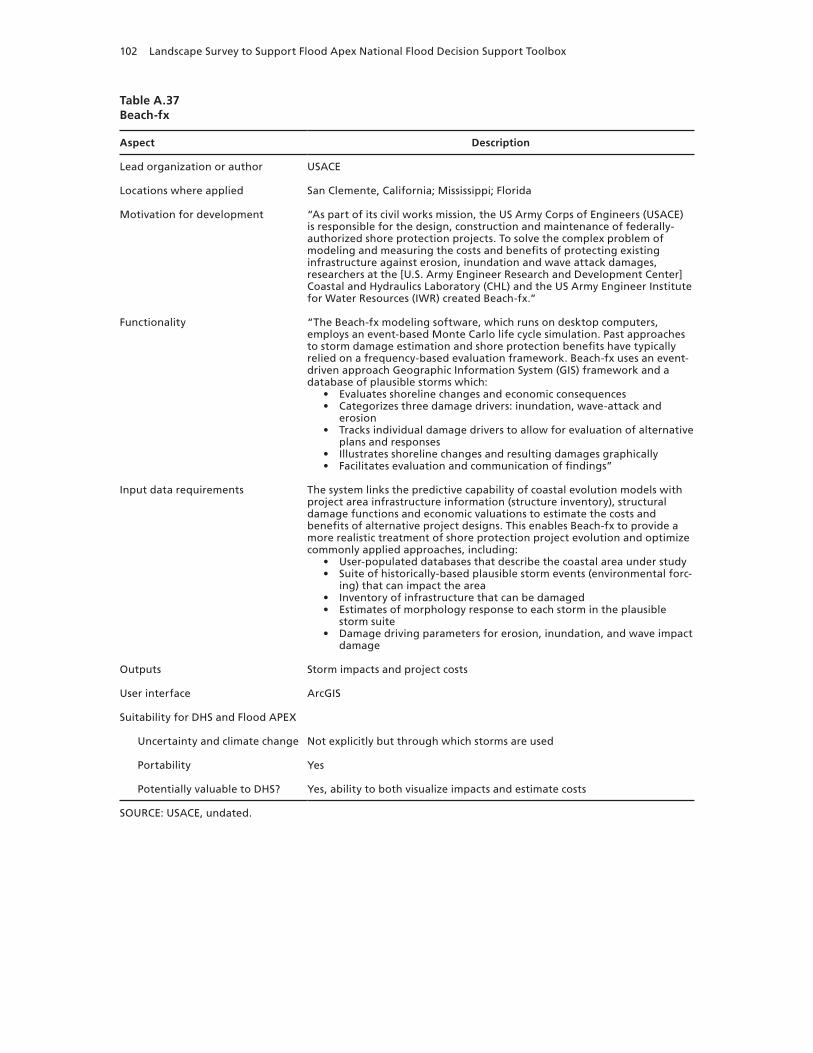
102 Landscape Survey to Support Flood Apex National Flood Decision Support Toolbox
Table A.37Beach-fx
Aspect Description
Lead organization or author USACE
Locations where applied San Clemente, California; Mississippi; Florida
Motivation for development “As part of its civil works mission, the US Army Corps of Engineers (USACE) is responsible for the design, construction and maintenance of federally-authorized shore protection projects. To solve the complex problem of modeling and measuring the costs and benefits of protecting existing infrastructure against erosion, inundation and wave attack damages, researchers at the [U.S. Army Engineer Research and Development Center] Coastal and Hydraulics Laboratory (CHL) and the US Army Engineer Institute for Water Resources (IWR) created Beach-fx.”
Functionality “The Beach-fx modeling software, which runs on desktop computers, employs an event-based Monte Carlo life cycle simulation. Past approaches to storm damage estimation and shore protection benefits have typically relied on a frequency-based evaluation framework. Beach-fx uses an event-driven approach Geographic Information System (GIS) framework and a database of plausible storms which:
• Evaluates shoreline changes and economic consequences• Categorizes three damage drivers: inundation, wave-attack and
erosion• Tracks individual damage drivers to allow for evaluation of alternative
plans and responses• Illustrates shoreline changes and resulting damages graphically• Facilitates evaluation and communication of findings”
Input data requirements The system links the predictive capability of coastal evolution models with project area infrastructure information (structure inventory), structural damage functions and economic valuations to estimate the costs and benefits of alternative project designs. This enables Beach-fx to provide a more realistic treatment of shore protection project evolution and optimize commonly applied approaches, including:
• User-populated databases that describe the coastal area under study• Suite of historically-based plausible storm events (environmental forc-
ing) that can impact the area• Inventory of infrastructure that can be damaged• Estimates of morphology response to each storm in the plausible
storm suite• Damage driving parameters for erosion, inundation, and wave impact
damage
Outputs Storm impacts and project costs
User interface ArcGIS
Suitability for DHS and Flood APEX
Uncertainty and climate change Not explicitly but through which storms are used
Portability Yes
Potentially valuable to DHS? Yes, ability to both visualize impacts and estimate costs
SOURCE: USACE, undated.
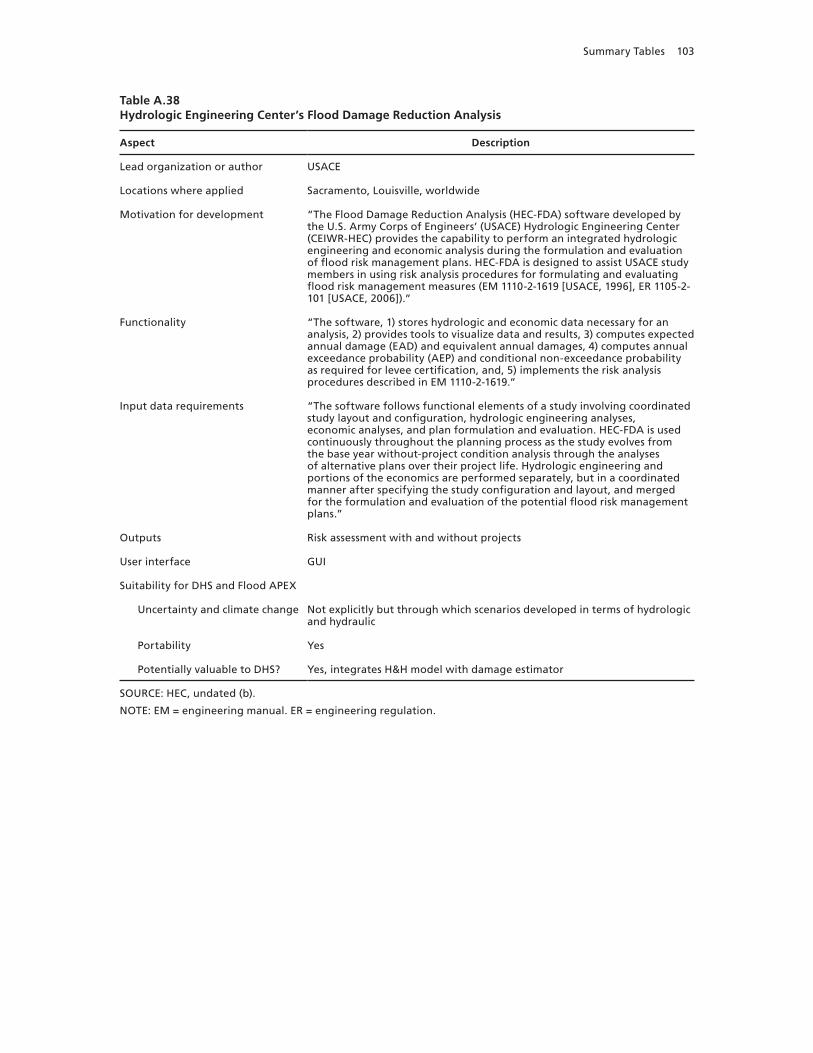
Summary Tables 103
Table A.38Hydrologic Engineering Center’s Flood Damage Reduction Analysis
Aspect Description
Lead organization or author USACE
Locations where applied Sacramento, Louisville, worldwide
Motivation for development “The Flood Damage Reduction Analysis (HEC-FDA) software developed by the U.S. Army Corps of Engineers’ (USACE) Hydrologic Engineering Center (CEIWR-HEC) provides the capability to perform an integrated hydrologic engineering and economic analysis during the formulation and evaluation of flood risk management plans. HEC-FDA is designed to assist USACE study members in using risk analysis procedures for formulating and evaluating flood risk management measures (EM 1110-2-1619 [USACE, 1996], ER 1105-2-101 [USACE, 2006]).”
Functionality “The software, 1) stores hydrologic and economic data necessary for an analysis, 2) provides tools to visualize data and results, 3) computes expected annual damage (EAD) and equivalent annual damages, 4) computes annual exceedance probability (AEP) and conditional non-exceedance probability as required for levee certification, and, 5) implements the risk analysis procedures described in EM 1110-2-1619.”
Input data requirements “The software follows functional elements of a study involving coordinated study layout and configuration, hydrologic engineering analyses, economic analyses, and plan formulation and evaluation. HEC-FDA is used continuously throughout the planning process as the study evolves from the base year without-project condition analysis through the analyses of alternative plans over their project life. Hydrologic engineering and portions of the economics are performed separately, but in a coordinated manner after specifying the study configuration and layout, and merged for the formulation and evaluation of the potential flood risk management plans.”
Outputs Risk assessment with and without projects
User interface GUI
Suitability for DHS and Flood APEX
Uncertainty and climate change Not explicitly but through which scenarios developed in terms of hydrologic and hydraulic
Portability Yes
Potentially valuable to DHS? Yes, integrates H&H model with damage estimator
SOURCE: HEC, undated (b).
NOTE: EM = engineering manual. ER = engineering regulation.
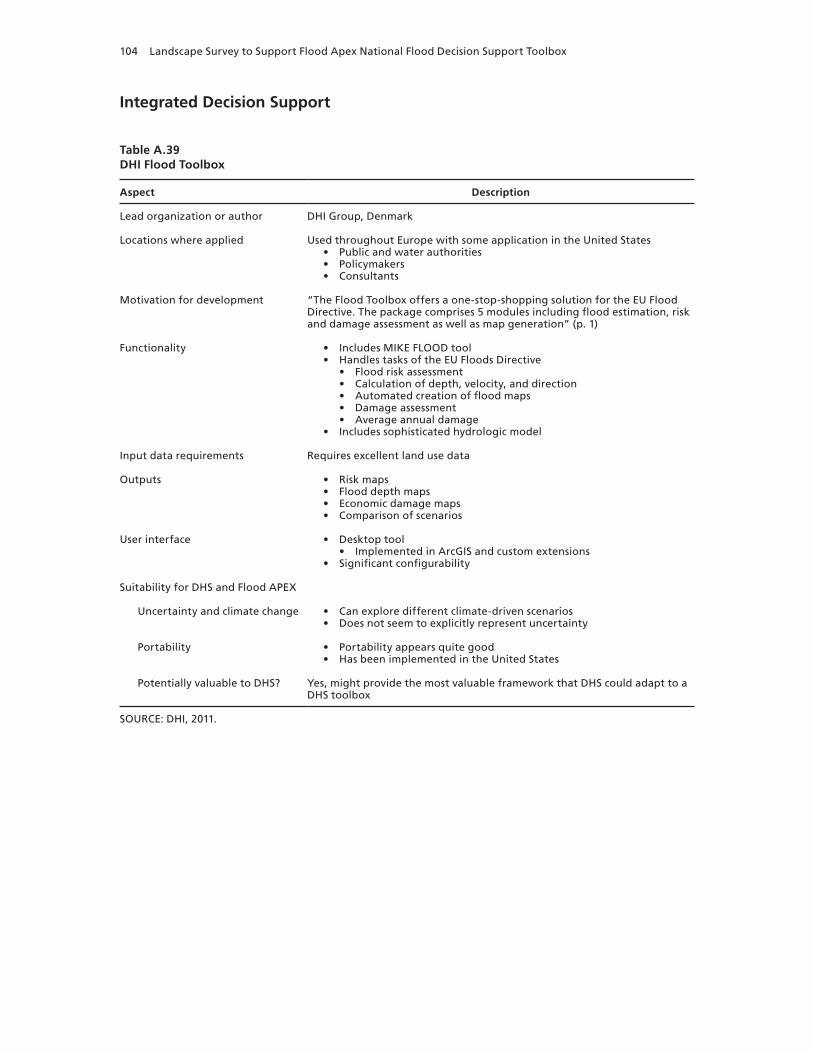
104 Landscape Survey to Support Flood Apex National Flood Decision Support Toolbox
Integrated Decision Support
Table A.39DHI Flood Toolbox
Aspect Description
Lead organization or author DHI Group, Denmark
Locations where applied Used throughout Europe with some application in the United States• Public and water authorities• Policymakers• Consultants
Motivation for development “The Flood Toolbox offers a one-stop-shopping solution for the EU Flood Directive. The package comprises 5 modules including flood estimation, risk and damage assessment as well as map generation” (p. 1)
Functionality • Includes MIKE FLOOD tool• Handles tasks of the EU Floods Directive
• Flood risk assessment• Calculation of depth, velocity, and direction• Automated creation of flood maps• Damage assessment• Average annual damage
• Includes sophisticated hydrologic model
Input data requirements Requires excellent land use data
Outputs • Risk maps• Flood depth maps• Economic damage maps• Comparison of scenarios
User interface • Desktop tool• Implemented in ArcGIS and custom extensions
• Significant configurability
Suitability for DHS and Flood APEX
Uncertainty and climate change • Can explore different climate-driven scenarios• Does not seem to explicitly represent uncertainty
Portability • Portability appears quite good• Has been implemented in the United States
Potentially valuable to DHS? Yes, might provide the most valuable framework that DHS could adapt to a DHS toolbox
SOURCE: DHI, 2011.

Summary Tables 105
Table A.40Elbe River Decision Support Tool Part of FLOODsite
Aspect Description
Lead organization or author FLOODsite Consortium of 37 organizations across Europe under the direction of EU Floods
Locations where applied EU
Motivation for development • FLOODsite definition of flood risk management:• “Holistic and continuous societal analysis, assessment and reduc-
tion of flood risk” (FLOODsite, undated [a])• DST to reduce flood risk
• More holistic• Based on resilience and sustainability• Consistent set of tools to be used across Europe
Functionality Flooding (three types):• Rainfall runoff: LISFLOOD (Van Der Knijff, Younis, and De Roo, 2010)• River channel: one-dimensional hydrodynamic-numerical model
WAVOS (Steinebach, 1999; Steinebach et al., 2004)• Inundation: 2d hydrodynamic-numerical surface water model
HYDRO_AS-2D (Nujic, 1995)Damage:
• Hochwasser-Schadens-Simulations-Modell (Neubert, Naumann, and Deilmann, 2009)
Climate: Downscaled climate projections• Statistical and Regional Model (statistical) and regional model
(dynamic)
Input data requirements
Outputs • Flood inundation maps• Damage estimates
User interface Interactive website with limited choices• Simulates flood risks under different scenarios• Examines preselected strategic alternatives• Uses various regional climate models
Suitability for DHS and Flood APEX
Uncertainty and climate change • Limited treatment• Differentiates between resistance and resilience strategies
Portability • Good portability• Requires adaptation to U.S. data
Potentially valuable to DHS? • High value• Excellent example of a reusable tool
SOURCES: FLOODsite, undated (a), undated (d); Van Der Knijff, Younis, and De Roo, 2010; Steinebach, 1999; Steinebach et al., 2004; Nujic, 1995; Neubert, Naumann, and Deilmann, 2009.
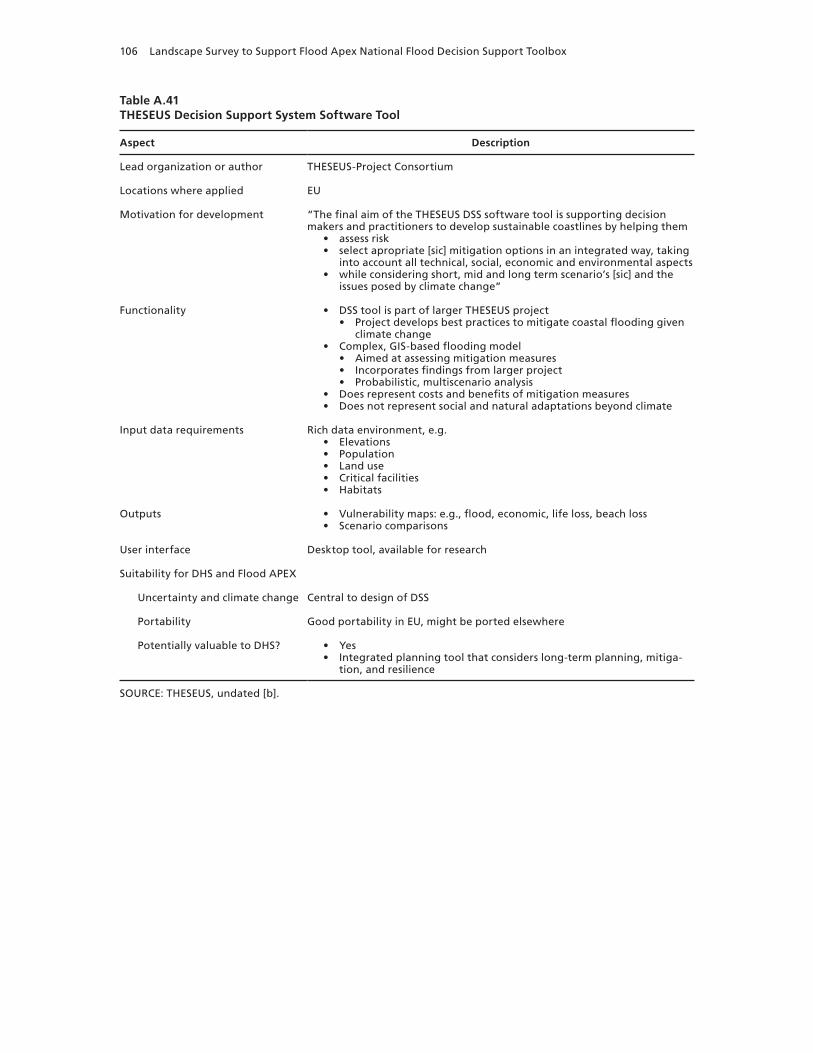
106 Landscape Survey to Support Flood Apex National Flood Decision Support Toolbox
Table A.41THESEUS Decision Support System Software Tool
Aspect Description
Lead organization or author THESEUS-Project Consortium
Locations where applied EU
Motivation for development “The final aim of the THESEUS DSS software tool is supporting decision makers and practitioners to develop sustainable coastlines by helping them
• assess risk• select apropriate [sic] mitigation options in an integrated way, taking
into account all technical, social, economic and environmental aspects• while considering short, mid and long term scenario’s [sic] and the
issues posed by climate change”
Functionality • DSS tool is part of larger THESEUS project• Project develops best practices to mitigate coastal flooding given
climate change• Complex, GIS-based flooding model
• Aimed at assessing mitigation measures• Incorporates findings from larger project• Probabilistic, multiscenario analysis
• Does represent costs and benefits of mitigation measures• Does not represent social and natural adaptations beyond climate
Input data requirements Rich data environment, e.g.• Elevations• Population• Land use• Critical facilities• Habitats
Outputs • Vulnerability maps: e.g., flood, economic, life loss, beach loss• Scenario comparisons
User interface Desktop tool, available for research
Suitability for DHS and Flood APEX
Uncertainty and climate change Central to design of DSS
Portability Good portability in EU, might be ported elsewhere
Potentially valuable to DHS? • Yes• Integrated planning tool that considers long-term planning, mitiga-
tion, and resilience
SOURCE: THESEUS, undated [b].

Summary Tables 107
Table A.42Modelling and Decision Support Framework 2
Aspect Description
Lead organization or author UK Environment Agency
Locations where applied UK-wide
Motivation for development • “The Modelling and Decision Support Framework [2] (MDSF2) was cre-ated by the Environment Agency to assess flood risk for a wide range of scenarios and flood risk management measures. The software is already used to create national flood risk maps.”
• “[C]urrently best suited are for estuarine or coastal flood risk where properties or agriculture are the dominant receptor type” (Evidence Directorate, 2015, p. 2)
Functionality • Provides evidence on the benefits of applying different strategies in a catchment
• Attributes risk to individual flood defenses• Supports structured scenario management• Graphical interface• Postprocessing tool display:
• Rapid flood spreading model• Wider section visuals
Input data requirements “[C]loser linking of MDSF2 to relevant databases and systems” and allowing the reuse of data (Evidence Directorate, 2015, p. 2).
Outputs • Probability of inundation• Indication of risks• Flood area• Probability of inundation plot• Prioritization of risk areas
User interface
Suitability for DHS and Flood APEX
Uncertainty and climate change • “MDSF2 . . . can explore a large number of scenarios very quickly, making it ideal for probabilistic risk assessments” (Evidence Director-ate, 2015, p. 1).
• User can change defense attributes and water levels to examine cli-mate change impacts.
Portability Data are UK-specific. Principles are portable.
Potentially valuable to DHS? • Good example of a national tool• UK data requirements prevent direct application.• Requires extensive data pre- and postprocessing
SOURCES: UK Environment Agency, 2015; Evidence Directorate, 2015.
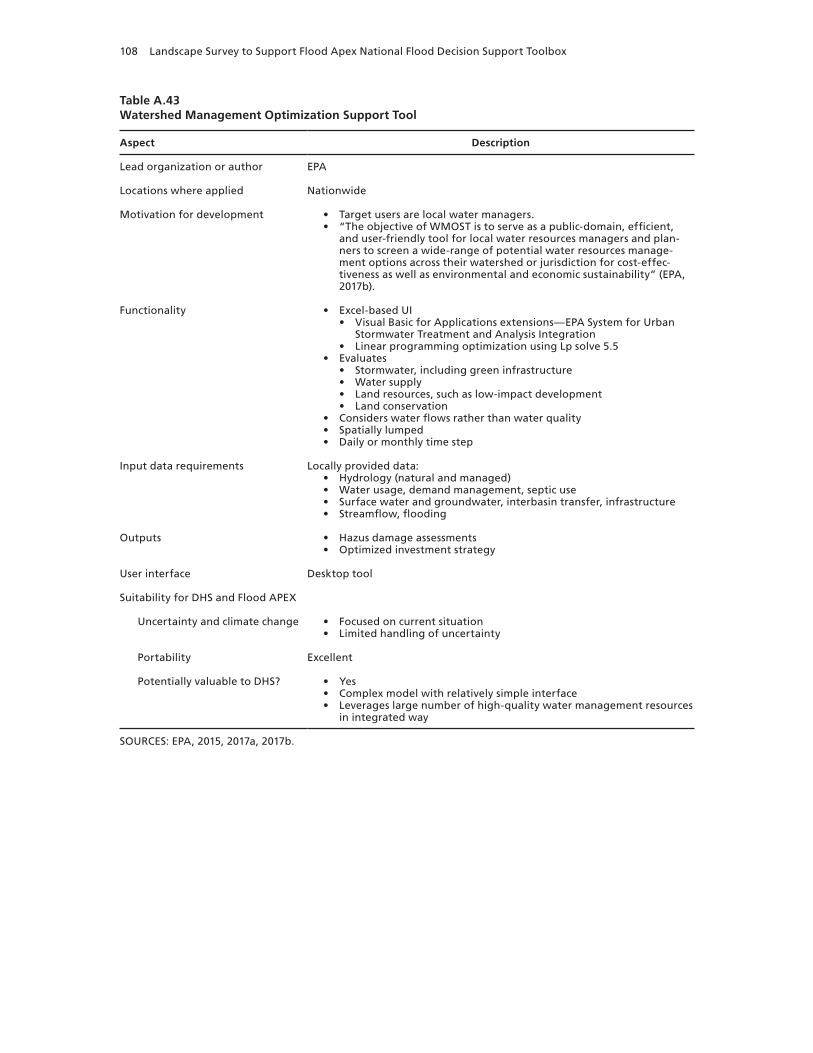
108 Landscape Survey to Support Flood Apex National Flood Decision Support Toolbox
Table A.43Watershed Management Optimization Support Tool
Aspect Description
Lead organization or author EPA
Locations where applied Nationwide
Motivation for development • Target users are local water managers.• “The objective of WMOST is to serve as a public-domain, efficient,
and user-friendly tool for local water resources managers and plan-ners to screen a wide-range of potential water resources manage-ment options across their watershed or jurisdiction for cost-effec-tiveness as well as environmental and economic sustainability” (EPA, 2017b).
Functionality • Excel-based UI• Visual Basic for Applications extensions—EPA System for Urban
Stormwater Treatment and Analysis Integration• Linear programming optimization using Lp solve 5.5
• Evaluates• Stormwater, including green infrastructure• Water supply• Land resources, such as low-impact development• Land conservation
• Considers water flows rather than water quality• Spatially lumped• Daily or monthly time step
Input data requirements Locally provided data:• Hydrology (natural and managed)• Water usage, demand management, septic use• Surface water and groundwater, interbasin transfer, infrastructure• Streamflow, flooding
Outputs • Hazus damage assessments• Optimized investment strategy
User interface Desktop tool
Suitability for DHS and Flood APEX
Uncertainty and climate change • Focused on current situation• Limited handling of uncertainty
Portability Excellent
Potentially valuable to DHS? • Yes• Complex model with relatively simple interface• Leverages large number of high-quality water management resources
in integrated way
SOURCES: EPA, 2015, 2017a, 2017b.

Summary Tables 109
Table A.44Ho Chi Minh City Robust Decisionmaking
Aspect Description
Lead organization or author World Bank; RAND Corporation
Locations where applied Ho Chi Minh City, Nhieu Loc-Thi Nghe catchment, Vietnam
Motivation for development “RDM is an iterative, quantitative, decision support methodology that helps policy makers identify strategies that are robust, satisfying decision makers’ objectives in many plausible futures, rather than optimal in any single best estimate of the future” (p. 2).
Functionality • Presented as a World Bank publication• Uses XLRM analytical framework
• X: exogenous uncertainties (e.g., population, climate)• L: Policy levers—near-term actions to consider• R: Relationships—usually represented by simulation models• M: Metrics—performance metrics of outcomes
• Models• Stormwater management
• GIS analysis• Analytica-based damage model
Input data requirements • Process involved multiple steps• Collaborative scoping with stakeholders• Scenario discovery and trade-off analysis workshops• Model revision and analysis
Outputs • Analysis of robustness of baseline planning• Development of investment strategies that are more robust to
unknown futures
User interface More planning approach than specific tool
Suitability for DHS and Flood APEX
Uncertainty and climate change State-of-the-art method for quantifying uncertainty, including climate change
Portability Moderate. Method can be applied elsewhere, but it is not an out-of-the-box solution.
Potentially valuable to DHS? • Yes• Comprehensive risk planning method• DHS might streamline and standardize the approach.
SOURCE: Lempert, Kalra, et al., 2013.

110 Landscape Survey to Support Flood Apex National Flood Decision Support Toolbox
Table A.45Coastal Protection and Restoration Authority Planning Tool
Aspect Description
Lead organization or author RAND Corporation
Locations where applied Coastal Louisiana
Motivation for development “The Planning Tool provided technical analysis that supported the development of the Master Plan through CPRA and community-based deliberations. This article provides a summary of the Planning Tool and its application in supporting the development of Louisiana’s Master Plan.”
Functionality • Takes the output from the CLARA model and develops the Pareto frontier of projects that are currently under consideration
• Provides project- and portfolio-level trade-off analysis to help inform decisionmakers
Input data requirements
Outputs • Outputs from the CLARA model are used to form the data for the planning tool.• These are extensive geospatial damage data sets that are con-
structed in another risk assessment model.
User interface • This is pretty much a black box to a nonuser.• Trade-off frontiers of projects and portfolios
Suitability for DHS and Flood APEX
Uncertainty and climate change Scenario analysis of thousands of storms and flooding events
Portability Could be used with other flood risk assessment models
Potentially valuable to DHS? • Potentially but requires significant effort for each location• Provides the decisionmakers with trade-offs necessary to making deci-
sions with long-term budgets• Helps in the prioritization and choice of a large number of projects
over a fairly large geography
SOURCE: Groves and Sharon, 2013.

Summary Tables 111
Table A.46Risk Mapping, Assessment and Planning
Aspect Description
Lead organization or author FEMA Risk Mapping, Assessment and Planning Program
Locations where applied Widely used in the United States
Motivation for development “This FEMA program helps communities identify, assess, communicate, and mitigate their flood risk through more precise flood mapping products, risk assessment tools, and support for planning and outreach” (U.S. Climate Resilience Toolkit, 2016).
Functionality • Includes MIKE FLOOD tool• Handles tasks of the EU Floods Directive
• Flood risk assessment• Calculation of depth, velocity, and direction• Automated creation of flood maps• Damage assessment• Average annual damage
• Includes sophisticated hydrologic model
Input data requirements Requires excellent land use data
Outputs • Risk maps• Flood depth maps• Economic damage maps• Comparison of scenarios
User interface • Desktop tool• Implemented in ArcGIS and custom extensions
• Significant configurability
Suitability for DHS and Flood APEX
Uncertainty and climate change • Can explore different climate-driven scenarios• Does not seem to explicitly represent uncertainty
Portability • Portability appears quite good • Has been implemented in the United States
Potentially valuable to DHS? Yes, provides integration between maps and damage together with scenario planning
SOURCES: FEMA, 2017b; U.S. Climate Resilience Toolkit, 2016.

112 Landscape Survey to Support Flood Apex National Flood Decision Support Toolbox
Process
Table A.47Georgetown Adaptation Tool Kit
Aspect Description
Lead organization or author Georgetown Climate Center
Locations where applied Never implemented
Motivation for development “[P]rovides local and state governments and their citizens with practical knowledge to help adapt to sea-level rise in a prudent and balanced manner. After laying out the problem in clear terms, based on current scientific consensus, the Tool Kit offers a menu of generally used legal devices that can reduce future harms” (p. iii).
Functionality • Provides a set of policy tools and their relevance for adapting to SLR• Quick overview of the policy levers available to decisionmakers facing
climate change and SLR
Input data requirements There are no data, just an overview of policy levers.
Outputs
User interface
Suitability for DHS and Flood APEX
Uncertainty and climate change Response to but no analysis of it
Portability It is not place-specific, so easily portable to every community to use.
Potentially valuable to DHS? Yes, nice overview of planning and policy tools available to communities
SOURCE: Grannis, 2011.

113
References
100RC—See 100 Resilient Cities.
100 Resilient Cities, home page, undated. As of March 23, 2016: http://www.100resilientcities.org/
Adaptation Clearinghouse, “Sea Level Rise Planning Tool (NOAA, FEMA, Army Corps),” June 2013.
ADCIRC—See Advanced Circulation.
Adger, W. Neil, “Social and Ecological Resilience: Are They Related?” Progress in Human Geography, Vol. 24, No. 3, 2000, pp. 347–364.
Advanced Circulation, “ADCIRC: The Official ADCIRC Web Site,” undated. As of October 1, 2016: http://adcirc.org
———, “Introduction,” in ADCIRC: A (Parallel) Advanced Circulation Model for Oceanic, Coastal and Estuarine Waters—User’s Manual: V50, April 10, 2012. As of July 14, 2017: http://adcirc.org/home/documentation/users-manual-v50/introduction/
Ahmed, Rashid, Mohamed Seedat, Ashley van Niekerk, and Samed Bulbulia, “Discerning Community Resilience in Disadvantaged Communities in the Context of Violence and Injury Prevention,” South African Journal of Psychology, Vol. 34, No. 3, 2004, pp. 386–408.
Alexander, D. E., “Resilience and Disaster Risk Reduction: An Etymological Journey,” Natural Hazards and Earth System Sciences, Vol. 13, No. 11, 2013, pp. 2707–2716.
Alinovi, Luca, Marco D’Errico, Erdgin Mane, and Donato Romano, Livelihoods Strategies and Household Resilience to Food Insecurity: An Empirical Analysis to Kenya, paper prepared for the conference Promoting Resilience Through Social Protection in Sub-Saharan Africa, European Report of Development, Dakar, Senegal, June 28–30, 2010. As of June 23, 2017: http://erd.eui.eu/media/BackgroundPapers/Alinovi-Romano-D%27Errico-Mane.pdf
Anh, Tran Tuan, Tran Van Giai Phong, Tran Huu Tuan, and Martin Mulenga, Community Consultation for Long-Term Climate-Resilient Housing in Vietnamese Cities: A Comparative Case Study Between Hue and Da Nang, London: International Institute for Environment and Development, Asian Cities Climate Resilience Working Paper Series 2, October 2013. As of June 21, 2017: http://pubs.iied.org/pdfs/10643IIED.pdf
Arup International Development, City Resilience Framework, Rockefeller Foundation, April 2014. As of June 19, 2017: https://assets.rockefellerfoundation.org/app/uploads/20140410162455/City-Resilience-Framework-2015.pdf
Autocase, home page, undated. As of July 14, 2017: https://autocase.com/
Beatley, Timothy, Planning for Coastal Resilience: Best Practices for Calamitous Times, Washington, D.C.: Island Press, 2012.
Bennett, E. M., G. S. Cumming, and G. D. Peterson, “A Systems Model Approach to Determining Resilience Surrogates for Case Studies,” Ecosystems, Vol. 8, No. 8, December 2005, pp. 945–957.

114 Landscape Survey to Support Flood Apex National Flood Decision Support Toolbox
Berke, Philip, and Gavin Smith, “Hazard Mitigation, Planning, and Disaster Resiliency: Challenges and Strategic Choices for the 21st Century,” in U. Fra Paleo, ed., Building Safer Communities: Risk Governance, Spatial Planning and Responses to Natural Hazards, 2009, pp. 1–20.
Berke, Philip, Gavin Smith, and Ward Lyles, “Planning for Resiliency: Evaluation of State Hazard Mitigation Plans Under the Disaster Mitigation Act,” Natural Hazards Review, Vol. 13, No. 2, May 2012, pp. 139–149.
Berry, Christine, Josh Ryan-Collins, and Tony Greenham, Financial Systems Resilience Index: Building a Strong Financial System, New Economics Foundation, May 2015.
Bodin, Per, and Bo Wiman, “Resilience and Other Stability Concepts in Ecology: Notes on Their Origin, Validity, and Usefulness,” ESS Bulletin, Vol. 2, No. 2, 2004, pp. 33–43.
Boulder Office of Emergency Management, All-Hazards Recovery Plan, January 2013.
Brooks, Nick, Eunica Aure, and Martin Whiteside, Draft Report: Assessing the Impact of ICF Programmes on Household and Community Resilience to Climate Variability and Climate Change, London: UK Department for International Development, February 2014. As of June 18, 2017: http://www.gov.uk/government/uploads/system/uploads/attachment_data/file/279639/ Draft-measuring-resilience-report.pdf
Brown, David D., and Judith Celene Kulig, “The Concepts of Resiliency: Theoretical Lessons from Community Research,” Health and Canadian Society, Vol. 4, No. 1, 1996–1997, pp. 29–50. As of June 20, 2017: https://www.uleth.ca/dspace/handle/10133/1275
Bruneau, Michel, Stephanie E. Chang, Ronald T. Eguchi, George C. Lee, Thomas D. O’Rourke, Andrei M. Reinhorn, Masanobu Shinozuka, Kathleen Tierney, William A. Wallace, and Detlof von Winterfeldt, “A Framework to Quantitatively Assess and Enhance the Seismic Resilience of Communities,” Earthquake Spectra, Vol. 19, No. 4, November 2003, pp. 733–752.
Burby, Raymond J., and Peter J. May, “Command or Cooperate? Rethinking Traditional Central Governments’ Hazard Mitigation Policies,” in Urbano Fra Paleo, ed., Building Safer Communities: Risk Governance, Spatial Planning and Responses to Natural Hazards, Amsterdam: IOS Press, 2009, pp. 34–43.
Butler, Lisa D., Leslie A. Morland, and Gregory A. Leskin, “Psychological Resilience in the Face of Terrorism,” in Bruce Bongar, Lisa M. Brown, Larry E. Beutler, James N. Breckenridge, and Philip G. Zimbardo, eds., Psychology of Terrorism, Oxford, UK: Oxford University Press, 2007, pp. 400–417.
Cardno, Catherine A., “Preparing for the Big One,” Civil Engineering, Vol. 85, No. 2, February 2015.
Carpenter, Steve, Brian Walker, J. Marty Anderies, and Nick Abel, “From Metaphor to Measurement: Resilience of What to What?” Ecosystems, Vol. 4, No. 8, December 2001, pp. 765–781.
Cheong, Tae Sung, “Development of Decision Support System for Flood Disaster Risk Management,” Tropical Cyclone Research and Review, Vol. 1, No. 2, 2012, pp. 198–206.
City of Boulder Department of Public Works, City of Boulder Colorado Multi-Hazard Mitigation Plan: Comprehensive Update, Boulder, Colo., October 2012. As of June 18, 2017: https://www-static.bouldercolorado.gov/docs/multi-hazard-mitigation-plan-update-2012-1-201303291127.pdf
Climate Central, “Surging Seas,” undated. As of June 23, 2017: http://sealevel.climatecentral.org/
Coastal Protection and Restoration Authority, “Welcome to CPRA’s Master Plan Data Viewer,” undated. As of October 1, 2016: http://cims.coastal.louisiana.gov/floodrisk/
———, Louisiana’s Comprehensive Master Plan for a Sustainable Coast, March 20, 2012. As of October 1, 2016: http://coastal.la.gov/a-common-vision/2012-coastal-master-plan/
Coastal Resilience, “Mapping Tools and Apps,” undated (a). As of October 1, 2016: http://coastalresilience.org/mapping-tool-apps/
———, “Natural Solutions Toolkit,” undated (b). As of June 23, 2017: http://coastalresilience.org/natural-solutions/toolkit/

References 115
———, “Projects,” undated (c). As of June 28, 2017: http://coastalresilience.org/our-work/
Cohen, Odeya, Dima Leykin, Mooli Lahad, Avishay Goldberg, and Limor Aharonson-Daniel, “The Conjoint Community Resiliency Assessment Measure as a Baseline for Profiling and Predicting Community Resilience for Emergencies,” Technological Forecasting and Social Change, Vol. 80, No. 9, November 2013, pp. 1732–1741.
Coles, Eve, and Philip Buckle, “Developing Community Resilience as a Foundation for Effective Disaster Recovery,” Australian Journal of Emergency Management, Vol. 19, No. 4, November 2004, pp. 6–15.
CollinsWoerman, Toward a Resilient Seattle: Post-Disaster Recovery Plan Framework, Seattle, Wash.: City of Seattle, January 22, 2013. As of June 18, 2017: https://www.seattle.gov/Documents/Departments/Emergency/PlansOEM/Recovery/SeattleDisasterRecoveryPlanFrameworkJan2013final.pdf
Colorado’s Flood Decision Support System, “Flood DSS Mapping Applications,” undated. As of October 1, 2016: http://flooddss.state.co.us/
Community and Regional Resilience Institute, Building Resilience in America’s Communities: Observations and Implications of the CRS Pilots, March 2013.
Cox, Robin S., and Marti Hamlen, “Community Disaster Resilience and the Rural Resilience Index,” American Behavioral Scientist, Vol. 59, No. 2, 2015, pp. 220–237.
CPRA—See Coastal Protection and Restoration Authority.
Cutter, Susan L., “The Landscape of Disaster Resilience Indicators in the USA,” Natural Hazards, Vol. 80, No. 2, January 2016, pp. 741–758.
Cutter, Susan L., Kevin D. Ash, and Christopher T. Emrich, “The Geographies of Community Disaster Resilience,” Global Environmental Change, Vol. 29, November 2014, pp. 65–77.
Cutter, Susan L., Lindsey Barnes, Melissa Berry, Christopher Burton, Elijah Evans, Eric Tate, and Jennifer Webb, “A Place-Based Model for Understanding Community Resilience to Natural Disasters,” Global Environmental Change, Vol. 18, No. 4, October 2008, pp. 598–606.
Cutter, Susan L., Bryan J. Boruff, and W. Lynn Shirley, “Social Vulnerability to Environmental Hazards,” Social Science Quarterly, Vol. 84, No. 2, June 2003, p. 242–261.
Cutter, Susan L., Christopher G. Burton, and Christopher T. Emrich, “Disaster Resilience Indicators for Benchmarking Baseline Conditions,” Journal of Homeland Security and Emergency Management, Vol. 7, No. 1, 2010, art. 51.
Deltares, untitled about page, undated (a). As of July 14, 2017: https://oss.deltares.nl/web/delft-fews/about
———, “Delft-FEWS Software Community,” undated (b). As of October 1, 2016: https://oss.deltares.nl/web/delft-fews/home
DHI, “Integrated Flood Modelling,” undated. As of October 1, 2016: https://www.mikepoweredbydhi.com/products/mike-flood/integrated-flood-modelling
———, “Flood Toolbox,” December 2011. As of October 1, 2016: https://www.dhigroup.com/upload/publications/scribd/ 94370726-Custom-Solutions-for-Flood-Risk-Management-DHI-Solution.pdf
DHS—See U.S. Department of Homeland Security.
EBM Tools Network—See Ecosystem-Based Management Tools Network.
Ecosystem-Based Management Tools Network, “Coastal Storms Initiative: Florida Pilot Risk and Vulnerability Assessment Tool,” last updated November 30, 2010. As of October 1, 2016: https://www.ebmtoolsdatabase.org/project/ coastal-storms-initiative-florida-pilot-risk-and-vulnerability-assessment-tool
Egeland, Byron, Elizabeth Carlson, and L. Alan Sroufe, “Resilience as Process,” Development and Psychopathology, Vol. 5, No. 4, October 1993, pp. 517–528.

116 Landscape Survey to Support Flood Apex National Flood Decision Support Toolbox
Environmental Dataset Gateway, U.S. Environmental Protection Agency, “NOAA Coastal Services Center Sea Level Rise Data: 1–6 ft Sea Level Rise Inundation Extent,” 2012.
Environmental Law Institute and Nature Conservancy, Watershed Approach Handbook: Improving Outcomes and Increasing Benefits Associated with Wetland and Stream Restoration and Protection Projects, September 2014. As of July 14, 2017: https://www.eli.org/sites/default/files/eli-pubs/watershed-approach-handbook-improving-outcomes-and-increasing-benefits-associated-wetland-and-stream_0.pdf
EPA—See U.S. Environmental Protection Agency.
Evidence Directorate, Department for Environment, Food and Rural Affairs, United Kingdom Environment Agency, “Evaluating MDSF2 for Flood Risk Management Strategies: Project Summary SC120062/S,” March 2015. As of July 14, 2017: http://evidence.environment-agency.gov.uk/FCERM/Libraries/FCERM_Project_Documents/ SC120062_summary.sflb.ashx
Federal Emergency Management Agency, Developing the Mitigation Plan: Identifying Mitigation Actions and Implementation Strategies, Washington, D.C., FEMA 386-3, April 1, 2003. As of June 19, 2017: https://www.fema.gov/media-library/assets/documents/4267
———, National Disaster Recovery Framework: Strengthening Disaster Recovery for the Nation, Washington, D.C., September 2011a. As of May 20, 2012: http://www.fema.gov/pdf/recoveryframework/ndrf.pdf
———, Local Mitigation Plan Review Guide, Washington, D.C., October 1, 2011b. As of June 18, 2017: https://www.fema.gov/media-library/assets/documents/23194
———, FEMA Strategic Plan 2014–2018, Washington, D.C., July 18, 2014. As of June 18, 2017: https://www.fema.gov/media-library/assets/documents/96981
———, “Region II Coastal Analysis and Mapping: Flood Risk Tools—Dataset and Product Descriptions,” last updated March 25, 2015. As of October 1, 2016: http://www.region2coastal.com/community-officials/flood-risk-tools/tool-descriptions
———, “Hazus Overview,” last updated April 10, 2017a. As of October 1, 2016: https://www.fema.gov/hazus-mh-overview
———, “Risk Mapping, Assessment and Planning (Risk MAP),” last updated June 2, 2017b. As of October 1, 2016: http://www.fema.gov/risk-mapping-assessment-and-planning-risk-map
FEMA—See Federal Emergency Management Agency.
Fischbach, Jordan R., David R. Johnson, David S. Ortiz, Benjamin P. Bryant, Matthew Hoover, and Jordan Ostwald, Coastal Louisiana Risk Assessment Model: Technical Description and 2012 Coastal Master Plan Analysis Results, Santa Monica, Calif.: RAND Corporation, TR-1259-CPRA, 2012. As of June 19, 2017: https://www.rand.org/pubs/technical_reports/TR1259.html
Fisher, R. E., G. W. Bassett, W. A. Beuhring, M. J. Collins, D. C. Dickinson, L. K. Eaton, R. A. Haffenden, N. E. Hussar, M. S. Klett, M. A. Lawlor, D. J. Miller, F. D. Petit, S. M. Peyton, K. E. Wallace, R. G. Whitfield, and J. P. Peerenboom, Constructing a Resilience Index for the Enhanced Critical Infrastructure Protection Program, Argonne, Ill.: Argonne National Laboratory, Decision and Information Sciences Division, ANL/DIS-10-9, August 2010. As of June 23, 2017: http://www.ipd.anl.gov/anlpubs/2010/09/67823.pdf
Flood Risk Information System, home page, undated. As of October 1, 2016: http://fris.nc.gov/fris/HOME.aspx
FLOODsite, “Flood Risk Management,” undated (a). As of July 14, 2017: http://www.floodsite.net/html/flood_risk.htm
———, “Long-Term Flood Risk Management Planning: Application to the Thames Pilot—Introduction,” undated (b). As of October 1, 2016: http://hikm.ihe.nl/floodsite/data/task24/01_Introduction.htm

References 117
———, “Risk Analysis Tool for the German Bight Coast: Introduction,” undated (c). As of October 1, 2016: http://hikm.ihe.nl/floodsite/data/Task27/Introduction.html
———, “Toolkit,” undated (d). As of October 1, 2016: http://floodsite.net/html/toolkit.asp
Francis, Royce, and Behailu Bekera, “A Metric and Frameworks for Resilience Analysis of Engineered and Infrastructure Systems,” Reliability Engineering and System Safety, Vol. 121, January 2014, pp. 90–103.
Ganor, Michael, and Yuli Ben-Lavy, “Community Resilience: Lessons Derived from Gilo Under Fire,” Journal of Jewish Communal Service, Vol. 79, No. 2–3, Winter–Spring 2002–2003, pp. 105–108.
Gao, Jianxi, Baruch Barzel, and Albert-László Barabási, “Universal Resilience Patterns in Complex Networks,” Nature, Vol. 530, February 18, 2016, pp. 307–312.
Gardner, Mark R., and W. Ross Ashby, “Connectance of Large Dynamic (Cybernetic) Systems: Critical Values for Stability,” Nature, Vol. 221, November 21, 1970, p. 784.
Global Risk Information Platform, United Nations Human Settlements Programme, International Federation of Red Cross and Red Crescent Societies, and United Nations Development Programme, “Simplified Flood Risk Assessment Tool (FRAT),” September 2009.
Godschalk, David R., “Urban Hazard Mitigation: Creating Resilient Cities,” Natural Hazards Review, Vol. 4, No. 3, August 2003.
Gordon, J. E., Structures: Or Why Things Don’t Fall Down, Cambridge, Mass.: Da Capo Press, 1978.
Grannis, Jessica, Adaptation Tool Kit: Sea-Level Rise and Coastal Land Use—How Governments Can Use Land-Use Practices to Adapt to Sea-Level Rise, Washington, D.C.: Georgetown Climate Center, October 2011. As of October 1, 2016: http://www.georgetownclimate.org/files/report/Adaptation_Tool_Kit_SLR.pdf
Groves, David, Jordan R. Fischbach, Debra Knopman, David R. Johnson, and Katheryn Giglio, Strengthening Coastal Planning: How Coastal Regions Could Benefit from Louisiana’s Planning and Analysis Framework, Santa Monica, Calif.: RAND Corporation, RR-437-RC, 2014. As of June 18, 2017: http://www.rand.org/pubs/research_reports/RR437.html
Groves, David G., and Christopher Sharon, “Planning Tool to Support Planning the Future of Coastal Louisiana,” Journal of Coastal Research, Special Issue 67: Louisiana’s 2012 Coastal Master Plan Technical Analysis, 2013, pp. 147–161.
Haimes, Yacov Y., “On the Definition of Resilience in Systems,” Risk Analysis, Vol. 29, No. 4, April 2009, pp. 498–501.
Hall, Robert, “Adaptive Governance Policy for Societal Resilience and Community Empowerment,” Journal of US–China Public Administration, Vol. 11, No. 12, December 2014, pp. 949–959.
Hayashi, Shin-ichiro, Hideaki Mizuno, Atsushi Okamoto, Masaki Hiruma, and Reiji Kondo, “Activities of the ESCAP/WMO Typhoon Committee Regarding Sediment-Related Disaster Prevention Using Non-Structural Measures, Based on Japanese SABO Technology,” Tropical Cyclone Research and Review, Vol. 2, No. 1, 2013, pp. 55–64.
HEC—See Hydrologic Engineering Center.
Holling, C. S., “Resilience and Stability of Ecological Systems,” Annual Review of Ecology and Systematics, Vol. 4, November 1973, pp. 1–23.
Homeland Security Studies and Analysis Institute, Concept Development: An Operational Framework for Resilience, U.S. Department of Homeland Security, Science and Technology Directorate, August 27, 2009.
Homeland Security Systems Engineering and Development Institute, Significant Indicators of Community Resilience, Washington, D.C.: U.S. Department of Homeland Security, January 29, 2016.
Huang, Yupeng, Wenchen Lin, and Haijiang Zheng, “A Decision Support System Based on GIS for Flood Prevention of Quanzhou City,” 2013 Fifth International Conference on Intelligent Human–Machine Systems and Cybernetics, IEEE Computer Society, 2013, pp. 50–53.
118 Landscape Survey to Support Flood Apex National Flood Decision Support Toolbox
Hughes, Karl, and Helen Bushell, A Multidimensional Approach to Measuring Resilience, Oxfam GB, August 1, 2013. As of June 23, 2017: http://policy-practice.oxfam.org.uk/publications/a-multidimensional-approach-to-measuring-resilience-302641
HURREVAC, home page, undated (a). As of October 1, 2016: http://www.hurrevac.com/
———, “Key Features of HURREVAC,” undated (b). As of July 14, 2017: http://www.hurrevac.com/about.htm
Hydrologic Engineering Center, U.S. Army Corps of Engineers, “CWMS,” undated (a). As of October 1, 2016: http://www.hec.usace.army.mil/cwms/cwms.aspx
———, “HEC-FDA,” undated (b). As of June 28, 2017: http://www.hec.usace.army.mil/software/hec-fda/
———, “HEC-RAS,” undated (c). As of October 1, 2016: http://www.hec.usace.army.mil/software/hec-ras/
IFRC—See International Federation of Red Cross and Red Crescent Societies.
Impact Infrastructure, “AutoCASE,” web page, undated.
Innes, Judith E., and David E. Booher, “Consensus Building and Complex Adaptive Systems: A Framework for Evaluating Collaborative Planning,” Journal of the American Planning Association, Vol. 65, No. 4, 1999, pp. 412–423.
Institute of Geography, Universität Heidelberg, “OpenFloodRiskMap: A Decision Support System Based on User-Generated Spatial Data for Communities in Support of Emergency Response Planning in Flood Management,” latest revision May 8, 2016. As of October 1, 2016: http://www.geog.uni-heidelberg.de/gis/open_flood_risk_map_en.html
International Federation of Red Cross and Red Crescent Societies, IFRC Framework for Community Resilience, Geneva, 2014. As of June 18, 2017: http://www.ifrc.org/Global/Documents/Secretariat/201501/ 1284000-Framework%20for%20Community%20Resilience-EN-LR.pdf
Johnson, David R., Jordan R. Fischbach, and David S. Ortiz, “Estimating Surge-Based Flood Risk with the Coastal Louisiana Risk Assessment Model,” Journal of Coastal Research, Special Issue 67, 2013, pp. 109–126.
Kimhi, Shaul, and Michal Shamai, “Community Resilience and the Impact of Stress: Adult Response to Israel’s Withdrawal from Lebanon,” Journal of Community Psychology, Vol. 32, No. 4, July 2004, pp. 439–451.
King County (Washington), King County Strategic Plan 2010–2014: Working Together for One King County, July 26, 2010. As of June 18, 2017: http://www.kingcounty.gov/~/media/depts/executive/performance-strategy-budget/documents/pdf/2014/ 2010-2014-KCStratPlan.ashx?la=en
———, Strategic Climate Action Plan, 2012a.
———, 2012 King County Comprehensive Plan, December 3, 2012b.
———, 2013 King County Flood Hazard Management Plan Update, November 2013. As of June 18, 2017: http://www.kingcounty.gov/depts/dnrp/wlr/sections-programs/river-floodplain-section/documents/ flood-hazard-management-plan-update.aspx
Kirby, David, Flood Integrated Decision Support System for Melbourne, c. 2015. As of October 1, 2016: http://www.floodplainconference.com/papers2015/David%20Kirby%20Full%20Paper.pdf
Klein, Richard J. T., Robert J. Nicholls, and Frank Thomalla, “Resilience to Natural Hazards: How Useful Is This Concept?” Global Environmental Change, Part B: Environmental Hazards, Vol. 5, No. 1–2, 2003, pp. 35–45.

References 119
Knopman, Debra, and Robert J. Lempert, Urban Responses to Climate Change: Framework for Decisionmaking and Supporting Indicators, Santa Monica, Calif.: RAND Corporation, RR-1144-MCF, 2016. As of June 19, 2017: https://www.rand.org/pubs/research_reports/RR1144.html
Lacey, Stephen, “From Smart to Resilient: How Utilities Are Using New Technology to Protect the Grid,” Greentech Media, June 23, 2014. As of June 19, 2017: https://www.greentechmedia.com/articles/featured/How-Utilities-Are-Using-New-Technology-to-Protect-the-Grid
Land Utilisation and Capability Indicator, home page, undated.
Lei, Yongdeng, Jing’ai Wang, Yaojie Yue, Hongjian Zhou, and Weixia Yin, “Rethinking the Relationships of Vulnerability, Resilience, and Adaptation from a Disaster Risk Perspective,” Natural Hazards, Vol. 70, No. 1, January 2014, pp. 609–627.
Lempert, Robert J., David G. Groves, Steven W. Popper, and Steve C. Bankes, “A General, Analytic Method for Generating Robust Strategies and Narrative Scenarios,” Management Science, Vol. 52, No. 4, 2006, pp. 514–528.
Lempert, Robert, Nidhi Kalra, Suzanne Peyraud, Zhimin Mao, Sinh Bach Tan, Dean Cira, and Alexander Lotsch, Ensuring Robust Flood Risk Management in Ho Chi Minh City, World Bank, Sustainable Development Network, Office of the Chief Economist, Policy Research Working Paper 6465, May 2013. As of June 19, 2017: https://openknowledge.worldbank.org/handle/10986/15603
Link, Lewis E., Sandra K. Knight, Jason Rohner, and Liora Miller, Building Blocks for a National Resilience Assessment, Coastal Hazards Center, June 30, 2015. As of June 18, 2017: http://civil.umd.edu/sites/default/files/documents/National-Resilience-Assessment.pdf
Linkov, Igor, Todd Bridges, Felix Creutzig, Jennifer Decker, Cate Fox-Lent, Wolfgang Kröger, James H. Lambert, Anders Levermann, Benoit Montreuil, Jatin Nathwani, Raymond Nyer, Ortwin Renn, Benjamin Scharte, Alexander Scheffler, Miranda Schreurs, and Thomas Thiel-Clemen, “Changing the Resilience Paradigm,” Nature Climate Change, Vol. 4, No. 6, 2014, pp. 407–409.
Longstaff, Patricia H., Security, Resilience, and Communication in Unpredictable Environments Such as Terrorism, Natural Disasters, and Complex Technology, Cambridge, Mass.: Center for Information Policy Research, Harvard University, November 2005. As of June 20, 2017: http://www.pirp.harvard.edu/pubs_pdf/longsta/longsta-p05-3.pdf
LUCI—See Land Utilisation and Capability Indicator.
Maryland Department of the Environment, “Final 2010 Integrated Report of Surface Water Quality in Maryland,” April 2, 2010. As of June 28, 2017: http://www.mde.state.md.us/programs/Water/TMDL/Integrated303dReports/Pages/Final_approved_2010_ir.aspx
Masten, Ann S., Karin M. Best, and Norman Garmezy, “Resilience and Development: Contributions from the Study of Children Who Overcome Adversity,” Development and Psychopathology, Vol. 2, No. 4, October 1990, pp. 425–444.
Mayoral Seismic Safety Task Force, Resilience by Design, Los Angeles, Calif.: City of Los Angeles, December 2014. As of June 19, 2017: https://www.lamayor.org/sites/g/files/wph446/f/article/files/Resilience%20by%20Design%20(1).pdf
Mayunga, Joseph S., Understanding and Applying the Concept of Community Disaster Resilience: A Capital-Based Approach, working paper prepared for the summer academy for social vulnerability and resilience building, Munich, July 22–28, 2007.
McCalla, Emily, “This Tool Lets You See Flood Risk to Your Own Home,” Restore the Mississippi River Delta, March 2, 2016.
MIKE Powered by DHI, “Integrated Flood Modelling,” undated. As of June 27, 2017: https://www.mikepoweredbydhi.com/products/mike-flood/integrated-flood-modelling
120 Landscape Survey to Support Flood Apex National Flood Decision Support Toolbox
Miles, Scott B., and Stephanie E. Chang, “ResilUS: A Community Based Disaster Resilience Model,” Cartography and Geographic Information Science, Vol. 38, No. 1, 2011, pp. 36–51.
Miller, Fiona, Henny Osbahr, Emily Boyd, Frank Thomalla, Sukaina Bharwani, Gina Ziervogel, Brian Walker, Jörn Birkmann, Sander van der Leeuw, Johan Rockström, Jochen Hinkel, Tom Downing, Carl Folke, and Donald Nelson, “Resilience and Vulnerability: Complementary or Conflicting Concepts?” Ecology and Society, Vol. 15, No. 3, 2010, art. 11. As of June 19, 2017: https://www.ecologyandsociety.org/vol15/iss3/art11/
National Academies, Committee on Science, Engineering and Public Policy and Committee on Increasing National Resilience to Hazards and Disasters, Disaster Resilience: A National Imperative, Washington, D.C.: National Academies Press, 2012. As of June 19, 2017: https://www.nap.edu/catalog/13457/disaster-resilience-a-national-imperative
National Center for Computational Hydroscience and Engineering, University of Mississippi, “DSS-WISE: Decision Support System for Water Infrastructure Security (DSS-WISE),” undated. As of October 1, 2016: https://www.ncche.olemiss.edu/projects/DSS-WISE
———, “DSS-WISE: Decision Support System for Water Infrastructural Security,” revision 0, April 26, 2011. As of June 27, 2017: https://www.ncche.olemiss.edu/sites/default/files/files/docs/dss-wise/ DHS%20S%26T_Fact%20sheet_DSS-WISE_110425.pdf
National Institute of Standards and Technology, Disaster Resilience Framework: 75% Draft for San Diego, CA Workshop, February 11, 2015a. As of July 13, 2017: https://www.nist.gov/sites/default/files/documents/el/building_materials/resilience/ Framework_LineNumbered_75-25_11Feb2015.pdf
———, Community Resilience Planning Guide for Buildings and Infrastructure Systems, Special Publication 1190, April 24, 2015b. As of June 19, 2017: https://www.nist.gov/topics/community-resilience/community-resilience-planning-guide
———, “Four Agencies Join with NIST to Co-Sponsor New Community Resilience Panel,” November 13, 2015c. As of July 13, 2017: https://www.nist.gov/news-events/news/2015/11/ four-agencies-join-nist-co-sponsor-new-community-resilience-panel
Natural Capital Project, “InVEST: Integrated Valuation of Ecosystem Services and Tradeoffs,” undated. As of October 1, 2016: http://www.naturalcapitalproject.org/invest
Neubert, M., T. Naumann, and C. Deilmann, “Synthetic Water Level Building Damage Relationships for GIS-Supported Flood Vulnerability Modeling of Residential Properties,” in Paul Samuels, Stephen Huntington, William Allsop, and Jackie Harrop, eds., Flood Risk Management: Research and Practice—Extended Abstracts, CRC Press, 2009, p. 294.
New Hampshire Department of Environmental Services, Wetland Restoration Assessment Model, updated May 7, 2012.
New York City Office of Emergency Management, New York City Natural Hazard Mitigation Plan, New York, March 2009. As of June 19, 2017: https://www1.nyc.gov/assets/em/downloads/pdf/hazard_mitigation/full_hmp_march_2009.pdf
New York City Office of Emergency Management, New York City Department of City Planning, and Mayor’s Office of Long-Term Planning and Sustainability, The City of New York Hazard Mitigation Plan 2014, New York, January 31, 2014. As of June 19, 2017: http://www.nyc.gov/html/oem/downloads/pdf/hazard_mitigation/plan_update_2014/ final_draft_nyc_hmp.pdf
New York City Special Initiative for Rebuilding and Resiliency, PlaNYC: A Stronger, More Resilient New York, New York, June 11, 2013. As of June 19, 2017: http://www.nyc.gov/html/sirr/html/report/report.shtml
NHDES—See New Hampshire Department of Environmental Services.
References 121
NIST—See National Institute of Standards and Technology.
“NJ Flood Mapper,” Rutgers University, undated.
Norris, Fran H., Susan P. Stevens, Betty Pfefferbaum, Karen F. Wyche, and Rose L. Pfefferbaum, “Community Resilience as a Metaphor, Theory, Set of Capacities, and Strategy for Disaster Readiness,” American Journal of Community Psychology, Vol. 41, No. 1, March 2008, pp. 127–150.
North Carolina Floodplain Mapping Program, “Flood Risk Information System (FRIS),” undated. As of October 1, 2016: http://www.ncfloodmaps.com/
Nujić, Marinko, “Efficient Implementation of Non-Oscillatory Schemes for the Computation of Free-Surface Flows,” Journal of Hydraulic Research, Vol. 33, No. 1, 1995, pp. 101–111.
Obama, Barack, Critical Infrastructure Security and Resilience, Washington, D.C.: White House, Presidential Policy Directive 21, February 12, 2013. As of June 21, 2017: https://obamawhitehouse.archives.gov/the-press-office/2013/02/12/presidential-policy-directive-critical-infrastructure-security-and-resil
Office for Coastal Management, National Oceanic and Atmospheric Administration, “Coastal Flood Exposure Mapper,” last modified March 13, 2017a. As of October 1, 2016: https://coast.noaa.gov/digitalcoast/tools/flood-exposure
———, “Sea Level Rise Viewer,” last modified June 14, 2017b. As of October 1, 2016: https://coast.noaa.gov/digitalcoast/tools/slr
Office of Electricity Delivery and Energy Reliability, U.S. Department of Energy, “The Role of Microgrids in Helping to Advance the Nation’s Energy System,” undated. As of March 23, 2016: http://energy.gov/oe/services/technology-development/smart-grid/role-microgrids-helping-advance-nation-s-energy-system
Olshansky, Robert B., Lewis D. Hopkins, and Laurie A. Johnson, “Disaster and Recovery: Processes Compressed in Time,” Natural Hazards Review, Vol. 13, No. 3, August 2012, pp. 173–178.
Organisation for Economic Co-operation and Development, Final Report: Resilience Systems Analysis, Eastern Democratic Republic of Congo, Goma, April 29/30 2014—Workshop Report: Results and Roadmap, c. 2014. As of June 21, 2017: http://www.oecd.org/dac/ OECD%20UNICEF%20resilience%20roadmap%20eastern%20DRC%20FINAL%20ENGLISH.pdf
Oxford Metrica, Annual Report 2015: FM Global Resilience Index, c. September 2015.
Panel on Strategies and Methods for Climate-Related Decision Support, Committee on the Human Dimensions of Global Change, Division of Behavioral and Social Sciences and Education, National Research Council, Informing Decisions in a Changing Climate, Washington, D.C.: National Academies Press, 2009. As of June 19, 2017: https://www.nap.edu/catalog/12626/informing-decisions-in-a-changing-climate
Parker, John, “Autocase for Sustainable Buildings,” Autocase, July 26, 2016. As of June 19, 2017: https://blog.autocase.com/blog/2016/07/26/acsboccupancy/
Parris, Adam, Peter Bromirski, Virginia Burkett, Dan Cayan, Mary Culver, John Hall, Radley Horton, Kevin Knuuti, Richard Moss, Jayantha Obeysekera, Abby Sallenger, and Jeremy Weiss, Global Sea Level Rise Scenarios for the United States National Climate Assessment, National Oceanic and Atmospheric Administration, Technical Memorandum OAR CPO-1, December 6, 2012. As of June 27, 2017: https://scenarios.globalchange.gov/sites/default/files/NOAA_SLR_r3_0.pdf
Paton, Douglas, and David Johnston, “Disasters and Communities: Vulnerability, Resilience and Preparedness,” Disaster Prevention and Management: An International Journal, Vol. 10, No. 4, 2001, pp. 270–277.
Peacock, Walter G., ed., Advancing the Resilience of Coastal Localities: Developing, Implementing and Sustaining the Use of Coastal Resilience Indicators—A Final Report, Coastal Services Center and National Oceanic and Atmospheric Administration, December 2010.

122 Landscape Survey to Support Flood Apex National Flood Decision Support Toolbox
Pearce, David W., and Giles D. Atkinson, “Capital Theory and the Measurement of Sustainable Development: An Indicator of ‘Weak’ Sustainability,” Ecological Economics, Vol. 8, No. 2, October 1993, pp. 103–108.
Pendall, Rolf, Kathryn A. Foster, and Margaret Cowell, “Resilience and Regions: Building Understanding of the Metaphor,” Cambridge Journal of Regions, Economy and Society, Vol. 3, No. 1, 2010, pp. 71–84.
Petit, F. D., G. W. Bassett, R. Black, W. A. Buehring, M. J. Collins, D. C. Dickinson, R. E. Fisher, R. A. Haffenden, A. A. Huttenga, M. S. Klett, J. A. Phillips, M. Thomas, S. N. Veselka, K. E. Wallace, R. G. Whitfield, and J. P. Peerenboom, Resilience Measurement Index: An Indicator of Critical Infrastructure Resilience, Argonne, Ill.: Argonne National Laboratory, Decision and Information Sciences Division, ANL/DIS-13-01, April 2013. As of June 23, 2017: http://www.ipd.anl.gov/anlpubs/2013/07/76797.pdf
Pfefferbaum, Betty J., Dori B. Reissman, Rose L. Pfefferbaum, Richard W. Klomp, and Robin H. Gurwitch, “Building Resilience to Mass Trauma Events,” in Lynda S. Doll, Sandra E. Bonzo, David A. Sleet, and James A. Mercy, eds., Handbook of Injury and Violence Prevention, Springer, 2006, pp. 347–358.
Pfefferbaum, R. L., B. Pfefferbaum, and R. L. Van Horn, Communities Advancing Resilience Toolkit (CART): The CART Integrated System, Oklahoma City, Okla.: Terrorism and Disaster Center at the University of Oklahoma Health Sciences Center, 2011.
Pfefferbaum, R. L., B. Pfefferbaum, R. L. Van Horn, R. W. Klomp, F. H. Norris, and D. B. Reissman, “The Communities Advancing Resilience Toolkit (CART): An Intervention to Build Community Resilience to Disasters,” Journal of Public Health Management and Practice, Vol. 19, No. 3, May–June 2013, pp. 250–258.
Prior, Timothy, and Jonas Hagmann, “Measuring Resilience: Methodological and Political Challenges of a Trend Security Concept,” Journal of Risk Research, Vol. 17, No. 3, 2014, pp. 281–298.
Public Law 106-390, Disaster Mitigation Act of 2000, October 30, 2000. As of June 27, 2017: https://www.gpo.gov/fdsys/pkg/PLAW-106publ390
RAND Corporation, “Publications That Feature Robust Decision Making,” undated (a). As of June 19, 2017: http://www.rand.org/methods/rdmlab/research/pubs.html
———, “RDM,” undated (b). As of June 19, 2017: http://www.rand.org/topics/rdm.html
Reed, Richard, Building Resilient Communities, Chicago, Ill.: Chicago Preparedness Summit, September 9, 2012. As of June 19, 2017: http://www.redcross.org/images/MEDIA_CustomProductCatalog/m13445059_Richard_Reed.pdf
Renschler, Chris S., Amy E. Frazier, Lucy A. Arendt, Gian-Paolo Cimellaro, Andrei M. Reinhorn, and Michel Bruneau, A Framework for Defining and Measuring Resilience at the Community Scale: The PEOPLES Resilience Framework, University at Buffalo, State University of New York, Multidisciplinary Center for Earthquake Engineering Research, Technical Report MCEER-10-0006, October 8, 2010. As of June 23, 2017: http://mceer.buffalo.edu/publications/catalog/reports/A-Framework-for-Defining-and-Measuring-Resilience-at-the-Community-Scale-The-PEOPLES-Resilience-Framework-MCEER-10-0006.html
Resilience Alliance, “Key Concepts,” undated.
Rhoads, Deborah J., “Resiliency Research: An Exploration of Successful Coping Patterns,” Eta Sigma Gamma Monograph Series, Vol. 12, No. 1, July 1994, pp. 50–58.
Rhode Island Coastal Resources Management Council, untitled beach special area management plan page, undated. As of July 14, 2017: http://www.crmc.ri.gov/samp_beach.html
Rhode Island Shoreline Change Special Area Management Plan, “STORMTOOLS,” undated. As of October 1, 2016: http://www.beachsamp.org/resources/stormtools/
Rodin, Judith, “The City Resilient,” Rockefeller Foundation blog, June 24, 2013. As of June 21, 2017: https://www.rockefellerfoundation.org/blog/the-city-resilient/
Rose, Adam, “Defining and Measuring Economic Resilience to Disasters,” Disaster Prevention and Management: An International Journal, Vol. 13, No. 4, 2004a, pp. 307–314.

References 123
———, “Defining and Measuring Economic Resilience to Earthquakes,” in Jane E. Stoyle, ed., Research Progress and Accomplishments 2003–2004: A Selection of Papers Chronicling Technical Achievements of the Multidisciplinary Center for Earthquake Engineering Research, Buffalo, N.Y.: University of Buffalo National Center for Earthquake Engineering Research, May 2004b, pp. 41–54. As of July 17, 2017: https://ubir.buffalo.edu/xmlui/bitstream/handle/10477/631/04-SP01.pdf
———, “Economic Resilience to Natural and Man-Made Disasters: Multidisciplinary Origins and Contextual Dimensions,” Environmental Hazards, Vol. 7, No. 4, 2007, pp. 383–398.
Rose, Adam, and Shu-Yi Liao, “Modeling Regional Economic Resilience to Disasters: A Computable General Equilibrium Analysis of Water Service Disruptions,” Journal of Regional Science, Vol. 45, No. 1, February 2005, pp. 75–112.
Rose, Adam, Gbadebo Oladosu, and Shu-Yi Liao, “Business Interruption Impacts of a Terrorist Attack on the Electric Power System of Los Angeles: Customer Resilience to a Total Blackout,” Risk Analysis, Vol. 27, No. 3, June 2007, pp. 513–531.
San Francisco Planning and Urban Research Association, The Resilient City: Defining What San Francisco Needs from Its Seismic Mitigation Policies, San Francisco, Calif., February 2009. As of June 23, 2017: http://resilience.abag.ca.gov/wp-content/documents/resilience/toolkit/Defining%20What%20San%20Francisco%20Needs%20from%20its%20Seismic%20Mitigation%20Policies.pdf
Seattle Office of Emergency Management, Seattle All-Hazards Mitigation Plan, July 2009. As of June 19, 2017: http://www.seattle.gov/Documents/Departments/Emergency/PlansOEM/HazardMitigation/SeattleMitigationPlan.pdf
———, Comprehensive Emergency Management Plan: Base Plan and ESF Annexes, updated May 2015a. As of June 26, 2017: http://www.seattle.gov/Documents/Departments/Emergency/CEMP.BasePlan.2015-05-05(0).pdf
———, City of Seattle Disaster Recovery Framework, July 7, 2015b. As of June 19, 2017: http://www.seattle.gov/Documents/Departments/Emergency/PlansOEM/Recovery/SeattleDisasterRecoveryFramework7-7-15v2.pdf
Sempier, T. T., D. L. Swann, R. Emmer, S. H. Sempier, and M. Schneider, Coastal Community Resilience Index: A Community Self-Assessment, Mississippi–Alabama Sea Grant Consortium, MASGP-08-014, November 2010.
Sherrieb, Kathleen, Fran H. Norris, and Sandro Galea, “Measuring Capacities for Community Resilience,” Social Indicators Research, Vol. 99, No. 2, November 2010, pp. 227–247.
Sonn, Christopher C., and Adrian T. Fisher, “Sense of Community: Community Resilient Responses to Oppression and Change,” Journal of Community Psychology, Vol. 26, No. 5, 1998, pp. 457–472.
Steinebach, G., “Using Hydrodynamic Models in Forecast Systems for Large Rivers,” in K. P. Holz, W. Bechteler, S. S. Y. Wang, and M. Kawahara, eds., Proceedings: Advances in Hydro-Science and -Engineering, Vol. 3, Cottbus, 1999.
Steinebach, G., S. Rademacher, P. Rentrop, and M. Schulz, “Mechanisms of Coupling in River Flow Simulation Systems,” Journal of Computational and Applied Mathematics, Vol. 168, No. 1–2, 2004, pp. 459–470.
Stetson Engineers, Capital Improvement Plan Study for Flood Damage Reduction and Creek Management in Flood Zone 9/Ross Valley, Marin County Flood Control and Water Conservation District, Flood Zone 9, May 2011. As of October 1, 2016: http://www.marinwatersheds.org/documents/CIPStudyReportMay2011.pdf
Sustainable Coastal Communities, University of Delaware, “Community Viz and the weTable,” undated. As of July 14, 2017: https://www.scc.udel.edu/land-use-and-environment/community-viz-and-wetable
THESEUS, “Motivation,” undated (a). As of October 1, 2016: http://www.theseusproject.eu/project-partners/background.html
———, “THESEUS Decision Support System,” undated (b). As of June 28, 2017: http://www.theseusproject.eu/dss

124 Landscape Survey to Support Flood Apex National Flood Decision Support Toolbox
Turner, B. L., Roger E. Kasperson, Pamela A. Matson, James J. McCarthy, Robert W. Corell, Lindsey Christensen, Noelle Eckley, Jeanne X. Kasperson, Amy Luers, Marybeth L. Martello, Colin Polsky, Alexander Pulsipher, and Andrew Schiller, “A Framework for Vulnerability Analysis in Sustainability Science,” Proceedings of the National Academy of Sciences of the United States of America, Vol. 100, No. 14, 2003, pp. 8074–8079.
Twigg, John, Characteristics of a Disaster-Resilient Community: A Guidance Note, version 2, November 2009.
UK Environment Agency—See United Kingdom Environment Agency.
UNISDR—See United Nations Office for Disaster Risk Reduction.
United Kingdom Environment Agency, Framework and Tools for Local Flood Risk Assessment, last updated June 2, 2014. As of October 1, 2016: https://www.gov.uk/government/publications/framework-and-tools-for-local-flood-risk-assessment
———, Modeling Decision Support Framework (MDSF2) for Flood Risk Management Strategies, March 13, 2015. As of October 1, 2016: https://www.gov.uk/government/publications/ modelling-decision-support-framework-mdsf2-for-flood-risk-management-strategies
United Nations Office for Disaster Risk Reduction, “Making Cities Resilient: My City Is Getting Ready,” undated (a). As of June 23, 2017: http://www.unisdr.org/campaign/resilientcities/
———, “The Ten Essentials: An Operational Framework of Sendai Framework at Local Level,” undated (b). As of June 23, 2017: http://www.unisdr.org/campaign/resilientcities/home/toolkitblkitem/?id=1
———, Making Cities Resilient: Summary for Policymakers, 2013. As of June 23, 2017: https://www.unisdr.org/we/inform/publications/33059
USACE—See U.S. Army Corps of Engineers.
U.S. Agency for International Development, “The Resilience Agenda: Measuring Resilience in USAID,” c. 2013. As of June 23, 2017: https://www.usaid.gov/sites/default/files/documents/1866/ Technical%20Note_Measuring%20Resilience%20in%20USAID_June%202013.pdf
U.S. Army Corps of Engineers, “Beach-fx,” undated. As of June 28, 2017: http://www.erdc.usace.army.mil/Media/Fact-Sheets/Fact-Sheet-Article-View/Article/476718/beach-fx/
———, Engineering and Design: Risk-Based Analysis for Flood Damage Reduction Studies, EM 1110-2-1619, August 1, 1996. As of June 28, 2017: http://www.publications.usace.army.mil/Portals/76/Publications/EngineerManuals/EM_1110-2-1619.pdf
———, Planning: Risk Analysis for Flood Damage Reduction Studies, ER 1105-2-101, January 3, 2006. As of June 28, 2017: http://www.publications.usace.army.mil/Portals/76/Publications/EngineerRegulations/ER_1105-2-101.pdf
U.S. Climate Resilience Toolkit, “Risk Mapping, Assessment, and Planning (Risk MAP) Program,” last modified August 29, 2016. As of July 14, 2017: https://toolkit.climate.gov/tool/risk-mapping-assessment-and-planning-risk-map-program
U.S. Department of Homeland Security, “Flood Apex Program: Rethinking America’s Costliest Disaster,” undated. As of July 14, 2017: https://www.dhs.gov/sites/default/files/publications/ Flood-Apex-Overview-Rethinking-Americas-Costliest-Disaster_v1-508_0.pdf
U.S. Environmental Protection Agency, “Climate Resilience Evaluation and Awareness Tool (CREAT),” updated January 17, 2013.
———, Watershed Management Optimization Support Tool (WMOST) v2: User Guide, Office of Research and Development, National Health and Environmental Effects Research Laboratory, EPA/600/R-15/059, November 2015. As of July 14, 2017: https://www.epa.gov/sites/production/files/2016-03/documents/wmostv2_userguide_508final.pdf

References 125
———, “Exposure Assessment Models: WMOST 2.0 Documentation—Watershed Management Optimization Support Tool (WMOST) v2,” last updated January 30, 2017a. As of October 1, 2016: https://www.epa.gov/exposure-assessment-models/wmost-20-documentation
———, “Exposure Assessment Models: WMOST—Watershed Management Optimization Support Tool (WMOST),” last updated June 9, 2017b. As of July 14, 2017: https://www.epa.gov/exposure-assessment-models/wmost
U.S. Global Change Research Program, “Sea Level Rise Tool for Sandy Recovery,” undated. As of October 1, 2016: http://www.globalchange.gov/browse/sea-level-rise-tool-sandy-recovery
Van Der Knijff, J. M., J. Younis, and A. P. J. De Roo, “LISFLOOD: A GIS-Based Distributed Model for River Basin Scale Water Balance and Flood Simulation,” International Journal of Geographical Information Science, Vol. 24, No. 2, 2010, pp. 189–212.
Waller, Margaret A., “Resilience in Ecosystemic Context: Evolution of the Concept,” American Journal of Orthopsychiatry: Mental Health and Social Justice, Vol. 71, No. 3, July 2001, pp. 290–297.
Waterbouwkundig Laboratorium, “LATIS Flood Risk Tool,” undated. As of October 1, 2016: http://www.watlab.be/en/latis-flood-risk-tool
Watershed Resources Registry, home page, undated. As of October 1, 2016: http://watershedresourcesregistry.com/home.html
Way, Catharine M., ed., Understanding Community Resilience: Findings from Community-Based Resilience Analysis (CoBRA) Assessments, Nairobi: United Nations Development Programme, Drylands Development Centre, April 2014. As of June 23, 2017: http://www.undp.org/content/undp/en/home/librarypage/environment-energy/ sustainable_land_management/CoBRA/CoBRA_assessment.html
West Virginia Flood Tool, home page, undated. As of October 1, 2016: http://www.mapwv.gov/flood/
White, Robin K., Warren C. Edwards, Ann Farrar, and M. John Plodinec, “A Practical Approach to Building Resilience in America’s Communities,” American Behavioral Scientist, Vol. 59, No. 2, 2015, pp. 200–219.
Winderl, Thomas, Disaster Resilience Measurements: Stocktaking of Ongoing Efforts in Developing Systems for Measuring Resilience, United Nations Development Programme, February 2014. As of June 17, 2017: http://www.preventionweb.net/files/37916_disasterresiliencemeasurementsundpt.pdf
Wing, Ian Sue, Adam Z. Rose, and Anne M. Wein, “Economic Consequence Analysis of the ARkStorm Scenario,” Natural Hazards Review, Vol. 17, No. 4, November 2016.
World Bank, “The Atlas of Social Protection: Indicators of Resilience and Equity,” last updated May 9, 2017. As of June 23, 2017: http://data.worldbank.org/data-catalog/atlas_social_protection
Zhao, Penjun, Ralph Chapman, Edward Randal, and Philippa Howden-Chapman, “Understanding Resilient Urban Futures: A Systemic Modelling Approach,” Sustainability, Vol. 5, No. 7, 2013, pp. 3202–3223.
Ziyath, Abdul M., Melissa Teo, and Ashantha Goonetilleke, “Surrogate Indicators for Assessing Community Resilience,” Proceedings of the International Conference on Building Resilience 2013: Individual, Institutional and Societal Coping Strategies to Address the Challenges Associated with Disaster Risk, University of Salford, Ahungalla, Sri Lanka, 2013.

www.rand.org
RR-1933-UNC 9 7 8 0 8 3 3 0 9 9 2 1 1
ISBN-13 978-0-8330-9921-1ISBN-10 0-8330-9921-3
53700
$37.00
This report summarizes the literature on definitions of resilience to flood risk, conceptual system-of-systems frameworks to analyze resilience, metric and indicator systems for measuring resilience, and examples of resilience-building in action at the community level. The literature suggests three main themes associated with the concept of resilience: (1) reducing the likelihood of a disaster and a community’s ability to absorb or resist a shock, (2) increasing a system’s adaptability while still maintaining function in the presence of a shock, and (3) reducing the time to recovery to normal functioning that might differ from pre-event functioning. These themes translate into capacities at the community or regional level that are essential to achieving resilience: absorptive or resistive capacity, adaptive capacity, and restorative capacity. Conceptual frameworks can be categorized into two groups: systems that segment the world by public service sectors (e.g., electric, water, and transportation) and systems that segment along functional lines (e.g., social, built, or natural). Additionally, this report provides a catalog of decision support tools for flood mitigation efforts and provides examples of how they have been used in practice. The authors’ goals were to present a structure for thinking about decision support in the context of flood risk reduction, management, and resilience; briefly overview each of the tools that meet the authors’ criteria for decision support; use several examples to illustrate how these tools have been used in different settings; and make recommendations to the U.S. Department of Homeland Security about whether further investigation into the models is warranted.
C O R P O R A T I O N


