55
IFAD RESEARCH SERIES 47 Landscapes of rural youth opportunity by James Sumberg Jordan Chamberlin Justin Flynn Dominic Glover Vicky Johnson Papers of the 2019 Rural Development Report

IFAD RESEARCHSERIES
47
Landscapes of rural youth opportunity
byJames SumbergJordan ChamberlinJustin FlynnDominic GloverVicky Johnson
Papers of the 2019 Rural Development Report
The opinions expressed in this publication are those of the authors and do not necessarily represent
those of the International Fund for Agricultural Development (IFAD). The designations employed and the
presentation of material in this publication do not imply the expression of any opinion whatsoever on
the part of IFAD concerning the legal status of any country, territory, city or area or of its authorities, or
concerning the delimitation of its frontiers or boundaries. The designations “developed” and “developing”
countries are intended for statistical convenience and do not necessarily express a judgement about the
stage reached in the development process by a particular country or area.
This publication or any part thereof may be reproduced for non-commercial purposes without prior
permission from IFAD, provided that the publication or extract therefrom reproduced is attributed to IFAD
and the title of this publication is stated in any publication and that a copy thereof is sent to IFAD.
Authors:
James Sumberg, Jordan Chamberlin, Justin Flynn, Dominic Glover and Vicky Johnson
© IFAD 2019
All rights reserved
ISBN 978-92-9072-964-8
Printed December 2019
The IFAD Research Series has been initiated by the Strategy and Knowledge Department in order to bring
together cutting-edge thinking and research on smallholder agriculture, rural development and related
themes. As a global organization with an exclusive mandate to promote rural smallholder development,
IFAD seeks to present diverse viewpoints from across the development arena in order to stimulate
knowledge exchange, innovation, and commitment to investing in rural people.

IFAD RESEARCHSERIES
47
byJames SumbergJordan ChamberlinJustin FlynnDominic Glover Vicky Johnson
Landscapes of rural youth opportunity
This paper was originally commissioned as a background paper for the 2019 Rural Development Report: Creating opportunities for rural youth.
www.ifad.org/ruraldevelopmentreport

Acknowledgements
This background paper was produced with the support of IFAD to inform the 2019 Rural
Development Report, Investing in Youth. This background paper was prepared for the Rural
Development Report 2019 “Creating Opportunities for Rural Youth”. Its publication in its
original draft form is intended to stimulate broader discussion around the topics treated in the
report itself. The views and opinions expressed in this paper are those of the author(s) and
should not be attributed to IFAD, its Member States or their representatives to its Executive
Board. IFAD does not guarantee the accuracy of the data included in this work. For further
information, please contact [email protected]. IFAD would like to acknowledge
the generous financial support provided by the Governments of Italy and Germany for the
development of the background papers of the 2019 Rural Development Report.
About the authors
James Sumberg is a Fellow in the Rural Futures Research Cluster at the Institute of
Development Studies in Brighton, United Kingdom. He is an agriculturalist by training and has
over 30 years’ experience working on small-scale farming systems and agricultural research
policy in sub-Saharan Africa. He currently directs a multi-country study on youth engagement
with the rural economy.
Jordan Chamberlin is a Spatial Economist in the Socio-Economics Programme at the
International Centre for Maize and Wheat Improvement (CIMMYT), based in Nairobi, Kenya.
He is interested in rural development and economic growth in the developing world,
particularly with respect to smallholder agriculture and rural household welfare. His work
emphasizes microeconomic (i.e. behavioural) foundations for conceptualizing such processes.
Areas of recent research include smallholder access to land under evolving land institutions in
sub-Saharan Africa; the efficiency of market intermediation services; the provision of
infrastructure and other public goods; and small town development.
Justin Flynn is a Research Officer and PhD student in the Rural Futures Research Cluster at
the Institute of Development Studies in Brighton, United Kingdom. He is interested in youth
employment, with a particular focus on young people living in rural areas, as well as food
security, food systems and agricultural policy. He has conducted a mixed methods study on
youth savings groups in four African countries and currently supports a multi-country study on
youth engagement with the rural economy.
Dominic Glover is a Fellow in the Rural Futures Research Cluster at the Institute of
Development Studies in Brighton, United Kingdom. He specializes in the study of technology
and processes of socio-technical change, particularly in small-scale farming in the global
South. He has more than 14 years of experience in research, policy analysis and
communication on technological change, innovation, knowledge systems, governance and
policy processes relating to agriculture, biotechnology and rural development. He is currently
completing a four-year collaborative research programme that aims to understand the
emergence and spread of a rice cultivation method called the System of Rice Intensification
(SRI).

Vicky Johnson is a Senior Research Fellow in the Anthropology Department at Goldsmiths
University of London. She has over 20 years of experience as a researcher and consultant in
social and community development, both in the United Kingdom and internationally. She is
Principal Investigator for Youth Uncertainty Rights (YOUR) World Research in Ethiopia and
Nepal, funded by the ESRC-DFID Poverty Fund (2016-2019). Recent research she has led
includes steps for engaging children in research; social protection and education for street
connected girls in Nairobi; and youth sexual rights.

3
Table of contents
1. Introduction 5
2. Opportunity: background and argument 6
2.1 Background 6
2.2 The argument 7
3. Diversity, local economy and spatial analysis 8
3.1 The local rural economy 8
3.2 Rural diversity and spatially explicit frameworks 9
4. Landscapes of rural opportunity: a framework 12
4.1 Introduction 12
4.2 Landscapes are structured, landscapes are read 13
5. New empirical analysis 16
5.1 Data 17
5.2 Distribution of Africa’s young people across economic geographies 17
5.3 Individual labour allocation by age 20
5.4 Individual labour allocation of young people varies by context 22
5.5 Distribution of employment opportunities 23
5.6 Alternative ways of capturing geographical context 27
5.7 Household type as a contextual factor 31
5.8 Income orientations of young households change over economic geographies 33
5.9 Economic geographies as opportunity structures 35
6. Conclusions 35
References 37
Appendix 42

Landscapes of rural youth opportunity
4
Abstract
This paper is motivated by the consistent portrayal, within current policy discourse, of agriculture and
the broader rural economy in Africa as domains of opportunity for rural youth. It presents a new
conceptualization of landscapes of rural youth opportunity, where these landscapes reflect an
individual’s reading of the complex interplay between economic geography; local history, agrarian
relations, institutions and politics; social and cultural norms; family influences; education and
experience; aspirations and preferences; and access to resources. The argument is that it is essential
to acknowledge the importance of opportunity structures, and avoid anything that suggests that
individual characteristics, such as agency, aspirations, skills, entrepreneurial behaviour and “good
choices” should be the primary considerations in relation to an “investing in youth” strategy. The paper
also presents new empirical analysis of young people’s engagement with the rural economy using
LSMS data from six African countries.

Landscapes of rural youth opportunity
5
1. Introduction
What is “opportunity”? What does opportunity look like to young people in rural areas? Does rural
opportunity differ from one agro-ecological zone to another, within an agro-ecological zone, or from
one location to another? Does rural opportunity differ between and/or within social groups? What are
the relationships between opportunity and identity, or opportunity and aspiration? What roles do
structure, agency and power play in shaping rural opportunity? Finally, how important are differences
in opportunity for young people’s livelihoods; and what implications do these differences have for
programming focused on rural youth?
This paper is motivated by the consistent portrayal, within current policy discourse, of agriculture and
the broader rural economy in Africa as domains of opportunity for rural youth. This perception of rural
youth opportunity also bundles together ideas about the propensity of young people to innovate
(Sumberg and Hunt 2018), and about technology, mechanization, entrepreneurship, value chains and
the importance of seeing “farming as a business”. The current push to “invest in youth” for rural and
national development rests squarely upon this set of intertwined ideas.
However, the picture of rural opportunity that emerges from policy documents and that underpins
policy and investment decisions is generally very broad, abstract and poorly theorized (if at all). This
hinders efforts by IFAD and other agencies to invest in youth effectively, whether directly (through
youth-specific programmes) or indirectly (through good rural development).
The objective of this paper is to develop a conceptualization of landscapes of rural youth opportunity
that (1) is grounded in social and economic science concepts and theory, (2) will generate new and
policy relevant empirical analysis, and (3) can help to constructively re-frame policy debate, and inform
programme design and implementation. The paper also presents new empirical analysis of young
people’s engagement with the rural economy of based on nationally representative household survey
data from six African countries (Ethiopia, Uganda, Tanzania, Zambia, Nigeria and Niger).1We focus on
sub-Saharan Africa, although we argue that the general framework is more broadly applicable.
Underpinning the paper is a view of youth “as generation”, the essence of which:
is that young people are defined in society as youth, not (or not only) by biological age, but by their
relationships with non-youth in society, economy and politics. In plain language: you are a youth as
long as society considers and treats you as not yet having adult status (Bourdieu, 1993; White, 2018,
also see; Wyn and White, 1997).
However, for the analysis of LSMS data we are particularly interested in the early stages of livelihood
building, so focus primarily on that segment of rural youth that includes all young people aged 15-24
years living in rural areas, rural towns and peri-urban areas.
Following this introduction, the paper proceeds as follows. Part 2 sets out the argument and provides
the background to it. Part 3 briefly reviews the use of different typologies, domains and spatially explicit
frameworks in rural development, and assesses how these might inform the analysis of local rural
economies as the locus of rural youth opportunity. Part 4 presents the conceptualization of landscapes
of rural opportunity. Part 5 presents new empirical analysis using survey data from six African
countries. Part 6 concludes and highlights a number of implications of the analysis.
_____________________________________________
1 With the exception of Zambia, these countries are the focus of the IFAD-funded research project
Youth Engagement with the Rural Economy, which is currently being undertaken by IDS, the University of Sussex, CIMMYT and ActionAid.

Landscapes of rural youth opportunity
6
2. Opportunity: background and argument
2.1 Background
There is a vast literature on the topic of opportunity from various disciplinary perspectives including
business, strategy, entrepreneurship, innovation, education and philosophy. A detailed review is
outside the scope of this paper. Suffice it to say that relatively little of this literature deals directly with
young people in rural contexts in the South.
A particularly important body of literature for this paper is that related to the theory of occupational
allocation, which is also referred to as opportunity structure theory. Developed in the United Kingdom
in the late 1960s and 1970s, the central tenet is that the job opportunities available to school leavers
became “cumulatively structured” (Bynner and Roberts, 1991; Lehmann et al,. 2015; K. Roberts, 1968,
1977; K. Roberts et al., 1994; K.Roberts, 1995).2
Because of this structuring, K. Roberts (1977) argued
that it was a mistake to over-emphasize the role of aspirations and choice in determining how young
people enter the labour market. Indeed, he put it even more starkly: “neither school leavers nor adults
typically choose their jobs in any meaningful sense: they simply take what is available” (p.3).
Roberts’ warning was rooted in an analysis of what he called the “opportunity structures”, which, he
theorized, create distinct routes that govern both young people’s entry into the labour force and
subsequent career progress. These opportunity structures result from the inter-relationships within a
web of determinants including place, family origins, gender, ethnicity and education, and labour market
processes. It is not so much that opportunity structures leave the individual with no room for
manoeuvre, but rather that for most young people who are poor, poorly educated and/or socially or
geographically marginalized, it is likely to be very tightly constrained. As Roberts put it:
Choice is not irrelevant, but it fails to explain enough. It cannot account for the contexts, including the
labour market contexts, in which young people make their choices, and it cannot identify the different
limits within which different groups of young people choose (K. Roberts, 2009, 362).
The main implication of opportunity structure theory is that aspirations, choice and individual
responsibility are simply not very useful or appropriate policy framings. Change in how young people
enter and progress in the labour market will come about, not as a result of higher aspirations, better
choices or some skills training. Rather it is the opportunity structures that need to change, which
means nothing less than a long-term commitment to fundamental social change.
The perception of entrepreneurial opportunity literature (e.g. Maija et al., 2012) suggests that an
individual’s understanding of opportunity reflects both objective and subjective elements. In other
words, opportunity should be understood as a hybrid construction that emerges through a socially-
embedded individual’s reading of, for example, an economic, technical or social milieu. There is a
large quantitatively-oriented literature that seeks to model the search processes that entrepreneurs
and firms use to identify opportunity (Felin et al., 2014).
Another body of literature that has not yet been brought into debates about international rural
development originates from work in urban areas in the United States and focuses on the geography
of opportunity and so-called opportunity communities3 (Galster and Killen, 1995; Galster, 2017; Knaap,
_____________________________________________
2 https://runninginaforest.wordpress.com/category/careers-theory-2/theories-every-careers-adviser-
should-know/; https://warwick.ac.uk/fac/soc/ier/ngrf/effectiveguidance/improvingpractice/theory/traditional/ 3
http://kirwaninstitute.osu.edu/researchandstrategicinitiatives/#opportunitycommunities

Landscapes of rural youth opportunity
7
2017; Reece and Gambhir, 2009). This literature suggests that neighbourhoods are the primary
environments in which key opportunity structures are accessed: “neighbourhoods often determine
access to critical opportunities needed to excel in our society, such as high‐performing schools,
sustainable employment, stable housing, safe neighbourhoods, and health care” (Reece and
Gambhir, 2009). The notion of opportunity communities recognizes the fact that the local context, and
the degree to which it is enabling (or not), plays “a substantial role in life outcomes of inhabitants” (p.2).
It should be noted, however that an enabling neighbourhood or local context may only go so far in
addressing deep seated social, political or economic opportunity structures.
Finally, the literature on change-scapes (or youth centred landscapes of change) highlights the role
that young people’s developing identities, ideas and agency play in the structuring and re-structuring,
reading and re-reading of landscapes of opportunity (Johnson, 2011, 2014, 2017). The notion of
change-scape takes into account young people’s lived experience, and how their developing identities
and transitions to adulthood are influenced by the political, environmental, cultural and institutional
contexts in which they live; but how, through their individual and collective agency, they can also, to
some degree, change these contexts. Opportunity structures theory and the change-scape approach
are to a certain degree in tension, with the former giving greater importance to structures and the latter
to agency.
2.2 The argument
We are interested in understanding how and why rural young people in Africa get started along
particular livelihood trajectories,4 especially in the context of processes of rural transformation. We
argue that the individual’s reading of the local landscape of opportunity plays a significant role in this
process.
The image of a landscape of opportunity is particularly useful in furthering the understanding of rural
youth opportunity. The language of “opportunity landscape” is well established in the entrepreneurship
and strategy literatures, although its value is contested (Felin et al., 2014). A physical landscape is a
complex, multi-dimensional, relational space made up of different elements. Landscapes change over
time and are read differently depending on the background and experience of the observer: the same
landscape may be perceived as threatening by one individual and welcoming by another. Thus,
landscapes are constructed from a combination of the objective and the subjective. Landscapes are
navigated, and the process of navigation generates both new experiences and knowledge, and may
reveal aspects of the landscape that were previously hidden from view. Over time, an individual’s
understanding of, and relationship to, the landscape develops and evolves, and indeed, his/her actions
may also change the landscape. We argue that the image of a landscape of opportunity as complex,
relational and dynamic – and likely to be read differently by different actors – is more useful than, for
example, the idea of a rural “opportunity set” (often understood as the overall objective set of
opportunities available to individuals within a community).
_____________________________________________
4 We purposely use the term livelihood instead of work, employment or job, because young people’s
aspirations and their imagined futures encompass a broad range of concerns including family, marriage, children, religion, community, health, location and well-being, in addition to work, employment or career K. Hoskins, 'The Changing Landscape of Opportunity for Young People', Youth Identities, Education and Employment: Exploring Post-16 and Post-18 Opportunities, Access and Policy (London: Palgrave Macmillan UK, 2017), 1-21, K. Hoskins and B. Barker, 'Aspirations and Young People's Constructions of Their Futures: Investigating Social Mobility and Social Reproduction', British Journal of Educational Studies, 65/1 (2017/01/02 2017), 45-67, T. Yeboah et al., 'Perspectives on Desirable Work: Findings from a Q Study with Students and Parents in Rural Ghana', European Journal of Development Research, 29/2 (2017), 423-40.

Landscapes of rural youth opportunity
8
The landscape of opportunity is neither objective, fixed, nor exogenous to the individual. Rather it
represents an individual’s reading of the complex interplay between economic geography; local
history, agrarian relations, institutions and politics; social and cultural norms; family influences;
education and experience; aspirations and preferences; and access to resources. These factors
structure the landscape of opportunity, but it is the young person’s reading of the landscape, through
the lens of developing and shifting identities, that gives it meaning.
Thus, an individual’s reading of and engagement with the landscape of opportunity reflect the interplay
of structure and agency (Giddens, 1984; Sarason et al., 2006). Both understanding and engagement
evolve over time, reflecting changes in agency (the capacity and freedom to act) that stem from the
accumulation of knowledge, skill and experience, changing social position, evolving identities, etc. The
implication of this is that the landscape of opportunity may be read very differently by young people
within the same rural setting, and across different rural settings.
The more that is known about (1) how landscapes of opportunity are structured, (2) the relative
importance of young people’s reading of the landscape of opportunity in explaining the early stages of
livelihood trajectories, and (3) the relative importance of the different influences on young people’s
reading of a landscape of opportunity, the more potentially effective policy and investment will be.
Thus, we seek to develop a systematic way to think about landscapes of opportunity and how they are
structured, read, navigated and changed. We are not proposing a model of how young people make
decisions, or how they sort through the various possibilities that might be open to them. The latter
would be a different programme of research and conceptual development.
Finally, we take it for granted that opportunities reflect and are shaped by higher-level, non-local
conditions, factors and forces, such as trends in the global political economy, trade regimes, policy
processes and politics at various levels, history, etc. However, while clearly important, these key
conditions and interactions are not the immediate focus of this paper.
3. Diversity, local economy and spatial analysis
3.1 The local rural economy
Rural economic opportunity exists both on- and (increasingly) off-farm, and it has a strong spatial
dimension. To date, however, little progress has been made in developing what might be thought of as
a “local economy” approach to agriculture and development.5 Instead, much of the analysis of
technological change and agricultural commercialization in Africa – two critically important aspects of
rural transformation (IFAD, 2016) – has been at the farm and/or household levels. A local economy
approach is appealing because rural opportunity emerges within the (spatially mediated) interplay
between on-farm, rural off-farm and other economic activity. The dynamics of this interplay is at the
heart of the livelihood diversification (Ellis, 2000), de-agrarianization (Bryceson and Jamal, 1997;
Bryceson, 2002) and pluri-activity literatures.
_____________________________________________
5 The “local” in terms such as local economy and local food is not easily defined. For our purposes, we
conceive of a local economy as being characterized by a relatively dense network of exchange (including economic and social exchange).

Landscapes of rural youth opportunity
9
The most common approaches to understanding a local economy include analysis of trends in growth,
employment (or unemployment), job creation; distribution of income/wealth, etc. Existing data sets can
provide some useful indicators, however available data are often not adequate or appropriate for fine-
grained analysis at a localized level. Another challenge is that the nature of much (on- and off-farm)
rural work – essentially self-employment and/or, informal, seasonal and (at least partially) subsistence-
oriented – means that the value of standard labour market concepts and indicators, such as
employment, unemployment, underemployment and job creation needs to be carefully considered.
Any understanding of the interplay between on-farm and rural off-farm economic activity, and the role
of agricultural intensification and commercialization in this interplay, must be informed by the well-
established literature on structural change, forward and backward linkages, spill-overs and local
multipliers.6 The literature on territoriality and regional economic development is also relevant (de
Janvry and Sadoulet 2007; Schejtman and Berdegué 2004).
It is also the case that opportunities within the local rural economy exist alongside, and in relation to,
opportunities further afield. The landscape of opportunity extends well beyond what might be
considered the local economy, and encompasses other rural, small town and urban settings, both
within and across national borders. In this paper, the focus is principally on rural opportunities,
however the literature on youth mobility in Africa is certainly relevant too (Porter et al., 2010a; 2010b;
2012; 2017).
3.2 Rural diversity and spatially explicit frameworks
A long-term interest of geographers, economists and agricultural scientists has been to make sense of
the diversity that characterizes rural Africa. Some have focused at the “system” level, including early
efforts to classify agricultural and farming systems (Allan, 1965; Rutherberg, 1971).7 The spatial
aspect of these classifications was often either very broadly drawn, or implicit. The use of
recommendation domains within farming systems research sought to group farms, farmers or
households with similar characteristics or facing similar conditions, and for whom the same technical
recommendations were likely to be appropriate (Collinson, 2000; Hildebrand et al., 1993). Again,
spatial distribution of and/or spatial relations among and between recommendation domains was often
of secondary importance.
_____________________________________________
6 Although some common assumptions about local multipliers may need to be re-thought. For example,
it is often assumed that farm production-related transactions help sustain local economies, particularly where other production activities are limited. Relatively recent research from the United Kingdom and Europe tested this assumption, and findings from this research highlight:
the importance of allowing for context when explaining farmer purchasing and sales decisions. They also reveal a highly complex pattern of production-related linkages in the region, with many farmers choosing to bypass their most proximate agribusinesses. Certain towns are found to dominate agriculture related transactions in the region, reflecting the spatial concentration of upstream and downstream agribusinesses. The findings provide new insights into theoretical debates on the role of small towns in the urban system and the changing importance of geographical distance in determining business transactions Kate Pangbourne and Deborah Roberts, 'Small Towns and Agriculture: Understanding the Spatial Pattern of Farm Linkages', European Planning Studies, 23/3 (2015/03/04 2015), 494-508. also see: Deborah Roberts, Edward Majewski, and Piotr Sulewski, 'Farm Household Interactions with Local Economies: A Comparison of Two Eu Case Study Areas', Land Use Policy, 31/Supplement C (2013/03/01/ 2013), 156-65.
These findings suggest the need for a nuanced, context-specific understanding of the structure and dynamics of local rural economies and how these shape landscapes of rural opportunity. 7
Also see: http://www.fao.org/docrep/003/Y1860E/y1860e04.htm#P1_2

Landscapes of rural youth opportunity
10
Agro-ecological zonation is an example of a more spatially explicit approach. Here physical and bio-
physical characteristics, such as elevation, soil type and rainfall, are used to identify zones with a level
of homogeneity sufficient to describe “potential” and thus allow more effective planning and agricultural
extension (for an example from Kenya see Jiitzold and Kutsch, 1982; Sombroek et al., 1982). Most
exercises along these lines paid relatively little attention to the socio-economic or agrarian relations
underpinning ongoing agricultural activities within the agro-ecological zones. The World Bank’s
“sleeping giant” analysis of Africa’s guinea savannah is a recent example of this approach ( World
Bank, 2009).
A simple framework for thinking about the diversity of rural areas that brings together elements of the
agro-ecological and the socio-economic was proposed by Wiggins and Proctor (2001). This framework
uses differences in quality of natural resources and access to markets to characterize current activities
within different rural areas, and potential future agricultural and rural development trajectories (Table
1). Along similar lines, the development domains literature (Chamberlin et al., 2006; Pender et al.,
2004; Pender et al., 2006) uses agricultural potential, access to markets and population density to
understand “opportunities and constraints facing alternative rural livelihood options” (Chamberlin et al.,
2006). A further recent development has been in the mapping of sub-national agricultural development
segments linked to typologies of small farms (AGRA, 2017; Hazel et al., 2017; Hazel 2017).
The conceptualization of landscapes of rural youth opportunity that we develop below builds on and
extends the Wiggins and Proctor framework and the development domains approach by moving the
analysis from a development domain to a local rural economy, and by making explicit the importance
of local political economy, local institutions and social norms in shaping landscapes of opportunity
(Ripoll et al., 2017).

Landscapes of rural youth opportunity
11
Table 1. Rural diversity: a characterization, with most likely activities
Location characteristics
Quality of
natural
resources
Accessible areas “Middle” countryside Remote rural areas
Good
Market gardening and
dairying
Daily commuting to the city
Weekend recreation
activities
Manufacturing industry
may “deconcentrate” from
city proper into this space
Arable farming and
livestock production,
specialized, with
capital investment,
producing
surpluses for the
market
[Same for forestry,
fishing, mining,
quarrying]
Tourism and recreation
Some crafts
Employment in off-farm
economy including rural
industry
Migration (in or out)
Subsistence farming,
with only
the production of
surpluses of high value
items that can bear
transport costs
Crafts and services for
local markets
Tourism and recreation
Migration (out)
Poor
As above: i.e. Market
gardening and dairying
NB: Quality of natural
resources
not so important since
capital can
be used to augment poor
land – e.g. by irrigation,
fertilizer – when needed for
intensive farming
Probably lightly settled
Extensive farming,
probably livestock.
Few jobs
Tourism and recreation
Some crafts
Migration
Subsistence farming, low
productivity. Surpluses
very small or nil
Crafts and services for
local markets
Tourism and recreation
Migration
Source: Sumberg et al. (2015), adapted from Wiggins and Proctor (2001). “Accessible” areas include peri-urban and rural areas with good physical access to urban markets

Landscapes of rural youth opportunity
12
4. Landscapes of rural opportunity: a framework
4.1 Introduction
Possibility or opportunity?
Most rural situations provide people – including young people – with a range of different economic
activities that might be pursued, in principle or in theory. However, a young person is unlikely to
consider all of these theoretical possibilities equally as opportunities. We argue therefore that it is
useful and important to distinguish between possibilities and opportunities.
We consider a possibility to be an activity that is or may be viable in a given economic geography and
local context. A possibility is an option, akin to an element of what is often referred to as an
“opportunity set”. Due to incomplete knowledge and limited experience, there are likely to be some
possibilities that an individual is simply unaware of. Among the possibilities that she or he is aware of,
some may be more attractive or more desirable, for a whole variety of reasons, others less so. Some
may be so unattractive as to be unthinkable.
We will consider an opportunity to be a possibility that an individual is aware of and which, for
whatever reason, is considered desirable or attractive. We would expect that differences in age,
gender, class, religion and education will be important in explaining differences in the perceptual
classification of possibilities and opportunities. For example, for an ambitious secondary school leaver,
doing unpaid labour on family fields may well be a possibility, but it is unlikely to be seen as an
opportunity.
While mindful of Kenneth Roberts’ caution not to over-emphasize the roles of aspirations and choice in
determining how young people enter the labour market, we suggest that the distinction between
possibility and opportunity that is being proposed here is likely to be increasingly important as young
people have better access to education, and when they think that they have, or should have, livelihood
options.
Possibility areas and modes of engagement
In thinking about landscapes of rural opportunity we argue that it is useful to step back from a focus on
individual possibilities or specific jobs, and to focus on what we will call possibility areas. A possibility
area can be thought of as a something like a micro-sector, sitting between the level of a sector or
industry (e.g. agriculture) and a particular job (e.g. agricultural labourer). For example, in a given rural
context, cereals might represent an important possibility area, that would include production, as well as
the provision of associated goods and services, local processing, transportation and so forth. In the
light of the earlier discussion of local rural economies, the notion of a possibility area is attractive
because it includes and links together both on-farm and off-farm (or farm and non-farm) activities.
It follows that within any given possibility area, there will be a number of different potential ways that an
individual or firm might get involved – we call these different modes of engagement. For example,
consider a young man who works as a wage labourer on a neighbour’s maize farm because he has no
access to land on which to farm on his own account. For this young man, cereals is the possibility
area, and wage labour is the mode of engagement. For the farmer who employs him, cereals is also
the possibility area, and self-employment is the mode of engagement. The farmer’s sister supplies
maize seed through a kiosk she operates. For her, cereals is still the possibility area, but the mode of
engagement is (off-farm) self-employment.

Landscapes of rural youth opportunity
13
Social norms and expectations may mean that some possibility areas and/or some modes of
engagement are not open to or thought appropriate for members of certain social groups. A young
person’s access to resources – including land, capital, knowledge and networks – will also influence
what possibility area and mode of engagement combinations are open.
4.2 Landscapes are structured, landscapes are read
Landscapes of opportunity are structured
Below we identify four factors that act to structure local landscapes of rural youth opportunity:
economic geography, local particularities, social norms and family and access to resources.
Economic geography
The basic insight from economic geography is that in any given location, some economic activities are
more viable than others. In relation to natural resource-based activities like crop and livestock
production, it is clear that aspects of the natural resource base and agro-ecology, including soil
characteristics, altitude and climate, will to a large extent determine what commodities might be
produced. The well-established traditions of land evaluation (FAO, 1976) and agro-ecological zonation
(FAO, 1996; Fischer et al., 2002) have sought to capture this aspect of rural possibility.
But even if the production of a commodity is possible from an agronomic or agro-ecological
perspective, it will not necessarily be economically viable. Economic viability depends on, among other
things, access to input and output markets. Depending on the characteristics of the commodity, ease
of market access will reflect some combination of spatial proximity, the quality of infrastructure and the
cost of transportation services (as first elucidated in the early 19th century, Von Thünen, 1966).
The Wiggins and Proctor framework introduced earlier (Table 1), as well as the development domains
literature, integrate differences among rural areas in relation to both natural resources and market
access. The basic message is clear: economic geography acts to structure what is possible at the
highest level, independent of local context, specific social norms or any individual preferences. In
terms of the transformative potential of agricultural intensification and commercialization, frameworks
like this should focus the minds of rural development planners, and those interested in employment
possibilities for rural youth, on (1) middle countryside areas with good natural resources and (2) peri-
urban zones (Ripoll et al., 2017). It is of course the case that these frameworks present a static picture:
investments in transportation or irrigation infrastructure, for example, or radical innovations, could
fundamentally shift what is possible and what is economically viable in a given area.
Local particularities
While economic geography is clearly important, it provides only a first step in understanding the
economic possibilities within a particular location or local economy. Two local economies situated in
similar economic geographies (e.g. middle countryside with good natural resources) might present
very different pictures in terms of growth or employment generation because of local agrarian
dynamics (including historical patterns of development, demography, land availability and the
distribution of land holdings, inward investment in land etc.), and the institutions and politics that
underpin them (from inheritance and land tenure regimes, to local political elites, cooperatives and
farmer groups). Local agrarian dynamics will also reflect an array of extra-local factors including
regional and national politics and policy, and consumer demand.

Landscapes of rural youth opportunity
14
Local particularities and context structure opportunity landscapes not so much by eliminating particular
commodities, but rather by favouring certain modes, models and scales of production (e.g.
smallholder, contract, plantation etc), and by creating barriers to entry (e.g. through the availability
and/or cost of land) that may affect some groups more than others.
Social norms
Norms and expectations associated with social differences including gender, age, class, marital status,
religion and ethnicity act to reproduce preconceived notions of what is acceptable or appropriate [as in
Whitehead’s “gender-ascribed constraints”, and the idea that public institutions act as “bearers of
gender” (also see Kabeer, 2016; Whitehead, 1979)]. As a result, in particular locations, some
economic activities might not, for example, be considered appropriate for women (or young women, or
young single women). The literature on “women’s crops” and “men’s crops” provides additional
examples of how social norms structure rural economic opportunity (Carr, 2008; Doss, 2002; Evans et
al., 2015; Githinji et al., 2014; Lambrecht, 2016; Orr et al., 2016b; Orr et al,. 2016a). Gender-based
norms and expectations around mobility or long-distance travel is another example.
Norms and expectations are seldom absolute, and there is often some disjuncture between what can
or should be done, and what is actually done. Norms evolve over time, and through individual and
collective agency young people challenge social norms and thereby play a role in their evolution.
Family and access to resources
Family is widely understood to be a (if not the) major influence on young people’s aspirations and
imagined futures (Dabalen et al., 2014; Hoskins and Barker, 2017). Particularly for younger people, it
is often through families and kin groups that productive resources including land, finance, technology,
knowledge and networks are accessed. The key point is that within a particular possibility area,
differential access to resources may determine the modes of engagement – e.g. unpaid labour, wage
labour, self-employment – that are open to an individual.
It is of course the case that the local particularities and social norms referred to above will also be
reflected in the differential access to resources, including education and land, which young people
often access initially through families. There has been some discussion of the importance of land
tenure and inheritance regimes in restricting young people’s access to land in some situations
(Amanor, 2010; Berckmoes and White, 2014; Bezu and Holden, 2014), and some observers have
called for a new research focus on the effects of intergenerational decision making and transfers on
youth livelihoods.
Landscapes of opportunity are read
Our argument is that, in effect, the landscape of opportunity emerges, or becomes meaningful, only as
and when it is read by an individual.
Thus, reflecting their social situation (e.g. living at home or away; single or married; with or without
children), family background and the future they imagine for themselves, individual young people will
have views on the different possibilities that they see as being open to them. Some might be
dismissed out of hand (“I would never do that!”); some considered only in times of crisis; others might
be acceptable; and a few might be seen as highly preferable.

Landscapes of rural youth opportunity
15
Information about, and familiarity with, the different possibilities affects the reading of the landscape,
particularly for younger people whose knowledge about some possibilities is likely to be incomplete or
imperfect, and may even be wrong. We would expect that what an individual finds acceptable or
preferable will evolve over time, e.g. with greater knowledge and experience, or increasing obligations.
The distinction made earlier between possibility areas on the one hand, and modes of engagement on
the other, suggests that an individual’s reading of the situation must be considered at two levels. Thus,
while a possibility area – e.g. cereals – may be seen as an opportunity by a particular individual, some
possible modes of engagement within this possibility area, like small-scale producer or farm labourer,
may not be.
Summary
The proposed conceptualization of landscapes of rural youth opportunity is illustrated in Figure 1. This
figure suggests that a young person reads and engages with the landscape of opportunity as an actor
situated in a certain economic geography, and embedded in a set of specific local historical,
environmental, social, economic, political and family relations. Some of these relations will enable and
others will constrain.
The central proposition is that a young person’s landscape of opportunity emerges from the interplay
of structure and agency. It is also dynamic and evolving, reflecting changing circumstances, the
exercise of agency, and the accumulation of experience, knowledge and other assets. This
understanding is in contrast to the more common focus on aspirations and mind-set, individual
decision making and (Sumberg and Hunt, 2018) skills.
Figure 1. Landscapes of rural youth opportunity
Source: Authors
A young person’s understanding of possibility and opportunity, and reading of the
landscape of opportunity
• Circumscribed by structures & power relations• Emergent through the exercise of agency• Changing over time
Local economic geography (access to markets, quality of
natural resources, pop. density)
Social norms (relating to age, gender,
class, ethnicity, religion etc)
Local particularities(history, agrarian relations, land
availability, politics & institutions etc)
Access to resourcesIdentities, aspirations,
imagined futures, preferences
Education & experience
International & national policy, trade & market relations, history, politics, trends, dynamics…
Peers
Family, class, gender etc.

Landscapes of rural youth opportunity
16
Sumberg and Hunt (2018) acknowledged the reality that compared to older people, young people will
generally have less experience of the world of work and more limited access to productive resources.8
It seems reasonable to expect that these conditions will have important implications for how
landscapes of opportunity are read, and the possibility areas and modes of engagement that are open
to them. They may also be expected to impact on the success or otherwise of young people’s
engagement with employment-oriented development interventions.
The suggestion that incomplete or imperfect information affects how an individual reads the landscape
of opportunity points to some important questions: How do young people learn about economic or
livelihood possibilities? How does information and knowledge about different possibilities and modes
of engagement move among young people, and how does social difference affect this? Does the
nature of the local economy (more or less diverse, more or less commercialized, more or less
dynamic, etc.) affect this learning? What interventions have been used to address the problem of
incomplete or imperfect information about the possibility set, and with what effects?
If we accept that young people must read and navigate the landscape of opportunity, and that this
navigation is a social process,9 then it will be important to understand how family, household and
individual characteristics affect the process of navigation and associated outcomes. This can be done
by focusing on the lived experiences of young people, and how they negotiate changing family
expectations, rapidly changing political contexts and fragile environments.
5. New empirical analysis
To explore the degree to which our economic geography framework (laid out in Table 1, above) has
empirical traction, we use recent data from several nationally representative household survey
datasets, along with geographical contextual factors which represent the two axes of the framework
(market access and agricultural potential).
Our basic approach is to first use geospatial estimates of the extent and locations of these conditions
to characterize the relative share of Africa’s young people who operate within them. We then ascertain
how observable labour allocation and other economic engagement outcomes vary by age of
individual, and the degree to which these outcomes vary across spatial economic contexts.
_____________________________________________
8 This is not to suggest that young people do not have valuable knowledge and experience, or that
some young people may not have greater access to productive resources, and knowledge and experience in some areas than some adults. 9
It may be useful to look to the literature on “social navigation”, which is widely used, and particularly “when referring to how people act in difficult or uncertain circumstances and in describing how they disentangle themselves from confining structures, plot their escape and move towards better positions” Henrik Vigh, 'Motion Squared: A Second Look at the Concept of Social Navigation', Anthropological Theory, 9/4 (2009), 419-38, J. Flynn et al., Failing Young People? Addressing the Supply-Side Bias and Individualization in Youth Employment Programming. Ids Evidence Report 216 (Brighton: Institute of Development Studies (IDS), 2017).

Landscapes of rural youth opportunity
17
5.1 Data
Data on individual labour allocation, as well as household level income-orientation, were drawn
from georeferenced nationally-representative household survey data from six countries, as
described in Table 2 (also see Appendix Table 1)10
Our sample was restricted to the rural
component, defined as those households located in enumeration areas defined as rural by the
national statistical agency for each country, as well as households located in nominally “urban”
enumeration areas, but with population densities below 1000 persons per square kilometre.
Table 2. Household survey data used in this study
Country Survey Year used in this analysis
Sample households*
Sample individuals**
Ethiopia LSMS-ISA 2015-16 3,920 11,091
Niger LSMS-ISA 2014-15 2,847 8,220
Nigeria LSMS-ISA 2015-16 3,488 11,817
Tanzania LSMS-ISA 2012-13 3,393 9,884
Uganda LSMS-ISA 2012-13 2,212 6,734
Zambia RALS 2014-15 7,934 28,003
Notes: *Sample restricted to rural and peri-urban areas. **Individuals aged 15 years or more within sample households.
To complement these data, we define zones of economic geography based on the following variables.
For market access (represented as the horizontal dimension of the framework: high access, middle-
countryside and remote areas), we rely on estimated travel time to the nearest urban centre of 50,000
or more inhabitants, using data from the Malaria Atlas Project (Weiss et al., 2018). “Accessible” areas
are defined as locations within 30 minutes of travel time to an urban centre of 50,000+; areas are
classified as middle-countryside if they are between 30 minutes and 2 hours; remaining areas are
classified as remote. We further net out urban areas using the boundaries defined in the Global
Human Settlements database (Pesaresi and Freire, 2016).
For agricultural potential, we use a simple measure of EVI (Enhanced Vegetation Index) as our
primary indicator, using data from the MODIS sensor. As a measure of biomass, EVI effectively
synthesizes a number of agroclimatic, edaphic and other conditioners of agricultural production
potential. We define low potential areas as those with less than 0.5 EVI at the peak of greenness over
a three-year period (2014-16). This threshold is fundamentally arbitrary but does provide a useful
shorthand way of distinguishing between conventionally recognized high and low potential areas.
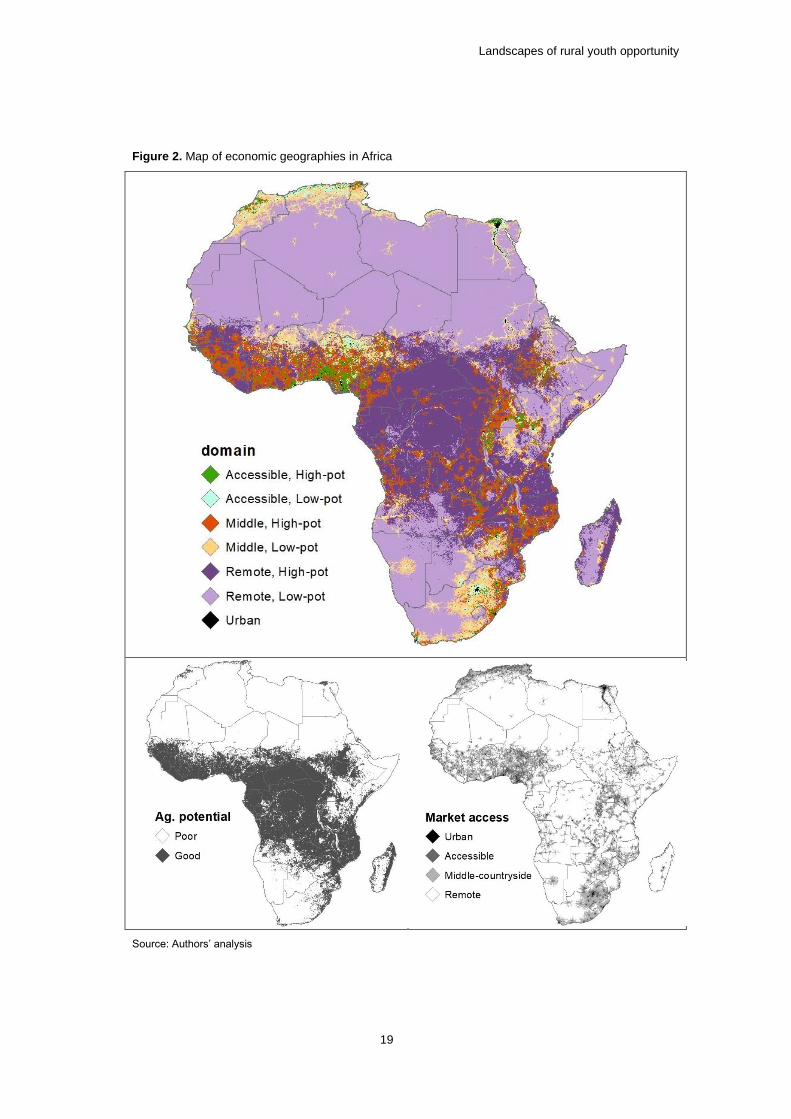
5.2 Distribution of Africa’s young people across economic geographies
Using geospatial estimates of average annual rainfall and distance to nightlights from the sources
described above, Figure 2 shows the distribution of six economic geographies across Africa. We then
overlay these mapped geographies with recent geospatial estimates of age-disaggregated population
_____________________________________________
10 Burkina Faso is also one of the countries we have targeted for this analysis, but there are no
geographical coordinates available for these households, and therefore we are unable to include this in
the current study. We have contacted the World Bank’s LSMS-ISA team about acquiring these data but
have not had a substantive response yet.

Landscapes of rural youth opportunity
18
distributions (Wardrop et al., 2018) to quantify the number and shares of young people (aged 15-24) in
each geography. Results are summarized in Table 3 (also see Appendix, Table 2, for a larger
selection of countries). It is striking that, overall, 56 per cent of young people live in areas with low
agricultural potential, and 28 per cent in areas that have low potential and are also remote. The
remaining young people are divided between Accessible (28 per cent) and middle countryside (22 per
cent) areas, and a slight majority of these young people in areas with relatively low agricultural
potential.
These findings would appear to have important implications for youth-focused agricultural and rural
development strategies: is it realistic that the rural economy can generate meaningful employment for
the 62 per cent of rural youth living in remote areas and low potential middle countryside areas?
Key points:
• Young people in rural sub-Saharan Africa (SSA) face a diverse set of economic
geographical conditions, and a correspondingly diverse set of likely opportunities
• Almost half the population lives in relatively highly accessible areas, where non-farm rural
opportunities are expected to be particularly relevant
• Of those that live in moderately accessible and remote areas, where agriculture is relatively
more important, the majority are in lower potential areas, in which both the farm and non-
farm economies are expected to offer fewer economic opportunities
Landscapes of rural youth opportunity
19
Figure 2. Map of economic geographies in Africa
Source: Authors’ analysis

Landscapes of rural youth opportunity
20
Table 3. Distribution of young Africans (aged 15-24) across economic geographies (1000s)
Market access
Agricultural
potential High access
Middle-
countryside Remote Total
High 26,160 22,034 48,194 96,388
Low 35,026 25,760 60,786 121,573
Total 61,186 47,794 108,981 217,961
High 12% 10% 22% 44%
Low 16% 12% 28% 56%
Total 28% 22% 50% 100%
5.3 Individual labour allocation by age
As a precursor to examining how economic engagement is shaped by geographic and other contexts,
we examine available indicators of individuals’ labour allocation by age. Results indicate that patterns
vary strongly by age. Figure 3 shows the percentage of individuals in Tanzania who report participation
in wage employment, non-farm business, family farm activities and school. Those who report no
participation in any of these categories are also tabulated. As expected, young people are much more
likely to be in school. Of particular note, however, is the relatively low share of even relatively young
individuals who are in school, even in the 15-18 range, where only about half the sample reports
currently being in school.11
This share drops precipitously between 15 and 20. The difference between
15-19 and 20-24 year olds also highlights some of the drawbacks of packaging information about
“youth” into the standard 15-24 year old age range, given the clear heterogeneity of labour allocation
patterns within this range. Furthermore, there is a strong spatial dimension to this: individuals in more
remote areas are less likely to report being in school at any age, signalling that average school leaving
ages are falling with remoteness (Figure 4). Individuals’ labour allocation for other countries, presented
in the Appendix Table 3 and Appendix Figures 1 through 6, show similar patterns.
A second pattern to note is that, although younger people are somewhat less likely to participate in
non-farm wage or business work than older people, and have slightly lower rates of family farm
engagement, they are nonetheless an important source of family farm labour.12
_____________________________________________
11 We need to critically examine the possibility that respondents said “not currently in school” if the
survey enumeration happened during a school break. This is probably not the case, but it still needs to be ruled out definitively. 12
We have other data compiled on this, showing that a majority of family farm labour comes from young adult household members. Furthermore, a sizable share of household wage income comes from such members (and wage income is an important component of total income in all countries).

Landscapes of rural youth opportunity
21
Key points:
• Strong differences in labour allocation (particularly with respect to school) within the 15-24
year age range signal the heterogeneity of engagements within young people defined by
coarse age categories
• For some of these patterns, there are strong spatial dimensions (which we explore further in
subsequent sections)
• Most young people participate in household farming activities, in contrast to the oft-made
stylized assertion that young people are abandoning agriculture in droves (although this
needs some qualification: we only view individuals who are still at home, and we do not
examine full-time equivalents of labour supplied to family farming; we can do the latter, but
have not done so yet).
• Individuals in the 18-25 year range are the most likely to report no economic activities at all.
• Off-farm wage employment is important in our sample and increases with age – a 35-year-
old in rural Tanzania is about twice as likely to have wage employment as a 20-year-old.
• Farm wages are generally much more important than non-farm wages across all age
categories.
Figure 3. Individual labour allocation decisions by age (Tanzania)
Source: Authors’ analysis
0%
10%
20%
30%
40%
50%
60%
70%
80%
90%
100%
15 20 25 30 35 40 45 50 55 60 65
% r
epo
rtin
g p
arti
cip
atio
n
Age of individual
wage employment (non-farm)
wage employment (farm)
non-farm business activities
farming activities
in school
no activity reported

Landscapes of rural youth opportunity
22
Figure 4. School participation rates, by age and remoteness category (Tanzania)
Source: Authors’ analysis
5.4 Individual labour allocation of young people varies by context
Table 4 assembles further evidence on how individuals’ labour allocation patterns differ across
economic geographies. Most strikingly, wage employment and non-farm business engagement
increases with proximity to markets. In some countries (e.g. Ethiopia, Zambia) the relative importance
of these non-farm activities decreases with remoteness more slowly in high potential areas. In other
words, in more remote areas, non-farm opportunities are greater in higher potential areas. This likely
reflects the role of agricultural surplus in enabling non-farm economic activities.
In a countervailing trend, the share of young people engaged in household farming activities generally
increases with distance from markets. The relationship between farm engagement and agricultural
potential (as currently defined) is less straightforward. In some countries (e.g. Niger), the share of
young people engaged in family farming activities is larger in higher potential areas, although in other
countries (e.g. Nigeria), the opposite appears to be the case.
The share of young people in school shows a strong positive correlation with proximity to markets;
young people in more remote areas consistently show lower rates of school attendance for the same
age groupings. These patterns also vary strongly across agricultural potential, with the difference
between school attendance in low versus high potential areas increasing with remoteness. This
pattern is interesting, although its drivers are unclear; it may be that public investments in education
(and, thus, opportunities) are more limited in marginal areas. Alternatively, it may be that relatively
higher household welfare levels in high potential areas enable young people to stay in school longer,
as there is a reduced need for them work to contribute to household income.
Key point:
• Strong differences in labour allocation (particularly with respect to school) within the 15-24
year age range signal the heterogeneity of engagements within young people defined by
coarse age categories.
0%
10%
20%
30%
40%
50%
60%
70%
80%
90%
15 16 17 18 19 20 21 22 23 24 25 26 27 28 29 30
% c
urr
en
tly
in s
cho
ol
Age of individual
Peri-urban Middle countryside Remote

Landscapes of rural youth opportunity
23
Table 4. Percentage of 15-24-year-olds reporting labour allocation to different activities
Geography
Wage
employment
Non-farm
activities
Farming
activities In school No activity
Low
pot.
High
pot.
Low
pot.
High
pot.
Low
pot.
High
pot.
Low
pot.
High
pot.
Low
pot.
High
pot.
Ethiopia
Accessible 8% 11% 10% 16% 32% 41% 49% 47% 25% 23%
Middle 6% 10% 9% 12% 45% 55% 37% 48% 23% 15%
Remote 4% 2% 6% 8% 58% 46% 37% 45% 21% 26%
Nigeria
Accessible 3% 3.6% 9% 6% 18% 19% 53% 61% 25% 23%
Middle 2% 1% 9% 9% 31% 29% 50% 53% 26% 25%
Remote 0% 0% 21% 17% 30% 4% 38% 52% 24% 26%
Tanzania
Accessible 25% 23% 14% 11% 56% 46% 29% 31% 13% 20%
Middle 17% 27% 11% 13% 80% 75% 31% 27% 5% 9%
Remote 21% 20% 13% 9% 86% 75% 20% 28% 4% 12%
Zambia
Accessible 1% 3% 0% 0% 60% 41% 40% 70% 16% 10%
Middle 8% 3% 3% 3% 69% 65% 48% 53% 5% 5%
Remote 3% 4% 3% 3% 72% 63% 48% 54% 4% 7%
5.5 Distribution of employment opportunities
Table 5 shows the distribution of wage employment across geography, in relation to the distribution of
young people (aged 15-24). This table shows, for each of the six domains of economic geography,
each zone’s share of (i) young people, (ii) employed young people, and (iii) employed young people in
full-time equivalents (FTEs). Within each country, the top panel (a) shows the distribution of these
numbers across domains. The bottom panel (b) shows the number of employed and employed FTEs
in each domain as a share of the number of people. The stark (although unsurprising) interpretation is
that the distribution of employment opportunities for young people (as measured by the number of
employed) is strongly skewed towards more accessible areas. For example, while accessible/good-
potential areas in Ethiopia are home to 14 per cent of rural young people, 23 per cent of the employed
young are located in these areas (and 28 per cent of the employed young FTEs). (Conversely,
remote/poor-potential areas are home to 17 per cent of young people, but only 13 per cent of the
employed young and 1 per cent of the employed young FTEs.) The fact that these trends are even
more pronounced when shown in per-FTE terms indicates that not only is the distribution of wage
employment skewed to more favourable areas, but also the distribution of full-time employment
possibilities (which may be taken as one measure of employment quality).

Landscapes of rural youth opportunity
24
Table 5. Distribution of young people, employed young people, and employed young FTEs
Tanzania Accessible Middle Remote
(a)
Good
potential
Poor
potential
Good
potential
Poor
potential
Good
potential
Poor
potential
% of people 6% 14% 16% 29% 20% 16%
% of employed 7% 17% 18% 24% 18% 14%
% of FTEs 9% 22% 17% 22% 18% 13%
Accessible Middle Remote
(b)
Good
potential
Poor
potential
Good
potential
Poor
potential
Good
potential
Poor
potential
% of people 100% 100% 100% 100% 100% 100%
% of employed 119% 125% 116% 86% 93% 88%
% of FTEs 141% 160% 105% 78% 90% 79%
Ethiopia Accessible Middle Remote
(a)
Good
potential
Poor
potential
Good
potential
Poor
potential
Good
potential
Poor
potential
% of people 14% 16% 20% 27% 6% 17%
% of employed 23% 17% 22% 20% 4% 13%
% of FTEs 28% 18% 17% 28% 8% 1%
Accessible Middle Remote
(b)
Good
potential
Poor
potential
Good
potential
Poor
potential
Good
potential
Poor
potential
% of people 100% 100% 100% 100% 100% 100%
% of employed 164% 106% 110% 74% 67% 76%
% of FTEs 200% 113% 85% 104% 133% 6%
Nigeria Accessible Middle Remote
(a)
Good
potential
Poor
potential
Good
potential
Poor
potential
Good
potential
Poor
potential
% of people 11% 55% 2% 29% 1% 2%
% of employed 15% 66% 1% 15% 0% 2%
% of FTEs 17% 66% 1% 14% 0% 2%
Accessible Middle Remote
(b)
Good
potential
Poor
potential
Good
potential
Poor
potential
Good
potential
Poor
potential
% of people 100% 100% 100% 100% 100% 100%
% of employed 147% 121% 45% 51% 67% 76%
% of FTEs 160% 120% 61% 48% 18% 75%

Landscapes of rural youth opportunity
25
Table 6 shows the same distributions as above, but drops the agroclimatic potential dimension, so
there are just three categories of economic geography: accessible, middle and remote. These more
streamlined patterns are possibly easier to interpret (we omit panel b for simplicity).
Table 6. Distribution of young people, employed young people, and employed young FTEs
Tanzania
(a) Accessible Middle Remote Total
% of people 20% 44% 36% 100%
% of employed 25% 43% 33% 100%
% of FTEs 31% 39% 30% 100%
Ethiopia
(a) Accessible Middle Remote Total
% of people 30% 47% 24% 100%
% of employed 40% 43% 17% 100%
% of FTEs 46% 45% 9% 100%
Nigeria
(a) Accessible Middle Remote Total
% of people 65% 32% 3% 100%
% of employed 82% 16% 2% 100%
% of FTEs 82% 16% 2% 100%

Landscapes of rural youth opportunity
26
Table 7. Distribution of wage employment quality indicators (Tanzania)
(a) Share of young people (15-34) with wage jobs
Accessible Middle Remote
Good 0.28 0.26 0.24
Poor 0.25 0.21 0.16
(b) Share of employed young people with skilled jobs
Accessible Middle Remote
Good 0.13 0.05 0.03
Poor 0.07 0.01 0.12
(c) Share of employed young people with skilled + semi-skilled jobs
Accessible Middle Remote
Good 0.67 0.38 0.35
Poor 0.60 0.53 0.57
(d) Share of wage jobs which are non-farm
Accessible Middle Remote
Good 0.72 0.33 0.24
Poor 0.62 0.43 0.46
(e) Diversity of employment sectors (Shannon's D)
Accessible Middle Remote
Good 0.76 0.37 0.37
Poor 0.75 0.38 0.30
(f) Diversity of employment types (Shannon's D)
Accessible Middle Remote
Good 0.63 0.31 0.38
Poor 0.65 0.29 0.32
Notes: Data are from the 2013 round of the Tanzanian LSMS-ISA data. Employment sectors include: a) agriculture, forestry and fishing; b) mining and quarrying; c) manufacturing; d) electricity, gas, steam and air conditioning supply; e) water supply; sewerage, waste management and remediation activities; f) construction; g) wholesale and retail trade; repair of motor vehicles and motorcycles; h) transportation and storage; i) accommodation and food service activities; j) information and communication; k) financial and insurance activities; l) real estate activities; m) professional, scientific and technical activities; n) administrative and support service activities; o) public administration and defence; compulsory social security; p) education; q) human health and social work activities; r) arts, entertainment and recreation; s) other service activities; t) activities of households as employers; undifferentiated goods- and services-producing activities of households for own use; u) activities of extraterritorial organizations and bodies. Employment types include: (1) administrators; (2) professionals; (3) technicians; (4) clerks; (5) service workers; (6) skilled ag/fish; (7) craft workers; (8) plant/machine operators; (9) elementary occupations; (10) defence forces; (11) not classified. Types 1-3 are classified as “skilled” and types 4-8 are classified as “semi-skilled” employment, with type 9 (elementary operations) defined as “unskilled”.

Landscapes of rural youth opportunity
27
There are several other measures of the distribution of quality employment opportunities that we might
consider. Table 7 provides a number of these, for Tanzania. Comparing panels (a) and (b), we see
that while the share of wage-earners in the young population declines strongly with remoteness (and
more moderately so with agricultural potential), the share of young wage-earners with “skilled” jobs
(i.e. administrators, professionals or technicians) declines even more precipitously across geography,
particularly the access dimension. The share of young people with skilled and semi-skilled jobs (panel
c) show similar trends, as does the share of jobs which are non-agricultural (panel d). Interestingly, the
relative share of these semi-skilled and non-agricultural jobs is larger in the low-potential remote and
middle-countryside areas than in the high-potential remote and middle-countryside areas (although the
overall share of wage jobs is lower). This may reflect out-posting of civil servants and other workers in
sectors which are spatially distributed according to political or social motivations rather than in
response to local economic vibrancy. In terms of diversity, both the diversity of sectors (panel e) and of
employment types (panel f) show strong gradients across the access dimension, with levels of
diversity in the more accessible areas double in magnitude of the diversity of in remote areas. These
findings underscore the multidimensional ways in which employment opportunities for young people
become more limited with economic remoteness.
5.6 Alternative ways of capturing geographical context
So far, our classification of agricultural potential and accessibility has been discrete and based on
thresholds to define agricultural potential and accessibility. These types of classifications have several
limitations. Most importantly, agricultural potential and (market) accessibility are not potentially discrete
outcomes, rather latent continuous outcomes that involve continuous variation in opportunities
associated with the agricultural and non-agricultural sector. Thus, another slightly different and data-
driven approach is to compile a number of attributes and spatial characteristics that are expected to
influence and explain agricultural potential or market accessibility. Aggregating these various spatial
and agro-ecological attributes of communities can provide more explanatory power along a continuous
gradient of related conditions. One benefit of such an approach is it allows us to explore non-linear
threshold effects or natural breaks in associations, which may inform how we construct category
thresholds.
For this purpose, we compile a set of geospatial attributes of survey locations, which describe different
aspects of agricultural potential or market potential. For instance, in an attempt to explain the market
potential of a locality, we compiled the following spatial attributes: population density, distance to
market, distance to nearest paved road, nightlight intensity and distance to the nearest non-zero
nightlight. Similarly, considering spatial attributes that may explain agricultural potential we compile the
following variables: enhanced vegetation index (EVI), annual rainfall, soil nutrient availability and water
retention capacity. We then employed factor analysis to quantify the loadings of these variables into
some unknown latent factors. Consistent with our intuition and classification above, those spatial
attributes expected to explain market potential have higher factor loadings into the latent index that we
refer to as the accessibility or market potential indicator. Similar patterns are observed with all other
remaining variables. Based on these factor loadings, we then construct two continuous indexes that
we interpret as capturing agricultural potential and market potential (or accessibility).
In Figures 5 and 6 we explore whether these two indexes can meaningfully explain labour market
outcomes of young people in Africa. We particularly estimate nonparametric polynomial regressions of
young people’s labour allocation and outcomes on these two indexes. In these figures, panel (a) plots
the predicted share of individuals participating in agricultural farming activities (in the vertical axis),
plotted against the index representing agricultural potential (on the horizontal axis). Panel (b) plots the
same dependent variable (predicted share of individuals participating in agricultural farming activities)
against the index representing market access on the horizontal axis. Panels (c) to (f) show similar plots

Landscapes of rural youth opportunity
28
for non-farm business participation (c) and (d), and wage employment (e) and (f), against the same
indices of agricultural potential and market access. The indices are constructed such that values on
the horizontal access read from low (left-hand side) to high (right-hand side).
Figure 5, for Ethiopia, shows that rates of participation in farming activities are positively and strongly
correlated with agricultural potential, while negatively correlated with accessibility and proximity to
urban areas. Figure 6 shows that similar patterns are observed for Niger (results for Nigeria are given
in Appendix Figure 7). Besides confirming the key empirical regularities from our previous tables, the
non-parametric figures below provide some fresh insights into the linkage between agricultural
potential and non-farm activities. We can observe, for example, that young people living in high
potential areas have higher rates of participation in both the farm and the non-farm economy. This
probably reflects the fact that a vibrant farm economy in high potential areas has important spillover
impacts on the non-farm economy.
Key points:
Young people’s farming activities increase with alternative measures of agricultural potential
and decrease with market access.
Young people’s wage income participation rates increase with market access (and seem to
increase with agricultural potential, although this relationship is less straightforward).
Other patterns (e.g. non-farm business participation) are less clear.
We are still exploring the best way to capture the spatial patterns of labour allocation.

Landscapes of rural youth opportunity
29
Figure 5. Individual labour allocation and generalized indices for Ethiopia (individuals aged 15-24)
.
Source: Authors’ analysis
.3.4
.5.6
.7P
art
icip
atio
n in
fa
rmin
g a
ctivitie
s
-3 -2 -1 0 1 2Agricultural potential
95% CI lpoly smooth: Participation_in_farming
(a). Participation in farming activities vs Agricultural Potential
0.2
.4.6
Pa
rtic
ipa
tio
n in
fa
rmin
g a
ctivitie
s
-4 -2 0 2 4 6Accessibility
95% CI lpoly smooth: Participation_in_farming
(b).Participation in farming activities vs Accessibility
.05
.1.1
5.2
Pa
rtic
ipa
tio
n in
no
n-f
arm
bu
sin
ess
-3 -2 -1 0 1 2Agricultural potential
95% CI lpoly smooth: Participation_in_non_farm
(c).Participation in non-farm business vs agricultural potential0
.1.2
.3P
art
icip
atio
n in
no
n-f
arm
bu
sin
ess
-4 -2 0 2 4 6Accessibility
95% CI lpoly smooth: Participation_in_non_farm
(d). Participation in non-farm business vs accessibility
.06
.08
.1.1
2.1
4P
art
icip
atio
n in
wa
ge
em
plo
ye
me
nt
-3 -2 -1 0 1 2Agricultural potential
95% CI lpoly smooth: Participation_in_wage_related
(e).Participation in wage employement vs agricultural potential
0.0
5.1
.15
.2.2
5P
art
icip
atio
n in
wa
ge
em
plo
ye
me
nt
-4 -2 0 2 4 6Accessibility
95% CI lpoly smooth: Participation_in_wage_related
(e).Participation in wage employement vs accessibility

Landscapes of rural youth opportunity
30
Figure 6. Individual labour allocation decisions and generalized indices for Niger (individuals aged
15-24)
Source: Authors’ analysis
.2.3
.4.5
.6.7
Pa
rtic
ipa
tio
n in
fa
rmin
g a
ctivitie
s
-4 -2 0 2 4Agricultural potential
95% CI lpoly smooth: Participation_in_farming
(a). Participation in farming activities vs Agricultural Potential
0.2
.4.6
.8P
art
icip
atio
n in
fa
rmin
g a
ctivitie
s
-2 -1 0 1Accessibility
95% CI lpoly smooth: Participation_in_farming
(b).Participation in farming activities vs Accessibility
0.0
5.1
.15
.2P
art
icip
atio
n in
no
n-f
arm
bu
sin
ess
-4 -2 0 2 4Agricultural potential
95% CI lpoly smooth: Participation_in_non_farm
(c).Participation in non-farm business vs agricultural potential0
.05
.1.1
5.2
.25
Pa
rtic
ipa
tio
n in
no
n-f
arm
bu
sin
ess
-2 -1 0 1Accessibility
95% CI lpoly smooth: Participation_in_non_farm
(d). Participation in non-farm business vs accessibility
-.1
0.1
.2.3
Pa
rtic
ipa
tio
n in
wa
ge
em
plo
ye
me
nt
-4 -2 0 2 4Agricultural potential
95% CI lpoly smooth: Participation_in_wage_related
(e).Participation in wage employement vs agricultural potential
0.0
5.1
.15
.2.2
5P
articip
atio
n in
wa
ge
em
plo
ye
me
nt
-2 -1 0 1Accessibility
95% CI lpoly smooth: Participation_in_wage_related
(e).Participation in wage employement vs accessibility
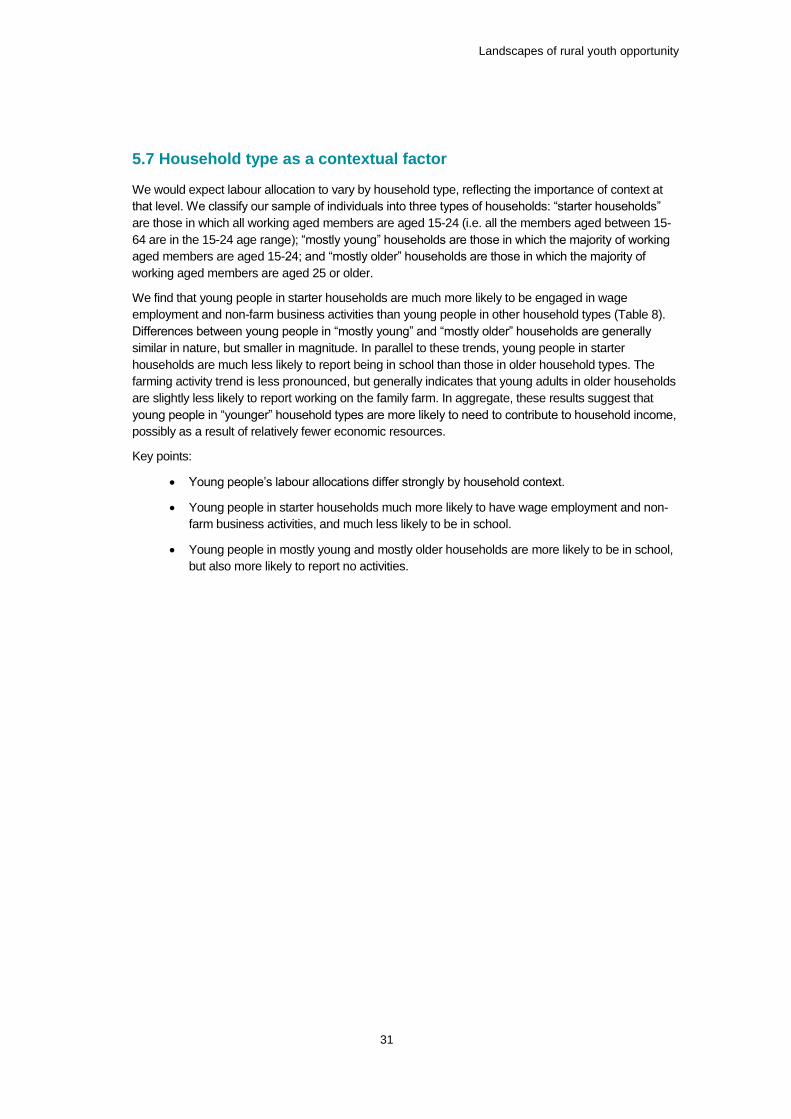
Landscapes of rural youth opportunity
31
5.7 Household type as a contextual factor
We would expect labour allocation to vary by household type, reflecting the importance of context at
that level. We classify our sample of individuals into three types of households: “starter households”
are those in which all working aged members are aged 15-24 (i.e. all the members aged between 15-
64 are in the 15-24 age range); “mostly young” households are those in which the majority of working
aged members are aged 15-24; and “mostly older” households are those in which the majority of
working aged members are aged 25 or older.
We find that young people in starter households are much more likely to be engaged in wage
employment and non-farm business activities than young people in other household types (Table 8).
Differences between young people in “mostly young” and “mostly older” households are generally
similar in nature, but smaller in magnitude. In parallel to these trends, young people in starter
households are much less likely to report being in school than those in older household types. The
farming activity trend is less pronounced, but generally indicates that young adults in older households
are slightly less likely to report working on the family farm. In aggregate, these results suggest that
young people in “younger” household types are more likely to need to contribute to household income,
possibly as a result of relatively fewer economic resources.
Key points:
Young people’s labour allocations differ strongly by household context.
Young people in starter households much more likely to have wage employment and non-
farm business activities, and much less likely to be in school.
Young people in mostly young and mostly older households are more likely to be in school,
but also more likely to report no activities.

Landscapes of rural youth opportunity
32
Table 8. Labour allocation of 15-24-year olds across household types
Household type
Wage-
employment
Non-
farm
business
Family
farm
activities In school
No
activity
reported
Ethiopia
Starter 14% 12% 40% 27% 28%
Mostly young 7% 10% 44% 42% 23%
Mostly older 8% 12% 54% 51% 15%
Tanzania
Starter 36% 24% 73% 6% 9%
Mostly young 16% 10% 69% 25% 12%
Mostly older 16% 9% 70% 30% 12%
Uganda
Starter 23% 16% 77% 18% 6%
Mostly young 9% 5% 69% 54% 6%
Mostly older 10% 2% 63% 56% 6%
Nigeria
Starter 5% 12% 25% 37% 27%
Mostly young 3% 9% 22% 51% 25%
Mostly older 2% 9% 23% 52% 25%
Niger
Starter 3% 20% 76% 20% 12%
Mostly young 3% 9% 58% 43% 17%
Mostly older 3% 8% 62% 43% 16%
Note: The Ethiopian and Nigerian questionnaires only asked about labour allocation decisions within the last 7 days. Labour allocation for the other countries was identified for the previous 12 months.
In Table 9, we provide households’ income portfolio and orientation, categorized by household types.
Non-farm orientation, measured as the share of household income from non-farm business and wage
employment, is generally largest for household types with more young members, i.e. “starter” and
“mostly young”. Nigeria is the biggest exception to this; Uganda and Tanzania show this pattern for
wages but not non-farm business. This signals a generally higher level of reliance on the non-farm
economy by young households. This is consistent with individual-level labour allocation data, which we
do not show here (it is the focus of another paper). A major conclusion from that work is that young
people are relatively more engaged in non-farm activities than older labour market participants,
signalling their importance to the region’s ongoing rural economic transformations.

Landscapes of rural youth opportunity
33
Table 9. Household income shares by household type
Household
type
Crop
productio
n Livestock
Non-farm
business Wages Transfers Total No. obs
Ethiopia
Starter 71% 0% 18% 11% 100% 148
Mostly young 83% 0% 8% 10% 100% 1429
Mostly older 84% 0% 7% 9% 100% 2237
Tanzania
Starter 29% 4% 20% 47% 100% 262
Mostly young 35% 15% 19% 30% 100% 1360
Mostly older 32% 12% 22% 34% 100% 1597
Uganda
Starter 41% 7% 28% 24% 100% 181
Mostly young 35% 7% 41% 16% 100% 1138
Mostly older 34% 5% 42% 19% 100% 1266
Nigeria
Starter 55% 1% 36% 6% 2% 100% 181
Mostly young 50% 3% 38% 8% 1% 100% 1138
Mostly older 47% 3% 40% 10% 0% 100% 1266
Niger
Starter 37% 2% 29% 2% 29% 100% 76
Mostly young 36% 4% 39% 5% 18% 100% 744
Mostly older 41% 4% 38% 3% 14% 100% 1897
Note: The Nigerian questionnaire only asked about labour allocation decisions within the last 7 days. Labour allocation for the other countries was identified for the previous 12 months.
5.8 Income orientations of young households change over economic
geographies
The structure of available survey data means that we are unable to build individual level estimates of
income orientation. Instead, we must aggregate income and income shares at the household level,
which means the link with “young people” is more tenuous.
The conventional approach is to use the age of the household head to say something about how
household-level outcomes are related to young people. This approach is problematic for at least three
reasons: first, for most definitions of “young”, most rural young people are not household heads and do
not live in households with young heads; second, the “head” identified by survey enumerators may be
the titular head only, and obscure the de facto economic leadership of one or more younger members;
third, if we restrict our sample to “young” heads, we often end up with samples which are too sparse to
enable any further disaggregation in analysis.

Landscapes of rural youth opportunity
34
Table 10 shows income orientations for young households, organized by economic geography. A
number of observations stand out. First, farm orientation (particularly with respect to crop production)
strongly increases with distance from markets and with agricultural potential. These trends are
consistent across alternative definitions of market access and agricultural potential.
Second, livestock income shares differ significantly across countries, reflecting different agro-ecologies
and farming systems, but in those countries where livestock income is relatively important, its share is
generally also increasing with market remoteness, probably reflecting relative land availability.
Third, non-farm business and non-farm wage income shares of total household income generally
increase with proximity to markets, as expected. These shares also generally increase with agricultural
potential, indicating the positive linkages between the farm and non-farm economies.
Finally, transfer incomes (remittances and gifts) differ highly across countries, but in many countries
they decline with remoteness. This is in line with other work (not shown here) that out-migration rates
are highest in higher access areas.
Key points:
Young households more likely to be non-farm oriented.
Non-farm business and non-farm wage income shares of total household income generally
increase with proximity to markets.
Non-farm business and non-farm wage income shares of total household income also
generally increase with agricultural potential.
Table 10. Income orientations of young households
Crop production Livestock
Non-farm business Wage Transfer
Low pot.
High pot.
Low pot.
High pot.
Low pot.
High pot.
Low pot.
High pot.
Low pot.
High pot.
Ethiopia
Accessible 9% 35% 6% 8% 32% 15% 38% 15% 15% 28%
Middle 34% 71% 10% 8% 21% 9% 16% 8% 19% 4%
Remote 52% 35% 18% 23% 11% 16% 16% 24% 2% 3%
Nigeria
Accessible 56% 15% 1% 0% 35% 39% 8% 30% 0% 16%
Middle 62% 60% 5% 0% 29% 40% 4% 0% 0% 0%
Remote 20% - 3% - 78% - 0% - 0% -
Tanzania
Accessible 10% 14% 6% 1% 27% 29% 57% 56% 10% 14%
Middle 27% 17% 5% 6% 28% 25% 41% 52% 27% 17%
Remote 28% 37% 6% 6% 25% 17% 40% 40% 28% 37%
Zambia
Accessible 19% 36% 8% 0% 32% 25% 41% 39% 0% 0%
Middle 52% 23% 6% 4% 16% 48% 22% 25% 3% 0%
Remote 59% 63% 6% 2% 25% 23% 8% 10% 2% 2%
Note: Sample consists of households with heads younger than 30.

Landscapes of rural youth opportunity
35
5.9 Economic geographies as opportunity structures
Table 11 presents a reformulation of Table 1, showing how economic geographies act as opportunity
structures and the resulting economic activities that are likely to be particularly important for one or
more groups of young people.
Table 11. Economic geographies as opportunity structures
Location characteristics
Quality of natural resources
Accessible areas “Middle” countryside Remote rural areas
Good
Non-farm HH income orientation predominant Wage labour allocation (ind) Finishing school
Y
Idle youth? Y
Land rental markets more important
Y
Household more specialized Migration (in + out)
Y
Market oriented farming Important non-farm sector (rural industry)
Non-farm HH income orientation important Wage labour allocation (individual) Migration (out)
Y
Subsistence farming Livestock Limited non-farm sector (Crafts and services for local markets; tourism and recreation) Leaving school early
Y
Household more diversified Migration (out)
Y
Poor
[relatively few areas like this] Non-farm HH income orientation Wage labour allocation (individual) Finishing school
Y
Idle youth? Y
Land rental markets more important
Y
Household more specialized Migration (in + out)
Y
[relatively few areas like this] Extensive farming Livestock Limited non-farm sector (possibly tourism and recreation) Migration (out)
Y
Subsistence farming, low productivity; Surpluses very small Livestock Crafts and services for local markets Tourism and recreation Migration (out)
Y
Notes: The superscript Y denotes an activity likely to be particularly important for young people.
Entries in bold denote were with further analysis it may be possible to disaggregate wage and business activity by sector.
6. Conclusions
Several conclusions emerge from the conceptualization of landscapes of opportunity developed in this
paper, and the accompanying empirical analysis. The first is that it is critically important that policy
makers and development partners acknowledge explicitly that rural areas differ in their potential to
provide decent employment for young people. It follows that the focus of any policy or programme to
“invest in youth” should be on those areas having both more potential and larger populations of young
people (i.e. high-access and middle countryside areas).
It must also be acknowledged that young people are highly differentiated by their educational, family,
social, cultural, economic backgrounds and by their local contexts (e.g. economic geographies). The
implication is that young people will see a diverse range of opportunity landscapes, and are likely to
respond to policies and programmes in different ways. As young people are deeply embedded in

Landscapes of rural youth opportunity
36
family and social networks, any strategy or intervention that implies that rural young people are or can
be dealt with as isolated economic or social actors must be avoided.
At its core, investing in youth should mean investing to change the opportunity structures that govern
how young people enter and progress in the labour market. In this sense, investment in good rural and
social development (e.g. infrastructure, education, health) can provide many important direct benefits
to rural youth. It is important not to frame policy or interventions in ways that suggest that individual
characteristics such as agency, aspirations, skills, entrepreneurial behaviour and ability to make “good
choices” are or should be first order concerns.
Finally, it is important to acknowledge that existing, nationally representative data sets have clear
limitations in their ability to provide insight into the dynamics of local rural economies, and the impacts
of opportunity structures on how young people establish their livelihoods. For example, qualitative
studies suggest that there is far more multiplicity of engagements (e.g. multiple jobs, business
activities and schooling or education) than indicated by survey statistics. Furthermore, the temporal
dynamism of many engagements is high, and probably not well captured by the labour modules in
standard survey instruments.
Landscapes of rural youth opportunity
37
References
AGRA (2017), Africa Agriculture Status Report: The Business of Smallholder Agriculture in Sub-
Saharan Africa (Issue 5) (Nairobi, Kenya: Alliance for a Green Revolution in Africa).
Allan, W. (1965), The African Husbandman (London: Oliver and Boyd).
Amanor, K. S. (2010), 'Family values, land sales and agricultural commodification in South-Eastern
Ghana', Africa: Journal of the International African Institute, 80 (1), 104-25.
Berckmoes, Lidewyde and White, Ben (2014), 'Youth, farming and precarity in rural Burundi',
European Journal of Development Research, 26 (2), 190-203.
Bezu, Sosina and Holden, Stein (2014), 'Are rural youth in Ethiopia abandoning agriculture?', World
Development, 64, 259-72.
Bourdieu, Pierre (1993), ''Youth' is just a word', in Pierre Bourdieu (ed.), Sociology in Question
(London: Sage).
Bryceson, D. F. (2002), 'The scramble in Africa: reorienting rural livelihoods', World Development, 30
(5), 725-39.
Bryceson, D. F. and Jamal, V. (1997), Farewell to Farms : De-agrarianisation and Employment in
Africa (Aldershot: Ashgate).
Bynner, J. and Roberts, K. (eds.) (1991), Youth and Work: Transition to employment in England and
Germany, London: Anglo-German Foundation (London: Anglo-German Foundation [Lib Main LD
4500 You]).
Carr, E. R. (2008), 'Men's crops and women's crops: The importance of gender to the understanding
of agricultural and development outcomes in Ghana's Central Region', World Development, 36 (5),
900-15.
Chamberlin, Jordan, Pender, John, and Yu, Bingxin (2006), Development domains for Ethiopia:
Capturing the geographical context of smallholder development options (Intl Food Policy Res Inst).
Collinson, M. (2000), 'Evolving typologoes for agricultural R&D', in M. Collinson (ed.), A History of
Farming Systems Research (Wallingford and Rome: CABI and FAO).
Dabalen, A., et al. (eds.) (2014), Do African Children Have an Equal Chance?: A Human Opportunity
Report for Sub-Saharan Africa (Washington, DC: The World Bank) 111-36.
de Janvry, A. and Sadoulet, E. (2007), 'Toward a territorial approach to rural development', Journal of
Agricultural and Development Economics (available online at www.fao.org/es/esa/eJADE), 4 (1),
66-98.
Doss, Cheryl R. (2002), 'Men’s Crops? Women’s Crops? The Gender Patterns of Cropping in Ghana',
World Development, 30 (11), 1987-2000.
Ellis, F. (2000), Rural livelihoods and diversity in developing countries (Oxford: Oxford University
Press).
Evans, R., Mariwah, S., and Antwi, K. B. (2015), 'Struggles over family land? Tree crops, land and
labour in Ghana's Brong-Ahafo region', Geoforum, 67, 24-35.
FAO (1976), A framework for land evaluation. FAO Soils Bulletin 32 (Rome: FAO).

Landscapes of rural youth opportunity
38
--- (1996), Agro-Ecological Zoning: Guidelines. FAO Soils Bulletin 76 (Rome: FAO).
Felin, T., et al. (2014), 'Economic opportunity and evolution: beyond landscapes and bounded
rationality', Strategic Entrepreneurship Journal, 8 (4), 269-82.
Fischer, G., et al. (2002), Global AgroEcological Assessment for Agriculture in the 21st Century:
Methodology and Results. IIASA RR‐02‐
02, (Laxenburg, Austria: IIASA).
Flynn, J., et al. (2017), Failing Young People? Addressing the Supply-side Bias and Individualisation in
Youth Employment Programming. IDS Evidence Report 216 (Brighton: Institute of Development
Studies (IDS)).
Galster, G. (2017), 'The Geography of Opportunity 20 Years Later', Housing Policy Debate, 27 (6),
941-43.
Galster, G. and Killen, S. P. (1995), 'The geography of metropolitan opportunity: A reconnaissance
and conceptual framework', Housing Policy Debate, 6 (1), 7-43.
Giddens, A. (1984), The constitution of society: Outline of the theory of structuration (Cambridge: Polity
Press).
Githinji, M. W., Konstantinidis, C., and Barenberg, A. (2014), 'Small and Productive: Kenyan Women
and Crop Choice', Feminist Economics, 20 (1), 101-29.
Hazel, P. (2017), 'Chapter 1. Why an Inclusive Agricultural Transformation is Africa’s Way Forward', in
AGRA (ed.), Africa Agriculture Status Report 2017: The Business of Smallholder Agriculture in
Sub-Saharan Africa (Issue 5). (Nairobi, Kenya: Alliance for a Green Revolution in Africa).
Hazel, P., et al. (2017), 'Annex 1. Operationalizing the Typology of Small Farm Households', in AGRA
(ed.), Africa Agriculture Status Report 2017: The Business of Smallholder Agriculture in Sub-
Saharan Africa (Issue 5). (Nairobi, Kenya: Alliance for a Green Revolution in Africa).
Hildebrand, P. E., et al. (1993), 'Farming systems research for agroforestry extension', Agroforestry
Systems, 23 (2-3), 219-37.
Hoskins, K. (2017), 'The Changing Landscape of Opportunity for Young People', Youth Identities,
Education and Employment: Exploring Post-16 and Post-18 Opportunities, Access and Policy
(London: Palgrave Macmillan UK), 1-21.
Hoskins, K. and Barker, B. (2017), 'Aspirations and young people's constructions of their futures:
investigating social mobility and social reproduction', British Journal of Educational Studies, 65 (1),
45-67.
IFAD (2016), Rural Development Report 2016: Fostering Inclusive Rural Transformation (Rome:
International Fund for Agricultural Development).
Jiitzold, R. and Kutsch, H. (1982), 'Agro-Ecological Zones of the Tropics, with a Sample from Kenya',
Der Tropenlandwirt, Zeitschrift fur die Landwirtschaft in den Tropen und Subtropen 83, 15-34.
Johnson, V. (2011), 'Conditions for Change for Children and Young People’s Participation in
Evaluation: ‘Change-Scape’', Child Indicators Research, 4 (4), 577-96.
--- (2014), 'Change-scape Theory: Applications in Participatory Practice', in Joanne Westwood, et al.
(eds.), Participation, Citizenship and Intergenerational Relations in Children and Young People’s
Lives: Children and Adults in Conversation (London: Palgrave Macmillan UK), 94-108.

Landscapes of rural youth opportunity
39
--- (2017), 'Moving beyond voice in children and young people’s participation', Action Research, 15 (1),
104-24.
Kabeer, N. (2016), 'Gender Equality, Economic Growth, and Women’s Agency: the “Endless Variety”
and “Monotonous Similarity” of Patriarchal Constraints', Feminist Economics, 22 (1), 295-321.
Knaap, Elijah (2017), 'The Cartography of Opportunity: Spatial Data Science for Equitable Urban
Policy', Housing Policy Debate, 27 (6), 913-40.
Lambrecht, I. B. (2016), '"As a Husband I Will Love, Lead, and Provide." Gendered Access to Land in
Ghana', World Development, 88, 188-200.
Lehmann, W., Taylor, A., and Hamm, Z. (2015), ''Go west young man!' Youth apprenticeship and
opportunity structures in two Canadian provinces', Journal of Education and Work, 28 (1), 44-65.
Maija, Renko, C., Shrader Rodney, and Mark, Simon (2012), 'Perception of entrepreneurial
opportunity: a general framework', Management Decision, 50 (7), 1233-51.
Orr, A., et al. (2016a), 'What Do We Mean by "Women's Crops'? Commercialisation, Gender and the
Power to Name', Journal of International Development, 28 (6), 919-37.
Orr, A., et al. (2016b), 'Are there "women's crops"? A new tool for gender and agriculture',
Development in Practice, 26 (8), 984-97.
Pangbourne, Kate and Roberts, Deborah (2015), 'Small Towns and Agriculture: Understanding the
Spatial Pattern of Farm Linkages', European Planning Studies, 23 (3), 494-508.
Pender, John, Place, Frank, and Ehui, Simeon (2006), Strategies for sustainable land management in
the East African highlands (Intl Food Policy Res Inst).
Pender, John, et al. (2004), 'Development pathways and land management in Uganda', World
Development, 32 (5), 767-92.
Pesaresi, Martino and Freire, Sergio (2016), GHS settlement grid, following the REGIO model 2014 in
application to GHSL Landsat and CIESIN GPW v4-multitemporal (1975-1990-2000-2015).
[Dataset] PID: http://data.europa.eu/89h/jrc-ghsl-ghs_smod_pop_globe_r2016a (Brussels:
European Commission, Joint Research Centre (JRC)).
Porter, G., et al. (2010a), ''Youthscapes' and escapes in rural Africa: education, mobility and livelihood
trajectories for young people in Eastern Cape, South Africa', Journal of International Development,
22 (8), 1090-101.
Porter, G., et al. (2010b), 'Moving young lives: Mobility, immobility and inter-generational tensions in
urban Africa', Geoforum, 41 (5), 796-804.
Porter, G., et al. (2012), 'Youth, mobility and mobile phones in Africa: findings from a three-country
study', Information Technology for Development, 18 (2), 145-62.
Porter, G., et al. (2017), Young People's Daily Mobilities in Sub-Saharan Africa: Moving Young Lives
(New York: Palgrave Macmillan).
Reece, J. and Gambhir, S. (2009), The Geography of Opportunity: Building Communities of
Opportunity in Massachusetts (Columbus, Ohio: Kirwin Institute, Ohio State University).
Ripoll, S., et al. (2017), 'Rural transformation, cereals and youth in Africa: What role for international
agricultural research?', Outlook on Agriculture, 46 (3), 168-77.

Landscapes of rural youth opportunity
40
Roberts, Deborah, Majewski, Edward, and Sulewski, Piotr (2013), 'Farm household interactions with
local economies: A comparison of two EU case study areas', Land Use Policy, 31 (Supplement C),
156-65.
Roberts, K. (1968), 'The entry into employment: an approach towards a general theory', Sociological
Review, 16, 165-84.
--- (1977), 'The social conditions, consequences and limitations of careers guidance', British Journal of
Guidance and& Counselling, 5 (1), 1-9.
--- (1995), Youth Employment in Modern Britain (Oxford: Oxford University Press [Lib Main HR 22415
UK (Rob)]).
--- (2009), 'Opportunity structures then and now', Journal of Education and Work, 22 (5), 355-68.
Roberts, K., Clark, S. C., and Wallace, C. (1994), 'FLEXIBILITY AND INDIVIDUALIZATION - A
COMPARISON OF TRANSITIONS INTO EMPLOYMENT IN ENGLAND AND GERMANY',
Sociology-the Journal of the British Sociological Association, 28 (1), 31-54.
Rutherberg, H. (1971), Farming Systems in the Tropics (Oxford: Clarendon Press).
Sarason, Y., Dean, T., and Dillard, J. F. (2006), 'Entrepreneurship as the nexus of individual and
opportunity: A structuration view', Journal of Business Venturing, 21 (3), 286-305.
Schejtman, A. and Berdegué, J. A. (2004), Rural Territorial Development. Documento de Trabajo N°
4. Programa Dinámicas Territoriales Rurales ( Santiago, Chile: Rimisp).
Sombroek, W. G., Braun, H. M. H., and van der Pouw, B .J. A. (1982), Exploratory Soil Map and Agro-
Climatic Zone Map of Kenya, 1980. Scale: 1:1'000'000. Exploratory Soil Survey Report No. E1.
Kenya Soil Survey (Nairobi, Kenya: Ministry of Agriculture, National Agricultural Laboratories).
Sumberg, J. and Hunt, S. (2018), African Rural Youth and Innovation: Claims, Evidence and
Implications. Unpublished background paper background paper produced to inform IFAD’s Rural
Development Report 2019, "Investing in Youth".
Sumberg, J., et al. (2015), 'Young people, agriculture, and employment in rural Africa', in D. Resnick
and J. Thurlow (eds.), African Youth and the Persistence of Marginalization: Employment, Politics,
and Prospects for Change (London: Routledge).
The World Bank (2009), Awakening Africa's Sleeping Giant : Prospects for Commercial Agriculture in
the Guinea Savannah Zone and Beyond (Washington, DC: The World Bank).
Vigh, Henrik (2009), 'Motion squared: a second look at the concept of social navigation',
Anthropological Theory, 9 (4), 419-38.
Von Thünen, J. H. (1966), Von Thünen's 'Isolated state' (English edition) (Oxford: Pergamon Press).
Wardrop, N. A., et al. (2018), 'Spatially disaggregated population estimates in the absence of national
population and housing census data', Proceedings of the National Academy of Sciences of the
United States of America.
White, B. (2018), Rural Youth Today. RDR 2017 Concept Note (Rome: IFAD).
Whitehead, A. (1979), 'Some Preliminary Notes on the Continuing Subordination of Women', IDS
Bulletin, 10 (3), 10-13.

Landscapes of rural youth opportunity
41
Wiggins, S. and Proctor, S. (2001), 'How special are rural areas? The economic implications of
location for rural development', Development Policy Review, 19 (4), 427-36.
Wyn, J. and White, R. (1997), Rethinking Youth (London: Sage).
Yeboah, T., et al. (2017), 'Perspectives on desirable work: Findings from a Q study with students and
parents in rural Ghana', European Journal of Development Research, 29 (2), 423-40.

42
Appendix
Appendix Table 1. Household survey data available for this study
Country 2008-09 2009-10 2010-11 2011-12 2012-13 2013-14 2014-15 2015-16
Burkina Faso
wave 1†
Ethiopia wave 1 wave 2 wave 3
Niger wave 1 wave 2
Nigeria wave 1 wave 2 wave 3
Tanzania wave 1 wave 2 wave 3 wave 4*
Uganda wave 1 wave 2 wave 3 wave 4†
Zambia wave 1 wave 2
Notes: * = new panel formation. † = no spatial data available. Data for Burkina Faso, Ethiopia, Niger, Nigeria, Tanzania
and Uganda are from the LSMS-ISA project. Data for Zambia are from the RALS survey conducted by IAPRI, MSU and the Zambian CSO.
Appendix Table 2. Distribution of young people (aged 15-24) across economic geography zones, by
country
Country High-
access/ high pot.
High-access/ low pot.
Middle/ high pot.
Middle/ low pot.
Remote/ high pot.
Remote/ low pot.
Algeria 12% 60% 1% 22% 0% 4%
Angola 4% 11% 16% 12% 38% 19%
Benin 22% 7% 49% 10% 12% 1%
Botswana 0% 29% 0% 29% 3% 39%
Burkina Faso 1% 14% 10% 48% 7% 19%
Burundi 54% 8% 31% 6% 1% 0%
Côte d'Ivoire 22% 3% 54% 3% 18% 1%
Cameroon 27% 7% 36% 8% 20% 1%
CAR 4% 0% 7% 0% 86% 2%
Chad 4% 5% 15% 13% 29% 33%
DRC 8% 2% 24% 3% 61% 3%
Djibouti 0% 40% 0% 29% 0% 31%
Egypt 45% 48% 1% 4% 0% 3%
Equatorial Guinea
3% 1% 23% 1% 70% 2%
Eritrea 0% 15% 0% 27% 2% 55%
Ethiopia 13% 6% 25% 16% 19% 21%
Gabon 6% 9% 8% 3% 66% 9%

Header title here
Country High-
access/ high pot.
High-access/ low pot.
Middle/ high pot.
Middle/ low pot.
Remote/ high pot.
Remote/ low pot.
Gambia 20% 9% 31% 12% 24% 4%
Ghana 29% 9% 40% 10% 11% 2%
Guinea 14% 3% 55% 5% 23% 1%
Guinea-Bissau 8% 2% 34% 8% 42% 7%
Kenya 37% 10% 28% 15% 3% 6%
Lesotho 0% 13% 0% 47% 0% 40%
Liberia 10% 1% 40% 1% 46% 2%
Libya 1% 57% 0% 26% 0% 16%
Madagascar 1% 8% 6% 10% 39% 36%
Malawi 17% 2% 60% 11% 8% 3%
Mali 2% 7% 13% 21% 15% 42%
Mauritania 0% 6% 0% 8% 4% 82%
Morocco 13% 37% 6% 40% 0% 5%
Mozambique 11% 6% 36% 8% 34% 5%
Namibia 0% 3% 0% 16% 4% 77%
Niger 0% 13% 0% 43% 0% 43%
Nigeria 34% 22% 21% 17% 4% 3%
Republic of Congo
8% 9% 20% 6% 47% 11%
Rwanda 32% 7% 43% 15% 2% 1%
Senegal 10% 19% 24% 26% 11% 11%
Sierra Leone 12% 1% 59% 3% 24% 2%
Somalia 1% 11% 4% 28% 4% 52%
South Africa 11% 25% 15% 39% 2% 8%
South Sudan 5% 3% 20% 6% 49% 17%
Sudan 0% 14% 2% 18% 11% 56%
Swaziland 20% 11% 44% 25% 0% 0%
Tanzania 8% 8% 21% 22% 28% 13%
Togo 17% 12% 43% 16% 10% 2%
Tunisia 10% 28% 9% 48% 0% 5%
Uganda 23% 5% 54% 8% 7% 2%
Western Sahara 0% 2% 0% 2% 0% 96%
Zambia 16% 4% 32% 6% 33% 9%
Zimbabwe 9% 9% 27% 28% 15% 12%
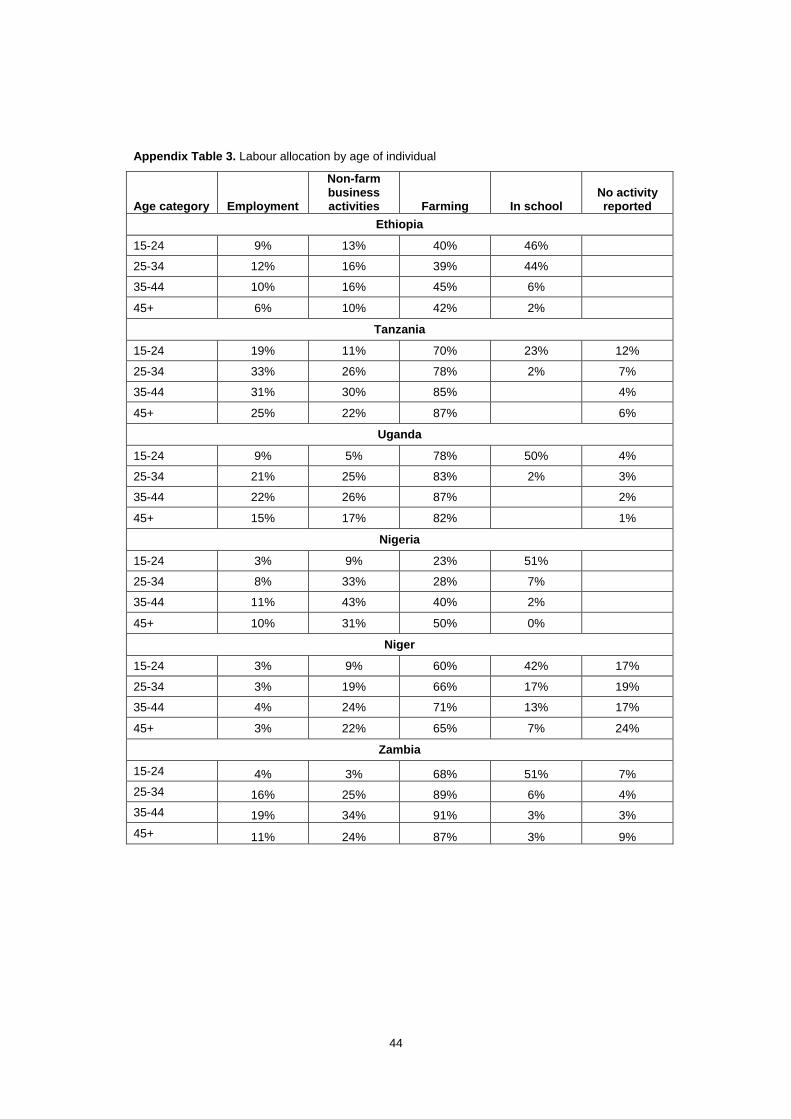
44
Appendix Table 3. Labour allocation by age of individual
Age category Employment
Non-farm business activities Farming In school
No activity reported
Ethiopia
15-24 9% 13% 40% 46%
25-34 12% 16% 39% 44%
35-44 10% 16% 45% 6%
45+ 6% 10% 42% 2%
Tanzania
15-24 19% 11% 70% 23% 12%
25-34 33% 26% 78% 2% 7%
35-44 31% 30% 85% 4%
45+ 25% 22% 87% 6%
Uganda
15-24 9% 5% 78% 50% 4%
25-34 21% 25% 83% 2% 3%
35-44 22% 26% 87% 2%
45+ 15% 17% 82% 1%
Nigeria
15-24 3% 9% 23% 51%
25-34 8% 33% 28% 7%
35-44 11% 43% 40% 2%
45+ 10% 31% 50% 0%
Niger
15-24 3% 9% 60% 42% 17%
25-34 3% 19% 66% 17% 19%
35-44 4% 24% 71% 13% 17%
45+ 3% 22% 65% 7% 24%
Zambia
15-24 4% 3% 68% 51% 7%
25-34 16% 25% 89% 6% 4%
35-44 19% 34% 91% 3% 3%
45+ 11% 24% 87% 3% 9%

Header title here
Appendix Figure 1. Individual labour allocation decisions by age, in Ethiopia
Source: Authors’ analysis
Appendix Figure 2. School participation rates, by age and remoteness category, in Ethiopia
Source: Authors’ analysis
0%
10%
20%
30%
40%
50%
60%
70%
80%
90%
100%
15 20 25 30 35 40 45 50 55 60 65
wage employment non-farm business activities
farming activities in school
no activity reported
0%
10%
20%
30%
40%
50%
60%
70%
15 20 25 30
% of individuals in school, by age and hotspot category
hotspot medium cold

46
Appendix Figure 3. Individual labour allocation decisions by age, in Niger
Source: Authors’ analysis
Appendix Figure 4. School participation rates, by age and remoteness category, in Niger
Source: Authors’ analysis
0%
20%
40%
60%
80%
100%
120%
15 20 25 30 35 40 45 50 55 60 65
wage employment non-farm business activities
farming activities in school
no activity reported
0%
10%
20%
30%
40%
50%
60%
70%
80%
90%
15 20 25 30
% of individuals in school, by age and hotspot category
hotspot medium cold

Header title here
Appendix Figure 5. Individual labour allocation decisions by age, in Nigeria
Source: Authors’ analysis
Appendix Figure 6. School participation rates, by age and remoteness category, in Nigeria
Source: Authors’ analysis
0%
20%
40%
60%
80%
100%
120%
15 20 25 30 35 40 45 50 55 60 65
wage employment non-farm business activities
farming activities in school
no activity reported
0%
10%
20%
30%
40%
50%
60%
70%
80%
90%
100%
15 20 25 30
% of individuals in school, by age and hotspot category
hotspot medium cold

48
Appendix Figure 7. Individual labour allocation decisions and generalized indices for Nigeria (individuals
aged 15-24)
Source: Authors’ analysis
.2.2
5.3
.35
.4P
art
icip
atio
n in
fa
rmin
g a
ctivitie
s
-2 -1 0 1 2 3Agricultural potential
95% CI lpoly smooth: Participation_in_farming
(a). Participation in farming activities vs Agricultural Potential
0.1
.2.3
.4P
art
icip
atio
n in
fa
rmin
g a
ctivitie
s
-2 0 2 4Accessibility
95% CI lpoly smooth: Participation_in_farming
(b).Participation in farming activities vs Accessibility
0.0
5.1
.15
.2P
art
icip
atio
n in
no
n-f
arm
bu
sin
ess
-2 -1 0 1 2 3Agricultural potential
95% CI lpoly smooth: Participation_in_non_farm
(c).Participation in non-farm business vs agricultural potential.1
.15
.2.2
5P
art
icip
atio
n in
no
n-f
arm
bu
sin
ess
-2 0 2 4Accessibility
95% CI lpoly smooth: Participation_in_non_farm
(d). Participation in non-farm business vs accessibility
-.0
20
.02
.04
.06
Pa
rtic
ipa
tio
n in
wa
ge
em
plo
ye
me
nt
-2 -1 0 1 2 3Agricultural potential
95% CI lpoly smooth: Participation_in_wage_related
(e).Participation in wage employement vs agricultural potential
0.0
5.1
.15
.2P
art
icip
atio
n in
wa
ge
em
plo
ye
me
nt
-2 0 2 4Accessibility
95% CI lpoly smooth: Participation_in_wage_related
(e).Participation in wage employement vs accessibility

List of RDR 2019 Background Papers published in IFAD Research Series
The demography of rural youth in developing countries By Guy Stecklov, Ashira Menashe-Oren
What drives rural youth welfare? The role of spatial, economic, and household factors By Aslihan Arslan, David Tschirley, Eva-Maria Egger
Youth agrifood system employment in developing countries: a gender-differentiated spatial approach
By Michael Dolislager, Thomas Reardon, Aslihan Arslan, Louise Fox, Saweda Liverpool-Tasie, Christine Sauer, David Tschirley
Gender, rural youth and structural transformation: Evidence to inform innovative youth programming
By Cheryl Doss, Jessica Heckert, Emily Myers, Audrey Pereira, Agnes Quisumbing
Rural outh inclusion, empowerment and participation By Carolina Trivelli, Jorge Morel
Economic participation of rural youth: what matters? By Louise Fox
Landscapes of rural youth opportunity By James Sumberg, Jordan Chamberlin, Justin Flynn, Dominic Glover and Vicky Johnson
Rural youth, today and tomorrow By Ben White
Climate and jobs for rural young people By Karen Brooks, Shahnila Dunston, Keith Wiebe, Channing Arndt, Faaiqa Hartley and Richard
Robertson
Rural transformation and the double burden of malnutrition among rural youth in developing countries
By Suneetha Kadiyala, Elisabetta Aurino, Cristina Cirillo, Chittur S. Srinivasan and Giacomo Zanello
Inclusive finance and rural youth By Arianna Gasparri, Laura Munoz
Information and communication technologies and rural youth By Jenny Aker
Youth access to land, migration and employment opportunities: evidence from sub-Saharan Africa
By Felix Kwame Yeboah, Thomas S. Jayne, Milu Muyanga and Jordan Chamberlin
Rural youth in the context of fragility and conflict By Ghassan Baliki, Tilman Brück (Team Leader), Neil T. N. Ferguson and Wolfgang Stojetz
Rural youth: determinants of migration throughout the world By Alan de Brauw
The Impact of Migrants’ Remittances and Investment on Rural Youth By Manuel Orozco, Mariellen Jewers
Unlocking the potential of rural youth: the role of policies and institutions By Lauren Phillips, Paola Pereznieto
Investing in rural youth in the Asia and the Pacific region By Roehlano Briones
The rural youth situation in Latin America and the Caribbean By Maia Guiskin, Pablo Yanes, Miguel del Castillo Negrete
Investing in rural youth in the Near East, North Africa, Europe and Central Asia By Nader Kabbani
The narrative on rural youth and economic opportunities in Africa: Facts, myths and gaps By Athur Mabiso, Rui Benfica
All publications in the IFAD Research Series can be found at:
https://www.ifad.org/en/web/knowledge/series?mode=search&catSeries=39130673


International Fund for Agricultural Development
Via Paolo di Dono, 44 - 00142 Rome, Italy
Tel: +39 06 54591 - Fax: +39 06 5043463
Email: [email protected]
www.ifad.org
facebook.com/ifad
instagram.com/ifadnews
linkedin.com/company/ifad
twitter.com/ifad
youtube.com/user/ifadTV


