74
Resa

Resa
L’ÉNERGIELES MÉDIAS &
TÉLÉCOMS
LE PORTEFEUILLEDE PARTICIPATIONS


RESA S.A.Rue Louvrex, 954000 LiègeBelgium
RPM Liège - 0847.027.754
www.resa.be

ELECTRICITYPRODUCER
REGULATOR
SUPPLIER
ELECTRICITYTRANSMISSION
SYSTEM OPERATOR(TSO)
NATURAL GASTRANSPORT
SYSTEM OPERATOR
DISTRIBUTIONSYSTEM
OPERATOR (DSO)
RESIDENTIAL CUSTOMERBUSINESS CUSTOMER
NATURAL GASIMPORTER
Management Report 2017 - 10

ELECTRICITYPRODUCER
REGULATOR
SUPPLIER
ELECTRICITYTRANSMISSION
SYSTEM OPERATOR(TSO)
NATURAL GASTRANSPORT
SYSTEM OPERATOR
DISTRIBUTIONSYSTEM
OPERATOR (DSO)
RESIDENTIAL CUSTOMERBUSINESS CUSTOMER
NATURAL GASIMPORTER
12
34
56
Editorial - 4
6 - Management bodies
Management Report 2017 - 10
Annual accounts 2017 - 38
20 - Highlights 2017
68 - List of adjudicators

the network user at the heart of primary concerns

RESA is a public interest player in the dis-tribution of energy, a market facilitator between the different intermediaries in the world of production, distribution and the transportation of energy. Like all Walloon distribution system operators, RESA plac-es the grid user at the heart of its primary concerns. In a market that is marked by a desire to control households' energy envelope, the DSO must or-ganise itself and challenge its mode of operation according to sector regulation requirements.
RESA DSO has managed to meet the major challenges of regulation, for the benefit of network users, by ensuring control of its operating costs. Legislative initiatives under way to set new standards for the constitution of DSOs and strength-ened requirements for independence, sometimes beyond the wishes expressed by the EU, will cause new upheavals, not only within the group to which the DSO is attached and from which it draws its management efficiency, but also call to the more general reflection on the future of the landscape of energy distribution in Wallonia. The public authori-ties of Liège, the ultimate shareholders of the group, are today fully aware of the issues surrounding DSO RESA, and more generally the Nethys-PUBLIFIN group.
Certainly the year 2017 has been atypical and full of paradoxes, for more than one reason... An exceptional financial balance sheet, unprece-dented results - the result of sound and strict man-agement at all times - with a troubled political and media context linked to PUBLIFIN, the parliamen-tary inquiry committee. In spite of this particularly difficult and uncertain climate, we wish to underline the exemplary professionalism of our staff who have tirelessly fulfilled their daily tasks in the service of the customers. This behaviour is testimony to the extreme maturity of the workers in our group who are not fazed nor are distracted from their essential role. This behaviour reflects the extreme maturity of the workers in our group who do not allow them-selves to be diverted from their essential role.
RESA
- A
nnua
l Rep
ort 2
017
—5

RESA’s management bodies have undergone significant changes in the fiscal year 2017
SITUATION AS OF 31 DECEMBER 2017
1. La Compagnie du Monty SA represented by Mr. Pierre MEYERS Chairman
2. NETHYS S.A., represented by Mr.Stéphane MOREAU Managing Director
3. Mr. Pol GUILLAUME Vice-Chair
4. Ms.Josette MICHAUX Vice-Chair
5. Mr. Pierre STASSART
Director
6. Ms. Denise LAURENT
Director
RESIGNED FROM THEIR POSITION DURING THE YEAR 2017
1. PUBLIFIN SCRL represented by Mr. André GILLES
2. Mr. Dominique DRION
3. Mr. Claude PARMENTIER
4. Mr. Georges PIRE
5 Mr. Pol HEYSE
6. ABNM Consulting Services SPRL represented by
Mr. Diego AQUILINA
7. CGO SA, represented by Mr. Philippe DELAUNOIS
Publication has been provided in the annexes of the
Moniteur belge.
Board of Directors
2
On 11 May 2018, the Walloon Parliament passed a decree amending the decree of 12 April 2001 on the organisation of the regional electricity market and the decree of 19 December 2002 on the organisation of the regional gas market.
As a result of the provisions of this decree and in order to meet the requirements ex-pressed by the Walloon Regulator as part of the controls carried out during the financial year, DSO RESA will be called upon to make a substantial change in the composition of its management bodies.
RESA
- A
nnua
l Rep
ort 2
017
—6
1. NETHYS S.A. represented by Mr. Stephane MOREAU
Chairman
2. Ms. Bénédicte BAYER
Chief of the CEO office
3. Mr. Pol HEYSE
CFO
4. Mr. Gil SIMON
General Secretary
The ExecutiveCommittee
SpecificCommitteesAudit and Risk Committee
Vacant position
Chairman
Mr. Pol GUILLAUME
Member
Ms. Josette MICHAUX
Member
Nomination and Remuneration Committee
Vacant position
Chairman
Mr.Pol GUILLAUME
Member
Ms. Denise LAURENT
Member 2RE
SA -
Ann
ual R
epor
t 201
7
—7

Quality Safety Availability Efficiency
RESA
- A
nnua
l Rep
ort 2
017
—8

8 OPERATING
SITES —
136,500 public lightning
POINTS —
14,113 KILOMETRES
of electricity network —
4,033 KILOMETRES
of gas network —
723 STAFF
—
680,083 GAS AND ELECTRICITY
SUPPLY POINTS —
5,752,595 MWh/Yr
DEMAND ON THE GAS NETWORK
—
3,601,563 MWh/Yr
DEMAND ON THE ELECTRICITY GRID
—
An identityand strong values
RESA
- A
nnua
l Rep
ort 2
017
—9

Management report from the Board of Directors on the annual accounts at 31 December 2017
In accordance with the provisions of the Corporate Code, we have the honour to report on the fiscal year covering the period from 1 January to 31 December 2017 and submit for your ap-proval the accounts for the year ended 31 December 2017.
As a first step, the Board wishes to bring to your attention the following information which occurred in fiscal year 2017:
3

I. GENERAL CONTEXT
For most of 2017, the company's activities took place in the politico-media context linked to the parliamen-tary inquiry commission charged with transparency on the PUBLIFIN-Nethys group, parent companies of RESA SA. In its final report, the parliamentary commission of inquiry concluded with various rec-ommendations, which certainly have no legal signif-icance as such, but which will directly or indirectly have a potential impact on the structure of the DSOs in Wallonia. This final report was the initiator of var-ious draft legislative amendments, including one amending the decrees relating to the organisation of the regional market for electricity and gas. The Board of Directors is of the opinion that the recom-mendations issued by the Parliamentary Committee of Inquiry in 2017 are not binding and that it is there-fore not appropriate for the financial year under review to consider the potential financial impacts resulting from it. The Parliamentary Inquiry Committee makes the following recommendation: put the structure of the group in compliance with the "gas" and "electricity" de-crees and take all measures to ensure the legality of acts by each body including the DSO. As a result, take all the necessary measures to this end and in particular recover RESA's shares and even assets in PUBLIFIN - without cost to PUBLIFIN - in order to directly link the DSO to its public shareholding and to ensure strict independence with re-gard to other activities within the group. These structural changes cancel the 2014 and 2015 decree amendments and will necessarily generate significant costs, the size of which remains to be determined.
The Board of Directors considers, however, that the rec-ommendation made with regard to the structure of the DSO is based on a misunderstanding of Articles 6 and 7 of the Electricity Decree as demonstrated by the internation-al law firm LINKLATERS in the analysis of 12 September 2017, in response to the Committee's final report commis-sioned by majority shareholder Nethys.
Compliance with the future provisions of the Gas and Electricity Decrees can only be achieved after - or con-comitantly with - the entry into force of the aforemen-tioned legal provisions and with consequent restructuring costs (legal, financial, HR , IT, logistics, purchasing, etc.). Internal services, however, are already working on the preparation of legal and operational decisions to make RESA SA independent from the rest of the Group. The an-nounced autonomy of RESA SA with regard to the Nethys group will necessarily lead to losses of operational syner-gies that will impact on operating results. In the context of the company's bond program, however, on 14 September 2017 the rating agency Moody's con-firmed the A2 rating with stable outlook.
The CWaPE* and the UVCW** have delivered their respec-tive opinions on the draft decree amending the Gas and Electricity decrees. The Board of Directors acknowledges that the CWaPE considers in particular that the possibility for a DSO to entrust all or part of the day-to-day opera-tion of its activities to a subsidiary should be limited if this would be justified by an economy of scale, which could hardly be the case when only one DSO has an operational subsidiary. The presence of a subsidiary presents, in the opinion of the CWaPE, supervisory difficulties for the regu-lator particularly with regard to the examination and prop-er understanding of the nature of the subsidiary's costs which are re invoiced to the DSO. The Board of Directors notes, however, that this objective of economy of scale has indeed been achieved by DSO RESA, particularly in terms of pooling a range of support services through its links with the NETHYS Group.
The opinion of the Board of Directors of the UVCW high-lights a set of major impacts such as the obstacle to the raising of capital on the markets to finance future invest-ments, an interpretation of the unbundling (of property) beyond European standards, the obligation to call on its own staff, the modification of the composition of manage-ment bodies and the prohibition of the form of legal per-son governed by private law, in particular.
II. REGULATORY CONTEXT AND TRENDS OVER THE FINANCIAL YEARElectricity and gas distribution management activities were carried out under the cover of distribution tariffs as part of the transitional period implemented by the Regulator pending the new tariff methodology coming into force for the years 2019 to 2023 which was finally published on 17 July 2017. By agreement of the Regulator, the electricity and gas distribution rates in force on 31 December 2017 were also extended for the transitional tariff period 2018, and not indexed.
In addition, a consultation calendar with market partici-pants has been established. This new tariff methodology is part of the decree adopted on 19 January 2017 by the Walloon Parliament.
For each year of the regulatory period, the calculation of the authorised revenue (covered by the periodic distribu-tion rates) is made according to a specific formula. The constraint linked to this model is that the revenue author-ised for 2019 excluding charges relating to specific budg-ets and excluding regulatory balances cannot exceed the 2017 budget envelope (indexed) beyond the ceiling and excluding the regulatory deposit. The authorised in-come proposals for the years concerned must reach the CWaPE for 1 January 2018. These authorised electricity and gas revenue proposals were approved by the Board of Directors on 20 December 2017 and returned to the regulator.
* CWaPE : Commission wallonne pour l’Energie - Walloon Commission for Energy
** UVCW : Union des Villes et Communes de Wallonie - Union of Cities and Towns of Wallonia
MANAGEMENT REPORT
RESA
- A
nnua
l Rep
ort 2
017
—11

According to this future tariff methodology, the decrease in RESA's controllable costs is estimated at 1.5% per year from 2020 and cumulative annually (estimated impact of factor X in the work-ing groups), which accentuates the regulatory pressure on the operational activities of the DSO.
In addition, RESA has granted the audits carried out by the CWaPE on the Walloon DSOs in terms of independence, organisation and confidentiality and has communicated a number of elements and arguments with regard to the decree provisions applicable to it.
*Overall, the year 2017 is characterised by an average 2.95% in-crease in tariffs and a slight increase of 0.45% in electricity for billed volumes, which is a stable situation due to the increase in consumption of 0.92% of customers connected to low voltage. As far as the distribution of gas is concerned, we have seen vol-umes distributed increase by 4.62 %, mainly due to an increase of 1.51% for Sane and degree days by 5.94% (degree-days rolling over 12 months)
The combination of these two phenomena results in an increase in Grid fee turnover (distribution fees) for RESA S.A. of 3.98%.
Also note, regarding the remuneration of DSO activities, that OLO 10-year rates, key factors for determining the margin of remuner-ation for the activity are at historically low levels and remain be-low 1% in 2017. However, the application of the new formula of determining the DSO's fair margin established by the CWaPE's transitional tariff methodologies for 2015-2016 and 2017 helped limit the effects of this decline (impacting only secondary regulat-ed assets) on the net income of the DSO. This is an increase over the previous year.
For the future, the regulatory pressure exerted on the DSO will inevitably intensify. It will be up to the DSO to exercise the utmost management rigour and the greatest possible efficiency in the management of controllable costs so as not to degrade its prof-it, i.e. its fair margin. To maintain profitability, RESA must there-fore continue to improve its efficiency, including through optimal management of assets and resources. The new 2019-2023 tariff methodology goes in this direction and introduces a "Revenue Cap" regulatory system containing a productivity factor of 1.5%/year for DSOs.
As evidenced by the graph below drawn up by the CWaPE, by way of example, RESA’s low-voltage electricity distribution tariffs (€241/ year) is below the weighted average of Walloon DSOs (€268/year), reflecting efficiency and cost control efforts.
Application of the provisions of the Code of Well-being at Work, Book III - Title 2 on the minimum safety requirements for electrical installations in workplaces.
Title 2 of Book III of the Code of Well-being at Work (MB 02/06/2017), incorporates the provisions of the Royal Decree of 4 December 2012 (which has become obsolete).
As a reminder, by Judgement of 5 March 2015, the Council of State rejected RESA, as well as other managers of distribution systems, in their action for annulment against the Royal Decree of 4 December 2012 on the minimum safety requirements of electri-cal installations in the workplace.
A review of the said judgment is no longer topical, but contacts with the authorities, via Synergrid, are nevertheless seeking an interpretation taking into account the particular situation of net-work managers. The aim of this approach is, first, to make the provisions of the Code (Book III Title 2) manageable for DSOs and, secondly, to revise certain articles of the new RGIE - Book 3 for DSOs (whose publication is planned for the end of 2018) in order to take into account the specifics of the DSOs, in particular concerning the DSOs' exemption from the obligation of conform-ity and periodic inspections of low-voltage pavement substations (thus attempting to prolong certain provisions of the exemptions that had been obtained by post from the Ministry of Economic Affairs on 6 May 1999, but whose legal value has been ques-tioned since then).
In 2017, RESA carried out an inventory, a risk analysis on 2,300 cabins and a prioritisation of investments on these cabins. The fi-nalisation of these analyses is scheduled for 2018. RESA has also awarded a contract for the initial checks of the old cabins. These will be spread over 2018 and 2019.
The first renovations of cabins listed as potentially dangerous fol-lowing the risk analysis started in 2017.
A renewal policy has been budgeted for future years in order to achieve compliance of all our network cabins.
Electricity distribution tariffs in Wallonia
Source: annual report 2017 CWaPE
LOW VOLTAGECustomer type Dc Consumption HP: 1.600kWh
Consumption HC: 1.900kWh
Network managers Distribution tariff 2017 (€/yr) Change 2017/2015
ORES MOUSCRON 197 7%
ORES Walloon Brabant 226 7%
AIEG 236 16%
RESA 241 7%
ORES HAINAUT 266 12%
PBE 277 8%
ORES NAMUR 279 11%
ORES LUXEMBOURG 303 9%
AIESH 313 3%
REW 325 17%
GASELWEST 326 38%
ORES EST 346 9%
ORES VERVIERS 366 15%
WEIGHTED AVERAGE €268 10%
Comparison of the electricity distribution tariffs of distribution system operators for a typical Eurostat DC customer from1 January 2017
WEIGHTED AVERAGEORES MOUSCRON
ORES BWAIEG
RESAORES HAINAUT
PBEORES NAMUR
ORES LUXEMBOURGAIESH
REWGASELWEST
ORES ESTORES VERVIERS
RESA
- A
nnua
l Rep
ort 2
017
—12
III. OPERATIONAL ACTIVITIES Resumption of the operational management of
the electricity grids in Liège city centre
As part of the takeover of INTERMOSANE Sector 1's elec-tricity grid management, an agreement on ORES's oper-ating procedures for the distribution of electricity in Liège was concluded in 2011. Operational management has been entrusted to ORES until 31 December 2016 with the gradual provision of RESA staff to replace the posts di-rectly assigned to grid management in Liège city centre. In order to allow RESA to fully resume operational manage-ment of the grids in Liège city centre without any impact on grid users, the agreement by ORES on the terms of operation of the distribution of electricity in Liège for and on behalf of RESA has been extended until 30 June 2017. The actual recovery took place on 1 July 2017.
Participation in the federal clearing house project, Atrias, a complex creation taking shape
The DSOs and Atrias have been on the Central Market System programme (Federal clearing house) for several years. They make every effort to complete this complex project which is important for the sector, and which aims to create a platform capable of supporting information ex-change in the SMART world, the beginnings of which are now noticeable. Both human and financial investments in this national pro-ject agreed by the DSO have however generated discus-sions with the Regulator and led to the recognition in the distribution tariffs for the periods 2015-2016 and 2017 of a complementary fixed-rate package for the project based on the number of Sane available to the different DSOs, taking into account the fact that the DSO is simultaneously supporting, over the years 2016 and 2017, the develop-ment costs of the Atrias clearing house (CMS) and current costs of maintenance of the clearing house based on the introduction by the DSO of a multi-year business plan for the costs and expected benefits of the proposed ATRIAS clearing house.
The year 2017 has had a series of tests and has conclud-ed, in view of the position of different DSOs invested in this programme, the postponement of the go live for this project.At RESA, the Atrias@RESA program consolidates all the components of the internal transformation aiming to im-plement in its own systems the changes related to the implementation of this new contract model as well as the specifics related to the integration with the Central Market System.
E-Cloud Project
As a reminder, the ''E-Cloud'' is a pilot project, introduced to the Walloon Region as part of the Marshall Plan 4.0, which tends to demonstrate interest in an electrical system integrating consumers and production units by optimising energy flows, optimising them for consumers, producers and the community. This project is aimed primarily at SMEs in two areas of
economic activity, one in the territory of DSO RESA and the other in the territory of DSO ORES, both coordinators of the project in their area.
In 2017, although the project has been approved by DG06 - recognising its innovative nature - and given the change of majority at Government level, subsidy funds have so far not been claimed by the project partners . However, convinced of the usefulness and the interest for Walloon industrialists and SMEs, the partners started the project using their own funds and just completed the analysis and simulation phase at the beginning of 2018.
This first phase was completed with the assistance of the customers in the two selected zones of activity. After an information session and one-on-one meetings, nearly 25% of the customers connected to these areas showed interest and signed a participation agreement. This partic-ipation rate is an important indicator for project partners. It reassures us that the concept of the E-Cloud responds well to the concerns of the target audience, SMEs Walloon zonings. In this project, the DSOs are in charge of the collection of the various data leading to the correct invoicing of the energy exchanges within the E-Cloud community and the link with the energy market.
The DSOs also want to give different customers forecasts on their consumption and production profile in order to al-low participating customers to optimise their consumption profile according to these forecasts. It should be noted that all that the DSO does is communicate this informa-tion. It is up to the customers themselves, or even other service providers that customers could freely choose, to use this information to drive their consumption processes. We believe that the DSOs are again in their role of market facilitator by creating the optimal conditions for the emer-gence of new services for SMEs. Means for making these forecasts available to customers will be studied in 2018.
For the actual creation of the forecasts, the DSOs will be releasing models developed as part of the GREDOR project.After many simulations, the DSOs were able to find a con-figuration that would allow a reduction in the cost of elec-tricity for the customers participating in the E-Cloud while guaranteeing profitability to the investors in the means of production (of the order of 7 %).
The goal of the project is to:
- Check the impact that an "E-cloud operation" might have on how partner customers consume;
- See the influence that the E-cloud can have on energy flows (injection/removal) at the ELIA station;
- Show that the E-cloud is a way to support the devel-opment of renewable energies without resorting to the green certificates mechanism;
- Ensure that all players in the E-cloud are winners by minimising the impact on the distribution bill of custom-ers outside the E-Cloud and/or having a lower impact compared to other models of development of existing renewable energies (direct line, individual self-con-sumption) or future ones (micro-grid).
To maximise the gains from the E-Cloud, the involve-ment of partner customers is essential. The DSOs are
MANAGEMENT REPORT
RESA
- A
nnua
l Rep
ort 2
017
—13

convinced that only the confrontation with the reality of the field will validate the hypotheses and simulations carried out in the first part of the project.
This is the reason why the two DSOs have requested the agree-ment of the CWaPE to deploy the E-Cloud tools on the defined zones, benefiting from a tariff exception based on Article 21 of the Decree of 19 January 2017 on the tariff methodology applicable to gas or electricity DSOs. The CWaPE response is scheduled for the first quarter of 2018.
THE GREAT ACHIEVEMENTS OF 2017 A. On the Electricity Grid
As every year, RESA has carried out several major projects on its electricity distribution network to improve its efficiency, safety and its quality:
Below is a summary of the main sites:
a) Improvement to supply in the Geer valley at Bassenge
Medium voltage cables were laid for the removal of two overhead networks from the GENDARMERIE and HAESEN network cabins. These installations will facilitate the transfer of electricity by elimi-nating sections of cables with small cross-sections and will avoid voltage differences when switching from one injection point to another (MALVOIE/ALLEUR). RESA laid 1,985 m of cables and decommissioned 849 m of obsolete paper cables.
b) Improvement in the supply to part of the municipality of Oupeye
Medium voltage cables were installed to improve the supply to a part of Oupeye from the HAUTS SARTS substation in Herstal (de-parting form EMUBEL). These installations have also eliminated a medium voltage overhead line overhanging homes and gardens. RESA laid 3,390 m of cables, decommissioned 2,685 m of obso-lete paper cables and removed 420 m of overhead lines.
c) Improvement in the supply to part of the town of Hannut
Medium voltage cables were installed to improve the supply to part of Hannut from the divisional cabin of HANNUT GARE at Hannut (departing from TALLEYRAND). These installations have also made it possible to remove several cast iron terminals locat-ed in the cabins along the installations as well as the removal of a dilapidated customer cabin in a building. RESA laid 1,646 m of cables and decommissioned 1,888 m of obsolete paper cables.
d) Removal of overhangs and overhead lines
In 2017, RESA devoted a part of its strategic investment to the burial of several dilapidated overhead lines and the elimination of overhangs in housing areas and areas with trees. The first project was in the municipality of Juprelle and the second was in the mu-nicipality of Aywaille. These different cable layouts will make the customer's power supply more reliable, and also improve network operation during repairs. For these two projects, RESA laid 8,677 m of cables and removed 7,050 m of overhead lines
RESA
- A
nnua
l Rep
ort 2
017
—14

B. On the Gas Distribution Network
As every year, RESA has carried out several major op-erations on its natural gas distribution network, whether renewals of pipelines, moves, extensions or technical clo-sures, but also setting up new gas cabins or their renewal.
Below is a summary of the main sites:
SITE OF RENEWALS AND MOVES
a) Construction site at Seraing, rue du Molinay
As part of the Molinay district renovation project, RESA has pro-ceeded with the renewal of 625m of low pressure pipelines and the connections of the network users in the area covered by the sanitation.
b) Construction site at Eupen Herbesthalerstrasse
As part of the SPW* development project from the main street to Eupen city centre, RESA proceeded with the renewal and relocation of 2400m of LP and MP pipelines. This project was completed in 2017 after three separate phases, the first of which started in 2015.
EXTENSIONS AND TECHNICAL CLOSURES
b) Construction site at Stavelot, rue Basse-Levée
In order to secure Stavelot's network while under development, RESA proceeded with the technical closure of two network cab-ins. This looping required the installation of a low pressure pipe-line DN 160 over a length of 1200 m. c) Construction site at Ivoz, Avenue Gonda - Seraing,
Val Saint-Lambert
In 2017, RESA finalised the second phase of the 15 bar medium pressure project to supply a 15bar/5bar distribution station with a capacity of 30,000 Nm³/h from the new Fluxys station in Ivoz-Ramet. This installation totalled 2700m of DN200 pipes (includ-ing 1900m in 2017). This investment will increase the reinjection capacity to the MP network in the Seraing center but will also strengthen the left bank at Flémalle.
* SPW : Service Public de Wallonie - Public Service of Wallonia
NEW NETWORK AND CUSTOMER CABINS
A new network cabin was also built in 2017 as well as seven cabins for customers:
Location AddressCabin Type
Capacity (Nm3/h)
Liège Rue Fusch5bar/20mbar network cabin
400
HerstalRue de l’Ecole Technique
Customer IPES Herstal
650
Oupeye TrilogiportCustomer DL
Trilogiport250
Eupen Rue HütteCustomer
municipal swim-ming pool
100
BatticeRue des Gayettes
Customer Haver Belgium
250
Welkenraedt Chemin Du DucCustomer
Dantresangle
SeraingRue Camille Lemonnier
Customer Fédé Wallonie-Bxl
school
LimburgQuai des Religieuses
Customer Ste-Claire school
100
RESA then proceeded with the renewal of six network cabins
Location AddressCabin Type
Capacity (Nm3/h)
Beyne-Heusay
Rue du Homvent 5bar/
20mbar1,500
LiègeRue Sainte-Walburge
5 bar/ 20 mbar
1,500
LiègeAngleur, Municipal park
5 bar/ 20 mbar
1,500
LiègeAngleur, rue Vaudrée
5 bar/ 100
mbar/20mbar2,500
LiègeSclessin, rue de la Centrale
5 bar/ 100 mbar
1,500
Huy Rue de Durbuy5 bar/
100 mbar750
a) Campaign to promote connection to the natural gas network
Note that the linear reduction of the volumes flowing through the gas distribution network has led RESA to implement a campaign to promote connection to the network of natural gas as a prior-ity on the territories equipped to do so (excluding extensions), to increase the base of the network users and to counter this volume effect in the coming years. A potential of 48,000 users has been identified. The awarding of bonuses for new connec-tions or replacement of heaters began in April 2017.
MANAGEMENT REPORT
RESA
- A
nnua
l Rep
ort 2
017
—15

IV. ANALYSIS OF THE ANNUAL ACCOUNTS
A. Balance Sheet and Income Statement
BALANCE SHEET
The total balance sheet of S.A. RESA amounts to €1,483,683,024.10.
The main headings of the assets are:
•Fixed assets worth €1,326,330,636.38 are mainly made up of the value of the electricity and gas networks
•Stocks and contracts in progress: €14,356,603.58
•Amounts receivable within one year: €82,987,824.39 of which €79,921,675.01 are trade debtors
•Cash at the bank and in hand: €36,704,272.97
•Deferred charges and accrued income: €23,303,686.78
The main line items of the assets are:
•Share capital of €657,880,492.30 represented by 9,063,477 shares
•Shareholders’ equity amounted to 702,356,508.28 €
•Provisions for liabilities and charges: €7,858,017.32
•Amounts payable after more than one year: €545,016,262.06, including the €500 million bond issue
•Amounts payable within one year: €182,680,005.80, including €80,279,908.95 of commercial debts, €23,869,853.43 of tax debts and €34,327,281.25 of other debts
•Accrued charges and deferred income: €45,772,230.64
INCOME STATEMENT
Operating income include a turnover of €352,628,221.72.
The cost of sales and services in the amount of €267,819.801,39 breaks down as follows:
•Raw materials, consumables: €36,743,183.35
•Services and other goods: €163,100,479.99
•Depreciation, downward valuations and provisions: €45,069,682.55
•Other operating charges: €22,006,578.69
•Non-recurring operating expenses: €899,876.81
The financial performance shows a positive result of €8,783,954.55
The performance before tax for the year ended with a profit of €76,024,465.78
Profit after tax amounted to €50,932,783.90.
RESA
- A
nnua
l Rep
ort 2
017
—16

B. Allocation of Profits
Gain to be appropriated: €50,932,783.90
Profit to be appropriated: €15,507,329.68
Transfers to the legal reserve: €2,546,639.20
Profit to be carried forward: €33,333,804.04
Return on capital: €30,559,670.34
C. Risks and uncertainties facing the company
The Board of Directors remains particularly attentive to the legislative work related to the preliminary draft decree of the Walloon Government modifying the Electricity and Gas Decrees. The new legislative projects no longer provide for any un-bundling of ownership, but retain the provisions relating to the removal of the possibility for the DSO to establish itself in the form of a private company but rather in the form of a public legal entity of which at least 75% of the capital is held by municipalities or provinces; the rest may be held by one or more private shareholders.
It shows the DSO must in the future be set up in the form of an intermunicipal company with as shareholders the different local authorities attached to the DSO or a "pure inter-municipal" financing company involving these same local authorities. Given the current status of PUBLIFIN scrl, parent company of the group, it could not be a share-holder of DSO RESA.
The Board of Directors has taken note of the review of var-ious types of risks related to RESA becoming autonomous of the Nethys group. They consist, for the most part, of significant expenses and investments to be allocated to the reconstruction of an IT infrastructure aimed at support-ing RESA’s business processes, the overall organisational overhaul of activities and a reallocation of human resourc-es, even, where applicable, commitments of management and management staff.
D. Significant events since the end of the fiscal year
The Board of Directors became aware of various avenues of reflection stemming from the analysis conducted with the support of the consulting firm McKINSEY on the recali-bration of the scope of activities of the majority sharehold-er Nethys with as a precept the autonomy of DSO RESA from the Nethys group. This decision was also recorded by Nethys's Board of Directors as binding on the com-pany, in view of the draft decree currently being adopted and the position of the regulator. The future "DSO" decree, which passed to its second and third readings during the
first quarter of 2018, will impose upon RESA the condi-tions of ownership and the specific operating conditions. In fact, the DSO will have to take the form of a legal public entity directly owned by the Province/municipalities or by a pure inter-municipal financing company. The regulator's position of enhancing the DSO's independence from the group companies will require RESA to retain its own staff and to prevent resources from delivering for different ac-tivities. Both of these lead to the autonomy of DSO RESA as regards the Nethys group.On the basis of the analyses carried out by the McKinsey consultancy on behalf of the shareholder Nethys, "disyner-gies" were evaluated, upon first approach, at €8 million for RESA and represent an estimated €90 million loss in val-ue. The interaction of support services in the broad sense has thus far allowed the generation of important syner-gies that result in lower prices to the weighted average of Walloon DSOs.The importance of these "disynergies" requires an extreme-ly precise "carve out" study in order to have a comprehen-sive register of operations and impacts in the operational field, of allocation of resources and information including tools. The total cost of these operations has not yet been defined with precision, but it will have a significant impact on the operating expenses and of investments during the next years.
E. Circumstances which may have a significant influence on SA RESA's development
The main impact of the draft decree for the Walloon Region to amend the Decree of 12 April 2001 on the organisation of the regional electricity market and the Decree of 19 December 2002 on the organisation of the regional gas market, as drafted at the time the present annual report was established, will be making DSO RESA autonomous from the Nethys-PUBLIFIN group. In its final report of 1 March 2018 on the control over DSO RESA, the CWaPE reckoned it would be appropriate to favour an interpre-tation of the Electricity Decree in line with the Electricity Directive and consider that the notion of "producer" within the meaning of Articles 7 bis and 16 ter of the Electricity Decree also targets companies that have both a produc-er and a DSO. The Board of Directors does not however share the CWaPE's interpretation on the notion of produc-er extended to Nethys and stresses the substantial social difficulties as well as a likely increase in payroll that could result from a transfer of Nethys staff. RESA argues strong-ly for Nethys staff to continue to work for the DSO because the 'disynergies' that will result are extremely strong.
MANAGEMENT REPORT
RESA
- A
nnua
l Rep
ort 2
017
—17

In conclusion, the compliance of the structure of the PUBLIFIN Group with regard to the future provisions of the Electricity and Gas Decrees can only be put in place after - or concomitantly with - the entry into force of the aforementioned legal provisions, leading to a broad restructuring cost. Majority shareholder Nethys has already initiated a set of preparatory analyses to implement the empowerment of DSO RESA and its future positioning in the Walloon energy distribution landscape.
F. Research and development activities
RESA has development and research activities in the following areas:
• the development of new systems for intelligent distribution of electricity and gas: Smart Distribution. • the development of new communication and telemetry tech-niques for electricity distribution equipment: communications and low currents. • the development of new tools and methodologies for the man-agement of the network infrastructure. • the development of new technologies related to energy distribu-tion: Electricity/Gas technology watch.
G. Existence of branches
None.
H. Information on the use of financial instruments
RESA S.A. has access to three-month versus long-term interest rate swaps.
Then, we inform you that:- there is no interest against the directors or shareholders.
Please kindly approve the present annual accounts and grant dis-charge to the directors as well as the Commissioner for their roles in the past year.
For the Board of Directors.Liège, 28 March 2018.
Monty S.A. company
Represented by Pierre MEYERSChairman.
RESA
- A
nnua
l Rep
ort 2
017
—18

MANAGEMENT REPORT
FINANCIAL YEAR FROM 01/01/2017 TO 31/12/2017
Rre
Dear shareholders,
In accordance with the provisions of Article 100 (6) /3 of the Companies Code, we hereby present you with a remunera-tion report giving an overview, on an individual basis, of the amount of compensation and other benefits, whether in cash or in kind, granted directly or indirectly, during the financial year, to the non-executive directors as well as to the executive directors as regards their position as a member of the Board of Directors, by the company or a company that is part of that company's accounting consolidation exercise.
We inform you that no remuneration or benefit has been at-tributed to administrators of RESA SA for the fiscal year 2017.
The positions of Directors within RESA SA are exer-cised free of charge, it being understood that these directors were remunerated in the exercise of their positions as Directors within the majority shareholder, Nethys SA.
RESA
- A
nnua
l Rep
ort 2
017
—19


Missions
As a key player in the distribution of electricity and natural gas in the province of Liège, RESA constantly invests to improve the quality of its supply and adapt its networks to the development of 73 municipalities.
To bring energy to your home
Whether it is for its individual or pro-
fessional customers, RESA builds,
maintains and operates natural gas
and electricity distribution networks,
is responsible for new connections
and the modification of existing con-
nections, and solves power outages
and failures on the networks 24 hours
a day.
In 2017, RESA recorded 2,768 new
connections to the electricity grid
and 1,794 new connections to the gas
network.
To exchange information and contribute to the proper operation of the market
RESA records and processes all in-
formation related to metering, points
of supply and consumption data, and
transmits it to suppliers for billing.
RESA maintains the access register
that brings together data on nearly
680,083 connections to electricity
and gas and provides access to its
networks for the various players in the
market.
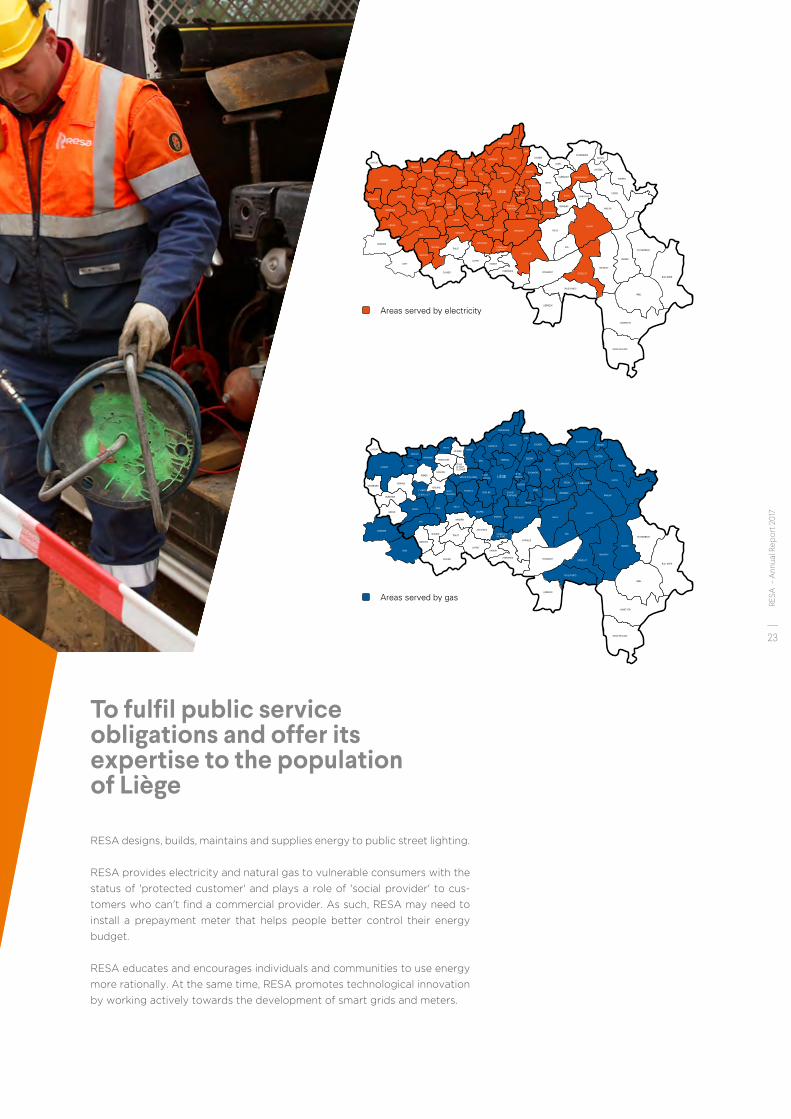
To fulfil public service obligations and offer its expertise to the population of Liège
RESA designs, builds, maintains and supplies energy to public street lighting.
RESA provides electricity and natural gas to vulnerable consumers with the
status of 'protected customer' and plays a role of 'social provider' to cus-
tomers who can't find a commercial provider. As such, RESA may need to
install a prepayment meter that helps people better control their energy
budget.
RESA educates and encourages individuals and communities to use energy
more rationally. At the same time, RESA promotes technological innovation
by working actively towards the development of smart grids and meters.
OHEY
Areas served by electricity
OHEY
Areas served by gas
RESA
- A
nnua
l Rep
ort 2
017
—23

135,500 public lighting points and a new Order from the Walloon Government (AGW)RESA designs, develops, maintains and supplies energy to
public street lighting.
RESA's network of 135,500 lights is distributed over 54 mu-
nicipalities in Liège.
Preventive maintenance, normal curative maintenance and
organisation for the maintenance of the components of the
grid are provided by RESA's teams. Public lighting main-
tenance costs have been the responsibility of DSOs since
2008.
Now, these 135,500 lights consume 47 million kWh per year,
which represents an expenditure of €7.6 million.
After a detailed audit, RESA is now able to provide each
municipality with an inventory of energy-consuming lights,
per neighbourhood and per street, and to propose solutions
to reduce the energy bill of €5.32 million, i.e. a reduction of
the overall bill by 70 %. In particular RESA is offering the
municipalities the chance to work on the equipment in place
and adjust the power of the lights to meet real needs, taking
into account the standards in force, the places to be lit and
how busy they are.
In 2017, RESA replaced 28.012 lamps as part of routine pre-
ventive maintenance and 9.517 lamps as a curative measure
(5 visits per year per municipality) i.e. 37.529 interventions.
Towards better energy efficiency
The energy efficiency of public lighting installations has 4
components:
• the replacement of the set of low-pressure mercury va-
pour fittings ('fluorescent' tubes) was completed at the
end of 2015. Despite the weak power of these lamps,
this change has enabled a saving of 55%
• the replacement by the end of 2018 of the set of
high-pressure mercury vapour fittings, banned from
sale by the European Union because they are too
energy-intensive
• investments to make energy and maintenance savings
• the five-year energy audit
TimeHighlights
RESA
- A
nnua
l Rep
ort 2
017
—24

LED is gaining ground
LEDs are increasingly present in our urban land-
scapes. These compact sources allow more flexibility
in designs, the use of colours and dynamic man-
agement of light, which makes them essential for
illumination. In addition to decorative lighting, LED
technology begins to take a more and more impor-
tant place in street lighting. As part of each reno-
vation and expansion record, RESA has decided to
place lamps equipped with LEDs and dimming de-
vices to allow the affected municipalities to make
substantial energy savings and meet the EU stand-
ard in the field
LED shows significant advances in both environmen-
tal and financial terms:
• dissemination of white light with a better colour
than yellow light
• increase the sense of safety
• reduction in energy consumption
• increase in light efficiency
• adaptation of lighting for every situation
(dimming)
• reduction in light pollution (modulation of power
and luminous flux)
RESA carried out an energy audit for 54 affiliated
municipalities this year. These highlight the situation
of public lighting. They also advocate suggestions
for improvements, including in energy and mainte-
nance for the lighting fixtures in each municipality.
At the end of 2017 RESA also started to replace
about 1,300 high-pressure mercury vapour fittings
with dimmed LED lighting in 5 municipalities:
In 2017, the Walloon Government modified the AGW
of 6 November 2008 relating to the OSP imposed
on the DSO in terms of maintenance and improve-
ment of energy efficiency in public lighting systems
(Walloon Government Decree of 14 September
2017), which has led to RESA creating a 10-year plan
to replace all lamps with LED technology or some
other equivalent.
This plan will be presented at the CWaPE level and
our 54 municipalities during 2018.
LIÈGE
PÉRIPHÉRIE
centre
OHEY
1 2
4
51
3
MUNICIPALITIES EQUIPPED IN LEDs END 2017,TO REPLACE MERCURY VAPOURS
MUNICI-PALITIES
NUMBER OFLEDs INSTALLED
END 2017
1 HUY 689
2 LIEGE 147
3 NEUPRE 125
4 OUPEYE 107
5 SPRIMONT 93
LIÈGE
PÉRIPHÉRIE
centre
OHEY
1 2
4
51
3
MUNICIPALITIES EQUIPPED IN LEDs END 2017,TO REPLACE MERCURY VAPOURS
MUNICI-PALITIES
NUMBER OFLEDs INSTALLED
END 2017
1 HUY 689
2 LIEGE 147
3 NEUPRE 125
4 OUPEYE 107
5 SPRIMONT 93
RESA
- A
nnua
l Rep
ort 2
017
—25


To facilitate access to energy for allAmong the social Public Service Obligations (OSP), RESA assists socially protected custom-
ers and assumes its role of supplier to people in difficulty by guaranteeing a social price that
is lower than any commercial service. One of the objectives pursued by the liberalisation
of the gas and electricity markets in Wallonia is in a strengthening of the protection of the
low-income people facing the risk of being deprived of resources that have become essential
to heat, light, or nourishment.
For the year 2017, the number of protected customers provided with gas and/or electricity
by RESA is 23,111, or a slight increase of 41% compared to the year 2016, linked to the resump-
tion of network management of the territory of Liège city centre.
In order to control its energy costs and to avoid situations of over-indebtedness, RESA is also
responsible for the placement of prepayment meters. A prepayment meter allows electricity
and/or gas to be paid for in advance using a rechargeable prepaid card. Since 2013, prepay-
ment meters have been reloaded using ATMs, available at DSO offices, in some CPASs* and
at many shops.
As of 31 December 2017, RESA's number of active-budget meters amounts to 11,544 gas-
budget meters and 21,583 electricity-budget meters.
* CPAS : Centre Public d’Action Sociale - public social welfare center
Atrias,a complex
undertaking taking shape
The DSOs and Atrias have been on the Central Market System programme
(Federal clearing house) for several years. They make every effort to complete
this complex project which is important for the sector, and which aims to create
a platform capable of supporting information exchange in the SMART world, the
beginnings of which are now noticeable.
Both human and financial investments in this national project agreed by the DSO have
however generated discussions with the Regulator and led to the recognition in the
distribution tariffs for the periods 2015-2016 and 2017 of a complementary fixed-rate
package for the project based on the number of Sane available to the different DSOs,
taking into account the fact that the DSO is simultaneously supporting, over the years
2016 and 2017, the development costs of the Atrias clearing house (CMS) and current costs
of maintenance of the clearing house based on the introduction by the DSO of a multi-year
business plan for the costs and expected benefits of the proposed ATRIAS clearing house.
The year 2017 has had a series of tests and has concluded, in view of the position of different
DSOs invested in this programme, the postponement of the go live for this project.
At RESA, the Atrias@RESA program consolidates all the components of the internal trans-
formation aiming to implement in its own systems the changes related to the implementation
of this new contract model as well as the specifics related to the integration with the Central
Market System.
RESA
- A
nnua
l Rep
ort 2
017
—27

Resumption of the operational management of the electricity grids in Liège city centre
As part of the takeover of INTERMOSANE Sector 1's elec-tricity grid management, an agreement on ORES's op-erating procedures for the distribution of electricity in Liège was concluded in 2011. Operational management has been entrusted to ORES until 31 December 2016 with the gradual provision of RESA staff to replace the posts directly assigned to grid management in Liège city cen-tre. In order to allow RESA to fully resume operational management of the grids in Liège city centre without any impact on grid users, the agreement by ORES on the terms of operation of the distribution of electricity in Liège for and on behalf of RESA has been extended until 30 June 2017.
The actual recovery took place on 1 July 2017.
The E-Cloud Project
As a reminder, the ''E-Cloud'' is a pilot project, introduced to the Walloon Region as part of the Marshall Plan 4.0, which tends to demonstrate interest in an electrical sys-tem integrating consumers and production units by op-timising energy flows, optimising them for consumers, producers and the community.
This project is aimed primarily at SMEs in two areas of economic activity, one in the territory of DSO RESA and the other in the territory of DSO ORES, both coordinators of the project in their area.
In 2017, although the project was approved by DG06 - recognising its innovative nature - and given the change of majority at Government level, subsidy funds have so far not been claimed by the project partners. However, convinced of the usefulness and the interest for Walloon industrialists and SMEs, the partners started the project using their own funds and just completed the analysis and simulation phase at the beginning of 2018.
RESA
- A
nnua
l Rep
ort 2
017
—28

This first phase was completed with the assistance of the customers in the two select-ed zones of activity. After an information session and one-on-one meetings, nearly 25% of the customers connected to these areas showed interest and signed a partic-ipation agreement. This participation rate is an important indicator for project part-ners. It reassures us that the concept of the E-Cloud responds well to the concerns of the target audience, SMEs Walloon zonings.
In this project, the DSOs are in charge of the collection of the various data leading to the correct invoicing of the energy exchanges within the E-Cloud community and the link with the energy market.
The DSOs also want to give different customers forecasts on their consumption and production profile in order to allow participating customers to optimise their con-sumption profile according to these forecasts. It should be noted that all that the DSO does is communicate this information. It is up to the customers themselves, or even other service providers that customers could freely choose, to use this information to drive their consumption processes. We believe that the DSOs are again in their role of market facilitator by creating the optimal conditions for the emergence of new services for SMEs. Means for making these forecasts available to customers will be studied in 2018.For the actual creation of the forecasts, the DSOs will be releasing models developed as part of the GREDOR project.
After many simulations, the DSOs were able to find a configuration that would allow a reduction in the cost of electricity for the customers participating in the E-Cloud while guaranteeing profitability to the investors in the means of production (of the order of 7 %).The goal of the project is to:
• Check the impact that an "E-cloud operation" might have on how partner customers
consume;
• See the influence that the E-cloud can have on energy flows (injection/removal) at
the ELIA station;
• Show that the E-cloud is a way to support the development of renewable energies
without resorting to the green certificates mechanism;
• Ensure that all players in the E-cloud are winners by minimising the impact on the
distribution bill of customers outside the E-Cloud and/or having a lower impact com-
pared to other models of development of existing renewable energies (direct line,
individual self-consumption) or future ones (micro-grid).
To maximise the gains from the E-Cloud, the involvement of partner customers is essen-
tial. The DSOs are convinced that only the confrontation with the reality of the field will
validate the hypotheses and simulations carried out in the first part of the project.
This is the reason why the two DSOs have requested the agreement of the CWaPE to de-
ploy the E-Cloud tools on the defined zones, benefiting from a tariff exception based on
Article 21 of the Decree of 19 January 2017 on the tariff methodology applicable to gas or
electricity DSOs. The CWaPE response is scheduled for the first quarter of 2018.
RESA
- A
nnua
l Rep
ort 2
017
—29

A dynamic investment policyInvestments in the electricity gridIn 2017, RESA invested more than 43 million euros in its
electricity grid, as follows:
NETWORK Gross investments [k EUR] %
LV 24,293 56%
MV 18,618 43%
OTHER 526 1%
TOTAL 43,437 100%
As every year, RESA has carried out several major projects
on its electricity distribution network to improve its efficien-
cy, safety and the quality:
INVESTMENT 2017 [million EUR]
Safety 1.2
Quality 1.2
Efficiency 0.8
Capacity requirement 2.5
Parallel with Elia investments 0.8
TOTAL 6.4
19%
Safety Quality Efficency
Capacity requirement Parallel with ELIA Investments
19%
12%
38%
12%
RESA
- A
nnua
l Rep
ort 2
017
—30

Main projectsImprovement to supply in the Geer valley at Bassenge
Medium voltage cables were laid for the removal of two overhead net-
works from the GENDARMERIE and HAESEN network cabins. These
installations will facilitate the transfer of electricity by eliminating sec-
tions of cables with small cross-sections and will avoid voltage differ-
ences when switching from one injection point to another (MALVOIE/
ALLEUR). RESA laid 1,985 m of cables and decommissioned 849 m of
obsolete paper cables.
Improvement in the supply to part of the municipality of Oupeye
Medium voltage cables were installed to improve the supply to a part
of Oupeye from the HAUTS SARTS substation in Herstal (departing
form EMUBEL). These installations have also eliminated a medium volt-
age overhead line overhanging homes and gardens. RESA laid 3,390
m of cables, decommissioned 2,685 m of obsolete paper cables and
removed 420 m of overhead lines.
Improvement in the supply to part of the town of Hannut
Medium voltage cables were installed to improve the supply to part of
Hannut from the divisional cabin of HANNUT GARE at Hannut (depart-
ing from TALLEYRAND). These installations have also made it possible
to remove several cast iron terminals located in the cabins along the
installations as well as the removal of a dilapidated customer cabin in a
building. RESA laid 1,646 m of cables and decommissioned 1,888 m of
obsolete paper cables.
Removal of overhangs and overhead lines
In 2017, RESA devoted a part of its strategic investment to the burial
of several dilapidated overhead lines and the elimination of overhangs
in housing areas and wooded areas. The first project was in the munic-
ipality of Juprelle and the second was in the municipality of Aywaille.
These different cable layouts will make the customer's power supply
more reliable, and also improve network operation during repairs. For
these two projects, RESA laid 8,677 m of cables and removed 7,050 m
of overhead lines
RESA
- A
nnua
l Rep
ort 2
017
—31

Investments in the gas networkIn 2017, RESA invested more than €33 million in its gas net-
work, as follows:
NETWORK Gross investments [k EUR] %
LP 27,205 81.6%
MP 6,033 18.1%
OTHER 88 0.3%
TOTAL 33,326 100%
As every year, RESA has carried out several major oper-
ations on its natural gas distribution network, whether
renewals of lines, moves, extensions or technical closures,
but also setting up new gas cabins or their renewal.
Main projectsSite of renewals and moves Construction site at Seraing, rue du MolinayAs part of the Molinay district renovation project, RESA has proceeded with the renewal of 625m of low pressure pipelines and the connections of the network users in the area covered by the sanitation.
Construction site at Eupen Herbesthalerstrasse
As part of the SPW* development project from the main
street to Eupen city centre, RESA proceeded with the
renewal and relocation of 2400m of LP and MP pipelines.
This project was completed in 2017 after three separate
phases, the first of which started in 2015.
Extensions and technical closuresConstruction site at Stavelot, rue Basse-Levée
In order to secure Stavelot's network while under develop-
ment, RESA proceeded with the technical closure of two
network cabins. This looping required the installation of a
low pressure pipeline DN 160 over a length of 1200 m.
Construction site at Ivoz, Avenue Gonda - Seraing, Val Saint-Lambert
In 2017, RESA finalised the second phase of the 15 bar medium pressure project to supply a 15bar/5bar distribution station with a capacity of 30,000 Nm€/h from the new Fluxys station in Ivoz-Ramet. This installation totalled 2700m of DN200 pipes (including 1900m in 2017). This investment will increase the reinjection capacity to the MP network in the Seraing center but will also strengthen the left bank at Flémalle.
* SPW : Service Public de Wallonie - Public Service of Wallonia
New network and customer cabins A new network cabin was also built in 2017 as well as seven
cabins for customers:
Location AddressCabin Type
Capacity (Nm3/h)
Liège Rue Fusch5bar/20mbar network cabin
400
HerstalRue de l’Ecole Technique
Customer IPES Herstal
650
Oupeye TrilogiportCustomer DL
Trilogiport250
Eupen Rue HütteCustomer municipal
swimming pool100
BatticeRue des Gayettes
Customer Haver Belgium
250
Welkenraedt Chemin du DucCustomer
Dantresangle
SeraingRue Camille Lemonnier
Customer Ecole Fédé Wallonie-Bxl
School
LimburgQuai des Religieuses
Customer Ste-Claire School
100
RESA then proceeded with the renewal of six network cabins
Location AddressCabin Type
Capacity (Nm3/h)
Beyne-Heusay
Rue du Homvent 5bar/
20mbar1,500
LiègeRue Sainte-Walburge
5 bar/ 20 mbar
1,500
LiègeAngleur, Municipal park
5 bar/ 20 mbar
1,500
LiègeAngleur, rue Vaudrée
5 bar/ 100
mbar/20mbar2,500
LiègeSclessin, rue de la Centrale
5 bar/ 100 mbar
1,500
Huy Rue de Durbuy5 bar/
100 mbar750
Investments supportsIn 2017, RESA invested more than €8 million in computer
equipment and its buildings, as follows:
SUPPORT Gross investments [k EUR] %
Facility 3,465 64%
MV 1,911 36%
TOTAL 5,376 100%
RESA
- A
nnua
l Rep
ort 2
017
—32


4,000
3,500
3,000
2,500
2,000
1,500
1,000
500
02007 2012 2013 2014 2015 2016
IMO 1 (GWh)RESA (GWh)
2017
92.51%
6.47%
1.01%
ELIA DSO Exchange Local production
Origin of energy consumed in 2017Total annual energy of 3,601,562,941 kWh comes from:
Total energy consumed The distribution of consumed
energy, for all RESA networks,
is respectively as shown in the
adjacent table:
Energy drawnIn 2017, the energy demand for all RESA networks is
3,601,562,941 kWh.
On RESA's territory we see a drop of 0.94% on the collec-
tive volume, all customers included, in 2017 compared to
the year 2016.
The change in energy demand for the last eleven years for
all RESA customer appears as follows:
The Intermosane 1 part has been incorporated into the
RESA figures from June 2017.
Total energy having transited on our network in 2017 is
3,658,488,543 kWh.
RESA
- A
nnua
l Rep
ort 2
017
—34

2017 electricity figures
Energy consumed (kWh)
SECTOR 2017
ENERGY (kWh) DISTRIBUTION (%)
LOW VOLTAGE
Residential and non-residential uses 1,766,416,908 97.58
Street lighting 43,758,648 2.42
Total 1,810,175,557 53.34
MEDIUM VOLTAGE
Services 734,379,613 46.38
Industry 848,980,450 53.62
Total 1,583,360,062 46.66
OVERALL TOTAL 3,393,535,619 100.00
The annual basis of low voltage billing distributed throughout the year has meant that the globalisation of these energies
does not represent a calendar year, but rather a sliding year that begins in the middle of the previous year.
AIEG-RESA
INTEREST-RESA
IMO2-RESA
Local production
ELIA
0 kW
100,000
200,000
300,000
400,000
500,000
600,000
700,000667,241 kW
Maximum quarter-hourly powerOn the RESA territory including Liège city centre, the max-
imum quarter-hourly power for the year took place on
tuesday 18 January 2017.
On that date, the maximum power taken at 18:30 on our
network was 667,241 kW.
It is noteworthy that the maximum power for 2017 was
reached during the full-hour period.
Tuesday 18 January 2017:
RESA
- A
nnua
l Rep
ort 2
017
—35
T1 (0-5,000 kWh)
T2 (5,001-150,000 kWh)
T3 (150,001-1.000,000 kWh)
T4 (>1,000,000 kWh)
T5 (<10,000,000 kWh - AMR)
T6 (>10,000,000 kWh - AMR)
Rate
57.80 %
5.57 %
12.34 %
12.83 %
11.36 %
0.09 %
SRA Saint-George
SRA Verviers
SRAEst
Huy
SRA Liège
SRA Spime (Waremme)
SRA Trooz
SRA Villers-le-Bouillet
SRA Amay
SRA Andenne
SRA Engis
SRA Hannut
SRA Hermalle-sous-HuySRA Huy
SRA Ivoz-Ramet
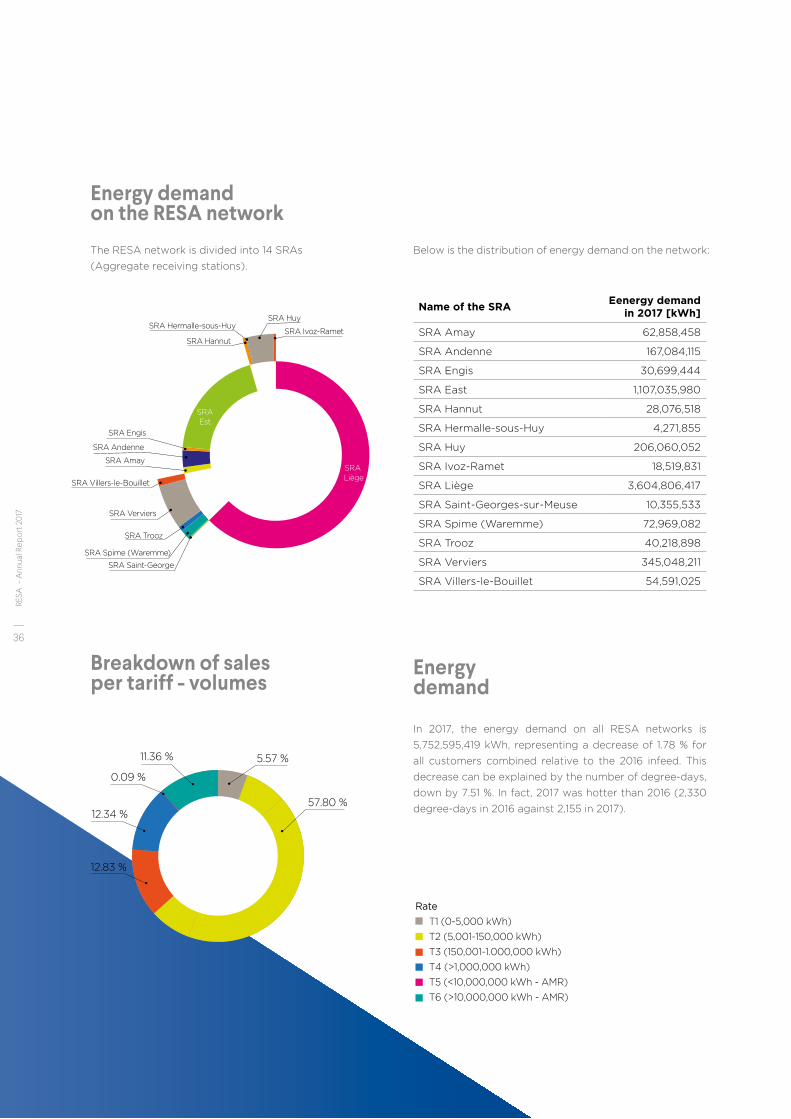
Energy demand on the RESA networkThe RESA network is divided into 14 SRAs
(Aggregate receiving stations).
Energy demand
In 2017, the energy demand on all RESA networks is
5,752,595,419 kWh, representing a decrease of 1.78 % for
all customers combined relative to the 2016 infeed. This
decrease can be explained by the number of degree-days,
down by 7.51 %. In fact, 2017 was hotter than 2016 (2,330
degree-days in 2016 against 2,155 in 2017).
Breakdown of sales per tariff - volumes
Below is the distribution of energy demand on the network:
Name of the SRAEenergy demand
in 2017 [kWh]
SRA Amay 62,858,458
SRA Andenne 167,084,115
SRA Engis 30,699,444
SRA East 1,107,035,980
SRA Hannut 28,076,518
SRA Hermalle-sous-Huy 4,271,855
SRA Huy 206,060,052
SRA Ivoz-Ramet 18,519,831
SRA Liège 3,604,806,417
SRA Saint-Georges-sur-Meuse 10,355,533
SRA Spime (Waremme) 72,969,082
SRA Trooz 40,218,898
SRA Verviers 345,048,211
SRA Villers-le-Bouillet 54,591,025
T1 (0-5,000 kWh)
T2 (5,001-150,000 kWh)
T3 (150,001-1.000,000 kWh)
T4 (>1,000,000 kWh)
T5 (<10,000,000 kWh - AMR)
T6 (>10,000,000 kWh - AMR)
Rate
57.80 %
5.57 %
12.34 %
12.83 %
11.36 %
0.09 %
RESA
- A
nnua
l Rep
ort 2
017
—36

1,000,000,000
0 kWh
2007 2012 2013 2014 2015 2016
2,000,000,000
3,000,000,000
4,000,000,000
5,000,000,000
6,000,000,000
7,000,000,000
2017
100,000,000
0 kWh
200,000,000
300,000,000
400,000,000
500,000,000
600,000,000
700,000,000
800,000,000
Jan Feb Mar Apr May June Jul Aug Sept Oct Nov Dec
900,000,000
1,000,000,000
500
0 2007 2012 2013 2014 2015 2016
1,000
1,500
2,000
2,500
3,000
Degrees-days 2017
100
0
200
300
400
Degrees-days
500
Jan Feb Mar Apr May June Jul Aug Sept Oct Nov Dec
The "degree-days" chart gives a picture of the temperature and therefore the average needs profile in heating a home. It
should be noted with regard to gas, that monthly or annual energy is strongly connected to it.
Below, the energy demand per month by 2017 with the total number of corresponding degree days.
The coldest period of the year is in January - February and November - December.
* Degree-days are a criterion for assessing the cold for a given period. To calculate equivalent degree days in Belgium, it is necessary to
first know the equivalent temperatures.
500,000
0
1,000,000
1,500,000
2,000,000
2,500,000
3,000,000
3,500,000
01/
01/
20
17
01/
02/2
017
01/
03/2
017
01/
04
/20
17
01/
05
/20
17
01/
06
/20
17
01/
07/2
017
01/
08
/20
17
01/
09
/20
17
01/
10/2
017
01/
11/2
017
01/
12/2
017m3(n)/day
Hourly volume
In 2017, the coldest day was 18/01/2017 (-3 degrees Celsius, which is equivalent to 19 degree days as this is the
number of degrees below a mean 16.5 degrees on a day measured in Uccle) with consumption on the day of
3,733,433 Nm3 including an hourly peak at 7:00 am of 192,646 Nm3 .
Below are the hourly volumes input into the system in 2017 (in Nm³).
2017 gas figures
RESA
- A
nnua
l Rep
ort 2
017
—37


5.1. Balance sheetafter appropriation 2017 (in thousands of euros)
ASSETS Codes Period 2017 Period 2016
FORMATION EXPENSES 20
FIXED ASSETS 21/28 1,326,331 1,303,877
I. Intangible fixed assets 21 19,158 21,307
II. Tangible fixed assets 22/27 1,307,080 1,282,472
A. Land and buildings 22 41,082 41,334
B. Plant, machinery and equipment 23 1,203,323 1,160,880
C. Furniture and vehicles 24 8,399 6,461
D. Leasing and other rights 25 1,388 1,446
E. Other tangible fixed assets 26
F. Tangible assets under construction and advance payments made
27 52,888 72,351
III. Financial fixed assets 28 93 98
A. Affiliated enterprises 280/1
1. Participating interests 280
2. Amounts receivable 281
B. Other enterprises linked by participating interests 282/3 88 88
1. Participating interests 282 88 88
2. Amounts receivable 283
C. Other financial assets 284/8 5 10
1. Shares 284 4
2. Amounts receivable and cash guarantees 285/8 5 6
CURRENT ASSETS 29/58 157,352 163,503IV. Amounts receivable after more than one year 29
A. Trade debtors 290
B. Other amounts receivable 291
V. Stocks and contracts in progress 3 14,356 13,511
A. Stocks 30/36 13,886 13,940
1. Raw materials and consumables 30/31 13,736 13,790
2. Work in progress 32 150 150
3. Finished goods 33
4. Goods purchased for resale 34
5. Immovable property intended for sale 35
6. Advance payments 36
B. Contracts in progress 37 470 454
VI. Amounts receivable within one year 40/41 82,988 90,937
A. Trade debtors 40 79,922 74,172
B. Other amounts receivable 41 3,066 16,765
VII. Current investments 50/53
A. Own shares 50
B. Other investments and deposits 51/53
VIII. Cash at bank and in hand 54/58 36,704 42,594IX. Deferred charges and accrued income 490/1 23,304 15,578
TOTAL ASSETS 20/58 1,483,683 1,467,380
RESA
- A
nnua
l Rep
ort 2
017
—40

5.1. Balance sheetafter appropriation 2017 (in thousands of euros)
EQUITY AND LIABILITIES Codes Period 2017 Period 2016
EQUITY 10/15 702,357 681,041I. Capital 10 657,880 657,880
A. Issued capital 100 657,880 657,880
B. Uncalled capital * 101
II. Share premium account 11III. Revaluation surpluses 12IV. Reserves 13 8,310 5,763
A. Legal reserve 130 8,310 5,763
B. Reserves not available 131
1. In respect of own shares held 1310
2. Others 1311
C. Untaxed reserves 132
D. Available reserves 133
V. Accumulated profits (losses) (+) / (-) 14 33,334 15,507VI. Investment grants 15 2,833 1,891VII. Advance to associates on the sharing
out of the assets **
19
PROVISIONS AND DEFERRED TAXES 16 7,858 7,890VIII. Provisions for liabilities and charges 160/5 7,858 7,890
A. Pensions and similar obligations 160
B. Taxation 161
C. Major repairs and maintenance 162 17
D. Environmental liabilities 163E. Other risks and costs 164/5 7,858 7,873
IX. Deferred taxes 168
AMOUNTS PAYABLE 17/49 773,468 778,449X. Amounts payable after more than one year 17 545,016 567,870
A. Financial debts 170/4 545,016 567,870
1. Subordinated loans 170
2. Unsubordinated debentures 171 500,000 515,000
3. Leasing and other similar obligations 172 33 100
4. Credit institutions 173 44,983 52,770
5. Other loans 174
B. Trade debts 175
1. Suppliers 1750
2. Bills of exchange payable 1751
C. Advances received on contracts in progress 176
D. Other amounts payable 178/9
XI. Amounts payable within one year 42/48 182,680 171,540A. Current portion of amounts payable after more than
one year falling due within one year42 22,853 7,962
B. Financial debts 43 1
1. Credit institutions 430/8
2. Other loans 439 1
C. Trade debts 44 80,280 74,986
1. Suppliers 440/4 80,280 74,986
2. Bills of exchange payable 441
D. Advances received on contracts in progress 46 21,350 19,569
E. Taxes, remuneration and social security 45 23,870 34,451
1. Taxes 450/3 23,870 34,451
2. Remuneration and social security 454/9
F. Other amounts payable 47/48 34,327 34,571
XII. Accrued charges and deferred income 492/3 45,772 39,039
TOTAL LIABILITIES 10/49 1,483,683 1,467,380
* Amount to be deducted from the issued capital.** Amount to be deducted from the other components of equity.
RESA
- A
nnua
l Rep
ort 2
017
—41

5.2. Income statementon 31 décembre 2017 (in thousands of euros)
Codes Period 2017 Period 2016
I. Operating income and charges 70/76A 352,629 337,629
A. Turnover 70 279,958 263,057
B. �Increase�(decrease)�in�stocks�of�finished�goods,� work�and�contracts�in�progress�(+)�/�(-)
71 16 218
C. Own construction capitalised 72 67,925 64,059
D. Other�operating�income 74 3,936 9,644
E. Non-recurring�operating�income 76A 794 651
II. Operating charges 60/66A 267,820 264,199
A. Raw�materials,�consumables 60 36,743 34,400
1. Purchases 600/8 36,711 35,065
2. Decrease�(increase)�in�stocks�(+)�/�(-) 609 32 -665
B. Services�and�other�goods 61 163,101 157,360
C. �Remuneration,�social�security�costs� and�pensions�(+)�/�(-)
62
D. �Depreciation�of�and�amounts�written�off�formation expenses,�intangible�and�tangible�fixed�assets
630 44,172 44,017
E. �Increase,�Decrease�in�amounts�written�off�stocks�con-tracts�in�progress�and�trade�debtors:�Appropriations�(write-backs)�(+)�/�(-)
631/4 929 -185
F. �Provisions�for�risks�and�charges�-�Appropriations�(uses�and�write-backs)�(+)�/�(-)
635/8 -32 -46
G. Other�operating�charges 640/8 22,007 26,946
H. �Operation�charges�carried�to�assets�as�restructuring�costs�(-)
649
I. Non-recurring�operating�charges 66A 900 1,707
III. Operating profit (loss) 9901 84,809 73,430
RESA
- A
nnua
l Rep
ort 2
017
—42

Codes Period 2017 Period 2016
I. Financial income 75/76B 95 62
A. Recurring financial income 75 95 62
1. Income from financial fixed assets 750
2. Income from current assets 751 26 8
3. Other financial income 752/9 69 54
B. Non-recurring financial income 76B
II. Financial charges 65/66B 8,879 12,319
A. Recurring financial charges 65 8,879 12,319
1. Debt charges 650 8,819 11,158
2. Amounts written down on current assets except stocks, contracts in progress and trade debtors (+) / (-)
651
3. Other financial charges 652/9 60 1,161
B. Non recurring financial charges 66B
III. �Profit�(loss)�for�the�period�before�taxes�(+)�/�(-) 9903 76,025 61,173
IV. Transfer�from�postponed�taxes 780
V. Transfer�to�postponed�taxes 680
VI. Income taxes (+) / (-) 67/77 25,092 16,866
A. Income taxes 670/3 25,342 17,351
B. Adjustment of income taxes and write-back of tax provisions
77 250 485
VII. Profit�(loss)�for�the�period�(+)�/�(-) 9904 50,933 44,307
VIII. �Transfer�from�untaxed�reserves 789
IX. Transfer�to�untaxed�reserves 689X. �Profit�(loss)�for�the�period�available� for�appropriation�(+)�/�(-)
9905 50,933 44,307
RESA
- A
nnua
l Rep
ort 2
017
—43

5.3. Appropriation account (in thousands of euros)
Codes Period 2017 Period 2016
I. Profit (loss) to be appropriated (+) / (-) 9906 66,440 44,307
A. Gain (loss) to be appropriated (+) / (-) (9905) 50,933 44,307
B. Profit (loss) to be carried forward (+) / (-) 14P 15,507
II. Transfers from capital and reserves 791/2
A. from capital and share premium account 791
B. from reserves 792
III. Transfers to capital and reserves 691/2 2,546 2,216
A. to capital and share premium account 691
B. to the legal reserve 6920 2,546 2,216
C. to other reserves 6921
IV. Profit (loss) to be carried forward (+) / (-) (14) 33,334 15,507
V. Owner’s contribution in respect of losses 794
VI. Profit to be distributed 694/7 30,560 26,584
A. Dividends 694 30,560 26,584
B. Director’s or managers’ entitlements 695
C. Workers 696
D. Other beneficiaries 697
RESA
- A
nnua
l Rep
ort 2
017
—44

STATEMENT OF INTANGIBLE FIXED ASSETS
DEVELOPMENT COSTS Codes Period 2017 Period 2016
I. Acquisition value at the end of the period 8051P 64
II. Movements during the period
A. Acquisitions, including produced fixed assets 8021
B. Sales and disposals 8031
C. Transfers from one heading to another (+) / (-) 8041
III. Acquisition value at the end of the period 8051 64IV. Depreciation and amounts written down
at the end of the period8121P 64
V. Movements during the period
A. Recorded 8071
B. Written back 8081
C. Acquisitions from third parties 8091
D. Cancelled owing to sales and disposals 8101
E. Transfers from one heading to another (+) / (-) 8111VI. Depreciation and amounts written down
at the end of the period8121 64
NET BOOK VALUE AT THE END OF THE PERIOD 81311
CONCESSIONS, PATENTS, LICENCES, KNOWHOW, BRANDS AND SIMILAR RIGHTS
Codes Period 2017 Period 2016
I. Acquisition value at the end of the period 8052P 42,293
II. Movements during the period
A. Acquisitions, including produced fixed assets 8022 648
B. Sales and disposals 8032
C. Transfers from one heading to another (+) / (-) 8042 17
III. Acquisition value at the end of the period 8052 42,958
IV. Depreciation and amounts written down at the end of the period
8122P 30,482
V. Movements during the period
A. Recorded 8072 3,361
B. Written back 8082
C. Acquisitions from third parties 8092
D. Cancelled owing to sales and disposals 8102
E. Transfers from one heading to another (+) / (-) 8112
VI. Depreciation and amounts written down at the end of the period
8122 33,843
NET BOOK VALUE AT THE END OF THE PERIOD 211 9,115
5.4. Appendicesto the annual accounts (in thousands of euros)
RESA
- A
nnua
l Rep
ort 2
017
—45

GOODWILL Codes Period 2017 Period 2016
I. Acquisition value at the end of the period 8053P 6,609
II. Movements during the period
A. Acquisitions, including produced fixed assets 8023
B. Sales and disposals 8033
C. Transfers from one heading to another(+) / (-) 8043
III. Acquisition value at the end of the period 8053 6,609IV. Depreciation and amounts written down
at the end of the period8123P 2,600
V. Movements during the period
A. Recorded 8073 650
B. Written back 8083
C. Acquisitions from third parties 8093
D. Cancelled owing to sales and disposals 8103
E. Transfers from one heading to another (+) / (-) 8113
VI. Depreciation and amounts written down at the end of the period
8123 3,250
NET BOOK VALUE AT THE END OF THE PERIOD 212 3,359
ADVANCE PAYMENTS Codes Period 2017 Period 2016
I. Acquisition value at the end of the period 8054P 5,487
II. Movements during the period
A. Acquisitions, including produced fixed assets 8024 1,214
B. Sales and disposals 8034
C. Transfers from one heading to another (+) / (-) 8044 -17
III. Acquisition value at the end of the period 8054 6,684IV. Depreciation and amounts written down
at the end of the period8124P
V. Movements during the period
A. Recorded 8074
B. Written back 8084
C. Acquisitions from third parties 8094
D. Cancelled owing to sales and disposals 8104
E. Transfers from one heading to another (+) / (-) 8114
VI. Depreciation and amounts written down at the end of the period
8124
NET BOOK VALUE AT THE END OF THE PERIOD 213 6,684
RESA
- A
nnua
l Rep
ort 2
017
—46

ADVANCE PAYMENTS Codes Period 2017 Period 2016
I. Acquisition value at the end of the period 8054P 5,487
II. Movements during the period
A. Acquisitions, including produced fixed assets 8024 1,214
B. Sales and disposals 8034
C. Transfers from one heading to another (+) / (-) 8044 -17
III. Acquisition value at the end of the period 8054 6,684IV. Depreciation and amounts written down
at the end of the period8124P
V. Movements during the period
A. Recorded 8074
B. Written back 8084
C. Acquisitions from third parties 8094
D. Cancelled owing to sales and disposals 8104
E. Transfers from one heading to another (+) / (-) 8114
VI. Depreciation and amounts written down at the end of the period
8124
NET BOOK VALUE AT THE END OF THE PERIOD 213 6,684
STATEMENT OF TANGIBLE FIXED ASSETS
LAND AND BUILDINGS Codes Period 2017 Period 2016
I. Acquisition value at the end of the period 8191P 71,874
II. Movements during the period
A. Acquisitions, including produced fixed assets 8161 1,272
B. Sales and disposals 8171 546
C. Transfers from one heading to another (+) / (-) 8181 89
III. Acquisition value at the end of the period 8191 72,689
IV. Revaluation surpluses at the end of the period 8251P 6,731
V. Movements during the period
A. Recorded 8211
B. Acquisitions from third parties 8221
C. Cancelled 8231 28
D. Transfers from one heading to another (+) / (-) 8241
VI. Revaluation surpluses at the end of the period 8251 6,703
VII. Depreciation and amounts written down at the end of the period
8321P 37,272
VIII. Movements during the period
A. Recorded 8271 1,268
B. Written back 8281
C. Acquisitions from third parties 8291
D. Cancelled owing to sales and disposals 8301 230
E. Transfers from one heading to another (+) / (-) 8311IX. Depreciation and amounts written down
at the end of the period8321 38,310
NET BOOK VALUE AT THE END OF THE PERIOD (22) 41,082
RESA
- A
nnua
l Rep
ort 2
017
—47

PLANT, MACHINERY AND EQUIPMENT Codes Period 2017 Period 2016
I. Acquisition value at the end of the period 8192P 1,520,854
II. Movements during the period
A. Acquisitions, including produced fixed assets 8162 27,470
B. Sales and disposals 8172 1,777
C. Transfers from one heading to another (+) / (-) 8182 52,738
III. Acquisition value at the end of the period 8192 1,599,285
IV. Revaluation surpluses at the end of the period 8252P 499,713
V. Movements during the period
A. Recorded 8212
B. Acquisitions from third parties 8222
C. Cancelled 8232 482
D. Transfers from one heading to another (+) / (-) 8242
VI. Revaluation surpluses at the end of the period 8252 499,231
VII. Depreciation and amounts written down at the end of the period
8322P 859,688
VIII. Movements during the period
A. Recorded 8272 36,866
B. Written back 8282
C. Acquisitions from third parties 8292
D. Cancelled owing to sales and disposals 8302 1,360
E. Transfers from one heading to another (+) / (-) 8312
IX. Depreciation and amounts written down at the end of the period
8322 895,194
NET BOOK VALUE AT THE END OF THE PERIOD (23) 1,203,322
FURNITURE AND VEHICLES Codes Period 2017 Period 2016
I. Acquisition value at the end of the period 8193P 31,121
II. Movements during the period
A. Acquisitions, including produced fixed assets 8163 2,166
B. Sales and disposals 8173 4,970
C. Transfers from one heading to another (+) / (-) 8183 1,791
III. Acquisition value at the end of the period 8193 30,108
IV. Revaluation surpluses at the end of the period 8253P 597
V. Movements during the period
A. Recorded 8213
B. Acquisitions from third parties 8223
C. Cancelled 8233 51
D. Transfers from one heading to another (+) / (-) 8243
VI. Revaluation surpluses at the end of the period 8253 546
VII. Depreciation and amounts written down at the end of the period
8323P 25,257
VIII. Movements during the period
A. Recorded 8273 1,970
B. Written back 8283
C. Acquisitions from third parties 8293
D. Cancelled owing to sales and disposals 8303 4,972
E. Transfers from one heading to another (+) / (-) 8313
IX. Depreciation and amounts written down at the end of the period
8323 22,255
NET BOOK VALUE AT THE END OF THE PERIOD (24) 8,399
RESA
- A
nnua
l Rep
ort 2
017
—48

LEASING AND SIMILAR RIGHTS Codes Period 2017 Period 2016
I. Acquisition value at the end of the period 8194P 1,908
II. Movements during the period
A. Acquisitions, including produced fixed assets 8164
B. Sales and disposals 8174
C. Transfers from one heading to another (+) / (-) 8184
III. Acquisition value at the end of the period 8194 1,908
IV. Revaluation surpluses at the end of the period 8254P
V. Movements during the period
A. Recorded 8214
B. Acquisitions from third parties 8224
C. Cancelled 8234
D. Transfers from one heading to another (+) / (-) 8244
VI. Revaluation surpluses at the end of the period 8254
VII. Depreciation and amounts written down at the end of the period 8324P 462
VIII. Movements during the period
A. Recorded 8274 58
B. Written back 8284
C. Acquisitions from third parties 8294
D. Cancelled owing to sales and disposals 8304
E. Transfers from one heading to another(+) / (-) 8314
IX. Depreciation and amounts written down at the end of the period 8324 520
NET BOOK VALUE AT THE END OF THE PERIOD (25) 1,388
WHEREOF
A. Land and buildings 250 1,388
B. Plant, machinery and equipment 251
C. Furniture and vehicles 252
ASSETS UNDER CONSTRUCTION AND ADVANCED PAYMENTS
Codes Period 2017 Period 2016
I. Acquisition value at the end of the period 8196P 72,351
II. Movements during the period
A. Acquisitions, including produced fixed assets 8166 35,155
B. Sales and disposals 8176
C. Transfers from one heading to another (+) / (-) 8186 -54,618
III. Acquisition value at the end of the period 8196 52,888
IV. Revaluation surpluses at the end of the period 8256P
V. Movements during the period
A. Recorded 8216
B. Acquisitions from third parties 8226
C. Cancelled 8236
D. Transfers from one heading to another (+) / (-) 8246
VI. Revaluation surpluses at the end of the period 8256
VII. Depreciation and amounts written down at the end of the period 8326P
VIII. Movements during the period
A. Recorded 8276
B. Written back 8286
C. Acquisitions from third parties 8296
D. Cancelled owing to sales and disposals 8306
E. Transfers from one heading to another (+) / (-) 8316
IX. Depreciation and amounts written down at the end of the period 8326
NET BOOK VALUE AT THE END OF THE PERIOD (27) 52,888
RESA
- A
nnua
l Rep
ort 2
017
—49

ENTERPRISES LINKED BY A PARTICIPATING INTEREST - PARTICIPATING INTERESTS AND SHARES
Codes Period 2017 Period 2016
I. Acquisition value at the end of the period 8392P 117
II. Movements during the period
A. Acquisitions, including produced fixed assets 8362
B. Sales and disposals 8372
C. Transfers from one heading to another (+) / (-) 8382
III. Acquisition value at the end of the period 8392 117
IV. Revaluation surpluses at the end of the period 8452P
V. Movements during the period
A. Recorded 8412
B. Acquisitions from third parties 8422
C. Cancelled 8432
D. Transfers from one heading to another (+) / (-) 8442
VI. Revaluation surpluses at the end of the period 8452
VII. Amounts written down at the end of the period 8522P
VIII. Movements during the period
A. Recorded 8472
B. Written back 8482
C. Acquisitions from third parties 8492
D. Cancelled owing to sales and disposals 8502
E. Transfers from one heading to another (+) / (-) 8512
IX. Amounts written down at the end of the period 8522
X. Uncalled amounts at the end of the period 8552P 29
XI. Movements during the period (+) / (-) 8542
XII. Uncalled amounts at the end of the period 8552 29
NET BOOK VALUE AT THE END OF THE PERIOD (282) 88RESA
- A
nnua
l Rep
ort 2
017
—50

OTHER ENTERPRISES - PARTICIPATING INTERESTS AND SHARES
Codes Period 2017 Period 2016
I. Acquisition value at the end of the period 8393P 4
II. Movements during the period
A. Acquisitions, including produced fixed assets 8363
B. Sales and disposals 8373 4
C. Transfers from one heading to another (+) / (-) 8383
III. Acquisition value at the end of the period 8393
IV. Revaluation surpluses at the end of the period 8453P
V. Movements during the period
A. Recorded 8413
B. Acquisitions from third parties 8423
C. Cancelled 8433
D. Transfers from one heading to another (+) / (-) 8443
VI. Revaluation surpluses at the end of the period 8453
VII. Amounts written down at the end of the period 8523P
VIII. Movements during the period
A. Recorded 8473
B. Written back 8483
C. Acquisitions from third parties 8493
D. Cancelled owing to sales and disposals 8503
E. Transfers from one heading to another (+) / (-) 8513
IX. Amounts written down at the end of the period 8523
X. Uncalled amounts at the end of the period 8553P
XI. Movements during the period (+) / (-) 8543
XII. Uncalled amounts at the end of the period 8553
NET BOOK VALUE AT THE END OF THE PERIOD (284)
OTHER ENTERPRISES - AMOUNTS RECEIVABLE Codes Period 2017 Period 2016
NET BOOK VALUE AT THE END OF THE PERIOD 285/8P 6
I. Movements during the period
A. Additions 8583
B. Repayments 8593 1
C. Amounts written down 8603
D. Amounts written back 8613
E. Exchange differences (+) / (-) 8623
F. Other (+) / (-) 8633
NET BOOK VALUE AT THE END OF THE PERIOD (285/8) 5
ACCUMULATED AMOUNTS WRITTEN OFF ON AMOUNTSRECEIVABLE AT THE END OF THE PERIOD
8653
RESA
- A
nnua
l Rep
ort 2
017
—51

INFORMATION RELATING TO THE SHARE IN THE CAPITAL
SHARE IN THE CAPITAL AND OTHER RIGHTS IN OTHER COMPANIES
List of both enterprises in which the enterprise holds a participating interest (recorded in the headings 280 and 282 of assets) and other enterprises in which the enterprise holds rights (recorded in the headings 284 and 51/53 of asset in the amount of at least 10% of the capital issued.
NAME, full address of the REGISTERED OFFICE and for the enterprise governedby Belgian law, the COMPANY NUMBER
SHARES HELD BYINFORMATION FROM THE MOST
RECENT PERIOD FOR WHICH ANNUAL ACCOUNTS ARE AVAILABLE
directly subsidiaries Primaryfinancial
statement :
Monetaryunit
Capital and reserves
Net result
Number % % (+) of (-) (in units)
ATRIAS SCRLGalerie Ravenstein 4 , box 2 1000 Brussel 1 Belgium0836.258.873Part sociale 58 15.59 0.00
31/12/2016 EUR 18,600 0
INTER-REGIES SCRL Royale 55, box 10, 1000 Brussel 1 Belgium 0207.622.758Part sociale 4,591 26.07 0.00
31/12/2016 EUR 1,132,366 17,210
RESA
- A
nnua
l Rep
ort 2
017
—52

DEFFERED CHARGES AND ACCRUED INCOME Period 2017
�Allocation�of�heading�490/1�of�assets�if�the�amount�is�significant.
Other expenses to be carried forward 11,061
Other products acquired 12,243
OTHER INVESTMENTS AND DEPOSIT, DEFFERED CHARGES AND ACCRUED INCOME (ASSETS)
STATEMENT OF CAPITAL AND SHAREHOLDING STRUCTURE
PROVISIONS FOR OTHER LIABILITIES AND CHARGES
Period 2017
Analysis of the heading 164/5 of liabilities if the amount is significant
1. Provisions for other liabilities and charges 7,858
STATEMENT OF CAPITAL Codes Period 2017 Period 2016
I. Social capital
A. Issued capital at the end of the period 100P 657,880
B. Issued capital at the end of the period (100) 657,880
Montants Nombre d’actions
C. Changes during the period
D. Structure of the capital
E. Different categories of shares
1. Registered shares 657,880 9,063,477
F. Registered shares 8702 9,063,477
G. Shares dematerialized 8703
RESA
- A
nnua
l Rep
ort 2
017
—53

Codes Period 2017
BREAKDOWN OF AMOUNTS PAYABLE WITH AN ORIGINAL PERIOD TO MATURITY OF MORE THAN ONE YEAR, ACCORDING TO THEIR RESIDUAL TERMI. Current portion of amounts payable after more than one year fallin due within one year
A. Financial debts 8801 22,853
1. Subordinated loans 8811
2. Unsubordinated debentures 8821 15,000
3. Leasing and other similar obligations 8831 66
4. Credit institutions 8841 7,787
5. Other loans 8851
B. Trade debts 8861
1. Suppliers 8871
2. Bills of exchange payable 8881
C. Advance payments received on contracts in progress 8891
D. Other amounts payable 8901
TOTAL AMOUNTS PAYABLE AFTER MORE THAN ONE YEAR, NOT MORE THAN ONE YEAR
(42) 22,853
II. Amounts payable after more than one year, between one and five years
A. Financial debts 8802 26,726
1. Subordinated loans 8812
2. Unsubordinated debentures 8822
3. Leasing and other similar obligations 8832 33
4. Credit institutions 8842 26,693
5. Other loans 8852
B. Trade debts 8862
1. Suppliers 8872
2. Bills of exchange payable 8882
C. Advance payments received on contracts in progress 8892
D. Other amounts payable 8902
TOTAL AMOUNTS PAYABLE AFTER MORE THAN ONE YEAR, BETWEEN ONE AND FIVE YEARS
8912 26,726
III. Amounts payable after more than one year, over five years
A. Financial debts 8803 518,290
1. Subordinated loans 8813
2. Unsubordinated debentures 8823 500,000
3. Leasing and other similar obligations 8833
4. Credit institutions 8843 18,290
5. Other loans 8853
B. Trade debts 8863
1. Suppliers 8873
2. Bills of exchange payable 8883
C. Advance payments received on contracts in progress 8893
D. Other amounts payable 8903
TOTAL AMOUNTS PAYABLE AFTER MORE THAN ONE YEAR, OVER FIVE YEARS 8913 518,290
STATEMENT OF AMOUNTS PAYABLE, ACCRUED CHARGES AND DEFERRED INCOME
RESA
- A
nnua
l Rep
ort 2
017
—54

AMOUNTS PAYABLE GUARANTEED (headings 17 and 42/48 of liabilities) Codes Period 2017
I. Amounts payable guaranteed by Belgian public authorities
A. Financial debts 8921 34,164
1. Subordinated loans 8931
2. Unsubordinated debentures 8941
3. Leasing and other similar obligations 8951
4. Credit institutions 8961 34,164
5. Other loans 8971
B. Trade debts 8981
1. Suppliers 8991
2. Bills of exchange payable 9001
C. Advance payments received on contracts in progress 9011
D. Remuneration and social security 9021
E. Other amounts payable 9051
TOTAL AMOUNTS PAYABLE GUARANTEED BY BELGIAN PUBLIC AUTHORITIES 9061 34,164
AMOUNTS PAYABLE FOR TAXES, REMUNERATION AND SOCIAL SECURITY
I. Taxes (headings 450/3 and 178/9 of the liabilities)
A. Expired taxes payable 9072
B. Non expired taxes payable 9073 15,030
C. Estimated taxes payable 450 8,840
II. Remuneration and social security (headings 454/9 and 178/9 of the liabilities)
A. Amount due to the National Office of Social Security 9076
B. Other amounts payable relating to remuneration and social security 9077
ACCRUED CHARGES AND DEFERRED INCOME
Allocation of heading 492/3 of liabilities if the amount is significant
1. Other charges to be charged 18,243
2. Other products to carry forward 27,529
RESA
- A
nnua
l Rep
ort 2
017
—55

OPERATING RESULTS
Codes Period 2017 Period 2016
OPERATING INCOME
I. Net turnover
A. Broken down by categories of activity
1. Turnover 279,957 263,057
B. Allocation into geographical markets
II. Other operating income
A. Operating subsidies and compensatory amounts received from public authorities
740 247 66
OPERATING COSTS
III. Employees for whom the company has submitted a DIMONA declaration or are recorded in the general personnel register
A. Total number at the closing date 9086
B. Average number of employees calculated in full-time equivalents 9087
C. Number of actual worked hours 9088
IV. Personnel costs
A. Remuneration and direct social benefits 620
B. Employers’ social security contributions 621
C. Employers’ premiums for extra statutory insurances 622
D. Other personnel costs 623
E. Old-age and widows’ pensions 624
V. Provisions for pensions
A. Additions (uses and write-back) (+)/(-) 635
VI. Amounts written off
A. Stocks and contracts in progress
1. Recorded 9110 21
2. Written back 9111
B. Trade debtors
1. Recorded 9112 6,178 1,976
2. Written back 9113 5,270 2,161
VII. Provisions for risks and charges
A. Additions 9115
B. Uses and write-back 9116 32 46
VIII. Other operating charges
A. Taxes related to operation 640 442 539
B. Other charges 641/8 21,565 26,407
IX. Hired temporary staff and persons placed at the enterprise’s disposal
A. Total number at the closing date 9096
B. Average number calculated as full-time equivalents 9097
C. Number of actual worked hours 9098 27
D. Charges to the enterprise 617
RESA
- A
nnua
l Rep
ort 2
017
—56

Codes Period 2017 Period 2016
RECURRING FINANCIAL INCOME
I. Other financial income
A. Subsidies granted by public authorities and recorded as income for the period
1. Capital subsidies 9125 57 43
2. Interest subsidies 9126
B. Allocation of other financial income
1. Other financial income 13 10
II. RECURRING FINANCIAL CHARGES
III. Depreciation of loan issue expenses 6501 3,618
IV. Capitalized Interests 6503
V. Amounts written off current assets
A. Recorded 6510
B. Written back 6511
VI. Other financial charges
A. Amount of the discount borne by the enterprise, as a result of negotiating amounts receivable
653
VII. Provisions of a financial nature
A. Appropriations 6560
B. Uses and write-backs 6561
VIII. Allocation of other financial charges
A. Other financial charges 59 1,161
FINANCIAL RESULTS
RESA
- A
nnua
l Rep
ort 2
017
—57

Codes Period 2017 Period 2016
NON-RECURRING INCOME 76 794 651
I. Non-recurring operating income (76A) 794 651
A. Write-back of depreciation and of amounts written off intangible and tangible fixed assets
760
B. Write-back of provisions for extraordinary operating liabilities and charges
7620
C. Capital gains on disposal of intangible and tangible fixed asset 7630 764
D. Other non-recurring operating income 764/8 30 651
II. Non-recurring financial income (76B)
A. Write-back of amounts written down financial fixed assets 761
B. Write-back of provisions for extraordinary financial liabilities and charges
7621
C. Capital gains on disposal of financial fixed assets 7631
D. Other non-recurring financial income 769
NON-RECURRING EXPENSES 66 900 1,707
III. Non-recurring operating charges (66A) 900 1,707
A. Non-recurring depreciation of and amounts written off formation expenses, intangible and tangible fixed assets
660
B. Provisions for extraordinary operating liabilities and charges: Appropriations (uses)(+)/(-)
6620
C. Capital losses on disposal of intangible and tangible fixed assets
6630 900 1,707
D. Other non-recurring operating charges 664/7
E. Non-recurring operating charges carried to assets as restructuring costs (-)
6690
IV. Non-recurring financial charges (66B)
A. Amounts written off financial fixed assets 661
B. Provisions for extraordinary financial liabilities and charges - Appropriations (uses) (+)/(-)
6621
C. Capital losses on disposal of financial fixed assets 6631
D. Other non-recurring financial charges 668
E. Non-recurring financial charges carried to assets as restructur-ing costs (-)
6691
INCOME AND CHARGES OF EXCEPTIONNAL SIZE OR INCIDENCE
RESA
- A
nnua
l Rep
ort 2
017
—58

CORPORATE INCOME TAXES Codes Period 2017
I. Income taxes on the result of the period 9134 25,342
A. Income taxes paid and withholding taxes due or paid 9135 25,342
B. Excess of income tax prepayments and withholding taxes paid recorded under assets 9136
C. Estimated additional taxes 9137
II. Income taxes on the result of prior periods 9138
A. Additional income taxes due or paid 9139
B. Additional income taxes estimated or provided for 9140
III. In so far as taxes of the period are materially affected by differences between the profit before taxes as stated in annual accounts and the estimated taxable profit
A. Deduction for at-risk capital -1,609
B. Taxable provisions -32
C. Reduction of taxable values44 -585
D. Expenses not allowed 3
CORPORATE INCOME TAXES AND OTHER TAXES
VALUE ADDED TAXES AND OTHER TAXES BORNE BY THIRD PARTIES
Codes Period 2017 Period 2016
I. Value added taxes charged
A. To the enterprise (deductible) 9145 70,917 64,511
B. By the enterprise 9146 112,714 106,211
II. Amounts withheld on behalf of third party
A. For payroll withholding taxes 9147
B. For withholding taxes on investment income 9148
RESA
- A
nnua
l Rep
ort 2
017
—59
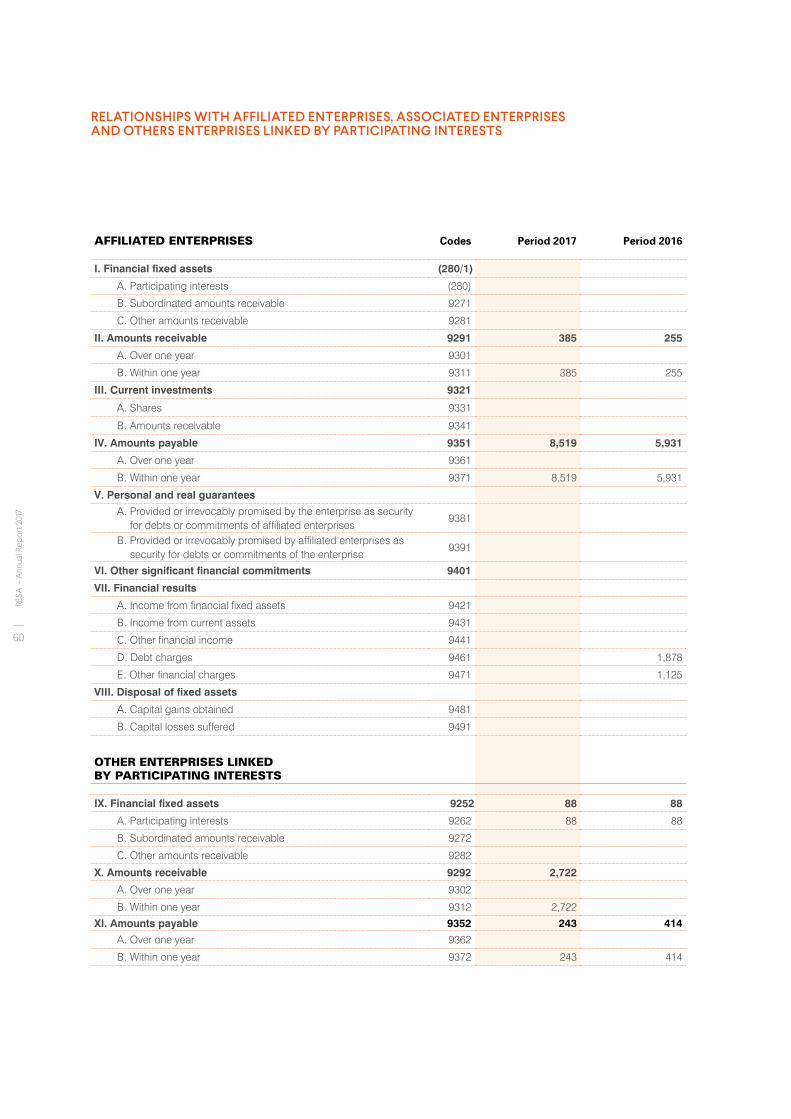
RELATIONSHIPS WITH AFFILIATED ENTERPRISES, ASSOCIATED ENTERPRISES AND OTHERS ENTERPRISES LINKED BY PARTICIPATING INTERESTS
AFFILIATED ENTERPRISES Codes Period 2017 Period 2016
I. Financial fixed assets (280/1)
A. Participating interests (280)
B. Subordinated amounts receivable 9271
C. Other amounts receivable 9281
II. Amounts receivable 9291 385 255
A. Over one year 9301
B. Within one year 9311 385 255
III. Current investments 9321
A. Shares 9331
B. Amounts receivable 9341
IV. Amounts payable 9351 8,519 5,931
A. Over one year 9361
B. Within one year 9371 8,519 5,931
V. Personal and real guarantees
A. Provided or irrevocably promised by the enterprise as security for debts or commitments of affiliated enterprises
9381
B. Provided or irrevocably promised by affiliated enterprises as security for debts or commitments of the enterprise
9391
VI. Other significant financial commitments 9401
VII. Financial results
A. Income from financial fixed assets 9421
B. Income from current assets 9431
C. Other financial income 9441
D. Debt charges 9461 1,878
E. Other financial charges 9471 1,125
VIII. Disposal of fixed assets
A. Capital gains obtained 9481
B. Capital losses suffered 9491
OTHER ENTERPRISES LINKED BY PARTICIPATING INTERESTS
IX. Financial fixed assets 9252 88 88
A. Participating interests 9262 88 88
B. Subordinated amounts receivable 9272
C. Other amounts receivable 9282
X. Amounts receivable 9292 2,722
A. Over one year 9302
B. Within one year 9312 2,722
XI. Amounts payable 9352 243 414
A. Over one year 9362
B. Within one year 9372 243 414
RESA
- A
nnua
l Rep
ort 2
017
—60

AFFILIATED ENTERPRISES Codes Period 2017 Period 2016
I. Financial fixed assets (280/1)
A. Participating interests (280)
B. Subordinated amounts receivable 9271
C. Other amounts receivable 9281
II. Amounts receivable 9291 385 255
A. Over one year 9301
B. Within one year 9311 385 255
III. Current investments 9321
A. Shares 9331
B. Amounts receivable 9341
IV. Amounts payable 9351 8,519 5,931
A. Over one year 9361
B. Within one year 9371 8,519 5,931
V. Personal and real guarantees
A. Provided or irrevocably promised by the enterprise as security for debts or commitments of affiliated enterprises
9381
B. Provided or irrevocably promised by affiliated enterprises as security for debts or commitments of the enterprise
9391
VI. Other significant financial commitments 9401
VII. Financial results
A. Income from financial fixed assets 9421
B. Income from current assets 9431
C. Other financial income 9441
D. Debt charges 9461 1,878
E. Other financial charges 9471 1,125
VIII. Disposal of fixed assets
A. Capital gains obtained 9481
B. Capital losses suffered 9491
OTHER ENTERPRISES LINKED BY PARTICIPATING INTERESTS
IX. Financial fixed assets 9252 88 88
A. Participating interests 9262 88 88
B. Subordinated amounts receivable 9272
C. Other amounts receivable 9282
X. Amounts receivable 9292 2,722
A. Over one year 9302
B. Within one year 9312 2,722
XI. Amounts payable 9352 243 414
A. Over one year 9362
B. Within one year 9372 243 414
FINANCIAL RELATIONSHIPS WITH
AUDITORS OR PEOPLE THEY ARE LINKED TO Codes Period 2017
I. Auditor’s fees 9505 28
II. Fees for exceptional services or special missions executed in the company by the auditor
A. Other attestation missions 95061 45
B. Tax consultancy 95062
C. Other missions external to the audit 95063
III. Fees for exceptional services or special missions executed in the company by people they are linked to
A. Other attestation missions 95081
B. Tax consultancy 95082
C. Other missions external to the audit 95083
Mentions related to article 133, paragraph 6 from the Companies Code
DERIVATIVES NOT MEASURED AT FAIR VALUE
FOR EACH CATEGORY OF FINANCIAL DERIVATIVES NOT MEASURED AT FAIR VALUE
Period 2017 Period 2016
I. Category of financial derivatives
II. Hedge risk III. Volume IV. Book value V. Fair value VI. Book value VII. Fair value
IRSEVOLUTIONEURIBOR
Hedging 633,404 0 -47 0 -74
IRSEVOLUTIONEURIBOR
Hedging 1,484,800 0 -64 0 -105
IRSEVOLUTIONEURIBOR
Hedging 355,491 0 -26 0 -42
IRSEVOLUTIONEURIBOR
Hedging 196,684 0 -15 0 -23
IRSEVOLUTIONEURIBOR
Hedging 2,000,000 0 -96 0 -152
IRSEVOLUTIONEURIBOR
Hedging 335,564 0 -25 0 -39
RESA
- A
nnua
l Rep
ort 2
017
—61

INFORMATION RELATING TO CONSOLIDATED ACCOUNTS
INFORMATION TO DISCLOSE BY EACH ENTERPRISE THAT IS SUBJECT TO COMPANY LAW ON THECONSOLIDATED ACCOUNTS OF ENTERPRISES
The enterprise has not published a consolidated annual statement of accounts and a management report, since it is exempt for thisobligation for the following reason *
The enterprise and its subsidiaries on consolidated basis exceed not more than one of limits mentioned in art.16 of Company Law*
* Delete where no appropriate.** Where the accounts of the enterprise are consolidated at different levels, the information should be given for the consolidated aggregate at the highest level on the one hand
and the lowest level on the other hand of which the enterprise is a subsidiary and for which consolidated accounts are prepared and published.
INFORMATION TO DISCLOSE BY THE REPORTING ENTERPRISE BEING A SUBSIDIARY OR A JOINT SUBSIDIARY
Name, full address of the registered office and, for an enterprise governed by Belgian Law, the company number of the parent company(ies) and the specification whether the parent company(ies) prepare(s) and publish(es) consolidated annual accounts in which the annual accounts of the enterprise are included**
PUBLIFIN Rue Louvrex 95 4000 Liège 1, Belgium 0204.245.277
The enterprise draws up consolidated annual accounts data for the major part of the enterprise
RESA
- A
nnua
l Rep
ort 2
017
—62

5.5. Valuation rules
PREAMBLEWith effect from 1 January 2014, RESA has benefited from a contribution from the “electricity” business line and, with effect from 1 January 2015, a contribution from the “gas” line by the intermunicipal company Publifin. These contributions were made in accounting continuity, assessment rules previously applicable to assets and liabilities within SCIRL Publifin con-tinue to apply. Those assessment rules have been built in as follows:
ASSETS1. Formation expenses These consist of costs for changes of voltage, staff training costs and bond issuing charges. These are valued at di-rect production cost and are fully depreciated in the year of acquisition.
2. Intangible assets These include:
• office software and other software, valued at acquisition price and depreciated on a straight-line basis over 5 years;
• costs of studies and research, valued as direct return costs, depreciated linearly over 5 years;
• the resulting goodwill from mergers by absorption would in principle have been, in all or in part, allocated to different as-set items acquired on the occasion of the merger. These are mainly related to customers and the absorbed network of the entity. They are depreciated linearly over ten years, pro rata for the the first year, which matches the depreciation period usually observed for the sector of activity concerned.
3. Tangible assets
a. General remarksSince 01.01.2007, all of the customers of the electricity and gas Distribution Network Operator or DSO are liberalised. As such, the CREG (Commission for Regulation of Electricity and Gas) has since 2001 applied a set of assessment rules, depreciation rates and residual values of fixed assets for which it has legal competence. The assessment rules have been adapted ac-cordingly since the fiscal year 2007.From 2014, the tariff jurisdiction was transferred to the Walloon regional regulator, the Commission Wallonne Pour l’Energie (CWaPE).
b. AssessmentTangible fixed assets are valued at the net revalued book val-ue (possibly limited to residual predefined values for the as-sets within the regulator’s jurisdiction, previously acquired in 2002), i.e. the acquisition value or the direct production cost is increased by the added value, by overheads of a percentage of the acquisition value (16.5% until 2007, 32.15% from 2008 to 2012 for “electricity” tangible assets and 16.5% until 2012 for the “gas” business line and then a percentage determined annually based on the fiscal year from 2013 for the two busi-ness lines) and decreased by interventions by third parties and recorded depreciation.
c. ReassessmentCapital assets can be reassessed in accordance with Article 57 of the Royal Decree of 30 January 2001, implementing the Corporate Code.
d. Ordinary depreciationFixed assets are systematically subjected to depreciation in accordance with Article 57 of the Royal Decree of 30 January 2001, implementing the Corporate Code.Depreciation is ap-plied pro rata using the straight-line method at the following rates:
Business line: “electricity”• 2% on administrative buildings;• 3% on structures and buildings and 15 kV low voltage net-
work substations;• 2% on low voltage and high voltage lines;• 3% on other low voltage and high voltage electrical
equipment;• 10% on furniture, tools and electronic equipment;• 20% on rolling stock;• 20 % on computer hardware.
Business line: “gas”• 2% on administrative buildings;• 3% on industrial buildings;• 3% on stations, posts and cabins;• 2% on pipes;• 2% on connection works;• 3% on meters;• 10 % on prepayment meters;• 10% on telemetry systems;• 10% on furniture, facilities, machinery and equipment;• 20% on rolling stock.
RESA
- A
nnua
l Rep
ort 2
017
—63

e. WithdrawalsIn case of withdrawals (disposals), the net revalued book value is decreased for all or part of the depreciation record concerned.For the particular case of added value from revaluation recorded in accordance with the CREG guidelines, this is subject to a re-duction in value of 2% annually as an estimate of decommission-ing (imposed by the regulator).
4. Financial fixed assets
Financial fixed assets are listed as assets on the balance sheet at their nominal value or at their acquisition value under deduction of uncalled amounts. Reductions in value are applied for long-last-ing or permanent losses.
5. Amounts receivable for over one year
These are listed as assets on the balance sheet at their nominal value or at their acquisition value under any deduction of reduc-tions in value for long-lasting or permanent losses.
6. Stock and manufacturing work in progress
Stock is valued at the weighted average unit price. It is subject to reductions or reversal in value taking into account the status of the stock on the date the financial year closes.Work in process is valued at direct production cost.
7. Amounts receivable within one year
Amounts receivable within a year are recorded at face value. A value reduction is based on the estimated doubtful amounts.
8. Cash investments and disposable assets
These are included in the balance sheet at their nominal value and the fixed-income securities at acquisition value.
9. Regularisation accounts
Adjustment accounts are valued at their nominal value.
LIABILITIES1. Reserves
The allocation to the legal reserve is in accordance with Article 616 of the Corporate Code.
2. Investment grants
These are taken at face value.They are transferred annually to the income statement at the same rate as the depreciation of the investment concerned.
3. Provisions for risks and expenses
Provisions are set up to deal with risks or predictable expenses. A reversal of provisions is carried out insofar as these are no longer justified and use is achieved when the risk or charge arises. An annual adjustment is carried out.
4. Liabilities
These are taken at face value.
5. Regularisation accounts
Adjustment accounts are valued at their nominal value.
NON BALANCE-SHEET
ITEMS1. Rights and commitments
These are recorded at face value.
RESA
- A
nnua
l Rep
ort 2
017
—64

5.6. Statutory auditor’s report on the annual accounts as of and for the year ended 31 December 2017
Sint-Stevens-Woluwe, 4 April 2018
To the Shareholders of RESA SALiège
We present to you our statutory auditor’s report in the context of our statutory audit of the annual accounts of RESA SA (the “Company”). This report includes our report on the audit of the annual accounts, as well as the report on other legal and reg-ulatory requirements. These reports form part of an integrated whole and are indivisible. We were appointed as statutory auditor by the general meet-ing of 27 April 2017, following the proposa} formulated by the Board of Directors. Our mandate will expire on the date of the general meeting which will deliberate on the annual accounts for the year ended 31 December 2019. We have performed the statutory audit of the annual accounts of RESA SA for four con-secutive years..
REPORT ON THE AUDIT OF THE ANNUAL ACCOUNTS
Unqualified opinion We have performed the statutory audit of the annual accounts of the Company, which comprise the balance sheet as at 31 December 2017, the profit and loss account for the year then ended, and the notes to the annual accounts. These annual accounts show a balance sheet total of EUR 1.483.683.024,10 and a profit and loss account with a profit for the year of EUR 50.932.783,90.
In our opinion, the annual accounts give a true and fair view of the Company’s net equity and financial position as at 31 December 2017, and of its results for the year then ended, in accordance with the financial-reporting framework applicable in Belgium.
Basisfor unqualified opinion We conducted our audit in accordance with International Standards on Auditing (ISAs).
Our responsibilities under those standards are further de-scribed in the “Statutory auditor’s responsibilities for the audit of the annual accounts” section of our rep_ort. We have ful-filled our ethical responsibilities in accordance with the ethi-cal requirements that are relevant to our audit of the annual accounts in Belgium, including the requirements relating to independence.
We have obtained from the Board of Directors and Company officials the explanations and information necessary for per-forming our audit.
We believe that the audit evidence we have obtained is suffi-cient and appropriate to provide a basis for our opinion.
Observation Without calling into question the opinion expressed above, we draw the attention of the reader to appendix C 6.14 of the an-nual accounts which mentions an estimate of costs that the Company may have to face following the application of the future Walloon decrees regulating the Gas and Electricity dis-tribution markets. Specifically, these decrees could affect the Company at the financial level and adversely impact its future results.
Responsibilities of the Board of Directorsfor the annual accounts The Board of Directors is responsible for the preparation of an-nual accounts that give a true and fair view in accordance with the financial-reporting framework applicable in Belgium, and for such interna! control as the Board of Directors determines is necessary to enable the preparation of annual accounts that are free from material misstatement, whether due to fraud or error.
In preparing the annual accounts, the Board of Directors is responsible for assessing the Company’s ability to continue as a going concern, disclosing, as applicable, matters relating to the going concern and using the going concern basis of accounting unless the Board of Directors either intends to liq-uidate the Company or to cease operations, or has no realistic alternative but to do so.
Statutory auditor’s responsibilities for the audit of the annual accounts Our objectives are to obtain reasonable assurance that the annual accounts as a whole are free from material misstate-ment, whether due to fraud or error, and to issue an auditor’s report that includes our opinion. Reasonable assurance is a high level of assurance, but is not a guarantee that an audit conducted in accordance with ISAs will always detect a mate-rial misstatement when it exists. Misstatements can arise from fraud or error and are considered material if, individually or in the aggregate, they could reasonably be expected to influence the economic decisions of users taken on the basis of these annual accounts.
As part of an audit in accordance with ISAs, we exercise pro-fessional judgment and maintain professional skepticism throughout the audit. We also:
• identify and assess the risks of material misstatement in the annual accounts, whether due to fraud or error. We design and perform audit procedures that respond to those risks, and obtain audit evidence that is sufficient and appropriate to provide a basis for our opinion. The risk of not detecting a material misstatement resulting from fraud is higher than for one resulting from error, as fraud may involve collusion, forgery, intentional omissions, misrepresentations, or the override of interna! control;
RESA
- A
nnua
l Rep
ort 2
017
—65

• obtain an understanding of interna! control relevant to the au-dit in order to design audit procedures that are appropriate in the circumstances, but not for the purpose of expressing an opinion on the effectiveness of the Company’s interna! control;
• evaluate the appropriateness of the accounting policies used as well as the reasonableness of the accounting estima tes and related disclosures made by the Board of Directors;
• conclude on the appropriateness of the Board of Directors’ use of the going concern basis of accounting and, based on the audit evidence obtained, whether a material uncertainty exists relating to events or conditions that may cast signifi-cant doubt on the Company’s ability to continue as a going concern. If we conclude that a material uncertainty exists, we are required to draw attention in our statutory auditor’s report to the related disclosures in the annual accounts or, if such disclosures are inadequate, to modify our opinion. Our con-clusions are based on the audit evidence obtained up to the date of our statutory auditor’s report. However, future events or conditions may cause the Company to cease to continue as a going concern;
• evaluate the overall presentation, structure and content of the annual accounts, including the disclosures, and whether the annual accounts represent the underlying transactions and events in a manner that achieves fair presentation.
We communicate with the Board of Directors regarding, among other matters, the planned scope and timing of the audit and significant audit findings, including any significant deficiencies in internai contrai that we identify during our audit.
REPORT ON OTHER LEGAL AND REGULATORY REQUIREMENTS
Responsibilities of the Board of Direct ors The Board of Directors is responsible for the preparation and the content of the directors’ report and of the documents required to be deposited by virtue of the legal and regulatory require-ments, as well as for compliance with the legal and regulatory requirements regarding bookkeeping, with the Companies’ Code and with the Company’s articles of association.
Statu.tory auditor’s responsibilities In the context of our mandate and in accordance with the Belgian standard (Revised) complementary to the International Standards on Auditing .(ISAs) as applicable in Belgium, our
responsibility is to verify, in all material respects, the directors’ report, certain documents which must be deposited by virtue of legal and regulatory requirements, as well as compliance with certain legal and regulatory requirements, and to report on these matters.
Aspects relating to the directors’ report In our opinion, after having performed specific procedures in relation to the directors’ report, the directors’ report is consist-ent with the annual accounts for the year under audit, and it has been prepared in accordance with articles 95 and 96 of the Companies’ Code.
In the context of our audit of the annual accounts, we are also responsible for considering, in particular based on the knowl-edge acquired further to the audit, whether the directors’ report is materially misstated or contains information which is inade-quately disclosed or otherwise misleading. In light of the proce-dures we have performed, there are no material misstatements we have to report to you. We do not express any form of assur-ance whatsoever regarding the directors’ report.
Statements relating to independence • We did not provide services which are incompatible with the
statutory audit of the annual accounts and remained inde-pendent of the Company in the course of our mandate.
• The fees for additional services which are compatible with the statu tory audit of the annual accounts referred to in arti-cle 134 of the Companies’ Code are correctly disclosed and itemised in the notes to the annual accounts.
Other statements • Without prejudice to formai aspects of minor importance, the
accounting records were maintained in accordance with the legal and regulatory requirements applicable in Belgium.
• The appropriation of results proposed to the general meeting complies with the legal provisions and the provisions of the articles of association.
• There are no transactions undertaken or decisions taken in breach of the Company’s articles of association or the Companies’ Code that we have to report to you.
The Statutory auditor PwC Reviseurs d’Entreprises sccrl Represented by
Isabelle RasmontStatutory auditor
Michaël FocantStatutory auditor
RESA
- A
nnua
l Rep
ort 2
017
—66


List of the adjudicators

RE
SA -
Rap
port
Ann
uel 2
016
I. Works contractsProcurement method: procedure negotiated with publication.
•Tegec sprl •ORLANDO FABRICE SPRL •AGEC sprl •SM HOTTON INFRA-APK INFRA •HYDROGAZ sa •Jacobs sa •Wilkin S.A. •COLLIGNON ENG. Sa •Boniver sa •TRTC BONFOND FILS S.A •ROGER GEHLEN SA •BODARWE SA •SM R. Lejeune & Fils SA – Nelles SA •R. Lejeune & Fils SA •SM Hydrogaz SA - RMS SPRL •SPIE BELGIUM sa •Aquaflux sa •Ets Crosset Leon sa •NEWELEC sa •AM NASTA CONSEIL sa ET MODAL INSTALLATION SA •Nelles Freres sa •Fodetra Infra S.A. •Etablissements E. Ronveaux sa •Genetec sa
Procurement method: procedure negotiated without publication.
•C. LONNEUX sprl
Procurement method: directly negotiated procedure without publication.
•GALERE SA
Procurement method: negotiated procedure with a prior call for competition.
•WILKIN SA •Yvan Paque sa •ROGER GEHLEN SA •SM HYDROGAZ - TEGEC
Procurement method: directly negotiated procedure with prior com-petitive bidding / directly negotiated procedure with a prior call for competitio.
•AIR AMBIANCE SA
Procurement method: directly negotiated procedure without publication.
•COLLIGNON ENG. Sa •APRUZZESE SA •Menuiserie Boulanger SPRL
II. Supply contractsProcurement method: procedure negotiated with publication.
•ABB •SGC NV •DEBA NV •DEPAIRON sa •TUBE BELGIUM SA •KABELWERK EUPEN AG •Dyka •BG PIPE • INDUTUBE •MRC Global SA •EMMER SERVICE •ELSTER •PAULY-ANDRIANNE SPRL •LISAP •VANDEPUTTE SAFETY •SOCOMEC - BELGIUM SA •VOLTACOM SPRL •Construction Electriques Schreder sa •Philips Belgium SA •AXPO BENELUX SA •Electrabel S.A. •Lampiris S.A. •EDF Luminus S.A. •AM SEVA DEPANNAGES SA •Renault Neri Liège sa •ELECOM SA
Procurement method: directly negotiated procedure with publication.
•ACT Commodities B.V.
List of the adjudicators of 2017 public contracts awarded on behalf of RESA sa
RESA
- A
nnua
l Rep
ort 2
017
—70

Procurement method: procedure negotiated without publication.
•Ej Benelux Access Solutions • INFRATECH sa •AVK Belgium NV •EMMER SERVICE • IMBEMA BELGIUM nv •Ateliers Berton SA •Piping Products Distribution •Tpim sa •HINNI-TRACHET •AM SEVA DEPANNAGES SA •COMET BELGIUM SA •RENAULT V.I. BELGIQUE SA •SAGEMCOM ENERGY & TELECOM SAS
Procurement method: negotiated procedure without a prior call for competition.
•Construction Electriques Schreder sa •A.D. Mécanique Générale SPRL •LITHOBETON SA •CDC-CABINES DE CINEY SA
III. Procurement of servicesProcurement method: procedure negotiated with publication.
•BOIS & TRAVAUX SA •SFR SA •JARDIN D’O •DELAWARE CONSULTING CVBA •Persolis S.A. •MICROPOLE CONSULTING BELGIUM NV •FLEXSO BRUSSELS S.A. •LAURENTY NV •ETHIAS sa •CGI Belgium SA •Contraste Europe S.A. •TUBE BELGIUM SA
Procurement method: procedure negotiated without publication.
•CEGELEC Infra Technics sa •PWC REVISEURS D’ENTREPRISES sccrl •MEGA International •WIN S.A. •LABORELEC CVBA
Procurement method: negotiated procedure without a prior call for competition.
•C.I.B. S.A. •NEXXEO SPRL •Deloitte Consulting •C.I.B. S.A.
RESA
- A
nnua
l Rep
ort 2
017
—71

Responsible editor:
Gil SIMON, General Secretary, RESA S.A.
RESA S.A.
Rue Louvrex, 954000 LiègeBelgiumT. +32 (0)4 220 12 11 F. +32 (0)4 220 12 00RPM Liège - 0847.027.754www.resa.be
Photo credits:
Shutterstock RESA Imagellan
© 2018 - All rights reserved RESA S.A.
Design: [Page UP] sprl
The paper used in this report is FSC certified (Forest Stewardship Council).
This certification attests to a series of principles and criteria for forest globally recognised
management. The goal of FSC certification is to promote responsible forest management.


