11
© Australian Taxation Office for the Commonwealth of Australia, 2013 Large business income tax strategy 2013-14 Current as at 1 August 2013 UNCLASSIFIED

© Australian Taxation Office for the Commonwealth of Australia, 2013
Large business income tax strategy
2013-14
Current as at 1 August 2013
UNCLASSIFIED
What are the key details of each document?*
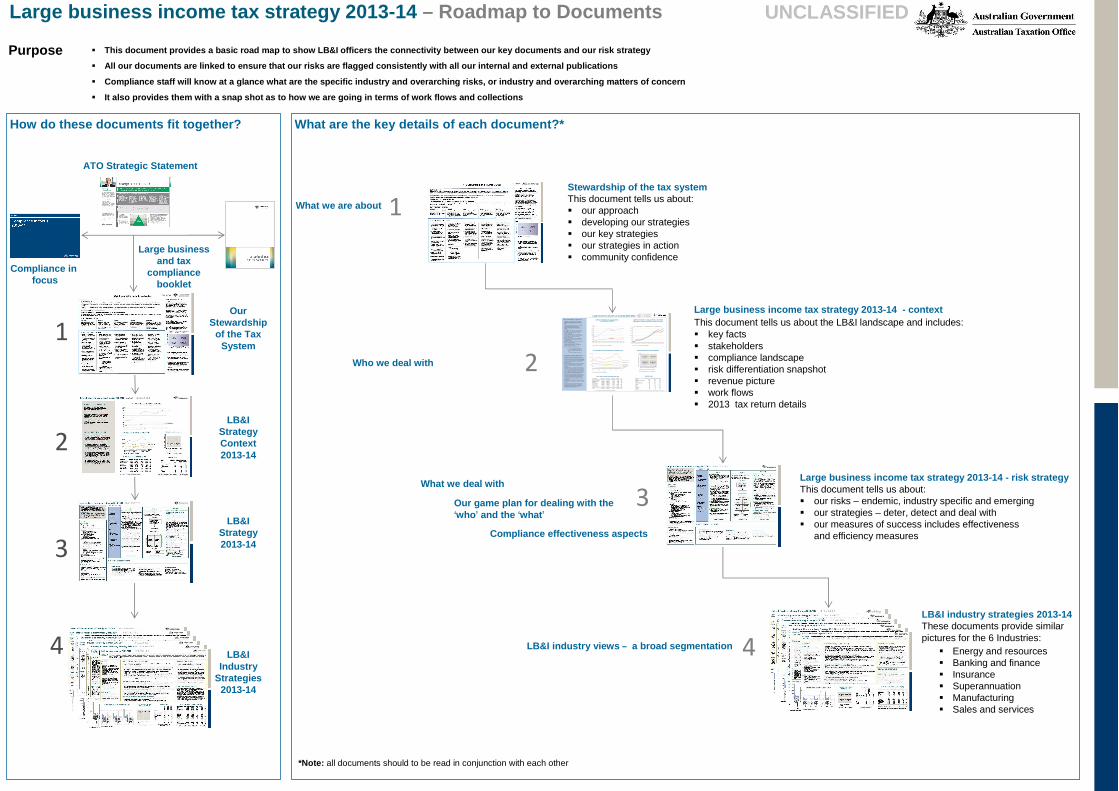
� Energy and resources� Banking and finance� Insurance� Superannuation� Manufacturing � Sales and services
� This document provides a basic road map to show LB& I officers the connectivity between our key documen ts and our risk strategy
� All our documents are linked to ensure that our ris ks are flagged consistently with all our internal a nd external publications
� Compliance staff will know at a glance what are the specific industry and overarching risks, or indust ry and overarching matters of concern
� It also provides them with a snap shot as to how we are going in terms of work flows and collections
Large business income tax strategy 2013-14 – Roadmap to Documents
Purpose
UNCLASSIFIED
Large business income tax strategy 2013-14 - contextThis document tells us about the LB&I landscape and includes:� key facts� stakeholders� compliance landscape� risk differentiation snapshot� revenue picture� work flows� 2013 tax return details
Large business income tax strategy 2013-14 - risk strategyThis document tells us about:� our risks – endemic, industry specific and emerging� our strategies – deter, detect and deal with� our measures of success includes effectiveness
and efficiency measures
Who we deal with
What we deal with
Our game plan for dealing with the ‘who ’ and the ‘what ’
Compliance effectiveness aspects
LB&I industry views – a broad segmentation
What we are about
Stewardship of the tax systemThis document tells us about:� our approach� developing our strategies� our key strategies� our strategies in action� community confidence
1
3
4
2
How do these documents fit together?
Large business and tax
compliancebooklet
LB&I StrategyContext2013-14
LB&I Strategy2013-14
Our Stewardship
of the Tax System
1
2
3
ATO Strategic Statement
LB&I Industry
Strategies2013-14
4
LB&I industry strategies 2013-14 These documents provide similar pictures for the 6 Industries:
LB&I TAXPAYERS – KEY FACTS
� LB& I entit ies are generally compliant in meeting regis trat ion, lodgment, payment and reporti ng obligat ions
� The imputation system and demand f or f ranked divi dends ac ts as a brake on tax planning, but around 47% of LB &I groups are f orei gn owned and therefore outs ide the imputati on regim e
� M any, if not most , LB& I entit ies do engage in a degree of t ax planning, particularly where the law is am biguous . S ome is cons idered contes table by t he ATO and is challenged
� Tax planning that we are currentl y seeing includes t he s truc turi ng of bus iness operati ons to c ircum vent t ax rul es especi ally t hose t hat extend beyond borders inc luding rules in respect to t hin capit alisation, debt/ equit y, transfer pricing, consol idati on, cost -set ting and sale of off shore assets. It is aggravated by laws that may not have kept pace with t rends in e-commerce and globalisation
� S ome of this res truc turi ng has lead t o erosion of the tax base and this has been t he subj ec t of recent concerted internat ional act ion by governments through various f orums such as the G20, FTA, as well as work of the Treasury ’s S pec ial Reference Group which t he ATO is ass ist ing wit h
� LB& I will ac tively engage Treasury so that outcomes from tax planning t hat do not ali gn with t he spiri t of the law are addressed
� Due to t he im portance of t he l arge market in t he t ax sys tem, LB& I maintains a hi gh l evel of com pliance coverage to prov ide a hi gh degree of assurance t hat compliance has occurred or that we are deali ng appropriately wit h matters of concern
� Large Business & I nternational (LB& I) has over 1,200 economic groups that cons ist of over 32,000bus inesses, generally with t urnover of more t han $250m
� LB &I comprises 6 major indus try groups - Energy & Resources, Banking & Fi nance, Insurance, Superannuat ion, Manufac turing and Sales & Serv ices. Each of t hese in turn has numerous sub indust ries .
� Around 66% of LB& I groups are publ ic companies
� Around 38% of LB& I groups are f oreign owned and controlled; another 9% are f oreign owned but controlled domestically
� LB &I’s income tax col lec ted in 2013 dropped from las t year’s high due t o a number of f ac tors but which inc ludes reduced revenue from the E nergy & Resources (E&R) sec tor
� LB &I taxpayers play a key role in t he integrity of t he PAYG wit hholding and superannuati on sys tems –nearl y $50bn in 2012
� LB &I is also responsible f or 76 superannuati on f unds which are regulated by A PRA
� The m arket is hi ghly skewed wit h the top 10 taxpayers accounting f or approx. % of t otal large market company t ax ; t he top 7%
� Under t he RDF model, we have assessed
� 1% of LB& I taxpayers as hi gher risk
� 8% of LB& I t axpayers as key t axpayers
� 33% of LB&I taxpayers as medium risk and
� 58% of LB&I t axpayers as l ower risk
COMPLIANCE/ RISK LANDSCAPE
Large business income tax strategy 2013-2014 Page 1 - Context
WORKFLOWS2012 YEAR TAX RETURN AND BAS ($M)
RISK DIFFERENTIATION FRAMEWORK
RELATIVE L IKELIHO OD O F NO N CO MPLIANCE
COMPANY INCOME TAX COLLECTIONS vASX COMPANY PROFITS
CO
NSE
QU
EN
CE
OF
NO
N C
OM
PL
IAN
CE
Source: LB&I Revenue Cube 26/03/2013Source: LB &I Data S ervices Team 1/03/2013
Sou rce : LB&I ACRPT 22 /03 /201 3 a nd IA & DM BI & R 2 6/3 /201 3 Source: LB&I Da ta Service s Team 1/0 3/2 013 an d L B&I Reve nue Ma nag ement Team 14 /03 /201 3
MEDIUM RISK33 7
LOWER RISK59 8
HIGHER RISK 7
KEY CLIENT83
Ad d itio n all y 3 3 9 N ot r eq u ire d a n d 66 un rat ed
LB&I INCOME TAX NET REVENUE BY SEGMENT ($M)
S ou rce : LB &I Re ve n u e Man a g eme n t Te a m 1 1 /1 0 /2 01 2
COMPANY INCOME TAX COLLECTIONS v ADJUSTED CORPORATE GROSS OPERATING SURPLUS (CGOS)
Product Finalised 2012 Finalised 2013 In progress
Advice 525 368 90
Risk Review s (excl PCR) 400 171 175PCRs 34 31 120Other Risk Products 249 130 15
Audits 61 27 117APA 46 11 60ACA 3 8 13
Object ions 68 98 123Litigation 57 36 39
LB&I Industry Total Income Total Assets Tax Payable PAYG(W) FBT
Energy & Resources 309,096 591,852 13,298 8,623 317
Banking & Finance 184,325 1,525,360 3,754 6,852 185Insurance 59,404 250,670 1,228 1,392 52
Superannuat ion 86,169 599,498 6,719 387 1Manufacturing 290,086 455,430 3,679 15,574 563
Sales & Services 326,072 359,331 6,396 17,563 469
Other 857 4,797 21 (1,393) 37Total 1,256,008 3,786,938 35,095 48,998 1,624
50
70
90
110
130
150
170
1998 1999 2000 2001 2002 2003 2004 2005 2006 2007 2008 2009 2010 2011
BillionAdjusted CGOS Tax payable inc CGT Tax payable exc CGT
UNCLASSIFIED
Energy & Resources
Banking & Finance
Superannuation
ManufacturingSales & Services
InsuranceOther0
5,000
10,000
15,000
20,000
2008 2009 2010 2011 2012 2013
Prof it
Tax collections
0
20
40
60
80
100
120
140
160
2002 2003 2004 2005 2006 2007 2008 2009 2010 2011 2012
Billions
So urce : Re ve n u e An a lys is B ra n ch 1 8 /0 6/ 2 01 3
Compliance infocus
*Note: all documents should to be read in conjunction with each other

ATO Stewardship in the Large Market
RISK DIFFERENTIATION
We differentiate our engagement with large organisations according to our assessment of their tax risk. All large businesses are assessed into one of four broad risk categorisations via the Risk Differentiation Framework (RDF) for each revenue type
The RDF is based on the premise that our risk management stance and style of taxpayer engagement will differ based on our view of a businesses likelihood of non-compliance (having a tax outcome that the ATO does not agree with) and the consequences (dollars, reputation) of that non-compliance
This not only enables us to allocate our compliance resources in the most efficient and effective way, in areas of higher risk, but it also reduces overall compliance costs
Risk categorisations are provided to large organisations annually and allow us to work with them on a personalised and transparent basis
� Key taxpayers are assigned the necessary resources to develop our relationship and to increase an understanding of their business
� For higher risk taxpayers, we assign appropriate resources to allow for continuous review
� For taxpayers identified as medium risk, we will undertake targeted activities to deal with identified tax compliance concerns. These activities are more likely to be reviews and audits
� Most large businesses are lower risk taxpayers and we monitor intelligence to confirm their lower risk categorisation
RISK DIFFERENTIATION FRAMEWORK
Less likely More likely
CO
NS
EQ
UE
NC
E
Lower
Higher
SERVICE FOCUS
ASSURANCE FOCUS
ENFORCEMENT FOCUS
OUR APPROACHWe recognise that large organisations are extremely important contributors to Australia’s economy and the overall health of the tax system. In our stewardship of Australia’s tax system, we seek a cooperative working relationship with large businesses to maximise outcomes for all. Our compliance strategies involve tailored and personalised engagement, including:
� supporting and encouraging voluntary compliance through engagement processes such as our relationship management model and annual compliance arrangements
� employing assurance-based approaches that encourage self-review and collaborative resolution of issues
� providing certainty through private and public rulings
� fostering a level playing field by responding to non-compliance in a firm, fair and professional way
We grow broader community confidence in the integrity and equity of the tax system by communicating the outcomes of our stewardship of the system and that large businesses are demonstrating compliance with the tax system
OUR STRATEGIC THEMES
Key taxpayers
Lower risk taxpayers
Higher risk taxpayers
Medium risk taxpayers
UNCLASSIFIED
OUR STRATEGIES IN ACTION
LIKELIHOOD
EncourageLarge organisations support and understand the benefits of participation – they are engaged and willingly participate
� Publication of the Large business & tax compliance booklet and the compliance in focus program make clear our approach to managing tax compliance
� Annual compliance arrangements (ACAs) are offered to taxpayers with good governance arrangements and who engage in open dialogue with us
� Speeches, media releases, reminders and alerts make our position clear
� Valuable intelligence is provided by external forums and organisations, such as the National Tax Liaison Group and the Large Business LiaisonGroup
� Working with other tax jurisdictions to resolve double taxation issues
� We use a mix of assurance approaches to encourage collaborative discussion and resolution of issues
Support Large organisations are helped and assisted to understand their rights and responsibilities and are able to fulfil their obligations easily at minimal cost
� A relationship management model with large entities to foster improved tax obligations and reduce compliance costs
� We offer ACAs to provide businesses with certainty on significant, time sensitive transactions
� We issue rulings and publications designed to clarify tax obligations
� Our Early Engagement Model focuses on improving the way we deal with private and class ruling applications
� Tools we have developed include:- Compliance risk manual- Large business active
compliance manuals for indirect and income taxes.
� We use informal information gathering approaches to reach an early resolution of matters
� We use RDF to differentiate taxpayer risk so we can tailor our responses
Protect We protect large organisations and the community by deterring, detecting and dealing with those who haven’t complied
� We use pre-lodgment compliance reviews (PCRs) to surface income tax issues earlier and allow self correction within a self assessment system
� We constantly monitor activity statements and other information relating to GST and excise to identify potential issues
� When risks are found to be significant, we would normally follow up with audit action
� Disputes are inevitable. We seek to resolve them as early and cooperatively as possible
EnhanceWe are passionate about improving our capabilities to be more innovative, agile and responsive to challenges and opportunities
� We regularly review our case selection processes, including the use of third party data, to deliver a more targeted response
� We evaluate the effectiveness of our compliance strategies to identify opportunities for improvement
� We are improving our compliance approaches to increase our focus on early intervention and prevention
� We provide ATO officers with targeted learning and development programs including refreshed leadership and management development programs and strengthened performance management
� We continue to look at ways of improving how we service and support large business
ChampionWe ensure the needs of large business help shape our administration and the government’s tax policy and law programs. We advise government where the law is not achieving its intended policy outcomes
� Consultation, collaboration and co-design of administrative solutions to tax administration challenges ensures the needs of large businesses are not ignored
� Our strategic litigation program aims to provide certainty and clarity as well as highlighting where legislative attention is required
� We work with Treasury to achieve changes to law and policy, drawing on input from our wide range of consultative forums, when appropriate
� Making changes to our processes and systems to improve the tax system and reduce the cost of compliance
� We work with other tax jurisdictions and international policy setting organisations such as the OECD on a range of issues including double taxation, base erosion and profit sharing

LB&I TAXPAYERS – KEY FACTS
Large business income tax strategy 2013-2014 – Context
WORKFLOWS
2012 YEAR TAX RETURN AND BAS ($M)
RISK DIFFERENTIATION FRAMEWORK
RELATIVE LIKELIHOOD OF NON COMPLIANCE
ASX LISTED COMPANY PROFITS & THEIR INCOME TAX COLLECTIONS ($B)
CO
NS
EQ
UE
NC
E O
F N
ON
CO
MP
LIA
NC
E
Source: LB&I Revenue Cube 10/07/2013
Source: LB&I Data Services Team 2/07/2013
Source: LB&I Data Services Team 2/07/2013 and LB&I Revenue Management Team 14/03/2013
Source: LB&I ACRPT 9/07/2013 and IA & DM BI & R 9/07/2013
MEDIUM RISK230
LOWER RISK651
HIGHER RISK 6
KEY CLIENTS86
Additionally 234 Not required and 218 unrated
LB&I INCOME TAX NET REVENUE BY SEGMENT ($M)
Source: LB&I Revenue Management Team 12/07/2013 and company profit reports to shareholders (Aspect Huntley)
COMPANY INCOME TAX COLLECTIONS v ADJUSTED CORPORATE GROSS OPERATING SURPLUS (CGOS) ($B)
UNCLASSIFIED
LB&I Total Income Total Assets Tax Payable PAYG(W) FBT
Energy & Resources 395,002 811,346 18,874 8,637 318
Banking & Finance 334,857 3,616,572 10,232 6,890 188
Insurance 100,058 383,831 1,783 1,394 52
Superannuation 107,360 743,872 7,123 15,644 563
Manufacturing 440,951 741,536 4,478 17,620 469
Sales & Services 433,252 512,760 7,522 429 2
Other 2,148 18,742 32 (1,616) 31
Total 1,813,628 6,828,659 50,045 48,998 1,623
Note: PAYG(W) & FBT represent collections for the period 01/07/2011 to 30/06/2012
Prof it
Tax collections
0
20
40
60
80
100
120
140
160
2002 2003 2004 2005 2006 2007 2008 2009 2010 2011 2012
0
20
40
60
80
100
120
140
160
180
200
1998 1999 2000 2001 2002 2003 2004 2005 2006 2007 2008 2009 2010 2011 2012
Adjusted CGOS Tax payable inc CGT Tax payable exc CGT
Product
Fin
alis
ed 2
012
Fin
alis
ed 2
013
In p
rogr
ess
1/07
/201
3
Advice 525 537 84
Risk Review s( excl PCR) 400 264 159
PCRs 34 64 130
Other Risk Products 249 167 40
Audits 61 57 105
APA 46 25 57
ACA 3 8 14
Objections 68 153 125
Litigation 57 39 42
1,443 1,314 756
LB&I TAXPAYERS – KEY FACTS
� LB&I entities are generally compliant in meeting registration, lodgment, payment and reporting obligations
� The imputation system and demand for franked dividends acts as a brake on tax planning, but a good proportion of LB&I groups are foreign owned and therefore outside the imputation regime
� Many, if not most, LB&I entities do engage in a degree of tax planning, particularly where the law is ambiguous. Some is considered contestable by the ATO and is challenged
� Tax planning that we are currently seeing includes the structuring of business operations to circumvent tax rules especially those that extend beyond borders including rules in respect to thin capitalisation, debt/ equity, transfer pricing, consolidation cost-setting and sale of offshore assets. It is aggravated by laws that may not have kept pace with trends in e-commerce and globalisation
� Some of this restructuring has lead to erosion of the tax base and this has been the subject of recent concerted international action by governments through various forums such as the G20, FTA, as well as work of the Treasury’s Special Reference Group which the ATO is assisting with
� LB&I will actively engage Treasury so that outcomes from tax planning that do not align with the spirit of the law are addressed
� Due to the importance of the large market in the tax system, LB&I maintains a high level of compliance coverage to provide a high degree of assurance that compliance has occurred or that we are dealing appropriately with matters of concern
� There are about 1300 large or multinational businesses which operate in Australia, each with over $250m annual turnover
� LB&I comprises 6 major industry groups - Energy & Resources, Banking & Finance, Insurance, Superannuation, Manufacturing and Sales & Services. Each of these in turn has numerous sub industries.
� Over half of LB&I groups are public companies
� Over a third of LB&I groups are foreign owned.
� LB&I is also responsible for 76 superannuation funds which are regulated by APRA
� LB&I’s income tax collections of just over $49bn in 2013 were a small decrease on the previous year. This decrease reflects economic conditions, with reduced collections from the E&R sector and continuance of the decline in collections from Manufacturing
� Large businesses play a key role in the tax and super system contributing 68% of company and superannuation income tax
� They also play a key role in the integrity of the PAYG withholding and superannuation systems – nearly $50bn in 2013
� The market is highly skewed with the top 7 taxpayers accounting for approximately 40% of total large market company tax
� Under the RDF model, we have assessed
� 0.6% of LB&I taxpayers as higher risk
� 9% of LB&I taxpayers as key taxpayers
� 24% of LB&I taxpayers as medium risk and
� 67% of LB&I taxpayers as lower risk
These percentages illustrate that over the past year there has been a reduction in the number of taxpayers assessed as having higher risk (1% to 0.6%) or medium risk (35% to 24%)
COMPLIANCE/ RISK LANDSCAPE
Source: Revenue Analysis Branch 10/07/2013Note: ABS Corporate GOS series has been adjusted to better align with taxable income
Energy & Resources
Banking & Finance
Superannuation
Manufacturing
Sales & Services
Insurance
Other0
5,000
10,000
15,000
20,000
2008 2009 2010 2011 2012 2013

Educate, Engage & Encourage� Provide practical certainty through a program of ACAs,
RDF notifications, public and private rulings, Taxpayer Alerts, speeches, and guidance material. The addition of the Technical Leadership Group (TLG) has enhanced our ability to provide more consistent and timely advice
� Provide direct assistance and support through Key Client Relationship managers and the Large Service Team (LST) as well as a number of on line services and the premium phone service
� Resolve issues in real time through the use of co-operative compliance products - ACAs, APAs, PCRs as well as early engagement with private binding rulings
� Consult and co-design via active participation in ATO forums such as the Large Business Liaison Group (LBLG) and the National Tax Liaison Group (NTLG), moving quickly to address issues raised in these forums
� Foster a relationship of trust, openness and transparency with taxpayers and their representatives in our day to day interactions with them and through co-design and publication of our approaches and procedures e.g.
� the Large Business Active Compliance manual –Income tax and the Large Business and Tax Compliance booklet
� the Large Market income tax risk filters and � the new Compliance in Focus which replaces the
Compliance Program� Ensure independent review of LB&I statement of audit
position within 60 working days by the Review & Disputes Resolution area within the Law group
� Continue to highlight the importance of good corporate governance in risk reviews, taxpayer meetings and speeches
Enforcement as deterrent� Continue to promote voluntary compliance through
application of differentiated approaches� Seek to improve our ability to quickly identify, escalate and
publish our view of emerging risk
� Seek to improve our ability to manage risk by :� utilising more current information in case selection� making the best use of intelligence � improving compliance process particularly
information gathering� strengthening the connection between risk experts
and operations teams� improving governance and assurance processes� developing improved methodologies for evaluating
compliance effectiveness especially in a real time environment
Large business income tax strategy 2013-2014 – Risk Strategy
OUR RISKSCurrent risks� Profit shifting
� Thin capitalisation – asset (intangible) revaluations� Business restructures (including service hubs)� Transfer pricing – interest deferrals on related party
borrowing, value chain assessments, guarantee fees, market support payments
� E-commerce and base erosion� Consolidation
� Incorrect cost setting on entry, exit and restructuring� Rights to future income (RTFI) and
residual tax cost setting rules (RTCS)� Offshore Banking Units (OBU) – eligible activities, funding, expense
allocation, ‘intra-entity’ transactions, ‘Pool of funds’, use of branches
� Exploration expenditure
� Research & Development (R&D) incentive scheme
� Capital gains tax� Incorrect utilisation of capital losses� Incorrect reporting of capitals gains� International investments; Division 855 and subdivision 768-
G provisions� Financial instruments/ arrangements
� TOFA (Stages 3 and 4)� Stapled Groups – debt/equity characterisation� Unnecessary and contrived steps
� Losses – misapplication of loss recoupment rules, don’t reflect genuine commercial arrangements or lack economic substance or failure to meet continuity ownership (COT) or same business (SBT) or recoupment tests
� Private equity exits – failure of private equity funds to correctly report income on the disposal of Australian investments
� Non-resident withholding tax� Use of copyright� Embedding amounts in overall price to conceal actual
or arm’s length consideration� Re-characterisation of payments to avoid withholding
tax through structured arrangements� Uniform Capital Allowances (UCA) – capitalised labour costs
� Unbilled income
Matters of concern� Number of consolidated groups under the same foreign parent
company which obtain tax benefits such as cost base uplifts, Div855 CGT exemption for asset transfers and MEC advantages
� Valuation of outstanding claims liability (OCLs)
� Failure to apply appropriate expenses /losses - Foreign Income Tax Offset (FITO)
� Tax deferred trust distributions
� Conduit foreign Income – correct allocation of expenses
� Sec 25-90/ section 23AJ arrangements
� Incorrect treatment (franking) of company distributions pursuant to Section 254T of the Corporations Act 2001
� Refundable film tax offset – over claiming and not meeting criteria
� Carbon pricing
COMPLIANCE EFFECTIVENESS INDICATORS
Non Compliance
Detection Controls
Quantitative
Intelligence
Qualitative
Intelligence
Deterrent Controls
• Register in the system• Lodge correct forms• Report accurately on them• Pay or make transfers
Compliance obligations
Higher Risk
Continuous
Review
Medium Risk
Periodic
Review
Key Client
Continuous
Monitoring
Lower Risk
Periodic
Monitoring
Deal with Controls
Deter Detect Deal with
� Work closely with Treasury, other agencies, other jurisdictions and international forums eg OECD and FTA, to champion appropriate policy, law and system changes especially where unforeseen consequences and/or the law is not working as intended.
� Effectively manage the implementation of new law
Rev
iew
Inte
nsity
Review Frequency
+
Risk Likelihood
Ris
k C
onse
quen
ce
What risk?
Who has the risk?
Enable & Empower
� Each higher consequence (HC) taxpayer will have a Taxpayer Assurance Plan (TAP) under which we conduct relationship management, revenue monitoring, and real-time compliance activities, as well as audits and reviews on real-time and legacy issues
� Currently there are 8 operational ACAs (2 renewals) across a number of industries, with another new 2 negotiation
� PCRs will be in place for all higher consequence taxpayers not in an ACA
� Approaches are tailored according to the risk profile of each taxpayer. Each year these taxpayers will be advised of their RDF categorisation
� For those taxpayers with concerns, we will develop an action plan aimed at addressing our concerns and moving the taxpayer to the left of the RDF
� Risk detection will be improved by the new Reportable Tax Positions (RTP) schedule and its incorporation into the PCR product
� Risks detected will drive risk projects in the lower consequence population
Quadrant 3: Medium risk taxpayers
Engage & Encourage/ Enforcement as remedy
OUR STRATEGIES
Revenue measures
� Large market net income tax company receipts closely track movements in reported company profits
� Company income tax collections as a percentage of tax revenue appropriately reflect the economic environment and policy settings
� Improvements in effective tax rates (eg tax to income, tax to assets and tax to profit) for the LB&I population and for particular sub groups such as industries, foreign owned entities and higherconsequence taxpayers
Reputation/engagement
� Improvements in client survey results� Increased external participation in tax forums� Favourable feedback from taxpayers, advisors and key
stakeholders indicating that they are confident in our administration and are engaged in cooperative approaches
Taxpayer Behaviours
� Change in RDF ratings with movement to the left of the framework� Increase in the number of taxpayers entering into ACAs and APAs� Increase in the number of taxpayers alerting us to potential risks� Greater transparency of taxpayers’ business and tax affairs� Increase in number of taxpayers applying for rulings � Greater co-operation in the provision of information� Increase in voluntary disclosures � Reduction in risks identified
STRATEGY OVERVIEWWe will encourage willing participation by working closely with our higher consequence taxpayers to identify and quickly resolve contentious matters. For our lower consequence taxpayers we will provide efficient and consistent treatment of compliance concerns.
Objectives for the yearOver the next 12 months, key compliance focus areas include base erosion and profit shifting, consolidation cost-setting and rights to future income, OBUs, exploration expenditure and R&D incentives. Another major focus will be implementation of a package of law changes announced in the May Budget.
Support� real-time resolution� greater certainty
� reduced compliance costs
Encourage� engage early� transparency
� promote sound tax risk management
Champion� help shape
administration, tax policy and law
� advise government
Protect� differentiated
approaches� flexible, tailored
treatment strategies
Enhance� improve capability to
manage risk
Quadrant 4: Lower risk taxpayers� Regular monitoring via risk filters and qualitative
intelligence
UNCLASSIFIED
� Medium risk taxpayers are managed through a mix of project -based activity, near real-time reviews (on taxpayers that may have a number of ‘filter hits’) and real-time activities
� The majority of our risk reviews this year will have a more comprehensive focus
� Projects can be for assurance, scoping and compliance purposes
Quadrant 1 & 2: Higher risk and key taxpayers� Continue to detect risk through a combination of
qualitative intelligence – case and industry insights – and quantitative intelligence – macro analysis of return and other data – supported by industry, topic or case expertise.
LB&I broad risk strategies are encapsulated in a risk bow tie which provides an end to end view of risk management in LB&I. These approaches are used at a market, industry and risk topic level. Each of our compliance risks has a risk owner/manager who is responsible for developing and implementing plans to address their risk. Each of the 6 broad industries has an industry leader responsible for developing strategies to manage compliance risks in their industry. These two groups work together to manage risk across LB&I.

Energy & Resources industry strategy 2013-2014
OUR STRATEGIES (deter, detect, deal with)
� Regular review and data analysis across the income tax return label fields and disclosures under Reportable Tax Positions (RTP) and International Dealings (IDS) schedules to detect and deal with emerging trends
� Use industry relationships and forums to build and foster improved levels of voluntary compliance and address industry issues
� Work with other tax jurisdictions through the Joint International Tax Shelter Information Centre (JITSIC) members and through formal exchanges of information (EOI). Furthermore, share experiences and development of best practice in compliance approaches with overseas tax authorities
� Build capability and share knowledge across income tax, resource rent tax, GST and Excise through the recently established Minerals and Petroleum Community of Practice that is run internally across the ATO
� Involvement with the various technical and intelligence networks to detect general emerging trends and E&R industry specific trends
� Contribute to law clarification, policy and administration by working closely with Treasury
� Work closely with taxpayers and industry bodies on the development of transparency tax reporting standards – we are playing an active role in the design and operation of the Australian pilot of the Extractive Industries Transparency initiative. We are also working with Treasury on measures to improve the transparency of Australia's business tax system
� Continuing with projects relating to exploration expenditure and mine site improvements to scope risk and clarify ATO position
� Communicate ATO view for emerging systemic risk as soon as possible via Taxpayer Alerts, tax determinations, ATO website, fact sheets etc
Specific approaches for higher risk and key taxpaye rs� Support higher consequence (Q1 and Q2) taxpayers with Senior Executive Relationship Managers – (building on the LRM initiative) and providing
them with individual Relationship Managers formerly known as KCMs
� Ensure Taxpayer Assurance Plans (TAPs) are in place and that progress of the compliance work is tracked
� PCRs conducted with relevant key taxpayers, with follow-up reviews, post lodgment, of their current financial year Income Tax Return
� ACAs to manage tax compliance in an open and transparent environment
� Using our specific products and our relationship management program to undertake governance reviews, thus obtaining assurance that corporate governance and risk management processes are operating effectively
� Participate in continuous/regular dialogue to resolve issues earlier and escalate other matters more quickly
� Identify tactical risks from Interpretive Assistance (IA) private rulings
� Communicate or escalate Foreign Investment Review Board (FIRB) applications to the relevant higher risk and key taxpayer team
� High level RDF discussion and review of rating to be conducted following lodgment of ITR 2013
INDUSTRY AT A GLANCE� Largely businesses engaged in exploring and extracting for coal, oil and gas,
metal ore, non-metallic mineral commodities, and services to mining
� 180 economic groups and single entities
� Compliance focus is on the major E&R companies that comprise 15%, but represent 85% of total income of the E&R population - all key taxpayers
� Dominated by large businesses, which typically operate at a global level and heavily export oriented. Business structures commonly used facilitate transfer pricing opportunities between international related parties
� The E&R industry is very capital intensive. There has been subdued global demand for resources with commodity prices falling in the past year. This has led to some uncertainty in the sector as it continues to focus on reducing costs. Due to changed economic conditions mining companies will focus on containing costs and potentially scaling back on investments
� Despite the changed economic conditions, energy and mineral commodity exports are projected to remain robust, largely driven by significant increases in iron ore, coal and LNG exports. Australia’s geographic proximity to Asia is a great benefit. Demand for minerals and energy from large developing countries such as China and India is expected to continue to grow.
� The E&R industry is heavily regulated at both the federal and state level
COMPLIANCE EFFECTIVENESS
OUR RISKS
Current risks� UCA – exploration expenditure, mine site
improvements, capitalised labour, blackhole expenditure
� Profit Shifting – Base erosion; Transfer pricing through the shifting of assets, risks and functions to low risk tax jurisdictions – cross border restructuring activities, marketing/service hubs, commodity pricing, related party financing, intra-group financial transactions, shipping
� Farm in/farm out arrangements
� Unbilled income by utility companies
� Mergers, acquisitions and demergers
� Consolidation – entry, exits, restructuring, rights to future income and residual cost setting
� Valuations – allocable cost allocation, market value of mining information (incl Division 855 implications)
� Financial instruments/arrangements - Debt/equity, international mismatches in entity and instrument characterisation, foreign exchange gains/losses (forex), thin capitalisation, TOFA
� Capital management – dual listed companies, synthetic disposals through hybrid and subordinated debt instruments
� Losses – misapplication of loss recoupment rules, don’t reflect genuine commercial arrangements or lack economic substance or failure to meet COT or SBT or recoupment tests
Matters of concern� Clarification of the ATO view with respect to the
treatment of exploration expenditure
� Application of the general anti-avoidance provisions of Part IVA and the transfer pricing rules
� R&D: Determination of how the new definitions for eligible R&D core and supporting activities are being applied
� A focus on higher consequence taxpayers, along with implementing PCRs have resulted in a greater emphasis on real-time deterrence. There were 13 PCRscompleted in 2012/13 with another 29 PCRs in progress.
� A number of taxpayers have shown interest in an ACA. We have agreed to one ACA and are currently negotiating 2 others. We are also seeing an increase in ruling requests and informal advice requests through the LRM initiative. There has also been a greater engagement of alternative dispute resolution processes in our case work.
� The risk profile for several higher consequence taxpayers has remained static over the past year which is expected due to the value and importance these taxpayers occupy in the industry. We have good coverage of lowerconsequence taxpayers through compliance and assurance projects such as exploration expenditure and transfer pricing projects.
STRATEGY OVERVIEW
Specific approaches for medium and lower risk taxpa yers� Undertake compliance projects to address risk areas including exploration expenditure, mine site improvements and R&D
� Undertake periodic reviews (including data mining) across ITR label fields
� Undertake specific risk reviews generated from issues identified in the compliance program and case selection processes
SUB-INDUSTRIES REVENUE PERFORMANCE ($M) WORKFLOWS 2012 YEAR TAX RETURN AND BAS ($M)
The Energy and Resources (E&R) industry is one of the strongest and best performing sectors in Australia. Tax concessions relevant to the sector combined with risks such as predominant foreign ownership, can impact tax payments significantly.
Over the next 12 months , we will focus on transfer pricing, exploration expenditure, R&D, mine site improvements and the derivation of unbilled income by utility companies. We will use real-time reviews and focussed project work to address these risk areas. We will continue to improve levels of compliance through industry relationships, involvement in industry forums and in projects such as the Extractive Industry Transparency initiative and new Treasury measures to improve the transparency of Australia's business tax system.
Source: LB&I Revenue Cube 10/07/2013
RISK DIFFERENTIATION FRAMEWORK 2013
MEDIUM RISK30
LOWER RISK70
HIGHER RISK0
KEY CLIENTS28
Additionally 22 Not required and 20 unrated
Source: LB&I Data Services Team 2/07/2013 Source: LB&I ACRPT 9/07/2013 and
IA & DM BI & R 9/07/2013 Source: LB&I Data Services Team 2/07/2013 and LB&I Revenue Management Team 17/07/2013
UNCLASSIFIED
E&R Sub Segment Total Income
Total Assets
Tax Payable
PAYG(W) FBT
Bauxite 9,633 26,645 207 281 9
Coal 26,140 69,291 1,184 973 20
Diversif ied Mining 116,964 188,054 10,151 2,541 114
Gold 13,005 55,004 427 476 16
Iron Ore 18,198 42,230 1,417 331 5
Nickel 776 1,271 6 53 3
NTER Entities 1,357 2,018 0 309 6
Other Miners 6,740 13,541 72 259 4
Petroleum 106,290 195,289 2,348 1,373 93
Mineral Sands 1,947 2,874 175 56 1
Services to Mining 15,054 14,001 278 1,001 14
Trading Houses 33,829 41,671 2,303 135 13
Utilities 45,066 159,457 307 849 19
Total 395,002 811,346 18,874 8,637 317
E&R as a % of LB&I Total 22 12 38 18 20
Note: PAYG(W) & FBT represent collections for the period 01/07/2011 to 30/06/2012
0
3,000
6,000
9,000
12,000
Div
ersi
fied
Min
ing
Pet
role
umT
radi
ng H
ouse
All
Oth
ers
Div
ersi
fied
Min
ing
Pet
role
umT
radi
ng H
ouse
All
Oth
ers
Div
ersi
fied
Min
ing
Pet
role
umT
radi
ng H
ouse
All
Oth
ers
Div
ersi
fied
Min
ing
Pet
role
umT
radi
ng H
ouse
All
Oth
ers
Div
ersi
fied
Min
ing
Pet
role
umT
radi
ng H
ouse
All
Oth
ers
Div
ersi
fied
Min
ing
Pet
role
umT
radi
ng H
ouse
All
Oth
ers
2008 2009 20112010 2012 2013
Product Fin
alis
ed 2
012
Fin
alis
ed 2
013
In p
rogr
ess
1/07
/201
3
Advice 88 84 11
Risk Review s (excl PCR) 69 61 29
PCRs 6 11 39
Other Risk Products 63 32 2
Audits 13 8 34
APA 22 2 10
ACA 0 1 4
Objections 18 17 54
Litigation 12 2 11
291 218 194
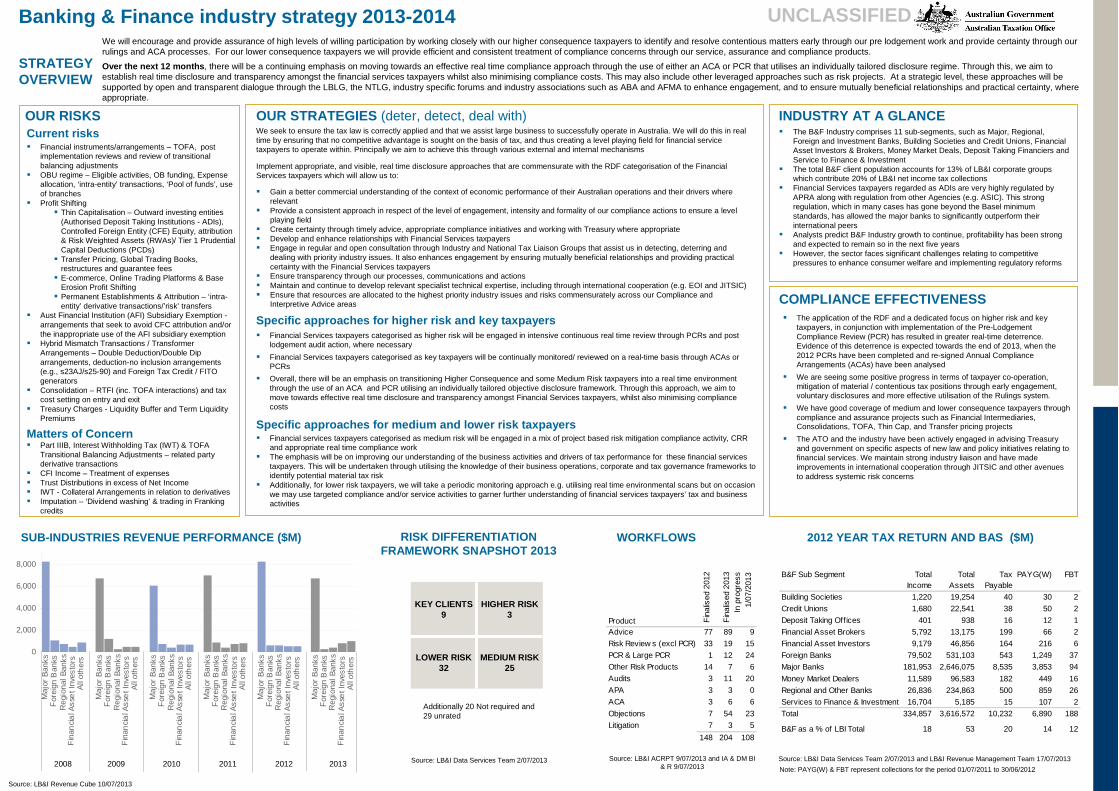
We will encourage and provide assurance of high levels of willing participation by working closely with our higher consequence taxpayers to identify and resolve contentious matters early through our pre lodgement work and provide certainty through our rulings and ACA processes. For our lower consequence taxpayers we will provide efficient and consistent treatment of compliance concerns through our service, assurance and compliance products.
Over the next 12 months , there will be a continuing emphasis on moving towards an effective real time compliance approach through the use of either an ACA or PCR that utilises an individually tailored disclosure regime. Through this, we aim to establish real time disclosure and transparency amongst the financial services taxpayers whilst also minimising compliance costs. This may also include other leveraged approaches such as risk projects. At a strategic level, these approaches will be supported by open and transparent dialogue through the LBLG, the NTLG, industry specific forums and industry associations such as ABA and AFMA to enhance engagement, and to ensure mutually beneficial relationships and practical certainty, where appropriate.
Banking & Finance industry strategy 2013-2014
OUR RISKS OUR STRATEGIES (deter, detect, deal with) We seek to ensure the tax law is correctly applied and that we assist large business to successfully operate in Australia. We will do this in real time by ensuring that no competitive advantage is sought on the basis of tax, and thus creating a level playing field for financial service taxpayers to operate within. Principally we aim to achieve this through various external and internal mechanisms
Specific approaches for higher risk and key taxpaye rs� Financial Services taxpayers categorised as higher risk will be engaged in intensive continuous real time review through PCRs and post
lodgement audit action, where necessary
� Financial Services taxpayers categorised as key taxpayers will be continually monitored/ reviewed on a real-time basis through ACAs or PCRs
� Overall, there will be an emphasis on transitioning Higher Consequence and some Medium Risk taxpayers into a real time environment through the use of an ACA and PCR utilising an individually tailored objective disclosure framework. Through this approach, we aim to move towards effective real time disclosure and transparency amongst Financial Services taxpayers, whilst also minimising compliance costs
INDUSTRY AT A GLANCE� The B&F Industry comprises 11 sub-segments, such as Major, Regional,
Foreign and Investment Banks, Building Societies and Credit Unions, Financial Asset Investors & Brokers, Money Market Deals, Deposit Taking Financiers and Service to Finance & Investment
� The total B&F client population accounts for 13% of LB&I corporate groups which contribute 20% of LB&I net income tax collections
� Financial Services taxpayers regarded as ADIs are very highly regulated by APRA along with regulation from other Agencies (e.g. ASIC). This strong regulation, which in many cases has gone beyond the Basel minimum standards, has allowed the major banks to significantly outperform their international peers
� Analysts predict B&F Industry growth to continue, profitability has been strong and expected to remain so in the next five years
� However, the sector faces significant challenges relating to competitive pressures to enhance consumer welfare and implementing regulatory reforms
COMPLIANCE EFFECTIVENESS
Current risks� Financial instruments/arrangements – TOFA, post
implementation reviews and review of transitional balancing adjustments
� OBU regime – Eligible activities, OB funding, Expense allocation, ‘intra-entity’ transactions, ‘Pool of funds’, use of branches
� Profit Shifting � Thin Capitalisation – Outward investing entities
(Authorised Deposit Taking Institutions - ADIs), Controlled Foreign Entity (CFE) Equity, attribution & Risk Weighted Assets (RWAs)/ Tier 1 Prudential Capital Deductions (PCDs)
� Transfer Pricing, Global Trading Books, restructures and guarantee fees
� E-commerce, Online Trading Platforms & Base Erosion Profit Shifting
� Permanent Establishments & Attribution – ‘intra-entity’ derivative transactions/’risk’ transfers
� Aust Financial Institution (AFI) Subsidiary Exemption -arrangements that seek to avoid CFC attribution and/or the inappropriate use of the AFI subsidiary exemption
� Hybrid Mismatch Transactions / Transformer Arrangements – Double Deduction/Double Dip arrangements, deduction-no inclusion arrangements (e.g., s23AJ/s25-90) and Foreign Tax Credit / FITO generators
� Consolidation – RTFI (inc. TOFA interactions) and tax cost setting on entry and exit
� Treasury Charges - Liquidity Buffer and Term Liquidity Premiums
Matters of Concern� Part IIIB, Interest Withholding Tax (IWT) & TOFA
Transitional Balancing Adjustments – related party derivative transactions
� CFI Income – Treatment of expenses� Trust Distributions in excess of Net Income� IWT - Collateral Arrangements in relation to derivatives� Imputation – ‘Dividend washing’ & trading in Franking
credits
� The application of the RDF and a dedicated focus on higher risk and key taxpayers, in conjunction with implementation of the Pre-Lodgement Compliance Review (PCR) has resulted in greater real-time deterrence. Evidence of this deterrence is expected towards the end of 2013, when the 2012 PCRs have been completed and re-signed Annual Compliance Arrangements (ACAs) have been analysed
� We are seeing some positive progress in terms of taxpayer co-operation, mitigation of material / contentious tax positions through early engagement, voluntary disclosures and more effective utilisation of the Rulings system.
� We have good coverage of medium and lower consequence taxpayers through compliance and assurance projects such as Financial Intermediaries, Consolidations, TOFA, Thin Cap, and Transfer pricing projects
� The ATO and the industry have been actively engaged in advising Treasury and government on specific aspects of new law and policy initiatives relating to financial services. We maintain strong industry liaison and have made improvements in international cooperation through JITSIC and other avenues to address systemic risk concerns
STRATEGY OVERVIEW
Specific approaches for medium and lower risk taxpa yers� Financial services taxpayers categorised as medium risk will be engaged in a mix of project based risk mitigation compliance activity, CRR
and appropriate real time compliance work� The emphasis will be on improving our understanding of the business activities and drivers of tax performance for these financial services
taxpayers. This will be undertaken through utilising the knowledge of their business operations, corporate and tax governance frameworks to identify potential material tax risk
� Additionally, for lower risk taxpayers, we will take a periodic monitoring approach e.g. utilising real time environmental scans but on occasion we may use targeted compliance and/or service activities to garner further understanding of financial services taxpayers’ tax and business activities
SUB-INDUSTRIES REVENUE PERFORMANCE ($M) WORKFLOWSRISK DIFFERENTIATION FRAMEWORK SNAPSHOT 2013
2012 YEAR TAX RETURN AND BAS ($M)
Source: LB&I Revenue Cube 10/07/2013
MEDIUM RISK25
LOWER RISK32
HIGHER RISK 3
KEY CLIENTS9
Additionally 20 Not required and 29 unrated
Source: LB&I Data Services Team 2/07/2013 Source: LB&I ACRPT 9/07/2013 and IA & DM BI & R 9/07/2013
Source: LB&I Data Services Team 2/07/2013 and LB&I Revenue Management Team 17/07/2013
Implement appropriate, and visible, real time disclosure approaches that are commensurate with the RDF categorisation of the Financial Services taxpayers which will allow us to:
UNCLASSIFIED
� Gain a better commercial understanding of the context of economic performance of their Australian operations and their drivers where relevant
� Provide a consistent approach in respect of the level of engagement, intensity and formality of our compliance actions to ensure a level playing field
� Create certainty through timely advice, appropriate compliance initiatives and working with Treasury where appropriate� Develop and enhance relationships with Financial Services taxpayers� Engage in regular and open consultation through Industry and National Tax Liaison Groups that assist us in detecting, deterring and
dealing with priority industry issues. It also enhances engagement by ensuring mutually beneficial relationships and providing practical certainty with the Financial Services taxpayers
� Ensure transparency through our processes, communications and actions� Maintain and continue to develop relevant specialist technical expertise, including through international cooperation (e.g. EOI and JITSIC)� Ensure that resources are allocated to the highest priority industry issues and risks commensurately across our Compliance and
Interpretive Advice areas
Note: PAYG(W) & FBT represent collections for the period 01/07/2011 to 30/06/20122008 2009 2010 2011 2012 2013
0
2,000
4,000
6,000
8,000
Maj
or B
a nk s
For
eig n
Ban
ksR
e gio
nal B
anks
Fi n
a nci
al A
s se
t In v
e sto
rsA
ll o t
her
s
Ma j
o r B
anks
For
eig n
Ba n
k sR
e gi o
n al B
a nk s
Fin
a nc i
al A
s se
t Inv
e st o
rsA
ll ot
her
s
Maj
o r B
anks
Fo r
eign
Ba n
k sR
egio
n al B
a nk s
Fin
anci
al A
sse
t Inv
esto
r sA
l l o t
he r
s
Maj
or B
a nk s
For
e ign
Ban
ksR
e gi o
n al B
a nk s
Fin
anci
al A
sse
t In v
esto
rsA
ll o t
her
s
Ma j
or B
a nk s
For
eig n
Ba n
ksR
egio
n al B
a nk s
Fi n
a nc i
al A
s se
t In v
e sto
rsA
ll ot
her
s
Ma j
o r B
anks
Fo r
eig n
Ba n
k sR
egio
nal B
anks
Fin
a nc i
al A
s se
t Inv
e st o
rsA
ll ot
he r
s
Product Fin
alis
ed 2
012
Fin
alis
ed 2
013
In p
rogr
ess
1/07
/201
3
Advice 77 89 9
Risk Review s (excl PCR) 33 19 15
PCR & Large PCR 1 12 24
Other Risk Products 14 7 6
Audits 3 11 20
APA 3 3 0
ACA 3 6 6
Objections 7 54 23
Litigation 7 3 5
148 204 108
B&F Sub Segment Total Income
Total Assets
Tax Payable
PAYG(W) FBT
Building Societies 1,220 19,254 40 30 2
Credit Unions 1,680 22,541 38 50 2
Deposit Taking Offices 401 938 16 12 1
Financial Asset Brokers 5,792 13,175 199 66 2
Financial Asset Investors 9,179 46,856 164 216 6
Foreign Banks 79,502 531,103 543 1,249 37
Major Banks 181,953 2,646,075 8,535 3,853 94
Money Market Dealers 11,589 96,583 182 449 16
Regional and Other Banks 26,836 234,863 500 859 26
Services to Finance & Investment 16,704 5,185 15 107 2
Total 334,857 3,616,572 10,232 6,890 188
B&F as a % of LBI Total 18 53 20 14 12

We will encourage high levels of willing participation by working closely with our higher consequence taxpayers to identify and resolve contentious matters early through our pre lodgment work and provide certainty through our rulings and ACA processes. For our lower consequence taxpayers we will provide efficient and consistent treatment of compliance concerns through our service, assurance and compliance products.
Over the next 12 months , we will focus on the level of reserving by general insurance companies, the interaction of consolidation and TOFA regimes with the specific statutory codes for life and general insurance companies, and the treatment of tax deferred distributions paid by trusts. We will also be conducting risk assessment focussed project work on health insurers, general insurers OCL documentation and MITs to detect non-compliance and risk within the tax system enabling the design ofnecessary mitigation strategies.
Insurance industry strategy 2013-2014
OUR RISKS OUR STRATEGIES (deter, detect, deal with) � Dovetail into LB&I strategy in terms of RDF and ‘bowtie model’ approach
� Deal with high consequence taxpayers through reviews, audits, ACAs, PCRs and lower consequence taxpayers (or widespread risks) through projects
� Review and develop strategies for disclosures under RTP schedules
� Law clarification through rulings, industry fora etc
� Detection from intelligence, risk reviews, RTP, life schedules, tax return design etc
� Review potential for ACAs with insurance groups
� Enhanced EOI dialogue with other tax jurisdictions
� Discussions and liaisons with industry bodies and RDF conversations
� Input and influence in law clarification, policy implementation and administration by working closely with Treasury
� Ensure industry specialisation knowledge and best practice of the insurance sector is maintained through regular interaction and liaison across Sydney, Box Hill, Brisbane and Parramatta ATO sites
Specific approaches for higher risk and key taxpaye rs� Ensure compliance work in progress is tracking in accordance with plans
� Continue regular dialogue with relevant key taxpayers during PCR process to resolve issues earlier and follow-up with reviews after lodgment of their current financial year Income Tax Return
� Ongoing evaluation of risk rating
� Identify, communicate and address key risks across the financial services industry
INDUSTRY AT A GLANCE� LB&I has responsibility for all general and life companies registered with Australian
Prudential Regulation Authority (APRA) irrespective of turnover level as well as Managed Investment Trusts (MITs) over $250m
� Insurance industry consists of 3 main sub-segments – general, life, health insurances and has close links with the trust based managed funds and superannuation sectors
� Highly regulated by APRA and Primary Health Insurance Administration Council (PHIAC) with specific legislation and concessional tax treatment for some categories of life insurance business
� The insurance industry comprises a number of domestic and foreign entities some of which are associated with the banking sector. These entities usually operate internationally
� While general insurance and some life insurance business involves risk policies, a very significant part of life insurance business consists of investment, income stream and retirement savings products
� Decline in revenue over recent years due to natural disasters and continuing volatile investment market
COMPLIANCE EFFECTIVENESS
Current risksLife insurance groups including Division 320� Interaction of TOFA, consolidation and Div. 320� Segregation mechanism for assets in complying superannuation/FHSA asset pool and segregated
exempt assets, including transfer values and annual valuations� TOFA elections carve out for life insurance business and interaction with members of group that
made TOFA elections� Consolidation treatment of intangible assets of life insurers and funds managers (including RTFI
rules)� Div. 320 / consolidation interactions in groups with life insurance companies including treatment of
acquired tax benefits � Treatment of deferred tax assets under Division 320 valuation mechanisms� Part 9 transfers of life insurance businesses – treatment of assets and liabilities on transfer of
business� Foreign investment, FX gains/losses and FITO calculations� Profit shifting - Thin Capitalisation including application of safe harbour rules to insurance business
assets of a group with an outward investing ADI� Permanent Establishments & Attribution – ‘intra-entity’ derivative transactions/’risk’ transfersGeneral insurance groups including Division 321� Valuation & documentation of insurance liabilities under Division 321 for tax purposes� International taxation of insurance business, including branches, subsidiaries and re-insurance � Interaction with consolidation and TOFA legislationHealth insurance groups� Establishing the income tax treatment of underwriting profits or losses arising from health insurance
business, given the scope of the term ‘general insurance company’ for Division 321 purposes� Transition from non-taxable to taxable status – including Division 57 of Schedule 2D to the ITAA
1936, consolidation issues and demutualisation� Income tax treatment of overhead expenses attributable to both non-taxable health insurance
business and other taxable business within a single economic groupManaged Investment Trusts/Public Unit Trusts� Capital and Revenue Losses
� Capital account treatment rules and withholding and related requirements on fund payments
� General application of Division 6 of ITAA 1936 including the determination and calculation of the trust’s net income including the trustee’s liability to pay tax under section 98 and 99A
� Treatment of amounts received by the trust from underlying trustees in excess of the net income of those trusts
Matters of concern� Integrity and assurance relating to the PAYG instalment calculations� Isolated and significant transactions
� The application of the RDF and a dedicated focus on key taxpayers, along with implementation of the Pre-Lodgement Compliance Review (PCR) has resulted in a greater emphasis on real-time deterrence. Evidence of the impact of real time activities is expected to manifest towards the end of the 2013 calendar year, when the PCR's on the 2012 financial year have been completed
� We continue to see some positive progress in terms of taxpayer co-operation and engagement for example through the ruling program and more open dialogue. Significantly, we have now seen 2 taxpayers shifted from a higher risk category to key taxpayer
� We have good coverage of lower consequence taxpayers through projects covering MITs, trusts, general and health insurance
� ATO and industry have been actively engaged in advising Treasury and government on insurance specific aspects of new law and policy initiatives particularly in relation to trusts and life insurance
STRATEGY OVERVIEW
Specific approaches for medium and lower risk taxpa yers� Undertake compliance projects to address risk areas
� Undertake specific risk reviews generated from issues identified in the compliance program and case selection processes such as MIT withholding and governance review
RISK DIFFERENTIATION FRAMEWORK 2013
WORKFLOWS 2012 YEAR TAX RETURN AND BAS ($M)SUB-INDUSTRIES REVENUE PERFORMANCE ($M)
Source: LB&I Revenue Cube 26/03/2013
MEDIUM RISK12
LOWER RISK43
HIGHER RISK 0
KEY CLIENTS5
Additionally 13 Not required and 36 unrated
Source: LB&I Data Services Team 2/07/2013 Source: LB&I ACRPT 9/07/2013 andIA & DM BI & R 9/07/2013
Source: LB&I Data Services Team 2/07/2013 and LB&I Revenue Management Team 17/07/2013
UNCLASSIFIED
Insurance Sub Segment Total Income
Total Assets
Tax Payable
PAYG(W) FBT
Insurance Brokers 640 1,403 37 77 3
General Insurance 43,233 111,477 842 718 38
Health Insurance 12,938 41,344 153 190 3
Life Insurance 35,954 174,546 751 407 8
Trusts 7,291 55,061 0 1 0
Total 100,058 383,831 1,783 1,394 52
Insurance as a % of LBI Total 6 6 4 3 3
Note: PAYG(W) & FBT represent collections for the period 01/07/2011 to 30/06/2012
2008 2009 2010 2011 2012 2013
0
500
1,000
1,500
2,000
I nsu
ranc
e B
roke
rsG
e ne r
al In
s ur a
n ce
He a
lt h I n
s ura
nce
Lif e
I ns u
ran
c e
Ins u
r an c
e B
r ok e
rsG
ener
a l In
sura
nce
He a
lt h I n
s ura
nce
Lif e
I ns u
ran
c e
Ins u
r an c
e B
r ok e
rsG
ener
a l In
sura
nce
He a
lt h I n
s ura
nce
L ife
Insu
ran
ce
Insu
ran c
e B
rok e
r sG
e ne r
al In
s ur a
n ce
Hea
lth In
sura
n ce
L ife
Insu
ran
ce
I ns u
ranc
e B
roke
rsG
e ne r
al In
sur a
n ce
Hea
lth In
sura
n ce
L ife
Insu
ran
ce
I ns u
ranc
e B
roke
rsG
e ne r
al In
sura
n ce
He a
lt h I n
s ura
nce
Lif e
I ns u
ran
c e
Product
Fin
alis
ed 2
012
Fin
alis
ed 2
013
In p
rogr
ess
1/07
/201
3
Advice 33 12 8
Risk Review s (excl PCR) 13 14 13
PCR & Large PCR 1 2 11
Other Risk Products 4 1 1
Audits 4 3 5
APA 0 0 0
ACA 0 0 0
Objections 6 7 3
Litigation 1 1 3
62 40 44

We will encourage, and provide assurance of, high levels of willing participation by working closely with our higher consequence taxpayers to identify and resolve contentious matters early through our pre lodgment work and we will provide certainty through our rulings program. For our lower consequence taxpayers we will provide efficient and consistent treatment of compliance concerns through our service, assurance and compliance products. We enhance our effectiveness in these areas through the specialist support we provide to the development of superannuation policy and legislation.
Over the next 12 months , we will focus on improving our real-time monitoring and support products to review large fund compliance with their income tax obligations including consideration of some industry specific risks and issues. We engage with key taxpayers and industry bodies to address risks early and maintain post lodgement compliance reviews on a project basis. We will continue in deterring, detecting and dealing with non-compliance with income tax obligations.
Superannuation industry strategy 2013-2014
OUR STRATEGIES (deter, detect, deal with)
Some specific strategies include:� Engaging key taxpayers on a real time basis using PCRs and real-time reports � Working co-operatively with funds to identify anomalies and unintended consequences of legislation � Conducting project work where warranted to review risks/anomalies and/or address industry concerns� Undertaking active compliance work to address individual and industry risks� Clarifying the law via input into public rulings and other advice/alert products
� Undertaking industry consultation and participating in industry forums to build and foster improved levels of voluntary compliance and address industry issues
� Contributing to and influencing law clarification and superannuation policy� Tax time work including maintenance of the Fund income tax return and aspects of the Company income tax return
Specific approaches for higher risk and key taxpaye rs� Ensure Taxpayer Assurance Plans (TAPs) are implemented and progress of the compliance work is tracked
� Pre-lodgment Compliance Reviews are conducted with relevant key taxpayers, with follow-up reviews after lodgment of their current financial year’s Income Tax Return
� Encourage and participate in continuous/regular dialogue to resolve issues earlier or escalate other matters more quickly� Address real-time enquiries that provide us with up to date information regarding the drivers behind assessable income on a quarterly basis
INDUSTRY AT A GLANCE� Superannuation is regulated by ATO, APRA and ASIC.
� 76 LB&I superannuation funds in 5 sub-industries – retail funds, public sector funds, pooled superannuation trusts, industry funds and employer corporate sponsors
� Industry is subject to frequent legislative change which has an impact on costs of compliance and member choice
� Specific legislation: although fund risks can be different from those facing other LB&I taxpayers and self-managed super funds
� Superannuation is a key source of funds in the wealth management industry
� Industry is currently undergoing a significant number of mergers due to the impact of recent policy announcements
� Revenue reached an historic high in 2012 on the back of steady assessable contributions, higher investment income and forex gains
� Revenue collections remain volatile, in part due to the volatility of the Australian dollar impacting forex gains/losses and inconsistent investment performance
COMPLIANCE EFFECTIVENESS� We engage with key taxpayer funds through the real-time report and pre-
compliance lodgement review process
� We use intelligence gathered from PCRs to influence administration of new and existing measures
� We influence development of superannuation policy and legislation
� We are observing positive progress in terms of taxpayer co-operation, engagement and deterrence through our PCR and real-time report processes
� Significantly, we have influenced a positive movement in the risk profile of a number of higher consequence taxpayers
� We maintained a good coverage of the industry through project reviews on treatment of merger costs, imputation credits, use of capital losses and exempt current pension income
STRATEGY OVERVIEW
Specific approaches for medium and lower risk taxpa yers� Address compliance risks utilising a leveraged project- based approach. Maintain watching briefs for major superannuation fund
mergers
� Undertake reviews encompassing issues identified in the compliance program and case selection processes
OUR RISKS
Current risks� Group life deductions including deductibility of
total and permanent disability premiums� Understanding the strategies and products
emerging from the move to post-tax reporting of investment returns
� Capital Gains Tax (CGT) loss rollover relief� Exempt current pension income claims
� Foreign investment, Foreign exchange gains and losses, and FITO calculations
� Determination of trust income and the treatment of distributions
� CGT reporting and in particular capital loss utilisation
� Over-claiming of franking credits� Correct treatment of assessable contributions
Matters of concern� Isolated and significant transactions
� Dividend washing transactions
� Correct reporting instalment income with specific focus on assessable and exempt income
� Treatment of merger costs
We recognise that large funds are subject to prudential regulation by APRA and generally compliant with their income tax obligations and that non compliance by funds often arises from a misapplication, misunderstanding or alternative view of the law rather than by a scheme to avoid tax. Our strategy has a major focus on championing the interest of funds and encouraging them to comply as well as deterring, detecting and dealing with non-compliance with the law in real-time. To implement our strategy we utilise a range of products and techniques covering guidance, support, consultation, risk assessment and active compliance functions.
RISK DIFFERENTIATION FRAMEWORK 2013
WORKFLOWS 2012 YEAR TAX RETURN AND BAS ($M)SUB-INDUSTRIES REVENUE PERFORMANCE ($M)
Source: LB&I Revenue Cube 10/07/2013
MEDIUM RISK20
LOWER RISK44
HIGHER RISK 0
KEY CLIENTS7
Additionally 1 unrated
Source: LB&I Data Services Team 2/07/2013 and LB&I Revenue Management Team 14/03/2013
Source: LB&I ACRPT 9/07/2013 and IA & DM BI & R 9/07/2013
Source: LB&I Data Services Team 2/07/2013 and LB&I Revenue Management Team 17/07/2013
UNCLASSIFIED
Note: PAYG(W) & FBT represent collections for the period 01/07/2011 to 30/06/2012
Superannuation Sub Segment Total Income
Total Assets
Tax Payable
PAYG(W) FBT
Employer Sponsored or Corporate Funds 5,887 39,686 391 23 0
Industry or Aw ard Funds 38,664 225,325 2,839 197 2
Approved Deposit Fund/ Pooled Super Trust 9,356 63,464 798 0 0
Public Sector Funds 29,535 117,288 2,333 117 0
Retail or Public Offer Funds 23,917 298,109 762 93 0
TOTAL 107,360 743,872 7,123 429 2
Superannuation as a % of LBI Total 6 11 14 1 0
2008 2009 2010 2011 2012 2013
0
1,000
2,000
3,000
4,000
Indu
stry
or
Aw
ar d
Fun
dsR
e tai
l or
Pu
b lic
Offe
r F u
nds
App
rov e
d D
epo
s it
F un
d/ P
o ol e
d S
upe
r T r
u st
Pu b
lic S
ecto
r F
u nd s
Em
p loy
er S
p on s
o re d
or
Co r
pora
te F
u nd s
Ind u
s try
or
Aw
ard
Fu n
d sR
etai
l or
Pu
bli c
Offe
r Fu
nd s
Ap p
rove
d D
e po
sit
Fun
d / P
oole
d S
up e
r Tr
ust
Pub
lic S
e cto
r F
unds
Em
plo y
e r S
pons
ored
or
Cor
p or a
te F
unds
Indu
stry
or
Aw
ar d
Fun
dsR
e tai
l or
Pu
b lic
Offe
r F u
nds
App
rov e
d D
epo
s it
F un
d/ P
o ol e
d S
upe
r T r
u st
Pu b
lic S
ecto
r F
u nd s
Em
p loy
er S
p on s
o re d
or
Co r
pora
te F
u nd s
Indu
stry
or
Aw
ar d
Fun
dsR
e tai
l or
Pu
b lic
Of fe
r Fu
nd s
App
rov e
d D
epo
s it
F un
d/ P
o ole
d S
upe
r T r
u st
Pub
lic S
ecto
r F
u nd s
Em
p loy
er S
p on s
o re d
or
Cor
pora
t e F
unds
Ind u
s try
or
Aw
ard
Fu n
d sR
eta i
l or
Pu
bli c
Offe
r F u
nds
Ap p
rove
d D
e po
sit
Fun
d / P
oole
d S
up e
r Tr
ust
Pu b
l ic S
e cto
r F
unds
Em
plo y
e r S
pons
ored
or
Co r
p ora
te F
u nd s
Indu
str y
or
Aw
ard
Fun
dsR
e tai
l or
Pu
b lic
Of fe
r Fu
nd s
Ap p
rov e
d D
epo
sit
F un
d/ P
o ole
d S
upe
r T r
ust
Pub
lic S
ect o
r F
u nd s
Em
p loy
er S
p on s
o re d
or
Cor
pora
t e F
unds
Product Fin
alis
ed 2
012
Fin
alis
ed 2
013
In p
rogr
ess
1/07
/201
3
Advice 8 6 2
Risk Review s (excl PCR) 29 16 17
PCRs 8 7 7
Other Risk Products 10 10 1
Audits 0 1 0
APA 0 0 0
ACA 0 0 0
Objections 4 12 1
Litigation 0 0 0
59 52 28

The Manufacturing sector is made up of a number of highly diversified industries and taxpayers, the activities of which do not usually demonstrate systemic industry level risk, but rather risks tend to be more general in nature at the individual taxpayer level (eg. Capital Gains / Losses, etc.).
Over the next 12 months there will be a focus on those industries with the greatest total income and assets. We will continue to work with our Higher Consequence taxpayers through the real-time PCR and APA programs. Both Higher and Lower Consequence taxpayers will continue to be monitored and reviewed. The level and intensity of compliance focus will be determined by the extent that those taxpayers exhibit characteristics which align with our current risks or matters of concerns.
Manufacturing industry strategy 2013-2014
OUR STRATEGIES (deter, detect, deal with) � Regularly review data analysis across the income tax return (ITR) label fields and disclosures under RTP schedules to detect and deal with emerging
trends
� Use the Manufacturing Sector reports (and others) to detect changes in the 13 industries and taxation aspects resulting from or contributing to these changes
� Work with other tax jurisdictions through the Joint International Tax Shelter Information Centre (JITSIC) members and through formal exchanges of information (EOI)
� Contribute and influence law clarification, policy and administration by working with Treasury
� Communicate ATO view for emerging systemic risks as soon as possible via Taxpayer Alerts, determinations, external ATO site, fact sheets etc
� Where there are similar risk hits detected within an industry (on current, emerging or newly detected) then a broader sampling of all taxpayers within that industry for that risk will be undertaken
� Deal with Higher Consequence taxpayers through risk reviews, audits, ACAs, PCRs, and Lower Consequence taxpayers through risk reviews and projects as necessary
Specific approaches for higher risk and key taxpaye rs� Higher Risk and Key Taxpayers (Higher Consequence taxpayers) have Senior Executive Relationship Managers and Relationship Manager support
� Use of the Manufacturing Sector reports (and others) to identify risks linked to Higher Consequence taxpayers
� Identification of risks from Interpretive Assistance private rulings
� Consider, evaluate and encourage the Higher Consequence taxpayers to enter into an ACA
� Real time activity through compliance products including PCRs and ACAs
� Regular dialogue with Higher Consequence taxpayers to resolve issues earlier and escalate other matters more quickly
� Specifically deal with Higher Consequence taxpayers exhibiting characteristics that align with our current risks or matters of concerns
� Ensure Taxpayer Assurance Plans are in place for each Higher Consequence taxpayer
� Deal with Higher Consequence taxpayers through risk reviews, audits as necessary
INDUSTRY AT A GLANCE� Manufacturing is the function or conversion of components into new products
� There are 13 industries in the manufacturing sector across a diverse range of activities, sub-divisions and specialist focus areas
� The top 5 economic groups by total income are in 5 different industries and account for approximately 12% of the Manufacturing industries total income
� Industries have significant levels of foreign ownership
� Significant private corporate structures are prevalent
� Manufacturing has been severely impacted by recent economic events, environmental impacts, the high $A and pressure from overseas competition
� Manufacturing’s share of LB&I revenue is decreasing in relative terms to LB&I (10% of total), and in real terms to growth of the greater economy, however the segment still accounts for in excess of 30% of PAYG(W) and 55% of LB&I GST collections
� There are no income tax codes specific to the industry
� Compliance risks identified in Manufacturing tend not to be systemic industry risks but rather generic in nature at the individual taxpayer level
COMPLIANCE EFFECTIVENESS
OUR RISKS Current risks� Profit Shifting
� Transfer pricing
� International re-organisations (incl. marketing hubs where there is a shift of functions, assets or risks to low tax jurisdictions)
� Alienation of intellectual property with values inconsistent with the arms length principle
� Debt levels of entities that satisfy the safe harbour amount test but have significant asset revaluation values for thin capitalisation purposes
� Corporate restructures incl. mergers and acquisition arrangements where tax and economic outcomes are not aligned
� Consolidation – incorrect or contrived application of cost setting rules on entry or exit, RFTI and RTCS
� Private Equity Exits – where certain transactions are entered into immediately prior to the disposal of a private equity target investment to avoid tax on sale proceeds, or incorrectly characterised as a capital gain
� Stapled Groups, financial arrangements / practices designed to generate deductions for what is effectively an equity return to investors via a stapled trust
� Losses – misapplication of loss recoupment rules, don’t reflect genuine commercial arrangements or lack economic substance or failure to meet COT or SBT or recoupment tests
� Research & Development – what can be claimed as R&D expenditure
� Positive movement in the risk profile of a number of the higher consequence taxpayers
� Increased activity focussed on the adoption of ACAs and APAs
� An increased take-up of the opportunity to seek certainty through the ruling program
� Greater capacity for input of intelligence (by teams) to the case selection process
� Appropriate coverage of the industries through effective compliance strategies
STRATEGY OVERVIEW
Specific approaches for medium and lower risk taxpa yers� Undertake periodic reviews (including data mining) across ITR label fields
� Use the Manufacturing Sector report (and others) to identify risks linked to Medium and Lower risk taxpayers
� Where there are risk hits detected in a Higher Consequence taxpayer population, then a broader sampling of Medium and lower risk taxpayers within that industry will be undertaken
� Undertake risk reviews generated from issues identified in the compliance program and case selection processes
� Deal with Lower Consequence taxpayers through project based risk reviews and audits as necessary
By applying the RDF and the adoption of the real-time approach (through products such as the APA and PCR), it would be expected that there will be continued;
RISK DIFFERENTIATION FRAMEWORK 2013
WORKFLOWS 2012 YEAR TAX RETURN AND BAS ($M)
Source: LB&I Revenue Cube 10/07/2013
MEDIUM RISK86
LOWER RISK280
HIGHER RISK 2
KEY CLIENTS20
Additionally 93 Not required and 52 unrated
Source: LB&I Data Services Team 2/07/2013 Source: LB&I ACRPT 9/07/2013 & IA & DM BI & R 9/07/2013
Source: LB&I Data Services Team 2/07/2013 and LB&I Revenue Management Team 17/07/2013
UNCLASSIFIED
Manufacturing Sub Segment Total Income
Total Assets
Tax Payable
PAYG(W) FBT
Agriculture 26,423 22,360 116 454 14
Beverage 17,632 46,444 274 606 35
Chemical and Assoc Products 42,954 40,020 710 1,452 88
Food 67,139 49,234 429 1,506 42
Machinery and Equipment 45,497 58,255 648 2,276 88
Other Manufacturing 18,886 18,326 238 380 19
Metal Product 24,070 42,529 121 880 27
Motor Vehicles and Associated Industries 52,326 48,210 687 840 59
Non Metalic Mineral Product 15,660 29,063 182 599 26
Property and Constructions 105,270 350,403 588 5,824 128
Textiles Clothing & Footw ear 3,745 4,543 31 182 5
Tobacco 7,837 3,542 386 93 14
Wood & Paper Products & Printing 13,513 28,607 67 553 20
Total 440,951 741,536 4,478 15,644 563
Manufacturing as a % of LBI Total 24 11 9 32 35
Note: PAYG(W) & FBT represent collections for the period 01/07/2011 to 30/06/20122012 2013
-200
0
200
400
600
800
1,000
Pro
per t
y an
d C
o nst
ruct
ions
Che
mic
a l a
nd A
sso c
Pro
duct
s
Mac
hin
ery
a nd
Equ
ipm
e nt
Bev
erag
e
Foo
dM
oto
r Ve h
icle
s a n
d A
sso c
i ate
d In
dus
trie
s
Me t
al P
rod u
c tT
e xti l
es C
lot h
ing
& F
oo t
wea
r
To b
a cc o
No n
Me
talic
Mi n
e ral
Pr o
d uc t
Oth
e r M
a nu f
actu
ring
Wo
od &
Pa p
e r P
rod u
c ts
& P
r inti n
g
Ag r
icul
t ure
Pro
p er t
y an
d C
onst
ruc t
ions
Ch e
mic
al a
n d A
ssoc
Pro
d uc t
s
Mac
hin
ery
a nd
Equ
ipm
ent
Be v
e ra g
e
Foo
dM
o to
r Veh
icl e
s an
d A
ssoc
iate
d In
du s
trie
sM
e ta
l Pr o
d uc t
Tex
tile s
Clo
thin
g &
Fo
otw
e ar
To b
a cco
Non
Me
t alic
Min
era l
Pro
duct
Oth
e r M
a nu f
actu
r ing
Wo
od &
Pap
er P
rodu
cts
& P
rintin
g
Ag r
icu l
ture
SUB-INDUSTRIES REVENUE PERFORMANCE ($M)
Product Fin
alis
ed 2
012
Fin
alis
ed 2
013
In p
rogr
ess
1/07
/201
3
Advice 96 91 21
Risk Review s (excl PCR) 110 64 49
PCRs 7 19 28
Other Risk Products 107 65 17
Audits 21 22 21
APA 13 13 27
ACA 0 1 3
Objections 10 30 24
Litigation 22 10 15
386 315 205

We will encourage and provide assurance of high levels of willing participation by working closely with our higher consequence taxpayers to identify and resolve contentious matters early through our pre lodgement work and provide certainty through our rulings and ACA processes. For our lower consequence taxpayers we will provide efficient and consistent treatment of compliance concerns through our service, assurance and compliance products.
Over the next 12 months , we will look to improve our understanding of the key sub industries in Sales and Services (S&S) such as Retail, Telecommunications and Information Technology. One particular focus across all industries will be the effect of e-commerce and globalisation on the way business is done and the tax implications of this. In this context, we will also be looking at the value chain of multinational corporations and plan to commence a project in the service segment to identify potential risks in this area.
Sales & Services industry strategy 2013-2014
OUR STRATEGIES (deter, detect, deal with)
Specific approaches for higher risk and key taxpaye rs� Manage compliance and other interactions with higher consequence taxpayers under a Taxpayer Assurance Plan; this includes tailoring
approaches and products in accordance with a taxpayer’s risk profile
� Higher consequences taxpayers have Senior Executive Relationship Managers (SERMs) and Relationship Manager support as appropriate
� All higher consequence taxpayers will be involved in cooperative compliance product – such as an ACA, which offers higher levels of certainty or a PCR; the mainstay of these products will be an understanding of a taxpayer’s tax risk governance process
� Ensure regular and open dialogue with higher consequence taxpayers and their representatives
Specific approaches for medium and lower risk taxpa yers� Regularly run risk filters over the population to identify potential risk
� Undertake projects to further scope risk; projects planned for this sector include reviews of profit shifting and value chain
� Undertake reviews and following that audits, where indicated, for those taxpayers presenting with risk
� Single entry point into ATO via Large Service Team (formerly by KCM hub)
INDUSTRY AT A GLANCE
COMPLIANCE EFFECTIVENESS
OUR RISKSCurrent risks� E-commerce and base erosion
� Profit shifting
� Service hubs – transfer of functions offshore
� Service payments- especially for marketing support
� Related party borrowings – non commercial interest rates, deferrals
� Questionable allocation of value to functions, assets and risks especially intangibles
� Thin capitalisation – debt pushdown, questionable valuation of intangibles
� Royalty withholding tax – whether royalty withholding tax has been paid correctly on software licensing fees remitted overseas
� Excessive, unnecessary or artificial funding of overseas investments to exploit s23AJ/s25-90
� Consolidation – incorrect or contrived application of cost setting rules on entry and exit; whether rights to future income and residual cost setting rules have been applied correctly
� TOFA – incorrect implementation of TOFA or incorrect reporting of TOFA gains and losses
� Losses – whether SBT, COT or recoupment tests are satisfied
� Private equity exits – failure to recognise profit from disposal of Australian assets and structuring to avoid tax on gains
� Disposal of Australian property by non residents (Div 855)
Matters of concern� Capital allowances – application of appropriate
methodology in relation to composite assets and Indefeasible Rights of Use (IRUs)/ Telecommunication Site Access Rights (TSARs)
� Imputation – ‘dividend washing’ & trading in franking credits
� Film Tax Offset – application of expenses
� Implementation of Shipping Incentives
� There has been positive progress in the past year in terms of taxpayer co-operation and engagement. In particular, there has been a material increase in the number of ruling requests and we are currently in ACA negotiations with one taxpayer, with at least two others expressing an interest in an ACA
� Coverage of the S&S segment was obtained through a diverse range of compliance and assurance projects including Transfer Pricing, Secrecy/ Low Tax Jurisdictions, TOFA, Consolidation Exits, Poor Economic and Tax Performance, Royalty Withholding Tax and Cross Border Internet Sales projects
� There was nominal change in the number of S&S key and higher risk taxpayers, although due to M&A and divestment activity there was some movement in and out of the key client category
STRATEGY OVERVIEW
The LB&I S&S sector comprises a large number of taxpayer groups of various sizes across a range of industries. By and large, the risks are generic to LB&I and strategies are similarly generic in nature. Where an industry issue is identified, it is common for the industry issue to be taxpayer specific rather than endemic in that industry. Though due to the nature of sales and services and the acceleration of e-commerce and globalisation in this sector, there will be a specific focus on tax planning structures and profit shifting in this group.
� LB&I S&S comprises 366 taxpayers and 8 diverse sub industries; the largest of which are retail and information communication & technology (ICT). These sub-industries include a number of the top 10 ASX companies
� The S&S sector is a significant and growing sector of the Australian economy; it represents approximately 25% of large market total income, over 25% of entities and around 14% of LB&I total revenue (2012)
� S&S tax revenue growth, which showed a modest decline from 2009 rebounded solidly in 2012, driven by increases in collections from ICT, retail and transport. ICT is expected to sustain moderate growth in the year ahead supported by continuing growth in mobile computing. Retail is expected to show slight growth – interest rate reductions should support demand, as well there are some signs the high $A may have peaked
� There is a mix of foreign and domestic groups. For example retail is mostly Australian owned whilst ICT is predominately foreign owned
� The value of international related party dealings peaked in 2009 but still significant at $11bn in 2011. Stock expenses made up the majority of this at 94%. Related party borrowing amounted to $26bn in 2011
� Globalisation and the growth of e-commerce continues to impact how S&S groups do business. In comparison with the US, the Australian digital economy is still in its infancy
RISK DIFFERENTIATION FRAMEWORK 2013
WORKFLOWS 2012 YEAR TAX RETURN AND BAS ($M)SUB-INDUSTRIES REVENUE PERFORMANCE ($M)
Source: LB&I Revenue Cube 10/07/2013
MEDIUM RISK57
LOWER RISK181
HIGHER RISK 1
KEY CLIENTS17
Additionally 56 Not required and 59 unrated
Source: LB&I Data Services Team 2/07/2013 Source: LB&I ACRPT 9 /07/2013 & IA and DM BI & R 9/07/2013
Source: LB&I Data Services Team 2/07/2013 and LB&I Revenue Management Team 14/03/2013Note: PAYG(W) & FBT represent collections for the period 01/07/2011 to 30/06/2012
In 2013-14, we will:� continue to be a key player in LB&I’s overall management of tax compliance risk, interacting with taxpayers in accordance with our assessment of
their tax risk� increase our focus and understanding of the S&S sector and the key sub industries through the regular sharing of industry knowledge, utilising
expertise of the ATO’s Economist Practice and leveraging off the insights gained by staff in respect to higher consequence S&S taxpayers� improve our understanding of how multinational S&S groups structure their business dealings in and out of Australia, especially an understanding
of the global business value chains and the significance of intangibles, and determine any revenue or compliance risk; liaise with bodies such as JITSIC to gain an appreciation of the global picture and also to assist with information gathering offshore
� improve our understanding of the effects of the digital economy on S&S taxpayers and contribute to cross business line work in this area
� work with taxpayer forums and industry bodies to surface issues and to assist in their resolution; generally provide taxpayers with certainty via provision of advice, alerts and guidance available on the large business web site, as well as real time resolution of issues presenting in APAs, ACAs and PCRs
� work with risk managers in designing appropriate filters to detect risks in the S&S population; these will include tax and economic performance filters to map the risk profile of the sector and its industries, and to identify taxpayers whose performance is below that of industry peers
� undertake scoping, assurance and compliance projects to improve our knowledge of lower consequence taxpayers, their industries and risks
� deal with identified risks through a range of strategies including education, compliance activity, law clarification and escalation of issues to Treasury
UNCLASSIFIED
S&S Sub Segment Total Total Tax PAYG(W) FBT
Accounting 6,185 3,029 8 442 21
Business Services 30,260 23,016 606 3,434 55
ICT 70,771 105,645 2,344 3,480 126
Law 4,258 5,761 1 280 9
Media 27,218 65,746 469 1,350 50
Retail 181,012 106,578 2,458 3,251 104
Other Services 40,493 70,428 867 2,428 43
Transport 73,055 132,557 770 2,955 60
Total 433,252 512,760 7,522 17,620 469
S&S as a % of LB&I Total 24 8 15 36 29
2008 2009 2010 2011 2012 2013
0
1,000
2,000
3,000
I CT
Re t
ail
Oth
er S
e rvi
ces
Tra
nspo
rtM
e dia
B
u sin
ess
Ser
vic e
s
ICT
Re t
ail
Oth
er S
e rvi
ces
Tra
nspo
rtM
edia
B
usin
ess
Ser
vic e
s
ICT
Ret
a il
Ot h
e r S
erv i
c es
Tr a
n sp o
rtM
e di a
B
u si n
e ss
Se r
vice
s
ICT
Re t
a il
Oth
er S
erv i
ces
Tr a
n sp o
rtM
e di a
B
u sin
ess
Se r
vice
s
ICT
Ret
ail
Oth
e r S
e rvi
c es
Tra
nspo
r tM
edia
B
usin
ess
Ser
v ic e
s
ICT
Ret
ail
Oth
e r S
ervi
c es
Tra
nsp o
r tM
edia
B
usin
e ss
Ser
v ice
s
Product
Fin
alis
ed 2
012
Fin
alis
ed 2
013
In p
rogr
ess
1/07
/201
3
Advice 71 85 8
Risk Review s (excl PCR) 105 57 29
PCRs 3 13 21
Other Risk Products 41 43 13
Audits 13 6 18
APA 5 6 7
ACA 0 0 1
Objections 12 18 8
Litigation 3 23 8
253 251 113


