1 Large-scale Mobile Traffic Analysis: a Survey Diala Naboulsi, Student Member, IEEE, Marco Fiore, Member, IEEE, Stephane Ribot, Razvan Stanica, Member, IEEE Abstract—This article surveys the literature on analyses of mobile traffic collected by operators within their network in- frastructure. This is a recently emerged research field, and, apart from a few outliers, relevant works cover the period from 2005 to date, with a sensible densification over the last three years. We provide a thorough review of the multidisciplinary activities that rely on mobile traffic datasets, identifying major categories and sub-categories in the literature, so as to outline a hierarchical classification of research lines. When detailing the works pertaining to each class, we balance a comprehensive view of state-of-the-art results with punctual focuses on the method- ological aspects. Our approach provides a complete introductory guide to the research based on mobile traffic analysis. It allows summarizing the main findings of the current state-of-the-art, as well as pinpointing important open research directions. Index Terms—Cellular networks, mobile communication, data analysis, data collection. I. I NTRODUCTION There is no doubt that personal mobile communication tech- nologies are amongst the most successful innovations of the new millennium. An increasing number of people completely rely on mobile devices not only for work, but also for their personal life and entertainment. In turn, the huge popularity of mobile services has lead to an explosion of mobile traffic, whose compound annual growth rate (CAGR) attained 146% between 2006 and 2013: such a performance surpassed even that of fixed traffic over the turn of the millennium, i.e., when the Internet first started to pervade our lives [1]. An indirect consequence of the success of this technology is that mobile subscribers represent today a vast fraction of the population, a trend that is consistent across developed and developing countries [2]. Also, mobile devices are continously interacting with the network infrastructure, and the associated georeferenced events can be easily logged by the operators, for different purposes, including billing and resource management. Combining the two elements above leads to the implicit possibility of monitoring a large percentage of the whole population with minimal cost: no other technology provides today an equivalent coverage. This rich source of knowledge represents a clear opportunity to many reseach communities, allowing scaling up studies across disciplines such as physics, sociology, epidemiology, transportation, and networking. Diala Naboulsi ([email protected]) and Razvan Stanica ([email protected]) are with Inria UrbaNet, 69621 Villeurbanne Cedex, France and Institut National des Sciences Appliqu´ ees (INSA) Lyon, 69621 Villeurbanne Cedex, France. Marco Fiore (marco.fi[email protected]) is with the Institute for Electronics, Information and Telecommunication Engineering of the National Research Council (CNR–IEIIT), 10129 Turin, Italy and Inria UrbaNet, 69621 Villeurbanne Cedex, France. Stephane Ribot ([email protected]) is with Universit´ e de Lyon, 69007 Lyon, France. This work was supported by the French National Research Agency under grant ANR–13–INFR–0005 ABCD. As a result, mobile traffic analysis is a rapidly emerging research field that encompasses a wide range of disciplines. We summarize its scope as the study of massive traffic datasets collected by mobile network operators to improve the under- standing of natural or technological phenomena occurring at large scales, and to design solutions to issues they may yield. This definition is necessarily generic, as it has to accommodate works that exploit mobile traffic of different type, in diverse ways, and for many and varied purposes. Yet, our definition traces a clear boundary on the mobile traffic sources we consider in this survey, which solely con- cerns datasets collected at the operator’s side of the mobile communication system. Therefore, works dealing with data gathered on the subscribers’ side via dedicated monitors running at the user equipment are out of the scope of our review: this concerns, e.g., the works carried out by Eagle and Pentland [3] within the MIT Reality Mining project 1 , or by De Domenico et al. [4] in the Nokia Mobile Data Challenge 2 , just to mention two popular examples. Similarly, we focus on analyses of data collected within cellular networks: as a matter of fact, mobile traffic datasets referring to other access technologies, such as Wi-Fi, do not currently achieve the desired coverage of large-scale user populations, even in presence of significant data collection efforts, such as that by Meneses and Moreira [5]. The aim of this manuscript is to provide an introductory guide to the state of the art in mobile traffic analysis. To the best of our knowledge, there exist only three previous efforts in that direction, all very recent. A first work reviewing mobile phone data analyses is that by Saramaki and Moro [6]. Unlike the survey we compile in our document, this work focuses on one specific topic, i.e., social graphs extracted from mobile traffic datasets. It thus represents an interesting and more technical reading for researchers interested in that precise subject, which we present in Sec.IV-A. Closer to our approach, Shang et al. [7] provide an overview of several works that collect and employ cellular phone data for studies on social networks, mobility, monitoring and estimation, or business applications. Blondel et al. [8] compile an even more extensive review of results on the analysis of mobile phone datasets, considering research on social networks, mobility, geography, urban planning, help towards development, and security. We believe that our survey extends both these works, introducing more comprehensive classification and discussion. On the one hand, we include in our study the vast literature on networking analyses that is neglected in previous reviews, and which is of capital interest 1 http://realitycommons.media.mit.edu/realitymining.html. 2 http://research.nokia.com/page/12000.
Transcript
1
Large-scale Mobile Traffic Analysis: a SurveyDiala Naboulsi, Student Member, IEEE, Marco Fiore, Member, IEEE,
Stephane Ribot, Razvan Stanica, Member, IEEE
Abstract—This article surveys the literature on analyses ofmobile traffic collected by operators within their network in-frastructure. This is a recently emerged research field, and,apart from a few outliers, relevant works cover the period from2005 to date, with a sensible densification over the last threeyears. We provide a thorough review of the multidisciplinaryactivities that rely on mobile traffic datasets, identifying majorcategories and sub-categories in the literature, so as to outline ahierarchical classification of research lines. When detailing theworks pertaining to each class, we balance a comprehensive viewof state-of-the-art results with punctual focuses on the method-ological aspects. Our approach provides a complete introductoryguide to the research based on mobile traffic analysis. It allowssummarizing the main findings of the current state-of-the-art, aswell as pinpointing important open research directions.
Index Terms—Cellular networks, mobile communication, dataanalysis, data collection.
I. INTRODUCTION
There is no doubt that personal mobile communication tech-nologies are amongst the most successful innovations of thenew millennium. An increasing number of people completelyrely on mobile devices not only for work, but also for theirpersonal life and entertainment. In turn, the huge popularityof mobile services has lead to an explosion of mobile traffic,whose compound annual growth rate (CAGR) attained 146%between 2006 and 2013: such a performance surpassed eventhat of fixed traffic over the turn of the millennium, i.e., whenthe Internet first started to pervade our lives [1].
An indirect consequence of the success of this technologyis that mobile subscribers represent today a vast fraction ofthe population, a trend that is consistent across developed anddeveloping countries [2]. Also, mobile devices are continouslyinteracting with the network infrastructure, and the associatedgeoreferenced events can be easily logged by the operators, fordifferent purposes, including billing and resource management.Combining the two elements above leads to the implicitpossibility of monitoring a large percentage of the wholepopulation with minimal cost: no other technology providestoday an equivalent coverage. This rich source of knowledgerepresents a clear opportunity to many reseach communities,allowing scaling up studies across disciplines such as physics,sociology, epidemiology, transportation, and networking.
Diala Naboulsi ([email protected]) and Razvan Stanica([email protected]) are with Inria UrbaNet, 69621 VilleurbanneCedex, France and Institut National des Sciences Appliquees (INSA) Lyon,69621 Villeurbanne Cedex, France. Marco Fiore ([email protected])is with the Institute for Electronics, Information and TelecommunicationEngineering of the National Research Council (CNR–IEIIT), 10129 Turin,Italy and Inria UrbaNet, 69621 Villeurbanne Cedex, France. Stephane Ribot([email protected]) is with Universite de Lyon, 69007 Lyon,France.This work was supported by the French National Research Agency undergrant ANR–13–INFR–0005 ABCD.
As a result, mobile traffic analysis is a rapidly emergingresearch field that encompasses a wide range of disciplines.We summarize its scope as the study of massive traffic datasetscollected by mobile network operators to improve the under-standing of natural or technological phenomena occurring atlarge scales, and to design solutions to issues they may yield.This definition is necessarily generic, as it has to accommodateworks that exploit mobile traffic of different type, in diverseways, and for many and varied purposes.
Yet, our definition traces a clear boundary on the mobiletraffic sources we consider in this survey, which solely con-cerns datasets collected at the operator’s side of the mobilecommunication system. Therefore, works dealing with datagathered on the subscribers’ side via dedicated monitorsrunning at the user equipment are out of the scope of ourreview: this concerns, e.g., the works carried out by Eagle andPentland [3] within the MIT Reality Mining project1, or byDe Domenico et al. [4] in the Nokia Mobile Data Challenge2,just to mention two popular examples. Similarly, we focuson analyses of data collected within cellular networks: asa matter of fact, mobile traffic datasets referring to otheraccess technologies, such as Wi-Fi, do not currently achievethe desired coverage of large-scale user populations, even inpresence of significant data collection efforts, such as that byMeneses and Moreira [5].
The aim of this manuscript is to provide an introductoryguide to the state of the art in mobile traffic analysis. Tothe best of our knowledge, there exist only three previousefforts in that direction, all very recent. A first work reviewingmobile phone data analyses is that by Saramaki and Moro [6].Unlike the survey we compile in our document, this workfocuses on one specific topic, i.e., social graphs extracted frommobile traffic datasets. It thus represents an interesting andmore technical reading for researchers interested in that precisesubject, which we present in Sec. IV-A.
Closer to our approach, Shang et al. [7] provide an overviewof several works that collect and employ cellular phonedata for studies on social networks, mobility, monitoringand estimation, or business applications. Blondel et al. [8]compile an even more extensive review of results on theanalysis of mobile phone datasets, considering research onsocial networks, mobility, geography, urban planning, helptowards development, and security. We believe that our surveyextends both these works, introducing more comprehensiveclassification and discussion. On the one hand, we include inour study the vast literature on networking analyses that isneglected in previous reviews, and which is of capital interest
to technology-oriented (e.g., computer science, telecommuni-cations, engineering) research communities. On the other hand,we provide a compact treatise, focusing on major findings andmethodologies rather than discussing highlight results; in thesame spirit, we also include per-category tables that providean immediate guidance through the many and varied workson mobile traffic analysis, by summarizing the nature of thedatasets they employ, and the popularity and intertwining ofthe research topics they address.
II. OVERVIEW OF THE RESEARCH FIELD
Although only recently emerged as a research field, mobiletraffic analysis has rapidly matured, with a sensible densifi-cation of activity over the last three years. We sketch theevolution of mobile traffic analysis in Sec. II-A, where wealso investigate the main reasons for its success. Then, wepropose a structured classification of the related literature inSec. II-B, which builds on the identification of a hierarchy ofmultidisciplinary subjects. Finally, we outline the organizationof the survey in Sec. II-C.
A. Evolution and driving factors
Mobile traffic conveys information concerning the move-ment, interactions, and mobile service consumption of indi-viduals at unprecedented scales. Fig. 1a provides some repre-sentative numbers in this sense, as it shows scatterplots of themain features of mobile traffic datasets studied in the literature:these typically include data on hundreds of thousands or evenmillions of mobile subscribers, and cover wide geographicalregions, i.e., cities to whole nations, over long timespans,i.e., weeks to months. Traditional data collection techniques,e.g., census, population surveys, phone interviews, or volun-teer recruitment, cannot offer an even remotely comparableperspective on human activities.
As a consequence, as soon as the surge in mobile com-munications became evident – one decade ago approximately– sociologists, epidemiologists, physicists, transportation andtelecommunication experts saw in the datasets collected bymobile network operators a clear opportunity to bring theiranalyses to an unprecedented scale while retaining a high levelof detail on each individual.
The first, seminal studies exploiting mobile traffic datasetsof significant size started to appear in 2006. Since then, thegrowth of mobile traffic analyses has been dramatic, swellingat a 90% compound annual growth rate, as shown by therepresentative numbers in Fig. 1b. The nature of mobile trafficdatasets, enabling large-scale research that is pertinent todifferent disciplines, is the main reason for this phenomenon.However, it is not the only one, and other aspects contributedto foster the success of mobile traffic analyses.
A first supporting cause behind the increase in the volume ofresearch works is the growing availability of datasets. As men-tioned above, mobile operators have been always monitoringmobile traffic in their networks, for troubleshooting, efficiency,and billing purposes. Yet, they have been traditionally verycautious about sharing the collected data. This attitude hasbeen changing over the last years, as operators have become
more and more prone to open their data to the wider researchcommunity. Such a shift was possible also thanks to seminalworks that proved how mobile traffic data can be an extremelyvaluable asset for fundamental research with a return forthe operators themselves. Collaborations between academicresearch groups and network operators based on the analysisof real-world mobile traffic datasets have been florishing,with a consequent rise in the number of research results andpublications.
A second factor favoring the success of the research fieldis the increasing quality of the datasets. On the one hand,operators, pushed by the value that mobile traffic data mayhave, are deploying ever more advanced probes in theirnetworks, allowing for finer measurements of subscribers’activities. On the other hand, mobile services have evolvedfrom simple calling and texting to Cloud-based always-onapplications: this results in much more frequent interactionsbetween users (or their devices) and the network, which, inturn, leads to a significantly higher granularity of the activitysamples recorded at the operator side. Clearly, the improvedaccuracy of mobile traffic datasets enables additional and morecomplex analyses, and thus attracts an even wider researchcommunity.
A third key element, originating from the first two above,is indeed the emergence of a very active and interdisciplinarycommunity that brings together researchers and industrialactors. The cohesion of academic-industrial partnerships hasimportant consequences: e.g., mobile operators are now foster-ing fundamental and applied research on mobile traffic throughtargeted challenges. Significant examples are the Data forDevelopment (D4D) Challenges by Orange3, and the TelecomItalia Big Data Challenges4. Within these initiatives, mobileoperators publicly disclose datasets of mobile traffic, and askthe research community to carry out analyses that can answerspecific societal or technical challenges.
The impact of operators’ challenges is indeed notable. InFig. 1b, we mark the dates of the main international venuededicated to mobile traffic analysis, i.e., NetMob5. The jump inthe number of publications observed in early 2013 correspondsto the 2013 edition of that conference, where the results of thefirst D4D Challenge were presented. This gives a rather clearidea of how similar initiatives can prompt research activitiesin the field. An event like NetMob is also interesting in thatit captures the heterogeneity of applications of mobile trafficanalysis. Sessions span over many domains, from transporta-tion systems to graph theory, from health to privacy, fromsocial structures to network management.
Considering that all the trends identified above are currentlyreinforced, the future of mobile traffic analysis as a researchfield appears promising enough. The quantity and relevanceof open directions for investigation is such that the dedicatedcommunity has still space to expand significantly. As a result,if the expectations are respected, there are significant chancesthat the mobile traffic analysis will evolve into a very popular,highly transdisciplinary domain of research.
(a) Dataset users (left), area (center) and duration (right) over time
0 20 40 60 80
100 120 140 160 180 200
199
7 1
998 1
999 2
000 2
001 2
002 2
003 2
004 2
005 2
006 2
007 2
008 2
009 2
010 2
011 2
012 2
013 2
014
Pub
licat
ions
Year
NetworkMobilitySocialGraph
0 20 40 60 80
100 120 140 160 180 200
199
7 1
998 1
999 2
000 2
001 2
002 2
003 2
004 2
005 2
006 2
007 2
008 2
009 2
010 2
011 2
012 2
013 2
014
Pub
licat
ions
Year
NetMob’13
NetMob’11
NetMob’10
(b) Publication volume over time
Fig. 1: Evolution of mobile traffic literature. (a) Main features of mobile traffic datasets. Circle color and size denote thenumber of papers with identical properties. We remark the dataset heterogeneity up to date, with the unique exception ofthe Ivory Coast dataset making the object of the 2013 Orange D4D Challenge. (b) Cumulated publications based on mobiletraffic analysis. Different color shades map to the four main categories we identify in our survey. Vertical lines pinpoint majordedicated events, as per the labels.
Fig. 2: Proposed classification of the mobile traffic analysis literature, including the spectrum of disciplines related to topics.
B. Literature classification
The literature on mobile traffic analysis is very heteroge-neous – a consequence of the large number of disciplinesfor which datasets collected by mobile network operatorsrepresent an important asset. Structuring the relevant worksin a comprehensive way is not trivial: one needs to harmonizeresearch originating from domains such as physics, sociology,epidemiology, transportation, and, obviously, networking. Atthe same time, forcing a neat separation among results ob-tained in each of such domains is a limiting approach, whichwould lose the significant overlaps and reciprocal referencesexisting across disciplines.
Our classification is thus organized around research sub-jects, each of which features multidisciplinary contributions.The global outline of the proposed hierarchy is shown in Fig. 2.At the top layer, we identify three macro-subjects of researchat the interface of multiple domains: they deal with the analysisof social, mobility, and network properties, respectively. Then,a tree of topics is developed within each macro-subject. Below,
we provide an overview of the themes addressed across theclassification.
Social analyses investigate the relationships between mobiletraffic and a wide set of social features. The major researchfocus is on the characterization of the social structure ofmobile users’ interactions, and on the study of how demo-graphic, economical, or environmental factors influence theway users consume mobile services. We also consider inthis category works that leverage social features, inferredfrom mobile traffic, for the characterization and mitigation ofdisease epidemics.
Mobility analyses deal with the extraction of mobility in-formation from mobile traffic. Mobility is intended here in itsbroadest acceptation, and includes generic human movementsat both individual or aggregate levels, as well as specializedpatterns that concern specific users, e.g., traveling on trans-portation systems. We also review in this section the quiteextensive literature on the dependability of mobile traffic dataas a source of mobility information.
4
Network analyses take a more technical perspective, as theyfocus on understanding the dynamics of the mobile trafficdemand, and how to evolve the mobile network infrastructureto better accommodate it. Works in this category thus focuson either the characterization of mobile service usages oron the exploitation of such knowledge to devise improvedtechnological solutions of diverse nature.
The vast majority of the categories outlined above areinterdisciplinary by their own nature. In the lower portionof Fig. 2, we provide a representation of the relevance offive major research domains to the different topics of mobiletraffic analyses. Relationships are necessarily not sharp, butwe can remark that mobility studies are those attracting thehighest variety of contributions. Most categories are significantto two or three disciplines. The only non-multidisciplinarysubjects concern the development of novel solutions for mobilenetworks: being quite specific and very technical topics, it isunderstandable that they attract contributions solely from thenetworking community.
C. Survey organization
Since mobile traffic data collected by mobile operators incellular networks is the cornerstone of all works we review,we start our survey by introducing some basic notions aboutsuch kind of data. Sec. III provides a primer of the cellularnetwork architecture, and presents different solutions to recordmobile traffic information within its access and core portions.The same section puts forward an important problem of thedata collection process, i.e., the preservation of subscriberprivacy, and outlines current approaches to the anonymizationof mobile traffic datasets. These discussions are relevant tothe whole body of works related to mobile traffic analysis,independently of the subject they address and of their specifictarget. We thus believe that the section provides a usefultechnical basis that eases the understanding of the actualexamination of the literature.
Sec. IV–VI represent the core of our contribution, andthoroughly survey mobile traffic analysis according to ourproposed classification. Specifically, works that concern social,mobility, and networking analysis, are presented in Sec. IV,Sec. V and Sec. VI, respectively. The internal structure of eachsection follows the hierarchy of classes identified in Sec. II-Babove. As a quick reference guide, we report in Fig. 2 thenumber of the (sub-)section where each classification subjectis addressed.
Throughout our discussion of the literature in these sections,we try to balance two aspects: (i) the comprehensive overviewof the main results achieved by mobile traffic analyses inthe considered theme, across disciplines; (ii) the introductionto significant details of the methodology adopted to obtainsuch results. The former represent the primary output ofthe research activities, and are presented in the main text.Methodological aspects that go into some technical depth areinstead introduced only when required and in footnote, so asnot to break the flow of the text. We thus suggest that readersinterested in grasping fundamental outcomes of state-of-the-art research in mobile traffic analysis go through the main text,
skipping technical footnotes. Readers willing to dig into somedetail on a specific subject may instead refer to the technicalfootnotes associated to that topic.
Finally, we summarize our review in Sec. VII, which pro-vides a general discussion of the results achieved in theresearch field. The section gives us the opportunity to highlightouttakes and point at main open issues and future researchdirections.
III. MOBILE TRAFFIC DATA COLLECTION
The scope of this survey encompasses works dealing withdata collected by probes that record traffic at different locationswithin the cellular network infrastructure6, whose architectureis outlined in Fig. 3. Such a network grants access to telecom-munication services and to the Internet by a wide range ofdevices: not only portable devices carried by mobile users,such as smartphones or tablets, but also meters or other typesof machine-to-machine (M2M) communicating devices, aswell as femtocells and cellular-connected Wi-Fi access pointsthat bring local connectivity without the need for cabling.
A. Cellular network architecture: an overview
The network is composed of two main parts: a Radio AccessNetwork (RAN), which provides wireless access to the indi-vidual devices, and a Core Network (CN), which manages alloperations needed to transfer voice and data among differentportions of the RAN as well as to and from external networks,including the Internet. The RAN is composed of base stations,each in charge of one or multiple cell sectors that jointlycover the geographical surface the network serves. End devicesconnect to the base station overseeing the cell section theyare currently located in. Mobile devices may trespass thecell sector boundaries while exchanging data with the RAN,which generates a handover (HO) event to the new servingbase station. Moreover, cell sectors are clustered into LocationAreas (LA)7 that represent the spatial granularity at which thedevice position is known at all times by cellular network, andit is thus used for paging. As a consequence, devices movingto a different LA are required to inform the network via alocation update (LU) event, even if they do not have anyongoing communication at that time.
From a more technical perspective, base stations are referredto as Base Station Subsystem (BSS) and Radio NetworkSubsystem (RNS) in 2G (GSM, GPRS, and EDGE) and3G (UMTS and HSPA) architectures, respectively. In bothcases, base stations are composed of separated antennas (Base
6According to the definition of Smoreda et al. [9], this corresponds topassive monitoring of mobile traffic. An active probing is also possible,where operator-side platforms periodically query end devices, as in [10].Active probing is typically done to obtain accurate positioning information.However, it requires dedicated network elements, induces additional trafficin the system, and has an impact on the batteries of the mobile terminals.Thus, active probing is fairly uncommon as a mobile traffic data collectiontechnique.
7The notion of Location Area, introduced originally in 2G networks,evolved with the development of new generations of mobile networks. Similarconcepts, such as Routing and Tracking Area are described in 3G and LTEsystems. However, in this paper, we use Location Area as a generic term,denoting all these different technical definitions.
5
Fig. 3: Simplified architecture of the cellular network encompassing different 2G, 3G and LTE technologies, and positions ofprobes for passive monitoring.
Transceiver Station, i.e., BTS, or NodeB) and controlling hard-ware (Base Station Controller, i.e., BSC, or Radio NetworkController, i.e., RNC). In the LTE architecture, the eNodeBgathers all base station functionalities.
At the CN, and considering 2G and 3G architectures, voiceand texting services are managed via the Circuit Switched (CS)Core, whereas data (i.e., IP-based) services are handled by thePacket Switched (PS) Core. The main entities of the CS Coreare the Mobile Switching Center (MSC) and the Gateway MSC(GMSC), which enable voice/text switching within the mobilenetwork and with networks of different operators, respectively.In the PS Core, Serving Gateway Support Nodes (SGSN)and Gateway GPRS Support Node (GGSN) are the interfacestowards the devices and the Internet, respectively, and takecare of packet-switched data transfers. In LTE, new entitiesare introduced to form the Evolved Packet Core (EPC). Thesemanage the device control (Mobility Management Entity, orMME) and data (Serving Gateway, or SGW) planes, andinterface them with other IP-based networks (Packet DataNetwork Gateway, or PGW).
Finally, a set of logical charging function are implementedin the network for billing and inter-operator accounting pro-cedures. They are responsible for collecting network resourceusages by each customer. The main functions are the fol-lowing: the Charging Trigger Function (CTF), which gen-erates charging events based on the observation of networkresource usages; the Charging Data Function (CDF), whichreceives charging events from the CTF to construct Call DetailRecords (CDR), providing for each user reports concerning hiscommunications; and the Charging Gateway Function (CGF),responsible for validating, reformatting and storing CDRsbefore sending them to the billing domain.
B. Mobile traffic probesMonitoring probes can be deployed at different locations
within the architecture described above.RNC probes, marked as A in Fig. 3, can be used to capture sig-naling events concerning any Radio Resource Control (RRC)operation. This allows to record fine-grained state changes ofeach device, and thus to detect device network attach anddetach operations, start and conclusion of sessions, HO andLU events, related to any call, texting, or data transfer activity.Moreover, it allows collecting performance indicators on datatransmission, such as the uplink and downlink throughputexperienced by the device.MSC probes, marked as B in Fig. 3, are similar to RNCprobes, in that they can collect similar statistics. However, asMSCs are located in the CS Core, these probes can only tracksignalling related to voice and texting (and not to data traffic).Moreover MSCs control multiple base stations and thus eventsthat are managed locally by a BSC or RNC (e.g., intra-basestation handovers occurring among cell sectors under controlof a same BSC or RNC) are transparent to the probe.GGSN/PGW probes, marked as C in Fig. 3, tap at links atGn/S5 interface of data gateways on the PS Core or EPC8.They inspect messages tunnelled in the core network via theuser data part of the GPRS Tunnelling Protocol (GTP-U);this maps to the IP traffic generated or received by mobiledevices. Operators typically have measurement infrastructuresalready in place to monitor IP-level statistics from such GTP-U message exchanges. Collected information include the IPsession start and end time, device and user identifiers, trafficvolume, type of service (i.e., transport- and application-layerprotocols, class of service – such as web, email, streaming
8Many operators have co-located GGSN and PGW, which allows gatheringinformation on 3G and LTE traffic at once [11].
6
audio/video – and name of the application in some cases).In addition, GGSN/PGW probes can associate location in-formation to the data traffic statistics above. To that end,they monitor the control data part of the GPRS TunnellingProtocol (GTP-C), which carry Packet Data Protocol (PDP)Context messages. These messages are transmitted by theSSGN or MME/SGW to the data gateway to establish, updateor tear down IP sessions (i.e., IMSI-to-IP address mappings)of end devices. PDP Context messages include, among otherattributes, the cell sector where the mobile device is locatedwhen the IP session is started or updated, which can be usedto localize the data traffic. In current network configurations,no information concerning voice or texting activities can becollected by GGSN/PGW probes.CGF probes, marked as D in Fig. 3, retrieve data fromthe CGF. The latter is responsible of providing Call DetailRecords (CDR) information to the billing domain of themobile operator, where fees to be charged to the owners ofthe end devices are determined. It is precisely CDR that arecollected by CGF: these contain start timestamp, duration,and originating cell sector of each voice, texting and datatraffic activity of every device. Less frequently, CDR includeadditional information on the last cell sector of the activityand on HO events occurred during the activity.Discussion. The probes listed above all have strengths andweaknesses. As a general rule, probes located closer to theend devices (i.e., following the alphabetical order in Fig. 3)provide a more detailed view of the mobile traffic, but aremore difficult to deploy and often less dependable in terms ofuptime.
As an example, RNC probes deployed at all RNS allowobserving all significant events occurring in the network, andthus provide accurate information about which cell sectoreach device is associated to at all times9. This represents theideal data for any study of user mobility or mobile trafficconsumption. However, not all RNC equipment is designedto support probes, which, in any case, induce non-negligiblecomputational and storage overhead on the RNC hardware.Moreover, RNCs are geographically distributed, which forces(i) the deployment and maintenance of a large number ofprobes10 to cover a significant geographical area, and (ii)significant additional long-haul capacity to transfer all eventsto a central server.
On the contrary, a small number of GGSN/PGW probesdeployed at the few data gateways necessary to cover a wholecountry allows to monitor mobile traffic much more efficiently.In addition, the information provided by such probes providesa rather detailed description of the IP traffic generated byeach device, largely sufficient for studies on mobile trafficconsumption. On the downside, no voice or texting data is cur-rently recorded by GGSN/PGW probes. More critically, theseprobes only yield very approximated positioning information,
9We recall that cell sectors represent the finest spatial granularity achievableby passive monitoring in cellular networks, at least unless complex triangula-tions based mechanisms, using transmit power or timing advance information,are performed by the operator.
10This number can be two orders of magnitude larger than that of, e.g.,CGF probes, at comparable geographical coverage.
updated only at the establishment of the PDP Context by anend device11, or when the device moves across different SGSNor 2G/3G/LTE coverage areas. The latter events are quite rare,whereas cell sector changes that trigger HO or even LU events– instead very frequent in cellular networks – are not reportedup to GGSN or PGW and thus go unnoticed. As a result,GGSN/PGW probes often have stale views of device locations.
The tradeoff is shifted in the case of CGF probes. Onthe one hand, the CDR they collect do not provide anyinsight on the type of data traffic generated by the devices:the rich information on protocol- and service-level operationsgranted by GGSN/PGW probes is lost at CGF probes, whichonly observe traffic volumes. On the other hand, however,CDR are readily available to mobile operators, typically ata single server for the whole network, and contain clean, wellformatted information on millions of devices. This makes suchkind of mobile traffic source extremely popular in research.In addition, the mobility information yielded by CDR is moreaccurate than that provided by GGSN/PGW probes: despitethe fact that CDR only include the starting cell sector of eachactivity, they track voice and texting sessions in addition todata ones, which leads to a higher sampling frequency ofdevice position. Clearly, this also implies that voice and textingbehaviors can be studied using CDR, which is instead notpossible with PDP Context data.
As a concluding remark, we underscore that the hetero-geneous nature of probes presented above reflects into astaggering diversity across the mobile traffic datasets studied inthe literature. As a matter of fact, the works we review in thissurvey rely on information that describes user position withspatial granularities that range from cell sectors to whole cities,and with temporal granularities that span from millisecondsto hours. In some cases, the datasets contain no or minimalnotion of the actual service provided to each subscriber (e.g.,voice, texting, data), whereas in other cases they detail theprotocols, applications, and URLs involved in each networktransaction. Differences also emerge in terms of customer base,geographical and temporal coverage. A clear demonstrationof such a variety is provided by Fig. 1a, which shows how:(i) the number of subscribers, the geographical surfaces andthe timespan covered by mobile traffic datasets can differ byseveral orders of magnitude; (ii) there is no clear trend overtime, and the growing number of points, i.e., works, just leadsto more diversity; (iii) with one notable exception12 there is atendency for each paper to use its own mobile traffic dataset.
C. Mobile traffic anonymization
Independently of collection location, mobile traffic datacontain information on many aspects of subscribers’ life,including their activities, interests, schedules, movement, and
11This maps to the time at which the device opens a data connection tothe network. We remark that, once the connection established, a device maykeep it open even if it switches to an idle state, and thus does not actuallytransfer data. The device can then become active again, and generate trafficover the same connection that was never closed. This leads to PDP Contextsthat are not updated for hours even if the devices change location.
12The larger circle in Fig. 1a maps to the fourty-some papers using the 2014Data for Development (D4D) Challenge dataset.
7
preferences. It is precisely the possibility of accessing to suchinformation at unprecedented scales that proves of criticalimportance for studies in many and varied research fields.
However, accessing such a rich source also raises concernsabout potential infringements of the privacy rights of mobilecustomers: among others, individuals can be identified, theirmovements can be tracked, and their mobile traffic can bemonitored. As a result, regulators have been working on lawsintended to protect the privacy of mobile users. As an example,the European Data Protection Directive 95/46/EC mandatesthat all mobile traffic datasets be anonymized so that noindividual is identifiable, before any cross-processing can berun on the data. Moreover, Directive 2002/58/EC states thatanonymized data shall be analyzed only for the time necessaryto provide the intended value-added service.
However, directives such as those above do not indicateany precise anonymization technique or privacy preservationmodel to be adopted during or after data collection. The reasonis that there is still a high degree of uncertainty on thissubject. On the one hand, there are many different notionsof privacy that are not necessarily subset of each other, suchas k-anonymity [12], l-diversity [13], t-closeness [14], anddifferential privacy [15], just to cite a well-known few. Whichdefinition should be adopted, and under which conditions, isopen to discussion. On the other hand, current anonymizationalgorithms aimed at guaranteeing the different privacy notionsabove are thought for standard tabular databases of staticattributes, which are quite different in nature from mobiletraffic datasets of subscribers’ spatio-temporal activity. In fact,even the debate on whether user re-identification represents anactual threat to subscribers or not is still on-going [16], [17].
Overall, no definitive solution exists today to protect mobileusers from privacy breaches that represent a certain risk – inthe first place because the latter are not yet clearly defined.The result is that, so far, operators have considered naivetechniques to preserve the privacy of customers. In most ofthe previous works, subscribers are anonymized by replacingtheir unique identifiers13 with random sequences that allow topinpoint a single user but hide his/her actual identity. Severalworks have focused on the issues of such an approach, andproposed solutions based on generalization and suppressionof data. We refer the reader to Sec. VI-B3 for a technicaldiscussion of the topic.
IV. SOCIAL ANALYSIS
The scale and granularity of social studies has been histor-ically limited by the considerable costs of collecting mean-ingful data. Extensive, statistically reliable population surveysrequire significant economic and organization efforts, may takea long time, and cannot be guaranteed to be free of biasesintroduced by the sample selection or survey methodology.
From this perspective, the availability of datasets describingthe dynamics of millions, such as those collected by mobileoperators, is a definite game changer. Still, social studiesoften require information that is not present in mobile trafficdata: the latter is thus complemented with traditional surveys,
13Typically, IMSI, IMEI, or the phone number.
including national and regional demographics and statistics, orsupplementary personal notions, including users’ age, gender,employment, or revenue.
We identify four main research directions where socialstudies have enjoyed particular benefit from mobile trafficanalysis. The first is the investigation of the structure ofinteractions among mobile subscribers, typically representedas a so-called mobile call graph. Results on properties andmodels of such particular graphs are surveyed in Sec. IV-A.The second subject is the exploration of the interactions amongdemographic factors and mobile communications, by meansof cross-correlation of mobile traffic and personal subscriberinformation databases. The main results on this subject are pre-sented in Sec. IV-B. The third topic concerns the relationshipsbetween the environment, in terms of both geographical andtemporal features, and the communication structure. We reviewthe related works in Sec. IV-C. The fourth research directionrelates to epidemiology, since mobile traffic provides massiveinformation on human movements and interactions that arecritical to better understanding how viral diseases propagate.We discuss these latter works in Sec. IV-D.
To ease the reader’s access to the studies on his/her topicof interest, we give an overview of the works discussed inthis section in Tab. I. The table also provides a quick accessregarding the size and geographical coverage of the useddatasets, as well as information regarding the supplementarydata used in these studies.
A. User interactions
Understanding the complex structure of mobile user inter-actions is a challenging task that has implications in physics,sociology and also networking, since this knowledge canbe used to, e.g., understand service adoption or anticipateevolutions in the customer base (see also Sec. VI-B2 on thissubject).
The vast majority of studies on mobile data characterizationemploy graph representations that allow adopting well-knownanalysis techniques issued from graph theory. We present themain results of these studies in Sec. IV-A1. Another significantresearch line aims at understanding the reasons behind thestructure of such graph representations, and develop so-calledgraph generative models. Such models can create syntheticgraphs of mobile data whose features mimic those of graphsextracted from real-world datasets. Sec. IV-A2 is dedicated toworks in the field of graph generative models.
1) Mobile call graph properties: Mobile traffic datasetsare very often represented as mobile call graphs. A mobilecall graph G = (V,E) is a mathematical structure describinga set of mobile users, which map to the set of vertices V, andtheir interactions (i.e., exchanged voice calls or text messages),which correspond to the set of edges E connecting pairs ofvertices. This generic definition can accommodate a numberof variations, depending on whether, e.g., edges are directedor undirected, weighted or unweighted, or subject to filteringrules.
In fact, there is no unique definition of a mobile call graph,and a variety of alternatives is found in the literature, as pre-
8
Analysis Dataset Focus
Name Date Operator Area Time Users V T ED FT Di GS GM AG EL EF Ge UL SE EC PC
Mob
ileca
llgr
aph
Nanavati [18] 11/06 – 4 Indian regions 1 month 2.7 M X – From X X X
Doran [19] 12/12 – Unknown country 3 weeks (2011) 3 M X – From X X
Onnela [20] 02/07 – European country 18 weeks 7.2 M X – From X X
Lambiotte [21] 09/08 Mobistar Belgium 16 months 2.5 M X X – From X X X X
Seshadri [22] 08/08 Sprint 4 USA regions 2 months 2 M X – From X X
Karsai [24] 02/14 – European country 18 weeks 6.2 M X – From X X
Onnela [25] 05/07 – European country 18 weeks 7.2 M X – From X X
Hidalgo [26] 05/08 – Unknown country 1 year (2004/05) 2 M X – From X
Miritello [27] 04/13 Telefonica Spain 19 months 20 M X – From X X
Palla [28] 04/07 – – 1 year 4 M X – From X
Dem
ogra
phic
s
Yang [31] 06/09 – Chinese city 6 months 300 K X Demographic To X
Sarraute [32] 08/14 – Mexico 3 months 500 K X X Demographic To X
Stoica [33] 11/10 Mobistar Belgium 6 months (2006/07) 3.3 M X X – To X
Mehrotra [34] 03/12 – Rwanda 4 years (2005/09) 1.2 K X X Demographic To X
Wang [35] 05/13 Sprint USA 1 month (2010) 20 M X Demographic From X
Brea [36] 08/14 – Mexico 3 months 70 M X X Demographic From X
Blondel [37] 03/08 Mobistar Belgium 6 months 2.04 M X X Demographic From X X
Toomet [38] 05/12 – Tallin, Estonia 1 year (2009) 32 K X X – From X X
Blumenstock [39] 04/15 EMT Estonia 5 years (2007/12) 48 K X X Demographic To X
Morales [40] 05/13 Orange Ivory Coast 5 months (2011/12) 500 K X X Demographic From X
Bucicovschi [41] 05/13 Orange Ivory Coast 5 months (2011/12) 500 K X X Demographic From X
Soto [42] 06/11 – City in Latin America 6 months (2010) 500 K X X Demographic From X
Smith [43] 05/13 Orange Ivory Coast 5 months (2011/12) 500 K X XEconomicindicators From X X
Mao [44] 05/13 Orange Ivory Coast 5 months (2011/12) 500 K X XEconomicindicators From X X
Wakita [45] 05/13 Orange Ivory Coast 5 months (2011/12) 500 K X X – From X X
Fajebe [46] 05/13 Orange Ivory Coast 5 months (2011/12) 500 K X X Commodity prices From X
Lim [47] 05/13 Orange Ivory Coast 5 months (2011/12) 500 K X XEconomicindicators From X
Frias-Martinez [48] 01/12 Telefonica City in Latin America 6 months 500 K X X Demographic From X
Krings [49] 05/13 – Brazil 2 months 6 M X XEmployment
details From X X
Env
iron
men
t
Onnela [50] 04/11 – European country 1 month 3.4 M X X – To X X
Wang [51] 04/15 – European country 2 years 10 M X X – To X
Schmitt [53] 05/13 Orange Ivory Coast 5 months (2011/12) 500 K X X – From X
Eagle [54] 08/09 – African country 4 years (2005/08) 1.4 M X Regional census From X X X
Almeida [55] 09/99 Telecel Lisbon 3 days (1997) – X – From X
Trestian [56] 11/09 – 5000 km2 1 week 281 K X Data traffic From X X
Vieira [57] 08/10 Telefonica 2 metropolis 4 months 1 M X – From X
Pulselli [58] 06/08 Telecom Italia Milan, Italy 2 months (2004) – X – From X X
Naboulsi [59] 04/14 Orange Abidjan, Ivory Coast 5 months (2011/12) 18 K X X – From X X
Girardin [60] 10/08 Telecom Italia Rome, Italy 3 months (2006) – X X – From X X
Bajardi [61] 04/15 Telecom Italia Milan, Italy 2 months (2013) – X X Points of interest From X X
Toole [62] 08/12 AirSage Boston, USA 3 weeks 600 K X X Land usage To X
Soto [63] 06/11 Telefonica Madrid and Barcelona 1 month (2009) 3 M X X Land usage From X
Cici [64] 06/15 Telecom Italia Milan, Italy 2 months (2013) – X X Land usage From X X
Furno [65] 08/15 Telecom Italia Milan & Turin, Italy 2 months (2013/15) – X X Land usage From X
Grauwin [66] 09/15 Various NYC, London, Hong Kong 3 months (2013) – X X Land usage From X
Ma [67] 06/15 – Chongqing, PRC 1 day 1.6 M X – From X
Secchi [68] 07/15 Telecom Italia Milan, Italy 2 weeks – X – From X
Candia [69] 07/08 – 230,400 km2 – – X – From X
Calabrese [70] 11/10 AirSage Boston 6 weeks (2009) 1 M X X Event list From X
Dixon [71] 05/13 Orange Ivory Coast 5 months (2011/12) 500 K X X – From X
Gowan [72] 05/13 Orange Ivory Coast 5 months (2011/12) 500 K X X Event list From X
Bagrow [73] 03/11 – European country 3 years 10 M X X Event list From X X
Linardi [74] 05/13 Orange Ivory Coast 5 months (2011/12) 500 K X X Event list From X
Epi
dem
ics
Wesolowski [75] 05/13 Orange Ivory Coast 5 months (2011/12) 500 K X X Health surveys From X
Enns [76] 05/13 Orange Ivory Coast 5 months (2011/12) 500 K X X Demographic From X
Gavric [77] 05/13 Orange Ivory Coast 5 months (2011/12) 500 K X X Health surveys From X
Baldo [78] 05/13 Orange Ivory Coast 5 months (2011/12) 500 K X X Demographic From X
Ndie [79] 05/13 Orange Ivory Coast 5 months (2011/12) 500 K X X Health surveys From X
Chunara [80] 05/13 Orange Ivory Coast 5 months (2011/12) 500 K X X Health surveys From X
Azman [81] 05/13 Orange Ivory Coast 5 months (2011/12) 500 K X XHealth and meteo
surveys From X X
Tizzoni [82] 09/11 Orange 3 countries – 6.8 M X Demographic From X X
Frias-Martinez [83] 05/12 Telefonica Mexico 6 months (2009) 1 M X Health surveys From X
Frias-Martinez [84] 09/11 Telefonica Mexican city 6 months (2009) 2.4 M X Health surveys From X X
Saravanan [85] 05/13 Orange Ivory Coast 5 months (2011/12) 500 K X X Health surveys From X X X
Leidig [86] 05/13 Orange Ivory Coast 5 months (2011/12) 500 K X X Health surveys From X X
Kafsi [87] 05/13 Orange Ivory Coast 5 months (2011/12) 500 K X X Demographic From X X X
Lima [88] 05/13 Orange Ivory Coast 5 months (2011/12) 500 K X X – From X X
TABLE I: Main features of works that leverage mobile traffic data for social analysis. In the analysis columns, date is thepublication month/year. In the dataset columns, V is voice, T is texting, and ED is complementary external data. In the focuscolumns, FT indicates if the paper studies social properties appearing in the dataset (From) or the impact of societal issues onmobile phone data (To), Di is mobile call graph distributions, GS is graph structure, GM is graph generative models, AG isage and gender, EL is ethnicity and language, EF is economic factors, Ge is geography, UL is urbanization and land use, SEis special events, EC is epidemics characterization, PC is epidemics prevention and control.
9
sented next. However, independently of the graph constructionmethodology, there exists a limited set of metrics that yieldmost of the significant information about the mobile call graphstructure. We employ these metrics to classify relevant worksin the following.Degree distribution. The vertex degree distribution is thestatistical distribution of the number of vertices connected byedges to a single other vertex. It conveys information aboutthe basic structure of communications among mobile users.
In a seminal work, Nanavati et al. [18] construct an un-weighted directed graph, which preserves the caller-calleerelationship (as edges point to the latter), but loses anyinformation on the number or duration of interactions betweenpairs of users (as edges do not depend on the intensity ofthe interactions). The authors observe that the in- and out-degree of vertices14 both follow power law distributions15. Theparametrization of the power law is however different for thein- and out-degree, with an exponent taking values between2.7 and 2.9 for the in-degree, and between 1.5 and 2 forthe out-degree. Nevertheless, the correlation between the twometrics at a same node is strong, implying that mobile usersthat call more people also tend to be called by a larger set ofindividuals. However, vertices with a very high in-degree (e.g.,customer service numbers) or out-degree (e.g., salesmen) losethat correlation. Similar conclusions are drawn by Doran etal. [19], although with slightly different power law parameters(an exponent of 3.41 for the in-degree and 2.63 for the out-degree).
The node degree power law distribution seems to be con-sistent over different modeling choices, as shown by Onnelaet al. [20], where the authors consider a mutual mobile callgraph, with an undirected edge connecting two vertices if atleast one reciprocated pair of calls was exchanged betweenthe corresponding users. In this graph, the notions of in- andout-degree coincide, and the node degree is characterized by apower law with a much faster decay, an exponent of 8.4, im-plying that the number of high-degree vertices is much lowerthan that measured when including one-way interactions.
In yet another different approach, Lambiotte et al. [21]consider a constrained mobile call graph, where an undirectededge connects two vertices if a minimum number of recip-rocated calls exists between the corresponding users duringa given time period. Specifically, the authors consider thatat least 6 reciprocated calls must be present in a 6-monthdataset for the relative edge to be present. The vertex degreedistribution follows a power law in this case as well, with anexponent of 5.0. Yet, the results indicate that the power lawmodels accurately only the tail of the empirical distribution,but not its head. A similar conclusion is drawn by Seshadriet al. [22] on multiple versions of an undirected mobile callgraph. The authors consider both unweighted and weightedversions of the graph, with two types of edge weights: the total
14The in-degree of a vertex, din, is the number of directed edges that endat the vertex. Equivalently, out-degree of a vertex, dout, is the number ofdirected edges that originate at the vertex.
15Denoting as d the in- or out-degree, then P (d) ∼ d−γ , where theexponent γ is inversely proportional to the presence of highly connectedvertices (also referred to as hubs) in the graph.
call duration between the pair of users, and the total numberof calls they exchanged. In all cases, power laws are found tofit the tail of the degree distributions, but not the head. Instead,a Double Pareto Log Normal (DPLN) distribution16 yields agood fit for the full vertex degree range.Other power law distributions. Power laws characterize notonly the tail of the vertex degree distribution, but other featuresof mobile call graphs as well. A first example is that of edgeweights, as shown by Karsai et al. [24] in undirected weightedgraphs, with the edge weight representing the number of callsbetween pairs of users. However, Onnela et al. [20] find thata different weight definition, the total call duration betweentwo users, can introduce a cutoff in the distribution, leadingto an exponentially-truncated power law17.
A second case is that of spatio-temporal properties. Karsaiet al. [24] disaggregate the mobile call graph over time, andstudy the users’ activity rate, i.e., the probability of a vertexto be involved in an interaction at each unit time. They findthe distribution of the activity rate to be heavy-tailed, withan exponent of 2.8. On the spatial side, Lambiotte et al. [21]associate geographical information from billing ZIP codes tothe vertices of the graph, and find that a power-law gravitymodel18 well approximates the probability that two mobileusers living at a given distance are connected in the graph,i.e., call each other.Assortativity. A graph is assortative if its vertices tend toconnect to other vertices with similar degree. This property,also known as assortative mixing, is typical of social networks.On the contrary, in a disassortative network high-degree nodestend to connect to low-degree ones and vice versa.
In the case of directed mobile call graphs, Nanavati etal. [18] show that assortative mixing is only present forthe in-degree, whereas the out-degree graph is even weaklydisassortative. Undirected graphs appear instead to be alwaysassortative, as shown by Onnela et al. [20].
In [20], the authors extend the assortativity analysis to edgeweights, comparing the average weight of a vertex’s edgesto that of its neighbors. The outcome is dependent on thedefinition of edge weight: the graph is weight-assortative ifedges are associated with the number of calls exchanged bymobile user pairs, but it is not in case total call durations areused as edge weights.Structural role of vertices and edges. Several studies havefocused on the identification of vertices and edges that areespecially important within the structure of the mobile callgraph, so as to pinpoint mobile users and calling interactionsthat play key roles in the communication network.
16The DPLN distribution is a mixture of lognormal distributions. Itscomplete formulation is rather complex, and, for the sake of brevity, we donot provide it here. A detailed discussion is provided in [23].
17Denoting as w the edge weight, then P (w) ∼ w−γe−w/k , where k isthe weight at which the exponential cutoff occurs, i.e., for which it becomesvery unlikely to find edges. In [20], γ = 1.9 whereas k is equal to 3.4 ·105 s,implying that reciprocated calls lasting more than 30 minutes/week are rare.
18The gravity model commends that a measure decreases as a power ofdistance. Denoting as dij the geographical distance between mobile users iand j, their probability to be connected is P (dij) ∼ d−γij . In [21], γ = 2.
10
The PageRank19 algorithm is used by Nanavati et al. [18]to assess the importance of vertices in the mobile call graph.The results show that the rank, i.e., importance, of a user istightly correlated to the in-degree of its vertex, or, in otherwords, to the volume of calls it receives.
Onnela et al. [20] focus on the importance of edges, ratherthan vertices. Specifically, they map edge significance to therole that an edge plays in maintaining the mobile graphstructure robust, i.e., well connected. They find that severalmeasures allow to rank edges according to their importance forthe graph robustness: removing edges with the lowest weight,the lowest overlap20, or the highest betweenness centrality21
results in a rapid disintegration of the graph. In a follow-up, Onnela et al. [25] delve deeper into the relevance of theedge weight, which they name the strength of the tie betweena pair of users. Interestingly, they find that the weight iscorrelated to the logical positioning of the edge within themobile graph structure. High-weight edges, i.e., strong ties,connect members of a same community, whereas weak tiestend to build links among communities. This explains whyweak ties are critical to the graph connectivity. The result isconfirmed in a recent work by Karsai et al. [24].
Instead, Doran et al. [19] are only in partial agreementwith the conclusion above. They rank edges according totheir outlying behavior, i.e., how significantly the edge weightand overlap20 deviate from the mean value in the graph,either positively or negatively. Their results suggest that themobile call graph is composed of well-connected communitiesfeaturing non-outlying edges. These communities are kepttogether by a backbone of outlying edges.
Finally, Hidalgo and Rodriguez-Sickert [26] identify a re-lationship among the importance of vertices and edges in themobile call graph structure. They measure the former as thevertex degree and the latter as the frequency with which anedge appears in graphs constructed over different periods, i.e.edge persistence, and find that low-degree vertices tend tocreate more persistent edges.Cluster structure. Real-world networks typically have nonrandom organizations that are the outcome of, e.g., socialinteractions, or spatio-temporal constraints. As a result, theirvertices and edges build precise internal structures that are notfound in random graphs.
A classical feature of real-world networks is the presence ofclusters, i.e. groups of vertices that are more tightly connectedwith each other than with other vertices in the graph. Atypical metric for the level of clustering in a graph is the
19PageRank is a random-walk-based algorithm used to rank webpages inthe Google search engine. PageRank computes the rank r(i) of a vertex i asr(i) = q/N + (1− q)
∑j:j→i r(j)/dout(j), where N is the total number
of vertices in the graph, j → i indicates an edge from j to i, dout(j) is theout-degree of vertex j, and 1− q is the damping factor, i.e., the probabilityto stop the random walk and start it again at a random graph vertex – thelatter being modeled by the term q/N .
20The overlap of an edge connecting two vertices i and j is defined asoij = nij/[(d(i) − 1) + (d(j) − 1) − nij ], where d(i) is the degree ofvertex i, and nij is the number of neighbors common to i and j.
21The betweenness centrality of an edge connecting vertices i and j isdefined as bij =
∑v∈V
∑w∈V/v σvw(i, j)/σvw , where σvw(i, j) is the
number of shortest paths between vertices v and w that traverse the (i, j)edge, and σvw is the total number of shortest paths between v and w.
clustering coefficient22. Nanavati et al. [18] and Onnela etal. [20] measure the average clustering coefficient of eitherdirected or undirected mobile call graphs, and find it to besimilar to that of many other empirical networks that have non-random structures, such as email communication graphs or theWorld Wide Web. Lambiotte et al. [21] add a geographicaldimension to the analysis, by studying the distribution dis-tances between ZIP areas of mobile users whose vertices forma triangle in the mobile call graph. They find that triangles aretypically characterized by shorter geographical distances andcall durations than the average network behavior.
Another measure of the cluster structure within a graph isthe presence of cliques, i.e. complete sub-graphs in whichall the nodes are connected to each other. Onnela et al. [20]confirm that this feature holds in mobile call graphs as well,as the number of cliques they observe is much more importantthan what expected in a random graph.Temporal dynamics. A few studies have considered theevolution of mobile call graphs over time. Miritello et al. [27]perform a massive study on the temporal dynamics of a mobilecall graph, using a 19-month dataset covering more than 20million mobile customers in Spain. The authors show thatsubscribers tend to renew their social circle slowly, as morethan 75% of the ties remain active over the full timespan ofthe dataset. Moreover, a conservation principle of the socialnetwork size is observed, with a very similar number ofactivated and deactivated ties per individual. The results arealso related to user demographics, since male users displaylarger social circles than women, and younger users have morecontacts than older ones. Palla et al. [28] complement theseresults, by showing that large groups persist in time even inthe presence of important membership turnovers, while smallgroups have a significant lifetime only if their compositionremains unchanged.
2) Mobile call graph models: The natural step beyondthe characterization of a complex network is the definitionof models that capture its most significant properties. Thishas been the case with, e.g., classical models of the Internetor World Wide Web, such as Jellyfish [29] and Bow-Tie [30]models. A correct model of the mobile call graph has a numberof applications, including: (i) explaining the generative processbehind the formation of mobile call graph structures; (ii)creating call interaction networks from synthetic populationsof mobile users; (iii) anticipating the evolution of the mobiledemand.Treasure-Hunt model. Nanavati et al. [18] were the firstto propose a model of directed mobile call graphs. TheirTreasure-Hunt model divides graph vertices into three groups,depending on whether they belong to the graph strongly con-nected component (SCC), are able to reach such a component(IN), or are reached by it (OUT). It then tells apart edgesthat connect IN-IN (entry), IN-SCC (in-tunnel), SCC-SCC(maze), SCC-OUT (out-tunnel), OUT-OUT (treasure), or IN-OUT (shortcut) pairs. The Treasure-Hunt model is shown to
22The clustering coefficient of a vertex i is defined as ci = 2ti/di(di−1),where di is the degree of i and ti is the number of triangles to which i belongs.The average clustering coefficient of a graph is the average of all ci’s.
11
fit the directed mobile call graphs from mobile traffic datasetscollected in four different regions.Lognormal multiplicative process. Seshrandi et al. [22]propose a method to build a synthetic mobile call graph, bystudying the generative process of such a graph. To that end,the authors leverage datasets from two different time periods,and study the evolution of the user population and interactions.They conclude that the temporal growth of the graph followsa lognormal multiplicative process, already successfully usedto model income distributions. Lognormal multiplicative pro-cesses result in the DPLN distributions that the authors foundto characterize the vertex degree distributions, as discussed inSec. IV-A1.Migration model. Lambiotte et al. [21] argue that classicalmodels neglect the geographical distances associated to edgespresent in mobile traffic datasets. They thus propose a genera-tive model where vertices are represented by agents, which canmigrate from one region to another. Upon migration, an agentcan either maintain its previous edges, or create new oneswith vertices in the new region it moved to. The authors showthat the migration model captures the geographical diversity oftriangles in the graph, which are mostly composed of short-distance edges, yet at time include long-distance edges, asmentioned in Sec. IV-A1.
B. Demographics
The most direct usage of mobile traffic for sociology pur-poses is probably the study of how communication and mobiledevice usage patterns relate to demographics. A number ofsuch factors can be expected to shape the behavior of mobileusers, including, e.g., their age, gender, and interpersonal ties.Below, we review the main studies that focus on such issues.Age and gender. Age and gender are among the primaryfeatures from demography that play a major role in definingthe behavior of a user. This was first indicated by Yanget al. [31], in an early study where they unveil a strongcorrelation between social and demographic elements. Using asix-month mobile traffic dataset covering a large Chinese city,and mixing it with subscribers’ age and gender information,the authors find out that people in the same age groupcommunicate among them more often and for a much longertime, a result that holds throughout all age classes. Gender alsoplays a significant role, the results showing that calls betweenfemale users have a much longer duration than calls betweenmale users.
Sarraute et al. [32] confirm the age homophily at a countryscale, considering 500,000 users over the entire Mexico.However, cultural differences seem to play an important roleon gender-related patterns, as men make more and longer callsthan women in Mexico, i.e., the opposite of what happensin PRC. Gender impact on mobile communications has beenfurther investigated in a number of other countries. Stoica etal. [33] study an even larger dataset of 3 million subscribers inBelgium, and show once again differences between genders,with average call duration longer for women. Mehrotra etal. [34] outline that gender also affects intra-day and inter-daycalling dynamics in Rwanda. Specifically, they prove women
to call much more than men at nighttime, whereas the trend isreversed during daytime. Gender differences also emerge withrespect to special events, with women increasing their activityin proximity of, e.g., Valentine’s Day or political elections,and men doing the same during Year’s End holidays.
The significant impact of demographic factors on phoneusage implicitly invites to develop techniques to automaticallyinfer personal data of mobile subscribers from their callingprofiles. Wang et al. [35] identify social characteristics like theage group, income level, and residential region of 20 millionindividuals, by leveraging homophily properties of the mobilecall graph in combination with ground-truth data on a smalluser subset. The accuracy is in the 70-80% range in all cases.A similar approach is adopted by Brea et al. [36], who focuson age prediction of 74 million Mexican citizens. By using thecorrelation between demographic properties of users that areconnected in the mobile call graph, the authors successfullyclassify up to 72% of the population into four age categories.Ethnicity and language. In addition to genetic characteristics,also social features characterizing large groups of individualshave attracted significant attention in terms of mobile trafficanalyses. In this perspective, most works have addressed theproblem of recognizing ethnic groups from the network data,and understanding their properties and dynamics.
In a seminal work, Blondel et al. [37] analyse mobiletraffic of 2 million users in Belgium, and show that thetwo main ethnic groups in the country, i.e., Walloons andFlemish, can be clearly inferred from the mobile call graph.To that end, they extract communities, i.e., sets of subscriberswith strong communication ties between each other and withweaker connections to individuals outside the set. The problemof community detection, computationally expensive to solve inlarge graphs, is addressed by proposing an original technique,called Louvain method23, which has hence risen to becomethe standard approach for community detection in all types oflarge datasets, not necessarily limited to mobile traffic.
Toomet et al. [38], followed by Blumenstock et al. [39],study a mobile traffic dataset of Tallinn, Estonia, and identifytwo separate ethnic groups in the city. In addition, they inves-tigate the spatial segregation between the two communities,and find that, while segregation exists in residential and workneighborhoods, driven by an ethnic composition, the rest ofthe activities, e.g., shopping or entertainment, take place in avirtually non-segregated environment.
Morales et al. [40] separate24 ethnic communities in IvoryCoast. Linguistic identity plays, rather unsurprisingly, a fun-damental role in the ethnical separation. Also, mobile commu-nication is shown to occur by preference within ethnic groups.
23The Louvain method is a scalable heuristic based on modularity, i.e.,a benefit function designed to measure the strength of a possible partitionof a network into components. The Louvain method efficiently detects com-munities through an iterative two-steps process, repeated until the maximummodularity is achieved: the first step aims at optimizing the modularity locally,while the second step aggregates the nodes in the same community to createa new network.
24In [40], individual trajectories and language maps are employed to drawethnical links among users. Then, a K-means clustering is run on the resultinggraph, so as to identify the groups of users sharing strong interactions ofethnical nature. K-means is a partitional clustering algorithm that allowsseparating a set of items into K disjoint categories.
12
An equivalent analysis is carried out by Bucicovschi et al. [41]in the same country, using a spatial approach25.Economic factors. The socio-economic status of subscribersis characterized by three main factors: income, education andoccupation. If measured at an individual level, these measurescan indicate the role the person plays in the society. If averagedover a certain population, they are an important instrument tomeasure the development of a country or a region.
Soto et al. [42] define a comprehensive list of 279 mobileuser features, and use machine learning methods to showthat the economic levels of a customer can be predicted withan accuracy higher than 80% with only 38 such features26.As the result is obtained by still combining a quite largenumber of features, Smith et al. [43] argue that such amicro-measurement approach is too complicated and may lacktransparency in the end. Therefore, the latter authors also usemachine learning techniques, but target regions rather thanindividuals, and limit their analysis to four properties only: thesum of communication flows between the regions, the gravityresiduals27, the diversity28, and the introversion29. They showthat a limited training sample, as low as 10% of the totalmobile traffic data, allows determining the poverty index ofIvory Coast regions, although the spatial granularity can beimproved significantly with more complete training. In fact,correlations between poverty and mobile traffic on a per-region basis can be also found using simpler metrics, e.g.,the volume of outgoing calls. Indeed, Mao et al. [44] finda negative relationship of the latter with economic indicatorssuch as the poverty rate and annual income of 19 regions inIvory Coast. The authors explain this result by the fact that thecommunication fee is generally paid by the initiator of the call,and people in richer regions have greater means to start a call.Also, by exploring communities in the mobile call graph ofeach region, they show that rich areas have a tendency to splitin many small communities, whereas poor areas display lessheterogeneity and segregation in the communication patterns.
Wakita et al. [45] use mobile traffic to determine theindustrialization level and the economic status of differentregions in Ivory Coast. The authors first identify large citiesas hubs of antennas with high social tie strength30. Then, theyuse time series of the average daily human activity to tellapart residential, working, and mixed zones in urban and non-
25In [41], a combination of gravity and Potts models is employed. A q-statePotts model is a spin model used to represent multi-body systems in statisticalmechanics, and has important applications in segmentation problems.
26Key features include the number of weekly calls, the reciprocity ofcommunication, the median of total number of calls, the individual area ofinfluence, the radius of gyration, the total number of towers used, and thetraveled distance.
27The gravity residuals are the errors between the real and estimated flowsamong each pair of regions u and v. The latter is Fuv = gmumv/d2uv .There, g is a constant, mu is the population of region u, and duv is theeuclidean distance between the centroids of regions u and v.
28Considering vij to be the fraction of region i flow that goes to region j,the diversity of i is ∆(i) = −
∑j vij log(vij) log(vij)/ log(ki), where ki
represents the number of regions to which region i is connected.29The introversion of a region i is I(i) = fii/
∑j 6=i fij , where fij is the
flow between regions i and j.30The strength of a social tie between two antennas i and j is computed as
wij = cij/(pipj), where cij represents the number of calls made betweenthe antennas, and pi is the estimated population covered by antenna i.
urban areas. Their results show that the economy of citiesin Ivory Coast is still largely dependent on agriculture, asurban areas do not show a clear separation of residential andworking zones, except for the capital city, Abidjan. Furtherproofs are provided by Fajebe et al. [46], who find positivecorrelations between the mobile communication volume andthe availability of commodities such as coffee, cocoa or palmoil in different regions of the same country.
Original metrics and tools have also been introduced in theattempt to fill the gap between mobile communications andeconomic development. Lim et al. [47] propose the conceptof social capital, i.e., a series of social attributes with aneconomic impact. Using classical clustering approaches onthe mobile call graph, the authors show that communitiesof mobile users with similar social capital can be foundin the Ivory Coast population. Similarly, Frias-Martinez etal. [48] propose a tool named CenCell that infers the socio-economic level of mobile subscribers from the behavioralpatterns obtained from their call records. CenCell attains 50%to 70% accuracy, depending on the classification type. On arelated note, Krings et al. [49] leverage community detectiontechniques31 in mobile traffic datasets so as to identify businessleaders in the Brazilian economic system. The authors analysethe mobile communications of 6 million business subscribersworking in 334,000 companies in Brazil, and individuatecompanies and their leaders with a 70% accuracy.
C. Environment
Not only the demographic aspects, but also the geographicaland social environment where users reside affects their mobilecommunication patterns. Below, we summarize the main re-sults concerning prominent environmental features that havean impact on mobile traffic.Geographical distance. Geographical locations can induceimportant biases on many human habits, and telecommuni-cation patterns are no exception. In a seminal work, Onnelaet al. [50] focus on the most basic geographical property, i.e.,physical distance. Using a one-month, country-wide dataset,they assign to each of the 3.4 million subscribers a geograph-ical coordinate, corresponding to the base station they use themost. By studying the mobile call graph at the light of thedistance of each user pair, they find that the probability of atie, i.e., mobile contact, between two users follows a power lawwith respect to their distance32. Interestingly, the tie strength,i.e., the call volume between the two users, is shown not tovary with distance.
In fact, Wang et al. [51] show that the overall distributionis the composition of two types of communication ties. Thefirst type emerges among users with a strong co-location
31In [49], the authors employ the Louvain method to tell apart companiesand sub-groups in each company. They then use an original metric of leader-ship, suggesting that leaders are not necessarily the users who communicatethe most, but those who have ties with entities in all sub-companies, and thatare also tightly linked to each other.
32Denoting as l the distance between a user pair, then the probability of atie between the two users is P (l) ∼ l−γ , where γ = 1.5 in [50]. This meansthat a vast majority of communications are geographically bounded, yet thereexists a heavy tail of long-distance ties.
13
rate33. Such users are deemed to be friend, and their favouritelocations are in proximity of each other: thus, such tiesdetermine the large number of short-distance links observedin the overall distribution. The second type of tie belongsto users with zero co-location rate, which instead establishlong-distance communication and cause the heavy tail of thedistribution.
These results suggest how the analysis is the most interest-ing when restricted to groups of subscribers who share someform of social interaction. In this perspective, Lambiotte etal. [21] show that groups of three users who call each otheroften tend to live within short geographical distance, and,incidentally, have quick calls. Wang et al. [51] confirm sucha result, and comment on its implication that communicationties are not uniform over space, but are more likely formed byusers who live in proximity. The authors corroborate the con-clusion by studying how the distance among users’ preferredlocations affects their mobile interactions. They identify a clearpercolation threshold at around 10-20 km, meaning that almostall communications in the network occur among subscriberswho live within such a distance from each other.
Analyzing the communities in the mobile call graph alsoallows Onnela et al. [50] to unveil the geographical propertiesof groups of individuals who maintain an important communi-cation activity among themselves. The geographical span34 ofa community is found to depend on the size of the community:it is almost constant at around 50 km for communities withless than 30 users, then it sharply increases over 100 km forlarger communities.
Krings et al. [52] group mobile customers by their billingaddress, and obtain a communication network between 571cities in Belgium. By studying this graph, the authors showthat inter-city communication follows a gravity model35. Thisresult thus corroborates that mobile communication distancetends to be heavy tailed. On a related aspect, Schmitt et al. [53]also suggest that the average call duration increases as theinter-subscriber distance increases.Urbanization and land use. Living in an urban or ruralenvironment yields sociological differences that reflect onmobile traffic. Eagle et al. [54] use four years of mobile trafficdata collected over a whole country to study the differencesemerging between urban and rural users. The authors findthat subscribers in urban areas communicate 50% more andwith more people than those in rural areas, although the latterhave, on average, longer conversations with their interlocutors.Schmitt et al. [53] complement these results, showing thatsome segregation exists between urban and rural regions, asusers in rural zones tend to communicate more among themthan with individuals living in cities. These trends do not
33The co-location rate of a pair of users is the probability that they appearin a same location and at the same time.
34The geographical span of a community C is an indicator of howspread out are the n members of the community, and is defined as D =1n
∑i∈C
√(x− xi)2 + (x− yi)2, where (x, y) are the coordinates of the
community geographical center, and (xi, yi) are the geographical coordinatesof a user i belonging to the community.
35The gravity model defines the communication intensity cij between twocities i and j as cij = pαi p
βj /d
γij , where pi is the population of city i, and
dij is the geographical distance between i and j. In [52], γ = 2.
change when considering migrations among the two types ofareas: Eagle et al. [54] show that the call volume of individualsmoving in urban areas increases, while the call volume towardsthe rural region of origin decreases.
In the urban context, several studies found a significantrelationship between land use, i.e., the type of activity ageographical area is destined to, and mobile traffic in theregion. In an early work, Almeida et al. [55] group basestations in Lisbon according to the land use of the area whereeach base station is located. They then study mobile trafficwithin the different groups, and find its temporal evolutionto be similar in residential and suburban areas. Areas includ-ing major transport arteries yield instead a diverse temporalprofile.
Also mobile traffic hotspots, i.e., high-activity locations,depend on land use. Trestian et al. [56] identify day, noon,evening and night hotspots in a metropolitan region, and findthem to be correlated with the nature of the geographical areathey reside in. Similarly, Vieira et al. [57] show how basestations in downtown undergo heavy loads during mornings ofweekdays, whereas base stations in commercial and businessareas become hotspots during the rest of the weekdays. Inthe weekend, hotspots appear around commercial and businesscenters in the morning and afternoon, and at commercial andnight life areas in the evening and at night.
The difference in the spatial distribution of mobile trafficbetween working days and weekends is recorded by otherworks as well. Pulselli et al. [58] employ geographical plotsof the aggregate daily demand in Milan, Italy, and noteactivity to be concentrated in the city center during weekdays,and in peripheral residential areas during weekends. Similarbehaviors are found in considerably different environments,such as Abidjian, Ivory Coast, as discussed by Naboulsi etal. [59]. Again, land use appears to be a main explanation: asan example, Girardin et al. [60] detect a high level of activityclose to the train station in Rome, Italy, during weekdays,whereas significant mobile traffic is generated during theweekends around the Colosseum, a major tourist attraction ofthe city. At a finer spatial granularity, Bajardi et al. [61] focuson precise points of interests, and show how a combinationof overall traffic volume and entropy in the mobile activity ofinternational users36 is a good estimator for the popularity oftourist locations.
An interesting dual problem is that of detecting land usefrom the dynamics observed in mobile traffic data. Toole etal. [62] exploit land use zoning information for the Bostonmetropolitan area to compute time series of average mobilephone activity for different neighborhoods, belonging to onein five categories: residential, commercial, industrial, parksand others. The authors show that the residual activity 37 inthese areas is different, and can be mapped to the daily andweekly cycles of human activities. The authors also test a
36The entropy is computed as Si = −∑c pi,c · log(pi,c), where pi,c is
the fraction of mobile phone activity in a cell i that is related to internationalusers from a country c.
37The residual activity time series of an area is obtained by subtracting theoverall average behavior from the activity time series of the correspondingarea
14
supervised classification algorithm, trying to predict the landuse in a certain area based on its mobile phone activity. Facedwith mediocre results (54% classification accuracy over theentire city), the authors argue that the problem lies in thequality of the ground truth data, which is incomplete andinaccurate. After confirming that the nature of mobile trafficdepends on the local land use, Soto et al. [63] take on areverse approach, and cluster38 base stations on their trafficvolume. They find the resulting groups to be associated towork, residential, hybrid, nightlife, and leisure regions – whichare thus characterized by unique traffic profiles.
An improved technique is developed by Cici et al. [64],who decompose39 the mobile traffic time series into seasonal(i.e., due to routine) and residual (i.e., due to one-time events)communications. By clustering geographical locations thatshow similar seasonal communication, the authors can detectland use with a higher accuracy, as demonstrated by thecomparative evaluation against ground truth data. Furno etal. [65] present another approach to define mobile traffic signa-tures 40 that outperforms previous proposals when confrontedto ground truth land usage in two different urban areas. Asimilar approach is adopted also by Grauwin et al. [66] toprovide a coarser detection41 of land use in three major citiesworldwide.
Alternative approaches have also been proposed. Ma et al.address the same problem of land use detection leveragingpoint measures computed at each cellular base station 42.Results are aligned with those obtained by the previousworks above. Secchi et al. [68] perform instead a combinedspatiotemporal analysis 43 that allows extracting importanttemporal patterns and relating them to specific urban areasat once. The results pinpoint the typical network usage thatpermeates the city of Milan, Italy, as well as several uniquepatterns referring to, e.g., transportation hubs and fair areas.Special events. Human-inhabited environments often featurespecial events that induce unusual mobile communicationpatterns. Events such as political happenings (e.g., electionsor manifestations), entertainment occasions (e.g., concerts,sports games), and accidents (e.g., power outages or exceptionroad congestion) can produce anomalies in the cellular accessnetwork load, which can be detected by, e.g., clustering thespatiotemporal dynamics of mobile traffic. An early attempt isthat by Candia et al. [69], who propose to detect anomalousevents by measuring the gap between the current and mean
38The authors apply K-means, with K chosen by a stopping rule maxi-mizing the ratio of the inter-cluster to intra-cluster distances.
39The authors use a Fast Fourier Transform (FFT) to infer the seasonalportion of the mobile traffic signal, and deem the rest of the signal as residual.
40The authors employ the median hourly volume of calls and text messagesobserved over a week-long time period as a signature of traffic at each cellsector.
41Six land use classes are identified in [66], against several tens inferredin [64], [65].
42The authors compute scalar values of the fluctuation, non-determinacy,usage diversity, and temporal homogeneity of mobile traffic at each basestation. These values are gathered into a Laplacian matrix. Then, spectralclustering is run on the matrix in order to derive three to nine types of landuse.
43The authors treat mobile traffic as functional data, and perform Treeletdecomposition while accounting for spatial dependence via a Bagging Voronoistrategy.
number of calls occurring within groups of closely-locatedbase stations. They find the methodology to be highly sensibleto the gap threshold. Similar approaches have been taken,more recently, by Calabrese et al. [70] and Dixon et al. [71]:both leverage large variations in mobile traffic volumes toidentify large-scale social events, national holidays, or powernetwork outages. The former authors can even track back theorigin location of crowds participating to events taking placein Boston, MA, USA.
More complex techniques for special event detection havealso been proposed. Gowan et al. [72] use a hierarchicalclustering technique to isolate the special communicationpatterns emerging during soccer games. Naboulsi et al. [59]introduce a dedicated framework to detect general outlyingbehaviors, based on the hourly geographical variations ofmobile traffic. The authors can detect a number of specialevents, including national holidays, political happenings, andsport events. Cici et al. [64] use instead information onresidual communication39 in order to determine how differentgeographical areas are affected by a same unusual event.By doing so, the authors show that it is possible to unveilsocially connected regions of a city. Finally, Bajardi et al. [61]employ the entropy in the mobile activity of internationalusers36 as a source of information. Specifically, they detectoutliers in the entropy value measured at different locations,and consider them as indicators of special events that affectone or more foreign communities. This approach allows theauthors to accurately trace, e.g., the unusual activity of footballsupporters within an urban region, before, during and afterinternational matches.
Attention has also been paid to events that are not theresult of social behaviors, but of natural or human-causeddisaster situations. In an extensive study, Bagrow et al. [73]focus on emergency situations. Using a dataset covering 10million users for two years, the authors select four such eventsoccurring in the target region: a bombing, a plane crash, a mildearthquake, and a power outage. The mobile traffic activityfollowing these events is compared with that of regular days,as well as with that recorded in presence of special plannedevents, such as concerts and festivals. While all the specialevents, both emergency and non-emergency, result in increasedcall volumes over the typical patterns, the mobile activitygrowth is immediate for actual emergencies, and more gradualfor planned events. Moreover, the magnitude of the increase iscorrelated with the severity of the event: the bombing resultsin the highest number of calls, followed by the plane crash,the earthquake and the blackout. Diversity emerges also from ageographical perspective: in all cases, the activity change is thehighest in proximity of the event epicenter, and exponentiallydecays with distance. When communication hops in the mobilecall graph are considered, major emergencies propagate fartheraway from the epicenter: the activity following the bombingand plane crash events is shown to quickly reach three-hopneighbors of the eyewitness population. A similar study iscarried out by Linardi et al. [74] on violent incidents occurringin Ivory Coast between 2011 and 2012. The authors show thatsuch events are not preceded by any unusual calling activity,but are followed by an increased mobile traffic volume. More-
15
over, they also highlight an important medium-term effect,with a significant increase in the call volume enduring forseveral days after each violent episode.
As a final remark, we stress that correlations betweenspecial events and mobile traffic are also very relevant tonetwork studies. While the works reviewed in this sectionconcern the problem of detecting special events from theanalysis of mobile traffic, networking research has mainlyfocused on the dual problem, i.e., the characterization of theimpact of social events on the mobile demand. Indeed, thelatter is critical to the design of networking solutions thatcan better accommodate any exceptional dynamics generatedby unusual situations. Thus, we refer the interested readerto the relevant, although more networking-oriented, works inSec. VI-A1, special dynamics tag.
D. Epidemics
Mobile traffic encloses data about the movement of largemasses of individuals. This kind of information, other thaninteresting per se, as thoroughly discussed in Sec. V, isparamount to a better understanding of the spreading dynamicsof infectious diseases. Indeed, by cross-correlating mobiletraffic datasets with statistics on the propagation of contagiouspathologies, it is possible to draw original models and proposecontainment solutions that effectively operate in very large-scale scenarios.Epidemics characterization. Many works have investigatedwhether patterns present in mobile traffic can be correlatedwith the diffusion of contagious diseases. Indeed, identifyingsuch relationships would pave the way to very effective but ex-tremely cheap techniques to anticipate and control outbreaks.
In a seminal work, Wesolowski et al. [75] study networksof mobile user movements and maps of malaria prevalencein Kenya, so as to identify relationships among commontrajectories of human mobility and parasite infection. Theauthors are able to pinpoint several importation routes thatfoster the diffusion of malaria among different regions ofKenya. A similar approach is adopted by Enns et al. [76], andGavric et al. [77], who compare mobility and communicationnetworks derived from mobile traffic to maps of malaria andHIV prevalence, respectively. The former authors find thatthe regions of Ivory Coast showing the strongest connections,in terms of both movements and mobile communication, arealso those where the malaria parasite is the most present.The latter authors draw regression models based on mobilecommunication features that attain very strong correlationswith HIV prevalence in the country. At the light of theseresults, both works suggest to account for mobility informationwhen designing infectious diseases control strategies; thisappears especially important for movements among regionsof varying prevalence, so as to avoid malaria being carriedfrom areas of high infection to areas of low infection.
Simpler analyses do not appear to yield equally significantinformation. For instance, Baldo et al. [78] explore spatialcorrelations among influenza cases and calls occuring inproximity of main hospitals in Ivory Coast, but their resultsshow that there is no correlation between the two metrics. Ndie
et al. [79] explore instead correlations between call exchangerates and HIV prevalence rates among different regions ofIvory Coast, but do not find significant correlations.
Mobile traffic also encloses data about the movement ofa vast amount of individuals during contagion outbreaks,which allows refining traditional epidemics representations,such as the Susceptible-Infected-Recovered (SIR) model andits variants. The SIR model builds on a macroscopic approach,and divides the population into groups of people who are (i)susceptible to catch the disease, (ii) infected by the diseaseand capable to transmit it, and (iii) recovered from – andthus immune to – the disease. Each individual can thentransit from the first to the third phase above. The standardSIR model can be augmented with geographical mobilityinformation derived from fine-grained mobile traffic, as doneby Chunara et al. [80]. They developed an extended SIRmodel by including an additional model stage, where so-calledcarrier individuals (hence the new model name, SCIR) diffusemeningitis through their physical movements. An alternativeapproach is proposed by Azman et al. [81], who parametrizea SIR model with transition rates that depend on mobilitycurves fitted on mobile traffic as well as on meteorologicaldata. However, Tizzoni et al. [82] question the validity ofSIR model variations based on mobile traffic. They considerthree different European countries, namely France, Spain andPortugal, and they compare the results of a SIR model runon mobile subscriber commuting movements against thoseobtained when the same model is applied to reliable censusdata. The authors show that mobile traffic leads to overestimatethe actual commuting flows, which in turn introduces somebias in the infection process. Still, the network data allowsinferring somehow meaningful arrival times of the disease atdifferent regions of a country, with an error of 2-3 weeks.
While the analyses above provide a macroscopic view ofthe epidemics, other works have focused on a fine-grainedmicroscopic-level characterization. Frias-Martinez et al. [83],[84] have been using an agent-based model to capture socialpatterns that can explain the spreading of infectious diseases.Operating on a per-individual basis, their model can takepersonal features into account, unlike what happens with, e.g.,aggregated SIR models. The results obtained using such adetailed model indicate that different countermeasures adoptedby the Mexican government in occasion of the 2009 H1N1 fluoutbreak have retarded the infection peak, and decrementedits impact by 10%. However, the decisions did not impact thespatial evolution of the virus. Saravanan et al. [85] enriched themicroscopic approach based on mobile agents above with thenotion of importance of individuals. The latter information isextracted from the mobile call graph44, and reveals especiallyuseful for designing epidemics control policies targeted onindividuals.Epidemics prevention and containment. Mobile traffic can
44In [85], influential members are identified by means of the Shapley value,which assigns a high score to subscribers who maintain a high number ofconnections with users who are instead scarcely connected. Formally, theShapely value of a user i is shi =
∑j∈V h
i1/(1 + dj), where V hi is the set
of users within h hops from i in the mobile call graph, and dj is the degreeof user j.
16
be used not only to understand disease spreading, but alsoas an instrument of control. This has led to the proposal ofsolutions that mitigate the spreading of diseases and involve,to different extents, mobile communications.
Leidig et al. [86] propose to reduce the diffusion of theinfection by rapidly spreading awareness of the danger. Tothat end, ego networks45 are leveraged to identify46 a limitedset of key individuals who can propagate information aboutthe disease in a rapid and reliable manner. Kafsi et al. [87]present three other strategies that aim to the same goal. Thefirst strategy extracts trajectories from mobile traffic so as todetect geographically localized communities of users: then, apolicy is enforced that forbids inter-community movementsduring outbreaks. The second strategy leverages the mobilecall graph, and identifies social communities within it: then,inter-community contacts, deemed to foster the infectiousprocess, are prohibited. The third strategy is adaptive withrespect to the disease spreading status, as it avoids trips ofmobile subscribers from regions of high prevalence to areasof low prevalence.
A more comprehensive study is provided by Lima etal. [88], who evaluate the contagion via a legacy SIR model,when (i) no countermeasure is adopted, (ii) geographic quar-antine is enforced, and (iii) an information campaign is runamong the population. The authors leverage country-widemobile traffic data of Ivory Coast to model individual mobility,and to outline the mobile call graph on which informativecommunication occurs in the last case before. Results showthat a geographic quarantine, despite being invasive, expensiveand hard to enforce, reduces the endemic size, but does notslow down the disease spreading. Instead, a collaborativeinformation campaign attains a significantly lower fraction ofinfected individuals, even for low participation rates of thesubscriber population.
V. MOBILITY ANALYSIS
Mobile data is an excellent source of knowledge on themovement of individuals. It can provide information aboutthe mobility dynamics of populations of millions, impossibleto obtain otherwise. Moreover, it allows doing so at virtuallyno operating cost. It is thus unsuprising that mobile datahas rapidly established as a key new source in the field ofmobility modeling, complementing and replacing traditionalapproaches based on, e.g., surveys or traffic counters. Thenovel mobility models obtained from mobile data are expectedto affect a number of fields, including urban planning, roadtraffic engineering, human sociology, epidemiology of infec-tious diseases, or telecommunication networking.
In the following, we review the body of most relevantworks that leverage mobile data to study human mobility.We distinguish three major subcategories. Sec. V-A discussesresearch on the characterization of human mobility, whose
45An ego network is a subset of the mobile call graph (see Sec. IV-A1),pruned so as to form a tree structure rooted at a specific individual. It thusrepresents mobile user interactions from the perspective of that individual.
46In [86], the authors employ a dedicated measure of an individual’simportance, which approximates the number of communities formed byhis/her neighbors in the ego network.
goal is to better understand and model how people travelat different spatial and temporal scales. Sec. V-B surveys theexploitation of mobile data for transportation research, wherethe aim is characterizing the usage of road and public transportinfrastructures. Sec. V-C presents results on the reliability ofmobile data for studies on mobility.
Tab. II summarizes the works reviewed in these sections, andprovides an overview of the features of datasets they employ.It also outlines which works deal with each research aspect ofmobility-oriented analyses of mobile traffic: it thus representsa useful quick reference for the reader.
A. Human mobility
The characterization of generic human mobility from mobiledata aims at: (i) the investigation of the fundamental laws thatgovern movement patterns; (ii) the proposal of mathematicalor simulative models capable of reproducing such patterns. Wenext separate works relating to these two subjects.
1) Fundamental laws: Laws derived from mobile dataanalysis can relate to multiple facets of human mobility, whichwe use below to structure the relevant literature.Visited locations. How individuals visit geographical loca-tions47 represents the very first subject addressed by stud-ies that employ mobile data to infer human mobility laws.The seminal work by Halepovic and Williamson [96] usesa relatively small dataset of 4,156 users, and describes themobility of users in terms of the number of cells they visit. Theauthors find mobility to be generally low, as 55% of users onlyappeared at one location; yet, the distribution is heavy-tailed,i.e., there exist users who visit hundreds of cells in one week.The imbalance in user mobility is later confirmed by Paul etal. [97] in a much larger, nationwide dataset. They show that60% of the customers are static, but 1% travel through 50cells or more in a day, on average. Subsequent works haveconfirmed the heavy tail of the visited location distribution,e.g., those by Scepanovic et al. [98], and Hess et al. [99].
Halepovic and Williamson [96] also outline the presenceof one clear preferred location48 for every user, which theyrefer to as the home location. Later, Isaacman et al. [103]prove the definition to be correct, as mobile data analysis canreveal the important locations of a user, including home and
47Identifying the locations where a user stops from mobile data is non-trivial, as the latter provide an irregular sampling over time with lowgeographical accuracy. Stop locations are typically mapped to pauses in themovement longer than a time threshold [89]–[91], possibly allowing the userto dwell at multiple antennas within a space threshold [70], [92]–[95].
48The extraction of important locations from mobile data has been per-formed with diverse approaches. Several works tag as home the most popularlocation for each user [91], [96], [100] Other authors adopt the sametechnique, but limit the study to night time, when users are more probablyat home [56], [70], [93], [94], [101], [102], Likewise, work locations aretypically identified as the most frequent location during working hours [90],[101]–[104]. Thresholds may be enforced, so as to ensure that home andwork locations are considered such only if users spend there a vast portionof their time [145]. All such mechanisms can be complemented with antennaclustering, so that locations map to a group of nearby antennas rather than toa single one [82], [103], [105]–[107]. Notably different approaches have beenproposed by Frias-Martinez et al. [108], who use ground-truth data to train agenetic algorithm, and by Csaji et al. [109], who classify antennas on theirweekly time series and unveil three classes of frequent locations, mapping towork, home, and other places.
17
Analysis Dataset Focus
Name Date Operator Area Time Users V T D S Lo Tr RM PM SM IM AM RT OD Mu TP Co VP VA VI
Hum
anm
obili
ty
Fund
amen
tal
law
s
Halepovic [96] 10/05 3G – 1 week (2004) 4 K X X X X
Paul [97] 04/11 – Nationwide 1 week (2007) ∼100 K X X X
Frias-Martinez [108] 12/10 – City in emerging country 5 months 100 K X X
Isaacman [103] 06/11 AT&T NY, LA 3 months (2009/10) 170 K X X X
Trestian [56] 11/09 – 5000 km2 1 week 281 K X X X X
Sridharan [111] 04/13 – USA 1 month 10 M X X
Gonzalez [116] 06/08 – – 6 months 100 K X X X X X
Calabrese [93] 10/11 AirSage MA, USA 3 weeks 250 K X X X X X X X X X
Mitrovic [117] 05/13 Orange Ivory Coast 5 months (2012) 50 K X X X X
Zang [119] 09/07 3G 3 cities 1 month (2006) 2 M X X X X
Schneider [106] 05/13 Orange Paris, France 5 months (2012) 40 K X X X X X X
Song [120] 01/10 – – 3 months 50 K X X X
Lu [121] 10/13 Orange Ivory Coast 5 months (2012) 500 K X X X X
Lu [122] 05/12 Digicel Haiti 1 year (2010) 1.9 M X X
Isaacman [123] 02/10 AT&T NY and LA, USA 2 months) 170 K X X
Isaacman [124] 03/11 AT&T NY and LA, USA 4 months (2009/10) 170 K X X X X X
Rubio [112] 03/10 Telefonica – 4 months 410 K X X X X
Dixon [71] 05/13 Orange Ivory Coast 5 months (2012) 500 K X X X
Calabrese [70] 05/10 AirSage Boston, USA 2 months 1 M X X X X X X
Girardin [60] 10/08 Telecom Italia Rome, Italy 3 months (2006) – X X X
Bengtsson [126] 08/11 Digicel Haiti 7 months (2010) 1.9 M X X X
Linardi [74] 05/13 Orange Ivory Coast 5 months (2011/12) 500 K X X X
Csaji [109] 06/13 Orange Portugal – 100 K X X X X X
Mod
els
Song [110] 09/10 – – 1 year 1 M X X X X X X
Cho [100] 08/11 – Nationwide 1 year 2 M X X X X X X X
Hess [99] 06/15 Orange France 40 days (2011) 10 M X X X X X
Simini [128] 04/12 – – 4 weeks 4.3 M X X
Isaacman [129] 06/12 AT&T NY and LA, USA 3 months (2011) 600 K X X X
Mir [130] 10/13 AT&T NY and LA, USA 3 months (2011) 600 K X X X
Yang [131] 05/13 France Telecom Portugal and Rwanda – – X X X X X
Tran
spor
tatio
nsy
stem
s
Qiu [133] 01/07 – Shanghai, PRC 1 year 9 M HO X X X
Bar-Gera [136] 12/07 Orange/ITIS Ayalon freeway, Israel 3 months – HO X X
Schlaich [89] 01/10 T-Mobile Sout-West Germany 3 months – LU X X X X
Janecek [137] 09/12 – one highway, Austria 1 month (2011) – X X X X
Calabrese [139] 03/11 Telecom Italia Rome, Italy Time – X X X X X X
Ma [95] 11/13 AirSage Sacramento, USA 1 month (2010) 128 K X X X X X X X
Bekhor [91] 06/13 Orange/ITIS Israel 1 week 160 K X LU X X X X
Nanni [107] 05/13 Orange Ivory Coast 5 months (2012) 500 K X X X X
Mamei [104] 05/13 Orange Ivory Coast 5 months (2012) 500 K X X X X X
Lenormand [102] 08/14 – Madrid–Barcelona, Spain 2 months (2009) ∼500 K X X X X X X
Wang [92] 09/10 AirSage Middlesex, USA 1 month 56 K X X X X X X
Doyle [142] 06/11 Meteor Ireland 1 week (2009) 1 M X X X X
Zilske [143] 05/13 Orange Abidjan, Ivory Coast 5 months (2012) 18 K X X X
Berlingerio [94] 05/13 Orange Abidjan, Ivory Coast 5 months (2012) 18 K X X X X X
Cici [105] 02/13 Telefonica Madrid, Spain 3 months 4.7 M X X X X
Zhang [114] 09/14 – Shenzhen 1 year (2014) 10 M X X X X X X
Furletti [144] 08/12 – Pisa, Italy 1 month (2012) 230 K X X
Scepanovic [98] 05/13 Orange Ivory Coast 5 months (2012) 500 K X X X X X X
Liu [90] 05/13 Orange Ivory Coast 5 months (2012) 500 K X X X X X
Kung [145] 05/13 Orange, STC, AirSage Several countries months (2006-2013) 18 M X X X X
Val
idat
ion
Tizzoni [82] 09/13 Orange 3 cities – 6.8 M X X X X X
Douglass [125] 05/15 Telecom Italia Milan, Italy 2 months (2013 – X X X X
Wesolowski [127] 02/13 – Kenya 1 year (2008/09 14.8 M X X X X
Iovan [146] 05/13 Orange Paris, France 1 day (2009 4 M X X X X X
Hoteit [113] 05/14 AirSage MA, USA 4 months (2009 1 M X X X X X X
Ranjan [101] 07/12 3G S.Francisco, USA 1 month (2011) 500 K X X X X X
TABLE II: Main features of works that leverage mobile traffic data towards mobility analysis. In the analysis columns, dateis the publication month/year. In the dataset columns, V is voice, T is texting, D is data, and S is signalization (either HO,i.e., handover, LU, i.e., location updates, or X, i.e., both). In the focus columns, Lo is properties of visited locations, Tr isproperties of travels between locations, RM is regular mobility patterns, PM is prediction of mobility patterns, SM is specialmobility patterns, IM is individual mobility models, AM is aggregate mobility models, RT is road traffic conditions, OD isorigin-destination flows, Mu is multimodal mobility, TP is transport planning, Co is commuter mobility, VP is validation ofpopulation distributions, VA is validation of aggregate mobility, and VI is validation of individual mobility.
18
work locations, with a typical accuracy of 1 mile. Trestianet al. [56] confirm that trend, finding mobile subscribers tospend between 55% and 90% of their time, depending ontheir level of mobility, at the same three locations. Schneideret al. [106] study the distribution of the number of differentlocations visited daily by mobile subscribers. They find thedistribution to be log-normal49, with a small average valuearound three, thus confirming the low mobility of most users.
The temporal features of visits to locations are more thor-oughly explored by Song et al. [110], on a larger dataset of50,000 users. They study the time spent by an individual ata given location, finding that it follows a truncated power-law distribution50. They also investigate the number of distinctlocations visited by a user over time, showing that humanshave a decreasing tendency to visit new locations over time51.
Recently, Sridharan and Bolot [111] have shown that a sin-gle distribution can describe the scaling properties of multiplefeatures related to the locations visited by a user. Specifically,the Double Pareto LogNormal (DPLN) distribution52 describeswell the area of the minimum rectangle bounding all locationsvisited by a user, or the distance between groups of popularlocations. Interestingly, such a property is invariant of thelocale (i.e., the considered region) or geographical span (i.e.,city- or country-wide) of the analysis.Travel distance. The distribution of distances53 between sub-sequent locations has also attracted significant attention. In aseminal work, Gonzalez et al. [116] employ voice and textmobile data from 100,000 users to show that such traveldistances follow again a truncated power-law distribution54.This result is in agreement with those of Halepovic andWilliamson [96], as both imply that a large portion of thepopulation is characterized by limited mobility, but there existsa non-negligible number of highly mobile individuals whotravel over long distances.
The travel distance law above refers to the case wherethe displacements of all users are aggregated into a single
49Denoting as n the number of visited locations, then P (n) ∼exp
[−(ln(n)− µ2)/(2σ2)
]/(σn
√(2π)), with µ = 1 and σ = 0.5.
50Denoting as t the time spent at a location, then P (t) = t−γexp(−t/k),where γ is the tail weight, and k is duration at which the exponential cutoffoccurs. In [110], γ = 0.8 and k = 17 hours – the latter value matching thetypical daily activity period of an individual.
51Denoting as n(t) the number of visited locations at time t, then n(t) =tµ, with µ = 0.6. For random walks µ = 0.8 and for Levy flights µ = 1,implying that these random models yield a much stronger tendency to visitnew locations over time than found in real-world mobile data.
52See footnote 16 for more details on DPLN.53Travel distances are computed over the trips or trajectories of each user.
The extraction of the latter from mobile data is typically performed bymapping trips to sequences of geographical points (i.e., the positions wherethe user carries out some mobile traffic activity) between each two successivestop locations [70], [89], [93], [94], [112]. Then, a simple linear interpolationprovides a good approximation of user movement [113]. Some works also adda second phase where trips that are too short are aggregated [91], or trips thatform a small-distance loop within a brief time interval are discarded [95].Recently, state-of-the-art techniques used in GPS trajectory reconstructionhave been also adapted to the case of mobile traffic data [114]. Database-inspired approaches have also been explored by Vieira et al. [115], whodevelop a query system to retrieve user trajectories from call detail recorddatabases, under complex geographical and temporal conditions.
54Denoting as d the travel distance between two subsequent locations, thenP (d) = (d + d0)−αexp(−d/k). According to Gonzalez et al. [116], α =1.75 and the exponential cutoff k = 400 km.
distribution. Interestingly, Gonzalez et al. [116] find that alsodistances traveled by each user follow truncated power-lawdistributions, with different cutoff values that map to theuser’s radius of gyration55. Since the low spatial and temporalgranularity of voice and text mobile data used by Gonzalez etal. might have biased the analysis (see also Sec. V-C), Song etal. [110] carry out a similar study using data from 1,000 userswhose location was recorded every hour, thanks to a location-based service they subscribed to. Yet, their results confirm56
the truncated power-law nature of distances.In fact, the truncated power law scaling of travel distance
appears to be a global property, invariant of countries orcontinents. While the analyses above were performed onmobile data collected in European countries, similar resultshave been obtained by Calabrese et al. [93] and Mitrovic etal. [117] from mobile data collected in Massachusetts, USA,and in Ivory Coast, respectively57. The same distribution isretrieved also when computing all travel distances with respectto a user’s home location58, according to Cho et al. [100]. Thesame authors unveil an interesting twist, by relating mobiledata to social georeferenced networks – namely, Gowalla andBrightkite. Cross-referencing the datasets allowed them toconclude that short-distance travels (below 100 km) are betterexplained by routinary behaviors, such as home-workplacepatterns, while long-distance travels are much more influencedby social ties, such as the presence of friends.
As a final remark, we stress that the scaling properties oftravel distances inferred from mobile data appear to hold overlarge geographical scales (i.e., in the case of country-wide andinter-urban movements) only. Recent works based on finer-grained sources, such as GPS-based tracking, public transportusage, or individual surveys, have shown that human travelswithin cities follow a different, exponential scaling [118].Spatiotemporal regularity. One of the most talked-aboutresults of mobile data analysis is that individuals tend tohave strong regularity in their movement patterns. That is truein both spatial and temporal dimensions, as first claimed byGonzalez et al. [116]. These authors show that: (i) the popu-larity of locations visited by a user follows a Zipf’s law59, thusindividuals tend to have a few preferred locations, and a longtail of seldom visited ones; (ii) there is a strong habit by usersto return to previously visited locations within 24 hours, whichhighlights the temporal periodicity of movements. Here again,the results by Gonzalez et al. confirm those by Halepovicand Williamson [96], in that most individuals spend the vastmajority of their time at a limited number of frequently visitedlocations.
55The radius of gyration rg is a unidimensional measure of the distancetraveled by a user, which also keeps into account the direction of movement.It is computed as rg =
√1/n
∑i(ri − 1/n
∑i ri)
2, where ri, i ∈ [1, n]is a bi-dimensional vector describing the i-th location of the user.
56In [110], α = 1.55 and k = 100 km: the latter is limited by the 1-hourperiodicity of sampling.
57Calabrese et al. found α = 0.78 and k = 60 km, while Mitrovic et al.found a cutoff at around 100 km.
58In the study by Cho et al., α = 1.7 and k = 100 km: the latter is limitedby the small geographical coverage of the dataset employed.
59Given the rank l of a location, its level of popularity is described byP (l) = l−β , with β = 1.
19
Song et al. [110] employ their finer-grained mobile data,where the location of 1,000 users is monitored on an hourlybasis, to validate both the Zipf’s distribution of location pop-ularity60, and the 24-hour periodicity of movement patterns.Daily periodicity is also detected by Paul et al. [97] in a verylarge-scale dataset of millions of subscribers, and by Trestianet al. [56], who show that more than 70% of the mobileusers revisit at least one same location on every single day.Cho et al. [100] confirm the strong geographic and temporalregularity of human mobility, observing that users tend toreturn to the same places and travel at similar times of theday. Further evidence is provided by Hess et al. [99], whofind that 78% of 500,000 users in nationwide dataset revisitthe same locations, and that the revisit probability is higherwithin 24 hours and after one week. The latter result indicatesthat the strong periodicity in user movements does not onlyappear at a daily scale, but also at a weekly scale, as supportedby Calabrese et al. [93] and Zang and Bolot [119].
The latter authors also identify strong regularity in theprecise sequences of cells visited by mobile users over time.A similar level of detail on the geographical regularity ofusers’ movements is considered by Schneider et al. [106],who employ motifs, i.e., closed sequences of transitions amongactivity locations, and unveil that each customer’s daily patternin a 40,000-user dataset can be described through one ofjust 17 motifs. The limited number of motifs, which includeno more than 6 locations each, further proves how humanmobility dynamics are simpler than one could expect.Predictability. The strong regularity of human mobility raisesthe question of how easy to predict are individuals’ move-ments. In a seminal work, Song et al. [120] try to answerthat question, by investigating the theoretical maximum pre-dictability of individual mobility patterns in a 50,000-usermobile traffic dataset. To that end, they define a measureof entropy that captures spatiotemporal ordering of the vis-ited locations61; when computed over all users, the measureshows that users’ movements yield very low randomness62:on average, 93% of individual movements are potentiallypredictable 63. The authors also prove that such a result is duenot only to the limited number of favorite locations frequentlyvisited by each user, but also to the strong spatiotemporalcorrelation in such visits.
Also, Song et al. [120] show that movement predictabilitystays constant throughout very heterogeneous sets of users
60In [110], β = 1.2.61Given the complete mobility li of a user i, expressed as a sequence of
locations li = {l1, l2, . . . , lN}, the entropy in his/her mobility is expressedas S = −
∑l′i⊂li
P (l′i)log2[P (l′i)]. There, l′i is one of all possible
subsequences found in li, and P (l′i) denotes the probability of finding thatprecise subsequence in li.
62The entropy distribution has a peak at a value corresponding to anuncertainty in the user’s whereabouts of 1.74, i.e., less than two locations.For comparison, the entropy of random mobility implies an uncertainty of 64locations on a similarly sized dataset.
63The maximum predictability is obtained from the entropy measure byapplying Fano’s inequality, which states that if a user with entropy Smoves among N locations, then his/her predictability is bounded by amaximum value Πmax that depends solely on S and N , through S =−Πmaxlog2(Πmax)−(1−Πmax)log2(1−Πmax)+(1−Πmax)log2(N−1).
(e.g., for different gender, age, geographical attachment). Luet al. [121], [122] confirm that such a high predictabilityof human movements holds also in the case of developingcountries, and even after major events like natural disasters.Other factors may instead have an impact on the predictability.As an example, by using a similar analysis on a one-year-longmobile traffic dataset of 2 million users, Cho et al. [100] showthat the entropy in the visited locations is lower (and thususers’ locations are more predictable) at night hours, whenpeople are at home, and much higher during weekends, whentravel destinations are more varied.Factors affecting mobility. A large number of factors canaffect the diverse human mobility laws identified above. Atypical example is that of movement patterns in areas withdiverse topological features or development levels. In theirstudies, Isaacman et al. [123], [124] show that mobile datacollected in two cities in the USA, New York and Los Angeles,yield very different mobility features. Similarly, Rubio etal. [112] demonstrate that mobile data can be used to showdifferences in the way people move in developed and emergingeconomies. In the latter context, and namely in developingcountries such as Ivory Coast and Kenya, different levels ofmobility, measured as the radius of gyration of subscribers,are found to be related to geographical regions and incomelevels by Scepanovic et al. [98] and Wesolowski et al. [127].
Seasonality, as shown by Isaacman et al. [123], [124],holidays, as shown by Dixon et al. [71], and public events,as shown by Calabrese et al. [70], are other examples ofphenomena that can all affect in a significant manner themovement of individuals, by changing their standard attractionlocations as well as the sheer volume of human mobility.
Even when dealing with non-typical mobility, mobile dataanalysis can reveal extremely useful. In an early work, Gi-rardin et al. [60] show that mobile data can help understandingthe mobility of tourists. Within a different scope, Bengtssonet al. [126] demonstrate that mobile data analysis yields veryaccurate estimations of the mobility of people after naturaldisasters or large-scale epidemics. The same holds for violentepisodes, as those that occurred in Ivory Coast between 2011and 2012 and investigated by Linardi et al. [74]. In particular,the authors show a strong impact of such episodes on humanmobility, with a reduction of inward mobility and an increasein the number of users leaving the region where the violencehappened. An interesting result is that the impact on mobilityis even observed beforehand, suggesting that these violentevents are predictable, due to societal tensions prior to theoutbreak.
From an engineering standpoint, correlations have also beenfound between the level of mobility of users and their demandin terms of mobile data traffic. Early results in that directioncan be found in the works by Halepovic and Williamson [96],Mitrovic et al. [117], and Dixon et al. [71]. We point howeverthe interested reader to more thorough discussions of traffic-mobility correlations carried out by networking papers that arereviewed in Sec. VI-A2.
As a closing remark on this discussion, a relevant questionis that of which factors are the most important in order tofully characterize users’ mobility. An interesting study by Csaji
20
et al. [109] proves64 that the only relevant features are theaverage position of the user and the location of the two cellsthe user is most frequently attached to. This suggests thatbasic geographical information is already largely sufficient fora comprehensive analysis of subscriber movement patterns.
2) Models: Models of human mobility can either describethe movement of individual users, or aggregate dynamics ofwhole populations. Next, we classify models derived frommobile data analysis according to their granularity.Individual mobility models. Individual mobility models rep-resent the movement of each user independently. A first mobiletraffic-inspired model of individual mobility was proposed byHalepovic and Williamson [96]. Their stochastic approachbuilds on (1) the empirical distribution of the number ofcells visited by a user, and (2) the empirical distribution ofcell changes by a user. The model generates the movementsof a given user by extracting realizations of the theoreticalfunctions fitting such two distributions.
Song et al. [110] propose a more refined model, based onanalysis of a dataset containing the activity of one millionusers for one year. The model relies on two complementaryphases. The preferential return phase, occurring with proba-bility (1−ρ)N−δ , lets the user return to one of the previouslyvisited N locations, chosen proportionally to the number ofpast visits. The exploration phase, occurring with probabilityρN−δ , lets the user choose a new location never visited before,thus incrementing N by one unit65. The residence time at alocation (in both phases) and the distance of a new location (inthe exploration phase) are drawn from the heavy-tail proba-bility distributions identified to characterize individual humanmobility as discussed in Sec. V-A1. The model is demonstratedto correctly reproduce travel distances and residence timesat locations, and it respects the location ranking as wellas the number of new visited locations over time, as seenin Sec. V-A1. However, the model only captures long-termscaling features, and neglects the temporal periodicity (e.g.,regular returns at every 24 hours) and the sequential patterns(e.g., home-work-home) in the visited locations.
A third relevant model is devised by Cho et al. [100] topredict the location of each individual at different hours of theweek. The model considers the N most popular locations foreach user66 and creates a spatial probability distribution thatshifts over time among gaussian-shaped distributions centeredat such location. A social component is also added to themodel, in a way that a portion of the movements becomesdriven by the previous locations visited by friends of the user.The model anticipates the exact user location 42% of the time,although a simpler model that assumes the user to be at his/hertop location on a hourly basis attains 40% accuracy.
Also related to individual mobility modeling is the clas-
64Csaji et al. [109] use Principal Component Analysis (PCA) on 50 featuresthat can be used to represent mobile users, and include, e.g., the number ofvisited locations, their geographical dispersal, the quantity and duration ofcalls. They find that that 95% of the information is yield by just 5 features.
65Calibration on mobile data yields δ = 0.21, while ρ is specific to eachuser and can be extracted from a normal distribution with mean ρ = 0.6.
66In [100], N = 2, as adding more locations yields minor improvements.
sification67 of mobile subscribers based on their movementprofiles performed by Hess et al. [99]. The authors tell apart alimited number of mobility categories, including a large classof stationary users and a class of individuals showing high(68%) probability to revisit the same locations every day.Aggregated mobility models. Aggregated mobility modelsdescribe the mass movement of a large number of users withlow spatial granularity, e.g., among municipalities. Simini etal. [128] first found that such mobility is well described bythe radiation model68. Such a model is found to match thedistribution of traveled distances computed from mobile dataof 4.3 million users over 4 weeks. Also, it significantly im-proves the well-known gravity model69, although the latter hasbeen shown to be highly representative of specific scenarios,e.g., commuting distances in Portugal studied by Csaji etal. [109]. A simpler approach, involving Markovian modelingis proposed by Lu et al. [121], who show how a first-ordermodel is already sufficient to correctly predict 90% of dailyhuman mobility in Ivory Coast.
Radiation and Markovian models are intended to capturemobility at low spatial granularity (i.e., large geographicalregions), and are shown not to hold in the case of intra-urban mobility by Liang et al. [118]. Thus, when consideringmovements within a single urban area, different models areneeded. Isaacman et al. [129] propose WHERE, a frameworkthat extracts probability distributions (of home/work locations,commuting distances, and calls) from mobile and US Censusdata, and mixes such distributions so as to generate a syntheticmodel of mobility and calling behaviors. The framework yieldsdaily traveled distances similar to those extracted from real-world mobile data. An extension to WHERE is proposed byMir et al. [130], by including differential privacy70.
More recently, an improved model, based on a combinationof the gravity and radiation models was proposed by Yanget al. [131]. Evaluation against mobile traffic datasets showsthat such a mixed model is effective at different scales and inscenarios from diversely developed countries worldwide.
B. Transportation systems
Despite early criticisms, such as those expressed byRose [132], the evaluation and enhancement of transportation
67In [99], two well-known unsupervised clustering algortihms, XMeansand Expectation Maximization (EM), are used. They are found to producesemantically different classifications of subscriber mobility.
68The radiation model determines the mobility flux mij between tworegions i and j as mij = piKc(pipj/(pi + pij)(pi + pj + pij)), where piand pj are the populations in region i and j, Kc is the fraction of populationthat commutes to work, and pij is the the population in the circle centeredat i and of radius equal to the distance between i and j.
69The gravity model has been long considered as the reference model forlong-range mobility of people, animals and goods. It defines the mobility fluxmij between two regions i and j as mij = pαi p
βj /d
γij , where dij is the
geographical distance between i and j.70Differential privacy formalizes in a mathematically rigorous way the
principle that results of a data analysis should not be significantly affectedby the presence/absence of a single individual in the database, for anyindividual. Rigorously, an algorithmA is considered as ε-differentially private,i.e. providing a level of privacy equal to ε, if it fulfills the conditione−εP [A(D2) = O] ≤ P [A(D1) = O] ≤ eεP [A(D2) = O], whereD1 and D2 represent any couple of datasets that differ in one element andO is any output of the algorithm.
21
systems has been among the first practical applications ofmobile traffic analysis. Usage of mobile network data forintelligent transportation system (ITS) was first envisioned inthe late ’90s, and comprehensive literature reviews have beencompiled by Qiu et al. [133], and Caceres et al. [134]. In thefollowing, we summarize the main findings, classifying thedifferent works according to the topic they address.Travel time and traffic state. Wunnava et al. [135] authoredan early survey on the efforts by private companies (typicallycontracted by telecom operators) to extract travel time andtraffic state information from mobile network data71. Theyfind mobile traffic-based technologies to be mature and toprovide correct travel time estimates in presence of free flowroad traffic conditions. However, the authors conclude thatmobile traffic does not appear sufficient to accurately estimatecongested road traffic conditions. Since then, a number ofacademic efforts has been carried out in that direction, asoutlined below.
Qiu et al. [133] show that processing of handover infor-mation can lead to an average error in estimated travel timeswhich is within 5–15% of those computed from traditionalinduction loop detectors. A similar conclusion is reached byBar-Gera et al. [136], who compare speed and travel timemeasurements from mobile call data and handovers with theequivalent data from dual magnetic loop detectors: the errorthey record is within 10% of the actual value. The sameauthors also validate the results obtained from mobile dataand loops against actual GPS recordings from sample vehicles,and find that both techniques yield an acceptable 5–20% errorto the ground-truth GPS data. Schlaich et al. [89] furtherconfirm the appropriateness of mobile traffic analysis fortravel time estimation, with results close to those reportedby transportation authorities. Also, they are able to correctlyseparate fast (e.g., private cars) and slow (e.g., trucks) traffic,as well as to identify special traffic patterns (e.g., congestiondue to an accident), by using just mobile call information andlocation updates.
More recently, Janecek et al. [137] combined handoverand location update data in their study. Specifically, theypropose to use coarse-grained location updates, available fromall switched-on mobile terminals, to estimate travel timesand detect congestion. If congestion is observed, fine-grainedhandover information from terminals engaged in calls (around1/20 of the total switched-on terminals in their scenario) isemployed to localize and possibly classify the congestionevent in a more accurate manner. The authors show that theirlocation update-based technique can identify traffic anomaliesfaster than traditional systems (i.e., roadside sensors, toll datafrom trucks, GPS data from taxis, and FM radio broadcastsbased on drivers’ indications). Also, using handover dataallows to identify the precise type of congestion, e.g., widemoving jams or milder synchronized flows.
A different perspective is taken by Caceres et al. [138], whostudy the problem of traffic volume estimation, rather thantravel times. To that end, they map handovers to highway road
71In the context of transportation research, handover and location updatesare the kind of data typically used to estimate travel times [89], [133], [134],[136], [137], with rare exceptions [92].
traffic crossing cell boundaries. The authors develop a mappingfunction based on a wide range of physical properties, whichis found to capture road traffic with a 20% relative error w.r.t.real-world traffic counts from detectors.
The good results obtained with highway traffic are noteasily reproduced in the more complex and heterogeneousurban environment. The only work dealing with travel timeestimation in city scenarios is that by Calabrese et al. [139],who develop a framework, named LocHNESs, allowing real-time localization and tracking of vehicles from mobile traffic.They obtain a 10–18% error with respect to ground-truth GPSdata.Origin-destination matrices. Origin-destination (O-D) matri-ces describe the number of trips performed, during a giventime period, between each pair of locations within a geo-graphical area. They are a standard way to represent the traveldemand in transportation engineering. Using mobile traffic toinfer O-D matrices of human mobility in urban regions72 wasfirst envisioned by Bolla et al. [140]. A small scale evaluationon a minimal subset of mobile traffic collected during onemorning was then performed by White et al. [141]. Thefirst tests on mobile traffic datasets of significant scale wereperformed by Calabrese et al. [93] in Massachusetts, USA.They find a good agreement between O-D matrices obtainedfrom mobile data and county-to-county trips extracted from aUS Census survey. Results do not scale well when consideringthe more precise mobility among sub-county areas, althoughthe authors state that it is not necessarily a problem of mobiletraffic data; rather, it is an issue of the survey itself.
A similar result is obtained by Ma et al. [95], who canrecreate a faithful O-D matrix that models the travel demandaround the system interchange of two major highways inCalifornia, USA, and by Lenormand et al. [102], who buildreliable O-D matrices of commuting patterns in workdaysin Madrid and Barcelona, Spain. Other works successfullyemployed mobile traffic data to derive country-wide O-Dmatrices, such as those of Israel, by Bekhor et al. [91], orIvory Coast, by Nanni et al. [107] and by Mamei et al. [104].In particular, the aggregate mobility model mixing gravity andradiation approaches proposed by Yang et al. [131] can beeffectively employed to generate O-D matrices of commutingpatterns at very different scales, from individual cities to wholecountries.
It is to be said that, despite the success stories above, someworks question the capability of deriving accurate nationwideO-D matrices from mobile traffic only. As an example, byusing census data as a reference, Tizzoni et al. [82] un-derline the poor capacity of the mobile traffic to properly
72O-D matrices are easily obtained by aggregating individual trips over adiscretized space [102], [104]. Since mobile users only represent a portionof the whole population, a scaling factor is needed for a comprehensiverepresentation of mobility. That can be achieved using reference data on,e.g., population distribution [93], road traffic counts [95], mobile operatorcustomer information [91], or surveys [91]. Recently, Nanni et al. [107] alsopropose filtering the aggregated trips, so as to only include important mobilityflows in the O-D matrices. To that end, the importance of the flow betweeneach pair of locations l1 and l2 is measured via a lift measure computed asP (l1, l2)/(P (l1) · P (l2)), where P is the probability of occurrence of alocation (or an ordered sequence of locations) in the mobile traffic dataset.Only flows whose lift measure is higher than a threshold are accounted for.
22
account for the actual attractiveness of different destinationsfor commuters of a given location. A solution to this issue wasrecently proposed by Zhang et al. [114], who combine mobiletraffic information with public transport data, i.e., taxi/bus GPSlogs and subway transits, in order to derive O-D matrices.The proposed framework, named mPat, is capable of buildingdynamic O-D matrices, termed mobility graphs, from datacollected on-the-fly, with an accuracy of 75%.Multimodality. Multimodal transportation derives from thecombined utilization of different means of transport (e.g.,private or public, motorized or not, mass or individual). Theanalysis of mobile traffic has been employed to identifymultimodal aspects of transportation systems, and namely toquantify populations using different means of transport73.
Wang et al. [92] show that mobile traffic can be coupledwith travel time information (from the Google Maps service intheir case), so as to successfully infer the type of transportation(car, public mean or pedestrian) employed by an individual.The percentages of utilization of different transport modesobtained from mining mobile traffic are found to be close tothose recorded in surveys. Calabrese et al. [139] employ theirLocHNESs framework to separate users onboard cars fromthose moving on foot with an error in the mode estimationof 3–19%. Doyle et al. [142] can correctly identify thetransportation mode, between road and rail, of around 80%of the mobile users that traveled between Dublin and Cork, inIreland, using a one-week mobile traffic dataset.Planning of transportation systems. Recent works havetargeted the simulation and improvement of city-wide trans-portation systems from mobile traffic analysis. As far assimulation is concerned, Zilske and Nagel [143] use mobiletraffic data to parameterize the MATSim road traffic generatorin the scenario of Abidjan, Ivory Coast. They find that it ispossible to directly inject mobile traffic-based trips into theroad network without intermediate interpretative steps, and stillobtain plausible results.
Concerning the enhancement of transportation systems,Berlingerio et al. [94] identify, from mobile calls, thirtycommon mobility patterns74 in the city of Abidjan. Suchpatterns, mostly mapping to home-work commuting flows, areused to plan improvements to the existing public bus transitnetwork: the authors show that, by adding 4 new routes, theoverall travel times could be reduced by 10%. Cici et al. [105]use instead mobile traffic to study the potential for car sharingin Madrid, Spain. Their results indicate that a reduction inthe number of cars of up to 67% can be attained whendrivers share their cars and agree to take detours of 600 mat most in their routes. Finally, Zhang et al. [114] identifyunderserviced routes in Shenzhen, PRC, by comparing thetrajectories inferred from mobile traffic to public transport
73Different techniques have been devised to tell apart the transportationmode of users from their mobile traffic. Many of them leverage diversemeasures computed on speed estimates [133], [137], [139]. Others rely oncomparison against real-world travel times [92], or training on sets of tripswhose transportation mode is known [142].
74Mobility is described in terms of paths followed by flows of users, ratherthan just origin and destination pairs. The precise paths are identified usingthe widely adopted Prefixspan algorithm to mine sequential patterns in thesequences of stop locations of all users.
flows. The authors propose a system of new bus lines thatcan reduce travel times of commuters along such routes ofaround 25% in typical days.Commuting patterns. Mobile data has recently emerged asan interesting source of information for the characterization ofthe mobility patterns of commuters75. Furletti et al. [144] cansuccessfully tell apart commuters from other user categories,such as residents and tourists in Pisa, Italy. Scepanovic etal. [98] rank76 regions in Ivory Coast according to theirimportance in the country-wide commuting process, whereasLiu et al. [90] find commuting activity sequences to be thedominating cause of mobility in the same area. An extensiveanalysis of commuting behaviors is performed by Kung etal. [145], who consider multiple regions and different geo-graphical scales, and show how different regions yield uniquecommute time characteristics.
Finally, the mobility modeling methodologies developed byYang et al. [131] and Tizzoni et al. [82] explicitly target therepresentation of commuting patterns.
C. Validation
As discussed above, the analysis of mobile traffic can leadto important insights on human mobility, from a number ofdifferent perspectives. However, the limited granularity of thedatasets (see the discussion about mobile traffic sources inSec. III-B) may question the validity of the results. Significanteffort has then been put in assessing the reliability of thesedata as a source for studies concerning mobility.
Specifically, the focus has been on the dependability ofCDR, as they are by far the most common type of mobiletraffic data employed by the works in Sec. V-A and Sec. V-B,but, at the same time, they yield rather inaccurate positioninginformation. In fact, Smoreda et al. [9] speculate that thepopularity of CDR is a consequence of their wide availabilityand ease of collection, which makes them preferred over moreprecise mobile traffic sources, such as, e.g., signaling events,handover or location update records.
Overall, the conclusion of the studies on the reliability ofCDR is that the latter do introduce a certain bias in the studyof mobility. However, this bias can affect the final results atdifferent extents – or even not affect them at all. As that mainlydepends on the type of analysis, in the following we separatereliability evaluations on this aspect.Geographical distributions of populations. Multiple inde-pendent studies have proven that the density of mobile users’home locations extracted from CDR provides a very good ap-proximation of the actual population distribution. Isaacman etal. [124] unveil the match between national census data and thedensity of mobile users registered at different ZIP-code areas
75Different techniques have been adopted to identify commuters in themobile user population. In [144], commuters are extracted by clusteringtogether users with similar temporal profiles via Self Organizing Maps, aclass of neural network based on unsupervised learning. In [98], commutingpatterns are mapped to round-trips returning to the origin within a same day.In [90], visited locations are classified as home, work, or other, and commutingis mapped to home-work-home and home-other-home sequences. In [145] allusers with a home-work trajectory in the morning and a work-home trajectoryin the afternoon are considered as commuters.
76Performed by running the PageRank algorithm on the commuting graph.
23
in New York and Los Angeles, USA. Excellent agreementsbetween the spatial distribution of mobile phone locationsat night time and that of the population are also observedby Calabrese et al. [93] in eastern Massachusetts, Bekhoret al. [91] over the whole Israel country, and Lenormandet al. [102] in two major Spanish cities. High correlations77
between the geographical distributions of CDR-based andcensus populations have been likewise calculated by Mameiet al. [104] and Csaji et al. [109].
A dedicated and very thorough study on the topic is thatcarried out by Douglass et al. [125]. The authors not onlyconfirm the reliability of mobile traffic for the assessment ofpopulation distributions, but even argue that the calling activitycan be leveraged for the real-time estimation of populationlevels. They develop a model that takes into account bothmobile traffic features and land use information, and find that itcan provide high-resolution population measurements, withoutany need for costly and time-consuming census.Aggregated mobility flows. Results change when consideringwhether the aggregated movement of large flows can bereliably inferred from CDR. The controversy concerns bothroutinary and exceptional mobility situations.
On the one hand, Schneider et al. [106] show that regularmobility motifs78 inferred from CDR map well to thoseobtained through reliable population surveys. In addition,Bengtsson et al. [126] use CDR to estimate the distribution ofpeople that left Port-au-Prince, Haiti, in the months followingthe 2010 earthquake, and their results match with those of alarge retrospective survey carried out by the United Nations.Finally, a number of studies, including those by Calabreseet al. [93], Ma et al. [95], Lenormand et al. [102], Yang etal. [131], and Liu et al. [90] demonstrate how mobile trafficcan be leveraged to generate O-D matrices or commutingpatterns that are equivalent to those obtained from censusdata, population surveys. Notable validation approaches areintroduced by Ma et al. [95], who leverage flow directions ata highway ramp computed via automated plate number recog-nition, and Lenormand et al. [102], who exploit geolocatedTwitter data.
On the other hand, other studies found CDR to lead toan overestimation of large-scale mobility flows. Such is theconclusion of Tizzoni et al. [82], who identify significantstatistical differences between commuting flows inferred fromnational census data and those observed from mobile phonedata in three European countries, namely Portugal, Spain andFrance. Wesolowski et al. [127] show that inhabitants of Kenyathat use more often their mobile phones also tend to travelfarther and more frequently. As they generate a large numberof entries in the CDR dataset, such high-end users risk to biasthe average level of mobility of the population towards unre-alistically high values. The authors cross-validate this resultusing a survey of 33,000 individuals regarding mobile phoneownership, cellular phone expenses, income, and a variety ofother social and economical parameters. Additionally, theyprove that the actual bias is dependent on the geographical
77R2 values of 0.75 and 0.92 are obtained in [104] and [109], respectively.78See Sec. V-A for a definition of motif.
region considered: they thus propose a methodology based onmobile phone ownership and usage information, which allowscompensating for the bias and producing statistics that arerepresentative of the entire population of a given district.Individual mobility features. When it comes to the analysisof individual mobility, two approaches have been adopted inorder to assess the reliability of CDR data. We refer to thoseas intra-CDR and CDR-to-ground-truth, respectively.
As far as the intra-CDR approach is concerned, severalworks have evaluated the quality of the results providedby voice and texting CDR, using as a benchmark similarinformation extracted from high-frequency data traffic CDR.As a matter of fact, as shown by Iovan et al. [146], thereis a strong positive correlation among the length and spanof mobile user movements and their access frequency to thecellular networks; however, above a given activity level79,the correlation disappears, which implies that high-frequencymobile traffic data becomes at that point reliable proxy forthe actual movement of users. A confirmation, although withslightly different numbers comes from Trestian et al. [56],who compare the daily travel distance of users computed frommobile traffic data featuring diverse levels of granularity. Theyfind that trajectories extracted from CDR sampled at everyhour or at every 20 minutes are comparable, whereas lowersampling frequencies yield a loss of information.
In this context, Ranjan et al. [101] find that voice andtexting CDR are sufficient to infer important locations80 ofeach mobile user. Similarly, Gonzalez et al. [116] prove thatmobility flows among the important locations of a user are wellmodeled by voice and texting CDR. However, data traffic CDRprovide a much more complete view of individual mobility,exceeding important locations. Ranjan et al. [101] find datatraffic CDR to allow a better inference of (i) transient locationsalong trajectories, (ii) radius of gyration, and (iii) geographicalspread of activities81. Finally, Hoteit et al. [113] adopt an intra-CDR approach to show that a simple linear interpolation pro-vides a fair approximation of the actual subscriber trajectories.
The second approach consists instead in comparing mobil-ity extracted from CDR with some ground-truth informationobtained from a different, reliable source. In the context ofgeneric user mobility, such reliable source is typically a smallsubset of individuals participating in the experiment: e.g.,Isaacman et al. [124] employ ground-truth reference providedby five volunteer who periodically logged their position, andmeasured a typical error in the order of 1 km in the locationsretrieved from voice and texting CDR. This approach is alsovery common in transportation studies of travel times, whereground-truth data can be obtained from, e.g., induction loops
79In [146], the authors identify fifty events per day, i.e., an average samplingrate of around 30 minutes, as the access frequency threshold needed to fullycapture user mobility.
80The notion of significant locations is used in [101], which maps to thesubset of all visited locations that account for over 90% of a user’s activity.
81The difference in the activity spread is measured through the Jensen-Shannon divergence, a method to assess the similarity between two distri-butions, popular because it is symmetric and bounded in the [0,1] interval.Considering two distributions PS and PO , the Jensen-Shannon divergenceis defined as JSD(PS ||PO) = 1
2(D(PS ||PM ) + D(PO||PM )), where
PM = (PS +PO)/2, and D(PS ||PM ) = ln(PS/PM )PS is the Kullback-Leibler divergence between PS and PM .
24
or GPS probes: that is the case of Qiu et al. [133], Bar-Gera etal. [136], and Schlaich et al. [89], who all find good agreementbetween reference and mobile traffic-inferred data. Anotherexample is that of Calabrese et al. [139], who leverage ground-truth data from heterogeneous sources to show that CDR pro-cessed via their LocHNESs framework could attain individualpositioning precision of around 100, 200 or 700 m, in urban,subsurban and extra-urban environments, respectively.
Relevant to the last approach is also the work by Zhang etal. [114], who compare individual trajectories inferred fromCDR with those extracted from public transport data, i.e.,taxi/bus GPS logs and subway transits. The authors find thatmobile traffic can in fact capture trips that are more varied innature than those depicted by transportation data, both in termsof lengths and geographical coverage. Moreover, CDR cantrack a larger number of users if collected over time intervalsof six days or more.
VI. NETWORKING ANALYSIS
Large-scale mobile traffic data clearly yields enormous po-tential when it comes to understanding and improving cellularnetwork systems. On the one hand, mobile traffic informationis paramount in drawing a clear picture of how the accessnetwork resources are consumed by mobile users. We thuspresent works aiming at characterizing traffic dynamics incellular networks, at both aggregate and per-user levels, inSec. VI-A. On the other hand, the characterization of mobiletraffic is a first step towards the design and evaluation ofsolutions concerning not only technological aspects of cellularsystems, but also privacy and marketing ones, as reviewed inSec. VI-B.
We summarize the works covered in this section in Tab. III,and present the main characteristics of the studied datasetstherein. We also highlight the networking-oriented researchaspects discussed in each paper, providing the reader with aquick guide through the articles.
A. Mobile demand
The characterization of access network traffic has beenaddressed from two diverse perspectives: (i) a mobile operatorviewpoint, where the traffic is considered from the networkperspective and aggregated over many users within coverageof a same base station or within a same geographical area;(ii) a mobile user viewpoint, which focuses on the behaviorof individuals in terms of their cellular network access. Next,we separately review works taking the two approaches.
1) Aggregate access network traffic: Studies on mobiletraffic from an operated cellular network viewpoint aim atunderstanding the spatiotemporal dynamics of the global userdemand. The focus is not only on the typical variability due tothe routinary mobility and activities of the network customers,but also on anomalous behaviors induced by particular socialevents or technological issues.Temporal dynamics. There is general agreement on the factthat mobile traffic tends to follow regular temporal patterns.
Williamson et al. [147] observe that traffic at 100 basestations presents a repetitive daily pattern over different week-days, with a characteristic binary profile of low demand atnight and high demand during the day. This first result hasbeen largely confirmed by later works, over much larger scales.As an example, Paul et al. [97] confirm that this regularityexists at a nation-wide scale. They study the distributionof daily traffic over the whole US, and find it to evolveover time in very similar ways on different weekdays. Thesame diurnality of aggregate mobile traffic is remarked byKeralapura et al. [148], Shafiq et al. [149], Zhang et al. [150],and Mucelli et al. [151]. The phenomenon is not affectedby seasonality, rather it remains stable over different months,as shown by Naboulsi et al. [59]. Specifically, the latterauthors develop a dedicated clustering strategy82 and grouphourly usage profiles that yield similar load distributions. Thistechnique improves the simple visual inspection of time seriesor probability distributions employed by previous works, andallows observing how night and day hours form the twocategories with the most different mobile usage behaviors.
Although the most significant load difference is betweennight and day, some variability in the mobile traffic can alsobe noted among different daytime hours. In this case as well,several works agree that fluctuations tend to follow a commonpattern over all weekdays. However, the precise behavior ofsuch fluctuations seems to depend on the dataset considered:Williamson et al. [147] detect several daytime peaks, thelargest of which appearing late in the afternoon; Wang etal. [152] identify two daytime peaks in data collected in PRC,but just one in data from San Francisco, USA; Naboulsi etal. [59] observe the most significant diversity to occur betweenhours falling in the interval from 8 am to 4 pm and other timesof the day.
Weekends also yield aggregate mobile traffic demands thatare quite unlike those measured during weekdays. Specifically,Williamson et al. [147] remark that weekends are characterizedby loads that are remarkably lower than those recorded duringweekdays, a conclusion later supported by the works ofGirardin et al. [153], Zhang et al. [150], Wang et al. [152],Naboulsi et al. [59], and Hohwald et al. [154]. However, thelatter authors also underline that weekend calls last longer onaverage: it is thus a dramatic drop in the number of calls thatleads to the lower demand on those days.
Regular, although less intense, variations are also observedover time scales longer than a week. Cardona et al. [155]detect seasonal variations in users’ consumptions: namely, theyfind a 20% increase in monthly data usages towards the endof the year with respect to the summer period.
In all cases, the temporal regularity of aggregate mobiletraffic is especially useful when it comes to predicting thefuture network load. Shafiq et al. [149] show that a simple
82The authors combine two clustering techniques: the Unweighted PairGroup Method with Arithmetic Mean algorithm (UPGMA) and the K-meansalgorithm. UPGMA is a hierarchical clustering algorithm that starts from one-item clusters, and then merges at each iteration the two clusters at minimumdistance. K-means is a partitional clustering algorithm that allows separatinga set of items into K disjoint categories.
25
Analysis Dataset Focus
Name Date Operator Area Time Users V T D TD SD Sp VT AD UC TM DT LS PT AI E D CT SA PS
Mob
ilede
man
d
Agg
rega
te
Williamson [147] 11/05 – 100 cells 1 week (2004) 10 K X X X X
Paul [97] 04/11 – One country 1 week (2007) 100 K X X X X X
Keralapura [148] 09/10 – USA 1 day (2008) 500 K X X X
Shafiq [149] 06/11 – One state 1 week (2010) ∼ M X X X X
Zhang [150] 08/12 – – 1 week 50 K X X X
Mucelli [151] 09/14 – Mexico city, Mexico 1 week (2013) 2.8 M X X X X
Naboulsi [59] 04/14 Orange Abidjan, Ivory Coast 5 months (2012) 18 K X X X X
Wang [152] 04/13 – 2 cities Months (2007/11) 2.4 M X X X
Girardin [153] 06/09 AT&T NY, USA 1 year (2007/08) – X X X X
Hohwald [154] 06/10 – Metropolis 6 months 50 K X X X
Cardona [155] 12/14 – European country 7 months (2011/12) 40 K X X X
Shafiq [156] 12/13 – USA 1 week (2010) – X X X
Ratti [157] 11/06 – Milan 2 weeks (2004) – X X X
Willkomm [158] 10/08 – NC, USA 3 weeks – X X X
Csaji [109] 06/13 Orange Portugal – 100 K X X
Cerinsek [159] 05/13 Orange Ivory Coast 5 months (2012) 5 M X X X X
Hoteit [160] 12/12 Orange Paris 2 days (2012) >1.5M X X X
Shafiq [161] 03/12 – Metropolis 32 hours (2010) ∼ 10 K X X
Trestian [56] 11/09 – 5000 km2 1 week 281 K X X X
Trasarti [162] 05/13 – Paris, France – – X X X
Zong [163] 05/13 Orange Ivory Coast 5 months (2012) 5 M X X X
Xavier [165] 12/12 Oi Telecom Rio de Janero, Brazil 3 days (2011) – X X X
Gowan [72] 05/13 Orange Ivory Coast 5 months 5 M X X X
Shafiq [166] 06/13 - 2 metropolis Several days (2012) 100 K X X X X X
Xavier [167] 05/13 – 4 cities (Brazil) 4 days (2011/12) – X X X
Paraskevopoulos [168] 05/13 Orange Ivory Coast 5 months (2012) 5 M X X X
Pastor-Escuredo [169] 05/13 Orange Ivory Coast 5 months (2012) 5 M X X X
Elzen [170] 05/13 Orange Ivory Coast 5 months (2012) – X X X X
Bodlaj [171] 05/13 Orange Ivory Coast 5 months (2011/12) 500 K X X X
Rodriguez [172] 05/13 Orange Ivory Coast 5 months (2011/12) 500 K X X X
Smith [173] 05/13 Orange Ivory Coast 5 months (2011/12) 500 K X X X
Indi
vidu
al
Dasgupta [174] 03/08 – – 5 months (2007) 3.1 M X X X
Ben Abdesslem [175] 03/14 – European country 8 weeks (2011/12) 3 M X X X
Candia [69] 07/08 – 230400 km2 – – X X X
Lin [176] 10/07 – Northern PRC – 600 K X X X X
Becker [177] 06/11 – Morristown, USA 2 months (2009/10) 475 K X X X
Hess [99] 06/15 Orange France 40 days (2011) 10 M X X X X
Couronne [178] 10/11 Orange Paris, France 1 day 4 M X X X
Xu [179] 04/15 – – 6 days – X X
Tech
nolo
gies
Net
wor
king
Zang [119] 09/07 3G 3 cities 1 month (2006) 2 M X X X X
Zang [180] 03/10 – Suburbs – – X X
Xu [181] 06/11 – LA, USA 1 week (2010) – X X
Balachandran [183] 09/14 – Metropolis, USA 1 month (2012) 1 M X X
Shafiq [184] 06/14 – USA 1 month (2012) 500 K X X X
Gerber [185] 03/11 – USA 2 days (2010) ∼ M X X
Finamore [186] 12/13 – European metropolis 1 day (2012) > 200 K X X
Yu [187] 04/13 – Metropolis, PRC 1 month (2011) 65 K X X
Kumar [188] 02/15 – Lucknow, India 4 months – X X
Peng [189] 09/11 – 4 cities, PRC 2 months (2010) – X X X X
Bhaumik [190] 08/12 – 175 base stations 1 day – X X X X
Wang [191] 05/09 – – 6 months 100 K X X X
Agarwal [192] 05/13 Orange Ivory Coast 5 months (2012) 500 K X X X
Zhu [193] 04/09 – US 2 weeks (2008) 2 M X X X
Zhu [194] 05/13 Orange Ivory Coast 2 weeks (2011) 500 K X X X
Mar
ketin
g Wei [195] 08/02 – Southern Taiwan 4 months (2001) 114 K X X X
Belo [196] 07/13 – European country 1 year (2008/09) 10 K X X X
Szabo [197] 11/06 – – 14 months (2004/05) 5.5 M X X X X
Priv
acy
Zang [198] 09/11 – 50 states, USA 3 months (2010) 25 M X X
Montjoye [199] 03/13 – Western country 15 months (2006/07) 1.5 M X X X
Song [200] 07/14 – – 1 week 630 K X X
Gramaglia [201] 04/15 Orange Ivory Coast, Senegal 5 months (2011/13 350 K X X
Acs [202] 08/14 Orange Paris, France 1 week (2007) 2 M X X X
TABLE III: Main features of works analyzing mobile traffic data towards understanding resource consumptions and designingtechnological solutions. In the analysis columns, date is the publication month/year. In the dataset columns, V is voice, T istexting, D is data. In the focus columns, TD is traffic temporal dynamics, SD is traffic spatial dynamics, Sp is special dynamics,VT is visualization techniques, AD is activity distributions, UC is users categories, TM is traffic-mobility correlations, DT isdevice and traffic types, LS is localization solutions, PT is network parameter tuning, AI is architecture improvements, E isenergy efficiency, D is device to device, CT is churning and traffic plans, SA is service adoption, PS is privacy solutions.
26
Markovian model is capable of accurately anticipating thetemporal evolution of the demand based on its past history.Spatiotemporal dynamics. Temporal dynamics are aggre-gated over the whole access network, and thus hide thegeographical variability of mobile traffic. When separating thedemand of individual base stations or topographical regions,different spatiotemporal profiles of mobile traffic emerge.
In a seminal work, Girardin et al. [153] consider the evo-lution of mobile traffic over different areas of interest in NewYork, NJ, USA. They observe that these regions exhibit similaraverage mobile demands during working days, but a neatvariability during weekends. On a finer daily temporal scale,the same authors detect heterogeneity in the geographicaldistribution of mobile traffic during the evening hours, whilethe consumption stays quite similar among different regionsover the rest of the day. The spatial heterogeneity of the radioaccess load has been later confirmed by Paul et al. [97], Shafiqet al. [156], and Naboulsi et al. [59], among others.
Building on these observations, several works aim at rig-orously categorizing geographical regions, according to theirmobile usage profiles. In an early work, Ratti et al. [157] showthat some base stations in Milan, Italy, are characterized by ahigh level of activity during the evening while others presenthigh demands at office hours. Interestingly, geographicallylocating base stations with the two behaviors above allows theauthors to observe a neat movement of activity from the sub-urbs towards the city center between 9 am and 1 pm. A morecomprehensive approach is taken by Willkomm et al. [158],who group83 base stations in NC, USA, based on the timeseries of their mobile traffic load, and find three representativetemporal patterns at base station level: those with permanentlow traffic, those with low traffic during weekday nights only,and those with low traffic during weekdays nights as wellas during weekends. Three classes of base stations are alsoidentified by Csaji et al. [109], using weekly time series; theauthors map such categories to base stations in home, workand other locations. Finally, Cerinsek et al. [159] find84 fiveclasses of base stations with similar daily and weekly trafficprofiles. The authors also show that three of the base stationclusters present geographical correlation, as they are locatedin close proximity.
The geographical heterogeneity of mobile traffic becomeseven more evident when separating the load on a per-application basis. Hoteit et al. [160] notice that TCP- andUDP-based services increase the diversity among base stationsin Paris. Shafiq et al. [161] observe that usage of popularapplications is not spatially uniform, but stongly depends onlocation. The authors group85 base stations according to thetype of application traffic they receive: this leads to the iden-tification of four classes of base stations that mainly manage
83The authors apply the K-means algorithm with K = 10.84 The authors adopt a clustering strategy over vectors that represent the
mobile call activity at each base station. Their proposed methodology firstreduces the set of samples to analyze using a generalization of the K-meansmethod, named leaders method. Then, it runs Ward’s hierarchical clusteringalgorithm to unveil relations among the selected samples.
85The authors use the K-means algorithm, where K is chosen accordingto a gap statistic that relies on comparing the intra-cluster distance for thestudied data to the one resulting from a reference null distribution.
web browsing, email, audio and mixed traffic, respectively.In addition, base stations showing similar usage are oftenlocated nearby, which allows associating different applicationsto specific geographical regions. These results are aligned withthose by Trestian et al. [56], who show that services areconsumed differently at home and work locations.
An original twist to the analysis of spatiotemporal dynamicsof mobile traffic is proposed by Trasarti et al. [162], whoinvestigate correlations between the mobile load observed indifferent geographical areas at successive time instants. Byapplying this approach to data from Paris, France, they detectthat, e.g., an increase in activity at the local internationalairport is followed with high probability by an augmentedmobile demand at a major train station of the city. A quiteunique approach is also adopted by Zong et al. [163], whobuild a graph describing cell-to-cell interactions86, and studyits dynamics over several months. The authors show thattraditional network growth models, such as the preferentialattachment model87 do not apply to cell-to-cell mobile trafficgraphs, and propose a better-fitting generative model, namedlatent node radius88.
Also relevant to this section are studies that show how thespatio-temporal dynamics of the mobile demand are affectedby land-use. We refer the reader to Section IV-C for a detaileddiscussion of such analyses.Special dynamics. Special events of, e.g., natural, social,political, economical or technical origin, can affect humanactivity routines, which influence in turn cellular networkusage. The networking literature is mainly concerned with theinvestigation of how special events impact cellular networkusage. For the dual analysis of how mobile traffic can be lever-aged to infer social events, we refer the reader to Sec. IV-B,special events tag.
A wide range of large-scale social events are found toinduce notably higher mobile demands. Significant examplesare provided by Girardin et al. [153] during the New YorkWaterfall exhibition, Thanksgiving, Christmas, New Year’sEve, Easter, and July 4th, and by Hoteit et al. [160] duringand after the final match of the European soccer cup, in 2012.At times, however, special events can result in a localizeddecrease of the mobile activity, as observed by Xavier etal. [165] in the area around the soccer stadium in Rio deJaneiro during a match. Similarly, Gowan et al. [72] detectpeaks in the call duration before soccer games in Ivory Coast,followed by an important drop as games start. Shafiq etal. [166] illustrate how crowded sports and conference eventscan increase the access workload and result in significantvoice and data performance degradation, including two ordersof magnitude more probable connection failures. Clearly, the
86Graph vertices map to cells, and unweighted edges connect cells amongwhich the mobile traffic volume is larger than a minimum threshold.
87The preferential attachment model is known to describe, e.g., the growthof the World Wide Web graph [164]. The model commends that the likelihoodof connecting new vertices to existing ones is directly proportional to thedegree of the latter. The resulting graph yields a power-law degree distribution.
88In the latent node radius model, a new vertex i is assigned a latent radiusr(i), and the probability that i connects with an existing vertex j of degreed(j) is P (i, j) = a[r(j)− dij ]− b · d(j), where dij is the spatial distancebetween vertices i and j, and a and b are model parameters.
27
nature of the event determines whether, where and in whichway mobile traffic is varied, and different events can result inopposite dynamics. Several meaningful examples are providedby Xavier et al. [167].
Paraskevopoulos et al. [168] delve deeper in the analysis ofthe localization of the effects of special events, by proposinga strategy to cluster89 base stations based on their trafficprofiles during special events. The authors find that basestation load can be affected in antithetical ways by a sameevent, depending on the base station geographical locationwithin a city. The same spatial heterogeneity holds nationwide,as proven in different contexts by several studies, as follows.Gowan et al. [72] cluster90 base stations using their callduration profile before, during and after soccer matches: theauthors find matches to affect the mobile traffic in the outskirtsof large cities much more evidently than in all other areasof Ivory Coast. Pastor-Escuredo et al. [169] discover thatnatural hazards such as wildfires lead to a growth of morningcalls on the aftermath of the event in rural areas and smallcities of Ivory Coast; mobile traffic is instead reduced inlarge urban areas of the country during the same period.Elzen et al. [170] show that confrontations between politicaland ethnical factions in developing countries can lead to anincrease or decrease in the mobile traffic activity, dependingon the location respective to the region where clashes occur.Visualization techniques. Finally, relevant to this sectionare also several works that target the effective and scalablevisualization of aggregate access network traffic. Their goal isenabling the rapid identification of the important properties ofmobile traffic by flexible visual inspection. Bodlaj et al. [171]employ colored lines, dispersed lines and star rays to portraythe number of calls and the call duration between base stationsdeployed within a given geographical region. They show howdifferent levels of information are captured by the diverserepresentations. The popular Data-Driven Documents (D3)visualization language is employed by Rodriguez et al. [172]and Smith et al. [173] to create and control dynamic andinteractive geographical graphics of individual base stationstatistics, call volumes, or user movement. Finally, Elzen etal. [170] adopt a layered visual analytics approach, whichfacilitates the investigation of the properties of massive mobiletraffic datasets by allowing interactive analysis, zooming andfiltering of the data. The authors show that visual analytics iseffective in identifying major trends as well as special eventsin the dataset.
2) Individual access network traffic: Characterizing mo-bile traffic on a per-user basis primarily aims at understandinghow individual customers consume mobile services. Studies onthe subject analyze the heterogeneity in the demand generatedby single users, its variability over time and space, and howit is affected by mobility and consumed services.Activity distributions. The behavior of mobile users is de-fined in the first place by when and where they access the
89The authors group base stations using the UPGMA (see footnote 82)algorithm on vectors describing traffic at each base station at key time instants.
90The authors employ Ward’s minimum variance linkage. The algorithmstarts from the set of individual base stations, and merges at each iterationthe pair of clusters that yields the minimum joint intra-cluster variance.
cellular network. In a seminal work, Williamson et al. [147]study the calling behavior of 4,156 mobile users and find thatthey use the cellular network in a very heterogeneous way.The distribution of per-user activity follows a power law91,which implies that a vast majority of users performs a fewcalls per week, yet there exists a non-negligible amount ofhigh-activity customers generating hundreds of calls per week.The imbalance among users in terms of mobile access hasbeen later confirmed by Dasgupta et al. [174] at a much largerscale, considering 3 million users. The same authors also showthat the skewness does not affect calls only, but mobile datatraffic as well. This latter observation is corroborated by Paulet al. [97] at an even larger, nationwide scale, by showing thathigh-end users can generate 100,000 times the median datatraffic of all customers. The result is that 10% of the users con-sume 60% of the access network bandwidth. Shafiq et al. [149]provide further confirmation, as they remark that mobile trafficis dominated by a small fraction of users, 5% of which beingresponsible for 90% of the total demand. Even when focusingon specific types of traffic, mobile customers can be quiteheterogeneous in their access: e.g., Ben Abdesslem et al. [175]show that 20% of the users are responsible for 78% of the totalnumber of YouTube requests from mobile devices.
Coherently with the heterogeneous load they induce, usersalso tend to have very diverse temporal patterns in accessingthe cellular network. Candia et al. [69] show that the inter-call time also follows a truncated power-law distribution92.However, the result may vary across datasets, as Willkommet al. [158] observe that call inter-arrivals follow insteadan exponential distribution. Mobile users appear less diversewhen it comes to call durations: Willkomm et al. [158],and Dasgupta et al. [174] observe a clear tendency of callsto be short, with a peak at around 1 minute. Also whenconsidering mobile data traffic usage, subscribers do not showvery different activity durations: Mucelli et al. [151] find that80% of users in Mexico City are active for at most 4 hoursper day, while less than 5% consume services for more than10 hours per day.Mobile user categories. An interesting problem is that ofdistinguishing categories of mobile users, so as to make alimited number of typical user profiles emerge. Clusteringstrategies are typically applied to address this challenge.
Lin et al. [176] proved the feasibility of the approach byseparating93 the calling behavior of 600,000 mobile customersin PRC. A number of per-user features is considered tothat end, including the duration of different types of calls,the duration of idle periods, and the volume of data trafficgenerated. The authors identify three classes of users withespecially interesting features that tell them apart from the av-
91Denoting as c the call frequency, then P (c) ∼ c−γ , where γ is inverselyproportional to the tail weight and thus to the presence of users performing avery high number of calls in the dataset. In [147], γ = 1.021, which impliesa very heavy-tailed distribution.
92Denoting as t the inter-call time, then P (t) ∼ t−γe−t/k , where k is theinter-call time at which the exponential cutoff occurs, i.e., it becomes veryunlikely to find users whose calls are separated by such long intervals. In [69],γ = 0.9, implying again a very heavy tail. Instead, k is around 48 days, i.e.,calls by a same users occurring at more than 2 months of distance are rare.
93The authors employ a K-means algorithm, with K=15.
28
erage customer conduct: (i) frequent long-distance callers, (ii)frequent local callers, who also make large use of texting, and(iii) users who seldom access the cellular network. Becker etal. [177] adopt a similar approach94. on a simpler descriptionof each user’s behavior, represented by the calling and textingload generated on an hourly basis over a week. They find seventypical user profiles, two of which are especially interesting,as they can be mapped to commuters with a high level ofmobility, and to students, respectively. Cerinsek et al. [159]group84 users according to their daily and weekly activities,and detect two major behaviors that map to morning and lateevening users. Recently, Mucelli et al. [151] have separated95
user profiles according to their total data volume and numberof sessions over a period of 2 weeks. Their strategy leads tothe identification of six subscriber classes.
A similar approach is also taken by Hess et al. [99], whoclassify96 users based on the number and duration of theiruplink and downlink sessions. However, the authors providean interesting twist to their analysis, by investigating howsubscribers transit among traffic usage profiles. They find thatless than 30% of users are consistent in the way they accessthe mobile network, whereas the rest switches among multiplebehaviors. The authors also suggest that transitions acrossprofiles are periodic over time for a same user.
A more complex co-clustering solution is devised by Ker-alapura et al. [148], with a specific focus on grouping mobileusers based on their web browsing activity. The authors builda dedicated framework, named Phantom97, and run it on a one-day 500,000-user dataset. They find that just ten clusters cancapture all possible browsing behaviors of mobile users, andthat such profiles are scarcely affected by time. Interestingly,the heterogeneity in mobile access already observed in termsof traffic demand also exists for the browsing activity: manyusers have a limited set of browsing interests, but a non-negligible number of users, who have very diverse browsinginterests, is present.Traffic-mobility correlations. Several works have investi-gated how the mobility of a user affects the mobile traffiche/she generates. An early study by Williamson et al. [147]observes no significant correlation between the level of net-work activity of a user and the number of cells he visits.However, the conclusion is based on a small dataset of 4,156users. More recent works based on larger populations provedthe opposite. As an example, Couronne et al. [178] show thata strong correlation exists between the number of locations
94The authors employ a K-means algorithm, with K=7.95The authors combine the UPGMA (see footnote 82) and the K-means
algorithm, similarly to [59].96In [99], two well-known unsupervised clustering algortihms, XMeans
and Expectation Maximization (EM), are used. They are found to producesemantically different classifications of subscribers based on traffic.
97Phantom adopts original operations to make co-clustering scalable to verylarge datasets comprising hundreds of thousands users and URLs. Specifically,it first groups browsed URLs into website categories based on their subject.It then runs a co-clustering algorithm, based on the recursive, divisivehierarchical partitioning of data and automatic identification of stoppingconditions. Once co-clusters have been found, website categories are expandedback to browsed URLs, and the same co-clustering algorithm is run withineach co-cluster output by the previous step, so as to obtain the final co-clustersof users and browsed URLs.
visited by a user and the number of communication events hegenerates. Similarly, Paul et al. [97] observe that the mediantraffic of high-mobility users is twice that of subscribers witha low mobility level. However, when focusing on the uplinkdirection only, Hess et al. [99] find that more mobile userstend to perform a lower number of uploads, which are alsosmaller in volume.
Trestian et al. [56] provide a more in-depth analysis, byconsidering the impact of mobility not only on the aggre-gate traffic but also on the actual applications consumed bycustomers. To that end, they compute correlations among themobility of a user during a mobile data transfer session and thekind of service accessed on that session. Significant differencesemerge. Streaming music is mostly listened by users whilestationary and it rapidly disappears as user mobility increases.On the contrary, email shows a strong positive correlationwith mobility, i.e., it is accessed more and more frequently assubscribers become increasingly mobile. Other applications,such as social networking, show instead maximum accessprobability in presence of moderate mobility.
Finally, an interesting observation is made by Candia etal. [69], who indicate the fraction of users who call and travelat the same time remains stable over time, notwithstandingthe large spatiotemporal variations of the aggregate networkactivity discussed in Sec. VI-A1.Device and traffic types. Traffic consumption also dependson the types of device used to access the cellular network,and on the kind of applications such devices run. Indeed,different families of mobile (smart)phones have heterogeneouscomputational and storage capabilities; moreover, they onlyrepresent a portion of the devices accessing the mobile net-work, which is also used by, e.g., femtocell routers, vehiclesuploading so-called floating car data, or metering devicesthat represent the first instances of the emerging machine-to-machine (M2M) networking paradigm. Clearly, all thesedevices tend to generate diverse types of traffic.
Shafiq et al. [149] propose a first analysis of the loadinduced by different types of mobile devices. They considertwo families of smartphones and a class of wireless modemsproviding cellular connectivity to laptops and netbooks, find-ing that devices belonging to each class tend to generatevery dissimilar traffic. Morever, diversity emerges even amongdevices of a same class, favored by varied user behaviors.
In a subsequent work, Shafiq et al. [156] compare the trafficgenerated by smartphones and M2M devices. They observethat M2M devices induce a lower aggregate demand, which ishowever strongly biased towards the uplink direction, unlikethat of smartphones. Moreover, the authors point out howM2M devices are not all the same, as different temporaldynamics emerge in the traffic generated by diverse types ofdevices. In order to shed light on the heterogeneity of M2Mdevice traffic, a time series clustering strategy98 is proposed,which results into two major classes of M2M traffic. The first
98The authors apply Daubechies-1 wavelet transforms to decompose traffictime serie into sines and cosines, adopting Coifman and Wickerhauser’smethod to detect the optimal decomposition level. After that, they clusterthe decomposed time series via Ward’s method, with l2-norm distance metricand Davies-Bouldin index to determine the optimal number of clusters.
29
class shows a diurnal behavior that maps to the working andnon-working hours, whereas the second class reflects a flatconsumption shape over the whole day.
Also relevant to the mobile traffic type is the nature ofthe applications that generate it. Zhang et al. [150] analyzemobile data traffic and find that applications providing similarservices can in fact yield quite heterogeneous packet inter-arrivals. They thus identify99 sub-categories of social, news,and video applications that show comparable packet, flow andsession-related metrics. Xu et al. [179] devise a supervisedlearning technique named FLOWR, which identifies recurrentelements in HTTP headers and uses them as signatures tounveil which mobile application is generating the request.Once bootstrapped with a limited initial set of signatures,FLOWR achieves accurate association of up to 95% of flowsto their actual mobile application in the considered case study.
B. Technologies
The information extracted from mobile traffic has beenleveraged to devise and evaluate technological solutions thatrelate to cellular systems. We separate works that employ find-ings from mobile traffic analysis to propose novel approachesto (i) networking algorithms, protocols, and architectures, (ii)marketing strategies, and (iii) mobile user privacy.
1) Networking solutions: Original solutions that target theimprovement of the cellular network operation represent anatural outcome of mobile traffic analysis. As a result, variousaspects of that subject have been studied in the literature.User localization. Accurate identification of the location ofmobile users within a cellular network is a first importanttask that can be improved by inference of information frommobile traffic. The result can enable more efficient monitoringand management of the radio resources, as demonstrated byZang and Bolot [119]. The authors first profile individualuser movements and retrieve their popular locations frommobile traffic. Such information is then used to restrain paging,typically performed over large location areas that includehundreds of cells, to frequently visited cells only. The authorsshow that paging cost can be reduced by 90% in differenturban scenarios, at the cost of a 10% increase in the pagingdelay due to misses.
However, mobile traffic data does not allow continuoustracking of user positions100, which limits the precision oflocalization. To address this issue, Zang et al. [180] employBayesian inference on a number of parameters (including thenetwork layout, the path-loss, and the SINR thresholds for auser to be associated with a base station) to localize users.Their approach yields a 20% increase in precision over ablind method that determines the position of users withinthe associated cell sector according to a random uniformdistribution.
A more accurate localization strategy, named AccuLoc, isproposed by Xu et al. [181]. AccuLoc compensates for the
99The authors cluster applications using the K-means algorithm and applyPrincipal Component Analysis to understand the impact of each metric.
100At least, unless some dedicated infrastructure is put into place that allowsactive probing [10], at the cost of traffic overhead.
traditional limitations of user tracking from mobile trafficdata collected at the cellular network core. Once trained withground truth information retrieved, e.g., from fine-grainedsignalling events collected at the access portion of the network(see Sec. III), AccuLoc allows to locate mobile users withinfour cell sectors with an accuracy of 70%, by just employingstandard CDR. The precise positioning of mobile users pavesthe road to the rigorous characterization of access networkusages.
Network parameter tuning. A proper characterization ofmobile traffic can unveil problems that may be mitigated bydynamically tuning controllable settings at the access network.Shafiq et al. [166] study how the cellular network becomeslocally overloaded during especially crowded events, and findthat legacy mobile device state transitions101 lead to inefficientradio resource utilization. They show how simply tuningstate transition timings102 can completely avoid performancedegradation in presence of special events.
Balachandran et al. [183] employ fine-grained mobile trafficdata on web browsing sessions103 and radio-level signaliza-tion104 to understand how technical network factors (includ-ing handovers, failures, power levels, throughput, competingusers) impact mobile user browsing experience (measuredin terms of incomplete downloads, abandoned sessions, andsession length). They show that a limited set of parametersfully characterizes – and can be used to anticipate105 – theQuality of Experience (QoE) of subscribers. Notably, such aset does not include factors that are often considered importantby network operators, which are instead enabled to monitorQoE metrics through radio network information only.
A very similar approach is adopted by Shafiq et al. [184],who focus on video streaming to mobile users rather thanweb browsing. By using equivalent mobile traffic data106 theyassess how a vast range of technical network parametersaffect video abandonment. Their results provide guidance tonetwork operators on how to improve user QoE when it comesto video streaming – for example, a 1-dB higher signal-to-interference ratio reduces the video abandonment probabilityby 2%. Then, the authors propose a model that relates scalable
101User equipments typically cycle through three states: IDLE, i.e., inactive;FACH, where a link is established over physical radio channels that are sharedamong multiple terminals; DCH, where a link is established over a dedicatedradio channel. Mobile operators implement proprietary state machines fortransitions with fixed timeouts for state demotions, some of which have beenreverse-engineered [182].
102The authors study the impact of a single parameter, i.e., the DCH-to-FACH demotion timeout, and demonstrate that slightly decreasing its valueby 1-2 seconds during event days is sufficient to reduce access delays andenergy consumption.
103Namely, HTTP records.104Namely, Radio Resource Control (RRC) measurement reports.105Linear regression and decision trees models prove to be simple yet
efficient techniques to predict web browsing QoE from soft and inter-radioaccess handovers, energy per chip of the pilot channel, received signal strengthindicator, and number of users.
106Namely, HTTP records from which URL, host and requested contentinformation can be extracted, and RRC measurement reports.
30
network statistics107 to video abandonment. The model canbe leveraged to predict complete download of a video by amobile user with 87% accuracy by observing only the initial10 seconds of a session.Network architecture improvements. Gerber et al. [185] gobeyond parameter tuning, and analyze detailed mobile trafficdata108 with the goal of exploring the advantage brought bysignificant modifications to the cellular network operations. Inparticular, they focus on content caching at different levels ofthe cellular network architecture. They find that cache hit ratiosbetween 27% and 33% can be achieved when content is storedwithin the cellular network core109. Finamore et al. [186] focuson content caching as well, but they consider a “push” strategy,according to which the content in the cellular network is pre-staged to the mobile device cache before it is demanded.The authors evaluate three different caching strategies thatleverage content popularity, volume, and both, respectively.They observe that the content popularity-based strategy canlead to a reduction of up to 20% of the downlink traffic for asmartphone cache size of 100 MB, in case any popular contentcan be cached.Energy efficiency. Considering the energy aspect, Yu etal. [187] analyze mobile traffic with the aim of evaluatingthe energy consumption due to the establishment and releaseof a radio link between user equipments and base stations. Theanalysis confirms that a significant amount of power is wastedduring inactivity times when the interface of a user equipmentswitches between different states101. The authors investigatethe temporal correlations110 of mobile traffic workloads andpropose a prediction model for future data transmissions,which allows cutting down unnecessary waiting times. Theirproposed scheme saves 56% of energy on average.
Another solution to improve the energy efficiency of mobilenetworks is to switch off certain base stations when theirload can be assigned to neighboring cells. Using mobile datainformation from an Indian operator, Kumar et al. [188] findout that only around 40% of the deployed base stations areneeded to cover 99% of the geographical area under study.This implies that, during low traffic periods, base stations canbe indeed turned off without a major impact on the qualityof service provided by the network. Peng et al. [189] proposean heuristic to switch off base stations, trying at the sametime to save energy and to minimize the number of on-offtransitions. Their algorithm, tested on four different urbanregions, achieves energy savings between 20% and 50%, whileallowing only one switch off operation per base station per day.
Centralizing the computational resources of a mobile net-work can also reduce the overall energy consumption in the
107The model leverages pruned decision and regression trees to determinewhether a user will complete a streaming video session. It is based on radionetwork statistics and information collected from TCP/IP headers: as such, itdoes not require deep packet inspection of, e.g., HTTP headers, which wouldimply much larger data collection and significantly reduce scalability.
108Namely, HTTP records.109The maximum hit ratio of 33% is obtained by assuming infinite caching
at the GGSN level. A 27% cache hit ratio is obtained when balancing positiveeffects of caching with its cost: in that case, caching is found to be bestimplemented at SGSNs.
110The temporal correlation is calculated from the the entropy of individualtime series of packet arrivals.
network. Bhaumik et al. [190] show that 20% less resourcesare required in such a centralized architecture, and theirpractical CloudIQ resource management framework achievesresults close to this optimal value.Device-to-device communication. The analysis of mobiletraffic allows to explore original networking paradigms thatgo beyond the traditional user equipment-to-base station com-munication. Particular attention has been paid to device-to-device (D2D) communication, by considering that users whoare nearby can exchange data without resorting to the cellularinfrastructure, but via technologies such as Bluetooth, or, morerecently, Wi-Fi Direct and LTE Direct.
In a seminal work, Wang et al. [191] investigate how acombination of near-distance D2D communication and long-distance texting would affect the spread of self-propagatingmalware among the mobile terminal population. By assuminga Susceptible-Infected (SI) model111, the authors remark thatD2D communication allows the malware to reach all sus-ceptible devices, but at low speed. The spread via texting ismuch faster, but limited by the presence of communities inthe mobile call graph112, and by the market share of differ-ent operating systems. Agarwal et al. [192] adopt a similarapproach to assess the effectiveness of D2D communicationin disseminating information at nation-wide scales withoutresorting to the cellular infrastructure. The authors show thatone single device can propagate the information of 90% ofa 5,000-user population spread over the whole Ivory Coast.Zhu et al. [193] focus on viruses reproducing via textingonly, and leverage the structure of the mobile call graph inorder to restrain their spread among subscribers. Specifically,they identify graph partitions113, and inject security patches toselected users that link the different partitions.
The efficacy of D2D communication can be also leveragedto offload the access network from part of its load. Zhuet al. [194] explore several opportunistic routing methodsto that end, evaluating their performance on mobile trafficdata. They conclude that all methods perform well in denselypopulated and geographically constrained areas, where D2Dcommunication can be a promising solution for the deliveryof delay-tolerant contents to mobile users. Shafiq et al. [166]focus on radio access rather than traffic load. They considerthat multiple devices can leverage D2D communication toshare a single connection to the cellular network. Duringespecially crowded events, this approach can reduce failedconnections up to 95%.
2) Marketing solutions: Mobile traffic data constitute avaluable source of information to devise marketing strategies.Their analysis allows an operator to understand the behaviorof customers, their calling patterns and habits, and thus toformulate adequate and targeted offers.
111The SI model defines the infection rapidity as dI/dt = βS ·I/N whereβ is the effective infection rate, S the number of susceptible terminals, I isthe number of infected terminals and N is the size of the terminal population.
112See Sec. IV-A.113Two graph partitioning strategies are considered. Balanced graph parti-
tioning aims at forming even partitions in terms of node degree. Clusteredgraph partitioning separates the graph into partitions with minimum cutweight.
31
Churning and traffic plans. Mobile users tend to changetheir operator over time, which leads to so-called churning.Collecting mobile traffic data over long time periods canhelp understand and predict the churning phenomenon. Ina seminal work, Wei et al. [195] propose to predict futurechurners by studying the volume and frequency of calls byeach user114. The performance evaluation over a dataset of114,000 customers indicates results in a correct predictionof 70% of the churners, with a 20% false positive ratio.Dasgupta et al. [174] also focus on the prediction of churnersby considering the impact of the social relationships amongcustomers on the churning behavior. Given a set of initialchurners, the authors employ a diffusion model115 over themobile call graph112 to successfully predict 60% of futurechurners.
In order to attract churners, Lin et al. [176] group 600,000customers into different categories according to their callingand texting behaviors. The authors then tailor new trafficplans adapted to each group, which is claimed to positivelyaffect new customer subscriptions to the considered operator.An opposite perspective is adopted by Cardona et al. [155],who aim at avoiding churning. More precisely, the authorsinvestigate the cost savings that customers could achieve,combining different data traffic pricing plans and consumptionschemes. They observe that collaborative pricing plans canbe very beneficial for customers, and savings of up to 45%can be attained with group plans, i.e. plans that allow usersin a pre-defined group to share a certain amount of allowedcapacity. Even higher savings, reaching up to 70% of thebaseline cost, are granted by open sharing plans, i.e., plansproviding each customer with an individual traffic volume,and allowing him to sell his excess, unused capacity. User-driven collective consumption schemes through tethering arealso shown to properly complement such strategies, inducingadditional gains, especially in dense urban areas.Service adoption. Belo and Ferreira [196] study the im-pact of the mobile call graph112 on the diffusion oftelecommunication-related products among customers. Theyidentify different adoption incentives for several types of prod-ucts. They also observe that social influence among mobileusers can have a positive or a negative effect on the diffusionof the product, depending on the characteristics of the latter. Asimilar perspective is taken by Szabo and Barabasi [197], whoevaluate the impact of the social relationships on the adoptionof services. The authors observe a strong correlation betweensocial networking services adopted by a mobile subscriber andthose utilized by his/her contacts. The correlation is insteadnot present in the case of technical-oriented services for, e.g.,browsing or emailing.
114The authors employ a multi-classifier class-combiner technique, espe-cially designed to cope with the fact that the percentage of churners in adataset is typically low. The proposed solution starts by generating from themobile traffic training set a number of training subsets, each characterized by aknown distribution of churners and non-churners. Then, a classification modelis generated for each subset with a base classifier. Finally a meta-classifiercombines the predictions made by each individual base classifier.
115The model is based on Spreading Activation (SPA) techniques appliedin cognitive psychology. It allows to predict potential churners by exploringtheir social connections with current churners.
On a related point, mobile traffic can be also analyzed so asto understand the details behind the current level of adoption ofa given service. As an example, Shafiq et al. [184] investigatethe market of video players for mobile devices, by mining afine-grained 500,000-user dataset. The authors point out thatusage distributions among different video players is limited,as 80% of the relevant traffic load is generated by the five topplayers only. Ben Abdesslem et al. [175] focus on one specificvideo streaming service, i.e., YouTube, and unveil interestingfeatures of the mobile traffic it generates. Namely, the authorsfind a significant tendency to replay, with 37% of the usersrequesting at least 10 different streams over a month whoreplayed more than 20% of their videos. Also, they find videopopularity to follow a Zipf’s distribution116, and propose aclassification of the different processes that bring videos tobecome viral.
3) Privacy solutions: As discussed in Sec. III-C, mobiletraffic data contains sensible information on individual sub-scribers, whose privacy needs to be properly protected. Un-fortunately, the common practice of replacing mobile users’identifiers with so called pseudo-identifiers, is not sufficient tothat end.
The unfitness of the de-facto standard approach to mobiletraffic data anonymization has been the focus of several works.Zang and Bolot [198] compare the most popular locationsvisited by mobile users in order to break the anonymity grantedby random identifiers117. When applying their approach to datacollected at typical spatial (i.e., cell or sector) and temporal(i.e., at each event generated by a user) granularity, theauthors find that considering only the single top location ofeach user does not pose privacy issues. However, if the twomost frequently visited locations (presumably, home and worklocations, see Sec. V-A) are considered, 10% to 50% of theusers are uniquely identifiable. This percentage grows to morethan 50% when looking at the three top locations.
The authors also study how reducing the spatial gran-ularity of the original data, by aggregating mobile trafficover geographical ares of different size, improves anonymity.They find that only city-wide aggregation results in a reliableanonymization. Temporal domain approaches, implemented byperiodically changing the random identifiers, are instead foundto ensure privacy if the updating procedure is repeated at mostevery 24 hours, i.e., a same user cannot be tracked over twosubsequent days.
The low level of anonymity granted by random identifiers,and the relevance of choosing adequate spatial and temporalresolutions for the preservation of mobile user privacy areconfirmed by de Montjoye et al. [199]. Their analysis does notassume knowledge of popular locations, but only of randomly
116Given the rank l of a video, its level of popularity is described by P (l) =l−β , with β = 1.07.
117The authors leverage the concept of k-anonymity [12]. They extract thetop N locations of each user, and group all users sharing the same set oflocations. Then, the mobile traffic dataset is said to grant k-anonymity ifeach user group contains at least k individuals, who thus share the samepreferred locations. This makes a user indistinguishable from at least otherk-1 subscribers in the dataset. If k = 1 for some N , anonymity is breachedfor that N , as the user can be univocally identified by knowing his/her Npreferred locations.
32
sampled pairs of user position and time118. The authors showthat two randomly chosen spatiotemporal points are enoughto uniquely characterize 50% of the users, i.e., half of thetime there exists only one user in the dataset who visits thosetwo locations at those two times. Increasing the knowledge tofour randomly chosen points allows to uniquely characterizemore than 95% of the users. These results refer to fine-grained mobile traffic data, where the user position is identifiedat cell or sector level every hour. The authors thus explorethe impact of a reduced spatiotemporal granularity, but findthat even coarse resolutions may provide little anonymity119.The reasons of the poor anonymizability of mobile trafficdatasets are investigated by Gramaglia and Fiore [201]. Theyfind that mobile subscribers typically feature spatiotemporalpatterns that are similar to those of many other users, but fora small fraction of points. The latter make users’ trajectoriesunique; also, they may be very far apart, hampering attemptsat anonymizing the data through generalization.
An attempt at finding a solution is made by Song etal. [200]. First, the authors confirm the previous observationson the uniqueness of pseudo-anonymized trajectories: morethan 60% of users in their dataset are uniquely traced withonly 2 random points, and the percentage grows to 95% witha set of 4 random points. Then, to preserve user privacy, theyperiodically change each user’s pseudo-identifier. An updatinginterval of 6 hours reduces the trajectory uniqueness to 40% inthe case of two randomly selected points, however the benefitis less important for a higher number of points. Gramaglia andFiore [201] propose instead the first algorithm that achievesk-anonymity [12] of the spatiotemporal trajectories of usersin a two-week-long mobile traffic dataset. The algorithm,named GLOVE, leverages specialized per-user generalizationand suppression, and is shown to attain up to 5-anonymity inthe reference datasets while preserving a substantial level ofaccuracy in the data.
Finally, Acs et al. [202] focus instead on preserving useranonymity in the specific case where subscriber trajectoriesare aggregated into spatiotemporal density information. Theirmain concern is that, even under such aggregation, areasvisited by a low number of users may reveal individualmobility patterns. To handle that, they introduce a data-driven differentially private scheme120 that combines sampling,clustering and filtering processes of per-cell information togenerate aggregate density information for areas groupingseveral cells. Their strategy is shown to provide high privacyguarantees: removing any single user does not lead to anysensible variation in the outcome of the analysis, which
118Given a set of p random spatio-temporal points, named Ip, the authorscompute the number S(Ip) of individual movement traces that include the setof points Ip. An individual is considered uniquely identifiable if |S(Ip)|=1,i.e., he is the only one whose movement trace includes Ip.
119A measure ε of the uniqueness, i.e., identifiability, of mobile users iscalculated as the percentage of uniquely identifiable users given p spatio-temporal points. The authors show that ε ∼ (vh)β , where β ∼ −p/100, vrepresents the spatial aggregation in terms of number of cells merged together,and h is the level of temporal aggregation in terms of hours merged together.The relationship suggests that privacy is increasingly hard to attain by loweringthe resolution of a dataset. Moreover, even a slight increment in the numberof spatiotemporal points p makes users much more identifiable.
120See footnote 70 for a definition of differential privacy.
basically means that all subscribers are well hidden in thedataset. At the same time, the solution also preserves a gooddata utility level.
VII. OUTLOOK
The results presented in the previous sections are manyand varied, and span across a wide range of subjects anddisciplines. However, as anticipated at the beginning of thismanuscript, analyses of mobile traffic have become a populartool only during the last few years, and a large number ofquestions remain open. In that perspective, our comprehensiveoverview of the literature puts us in a unique position tocomment on the open problems and future research directionsfor research in the field of mobile traffic analysis. Below, wepropose a discussion of such issues, organized along the linesof our literature classification.
A. Social analysis
1) User interactions: In Sec. IV-A, we saw that the studieson the structure of mobile user communications have unveiledmost of the major properties of social interactions occurringvia mobile devices. As a result, we have today a ratherclear understanding of the shape of mobile call graphs, forwhich some models have also been proposed. However, theseproperties are typically inferred from static graphs that lose alltemporal dimensions. A most promising, although challenging,research direction is then the investigation of the dynamicsand evolution of mobile call graphs at multiple time scales.Also, cross-correlating mobile call graph representations withother databases (describing, e.g., user demographics, sub-scriber mobility, or mobile traffic plan information) can pavethe way to the practical exploitation of the knowledge on userinteractions.
2) Demographics, environment and epidemics: Cross-correlation is the key to progress also in mobile traffic analysesthat target other social topics, such as those presented inSec. IV-B, Sec. IV-C, or Sec. IV-D. Clearly, that implies theavailability of external relevant databases that can be correlatedto mobile traffic ones; open data initiatives that are becomingincreasingly popular will be paramount in this direction.Also, much longer datasets of mobile traffic, spanning overseveral years (not necessarily in a continuous way) wouldbenefit social studies, allowing the investigation of phenomenaoccurring at large time scales, such as urbanization, landscapeevolutions, or new technology and service adoption.
B. Mobility
1) Human mobility: When it comes to mobility studies,there is general agreement on a number of laws that drivemovement patterns in large populations over wide areas, asdiscussed in Sec. V-A1. This, together with the recognizedhigh regularity and predictability of human trajectories, hasallowed defining models that describe routinary user mobilityin Sec. V-A2. However, we also saw that a number of factorscan affect the customary mobility of users, and small attentionhas been paid to models that can capture such phenomena.
33
An interesting corollary open question is whether, and up towhich point, mobile communications affect the mobility ofsubscribers.
2) Transportation systems: Concerning more fine-grainedmobility analyses, such as intra-urban movement studies orthe research in transportation presented in Sec. V-B, the mainquestion stays that of the dependability of mobile traffic asan information source for movement patterns. The literaturein Sec. V-C is discordant on the answer, and there is anon-negligible risk that mobile traffic may bias microscopicmobility analyses.
On the positive side, there are clear indications that mo-bile traffic datasets featuring higher precision and samplingfrequency tend to reduce or eliminate that bias [137], [146].And, there are clear trends towards: (i) high-end mobileservices that generate continuous traffic; (ii) monitoring probesthat are shifted to the network edge, and collect positioninginformation that is both more precise and complete (seeSec. III-B). Therefore, it is very probable that mobile trafficdata will become extremely reliable in the future, even for,e.g., detailed individual trajectory mining. Yet, studies carriedout on today’s standard mobile traffic datasets shall not excludethe possibility of biases, especially in presence of microscopicmobility analyses.
3) Validation: Relevant to the discussion above is the on-going effort to validate the results obtained by analyzingmobile traffic datasets. There is common agreement on thefact that any type of mobile traffic provides a very goodview of static characteristics, such as the distribution ofpopulations or the position of locations that are importantto users, such as homes and workplaces. When it comes todynamics features, such as trajectories and movement flows,high-frequency mobile traffic data becomes a requirement. Inthis case, studies should only resort to datasets that containseveral points per hour for each subscriber.
In some use cases, such as that of land use detection, mobiletraffic data, possibly combined with external databases, riskin fact to produce results that are even more reliable that theground truth itself, which may be typically several years oldand incomplete.
C. Network
1) Mobile demand: Network studies in Sec. VI-A haveunveiled clear, regular spatiotemporal dynamics in mobiletraffic, and significant heterogeneity across mobile users interms of the demand they generate. Most works in the literaturehave explored the temporal and spatial dimensions, and a fewhave focused on the type of services consumed by mobileusers. What is still missing in the picture are techniques forthe comprehensive characterization of mobile traffic, whichcan capture at a time the three dimensions of space, time,and service usage. Such a holistic approach shall answer openquestions on the correlation among, e.g., land use, mobility,daily schedule and the nature of applications accessed bysubscribers.
2) Technologies: On the exploitation side, mobile trafficanalysis has already led to a number of interesting proposals
for novel networking approaches and solutions, outlined inSec. VI-B. However, many subjects have been just scratchedon the surface, and there is wide space for improvement inboth clean-slate and incremental design of mobile networkarchitectures and protocols. In particular, we draw the attentionto the need of models of the mobile demand that can (i)process mobile traffic data on-the-fly, i.e., as soon as it iscollected within the network, and (ii) predict short- (e.g.,minute to hours) and medium-term (e.g., days to weeks)evolutions in the demand. Indeed, such functions will be keyto original anticipatory/cognitive networking paradigms, whichare expected to be part of future 5G cellular systems.
Finally, the discussion in Sec. VI-B3 outlines the evidentneed for mobile traffic data anonymization techniques that en-sure subscriber privacy in a way that preserves the informationutility. Their persisting absence risks to limit the availability ofopen datasets, and to hinder research based on mobile trafficanalysis.
D. General
Finally, three open problems are common to all of thedifferent research topics touched by mobile traffic analysis.They concern the reproducibility and reliability of mobiletraffic analyses.
The first problem lies in the diversity of mobile trafficdatasets used in the literature. As discussed in Sec. III-B,different data collection approaches can generate datasets offairly dissimilar precision and extent. However, in the vastmajority of the works, small or no information is provided onthe nature of the mobile traffic data employed for the analysis.This is often due to non-disclosure agreements with the dataproviders, yet, in absence of these details, it is difficult to judgeon the reliability of the results and on the comparability withcompeting studies.
The second problem is partially in connection with the first.As a matter of fact, it maps to the need for a reference set ofmobile traffic datasets that can be adopted by the researchcommunity so as to favor reproducible research. Clearly,the set is to be publicly available. Moreover, it should beheterogeneous, i.e., representative of scenarios that are diversefrom many viewpoints, both semantic (e.g., geographical andtemporal span, subscriber density, development level of theregion) and technical (e.g., nature of the probes used for thedata collection), so that studies are not biased. Finally, thesedatasets should be in a clear and consistent format, and containinformation that allow running a large variety of analyses.
The third transversal issue concerns the definition of stan-dard best practices in the analysis of mobile traffic datasets.The overview we provided in this survey highlights how manydifferent techniques have been proposed to perform even themost basic operations throughout all research subjects. As anexample, trajectory extraction is a fundamental function formobility analyses, yet there is no clear agreement on whichis the current state of the art solution that should be adopted.There is thus a need to compare methodologies proposed in theliterature, and derive a set of well-defined, validated techniquesthat can be safely used by the research community.
34
VIII. CONCLUSIONS
In this document we surveyed the literature on mobiletraffic analyses run on operator-collected data. We proposed ahierarchical classification of studies in this recently emergedresearch field, and categorized a large body of relevant worksaccordingly. We also summarized the main features of researchactivities, as well as of the datasets they employ, into referencetables that provide immediate visibility on the many andvaried topics concerned by mobile traffic analysis. Our reviewprovides a comprehensive overview of the state of the art inthe usage of mobile traffic data for scientific research, andallows outlining open research directions.
REFERENCES
[1] Cisco, “Visual Networking Index – Forecast and Methodology, 2007-2012,” 2008.
[2] Pew Research Center, “Emerging Nations Embrace Internet, MobileTechnology,” Feb. 2014.
[3] N. Eagle, A. Pentland, “Eigenbehaviors: Identifying Structure in Rou-tine,” Behav. Ecol. Sociobiol., 63:1057–1066, Apr. 2009.
[4] M. De Domenico, A. Lima, M. Musolesi, “Interdependence and Pre-dictability of Human Mobility and Social Interactions,” Nokia MDCWorkshop, 1–6, Newcastle, UK, Jun. 2012.
[5] F. Meneses, A. Moreira, “Large Scale Movement Analysis from Wi-Fibased Location Data,” IPIN, Sydney, Australia, Nov. 2012.
[6] J. Saramaki, E. Moro, “From Seconds to Months: Multi-scale Dynam-ics of Mobile Telephone Calls,” arXiv:1504.01479 [physics.soc-ph],Apr. 2015.
[7] C. Shang, M.C. Zhou, C. Chen, “Cellphone Data and Applications,”International Journal of Intelligent Control and Systems, 19(1):35–45,Mar. 2014.
[8] V.D. Blondel, A. Decuyper, G. Krings, “A Survey of Results onMobile Phone Datasets Analysis,” arXiv:1502.03406 [physics.soc-ph],Feb. 2015.
[9] Z. Smoreda, A.-M. Olteanu-Raimond, T. Couronne, “SpatiotemporalData from Mobile Phones for Personal Mobility Assessment,” Trans-port Survey Methods: Best Practice for Decision Making, 41:745–767,Emerald Group, Jan. 2013.
[10] M. Ficek, T. Pop, P. Vlacil, K. Dufkova, L. Kencl, M. Tomek, “Perfor-mance study of active tracking in a cellular network using a modularsignaling platform,” ACM MobiSys, San Francisco, CA, USA, 2010.
[11] Cisco / Starent Networks, “LTE: Simplifying the Migration to 4GNetworks,” White Paper, 2010
[12] L. Sweeney, “k-anonymity: a model for protecting privacy,” Int. J.Uncertainty, Fuzziness and Knowledge-based Systems, 10(5):557–570,Oct. 2002.
[13] A. Machanavajjhala, J. Gehrke, D. Kifer, M. Venkitasubramaniam, “l-diversity: privacy beyond k-anonymity,” ICDE, Atlanta, GA, Apr. 2006.
[14] N. Li, T. Li, S. Venkatasubramanian, “t-Closeness: Privacy Beyond k-Anonymity and l-Diversity,” ICDE, Instambul, Turkey, Apr. 2007
[15] C. Dwork, F. McSherry, K. Nissim, A. Smith, “Calibrating noise tosensitivity in private data analysis,” TCC, New York, NJ, Mar. 2006.
[16] A. Cavoukian, D. Castro, “Big Data and Innovation, Setting the RecordStraight: De-identification Does Work,” White Paper, Jun. 2014.
[18] A. Nanavati, S. Gurumurthy, G. Das, D. Chakraborty, K. Dasagupta, S.Mukherjea, A. Joshi, “On the Structural Properties of Massive TelecomCall Graphs: Findings and Implications”, ACM CIKM, Arlington, VA,USA, Nov. 2006.
[19] D. Doran, V. Mendiratta, C. Phadke, H. Uzunalioglu, “The Importanceof Outlier Relationships in Mobile Call Graphs”, IEEE ICMLA, BocaRaton, FL, USA, Dec. 2012.
[20] J.-P. Onnela, J. Saramaki, J. Hyvonen, G. Szabo, M. A. de Menezes, K.Kaski, A.-L. Barabasi, J. Kertesz, “Analysis of a Large-Scale WeightedNetwork of One-to-One Human Communication”, New Journal ofPhysics, 9(179):1–27, Jun. 2007.
[21] R. Lambiotte, V. Blondel, C. de Kerchove, E. Huens, C. Prieur, Z.Smoreda, P. Van Dooren, “Geographical Dispersal of Mobile Commu-nication Networks”, Physica A, 387(21):5317–5325, Sep. 2008.
[22] M. Seshadri, S. Machiraju, A. Sridharan, J. Bolot, C. Faloutsos, J.Leskovec, “Mobile Call Graphs: Beyond Power-Law and LognormalDistributions”, ACM KDD, Las Vegas, NV, USA, Aug. 2008.
[23] W. Reed, M. Jorgensen, “The Double Pareto-Lognormal Distribution -A New Parametric Model for Size Distribution”, Communications inStatistics - Theory and Methods, 33(8):1733–1753, Aug. 2004.
[24] M. Karsai, N. Perra, A. Vespignani, “Time Varying Networks and theWeakness of Strong Ties”, Scientific Reports, 4(4001):1–7, Feb. 2014.
[25] J.-P. Onnela, J. Saramaki, J. Hyvonen, G. Szabo, D. Lazer, K. Kaski,J. Kertesz, A.-L. Barabasi, “Structure and Tie Strengths in MobileCommunication Networks”, PNAS, 104(18):7332–7336, May 2007.
[26] C.A. Hidalgo, C. Rodriguez-Sickert, “The Dynamics of a Mobile PhoneNetwork”, Physica A, 387(12):3017–3024, May 2008.
[27] G. Miritello, R. Lara, M. Cebrian, E. Moro, “Limited CommunicationCapacity Unveils Strategies for Human Interaction”, Scientific Reports,3(1950):1-7, Jun. 2013.
[28] G. Palla, A.-L. Barabasi, T. Vicsek, “Quantifying Social Group Evolu-tion”, Nature, 446, Apr. 2007.
[29] G. Siganos, S.L. Tauro, M. Faloutsos, “Jellyfish: A Conceptual Modelfor the AS Internet Topology”, Journal of Communications and Net-works, 8(3):339–350, sep. 2006.
[30] A. Broder, R. Kumar, F. Maghoul, P. Raghavan, S. Rajagopalan, R.Stata, A. Tomkins, J. Wiener, “Graph Structure in the Web”, ComputerNetworks, 33(6):309–320, Jun. 2000.
[31] S. Yang, B. Wu, B. Wang, “Multidimensional Views on Mobile Call Net-work”, Frontiers of Computer Science in PRC, 3(3):335-346, Sep. 2009.
[32] C. Sarraute, P. Blanc, J. Burroni, “A Study of Age and Gender seenthrough Mobile Phone Usage Patterns in Mexico”, ASONAM, Beijing,PRC, Aug. 2014.
[33] A. Stoica, Z. Smoreda, C. Prieur, J.-L. Guillaume, “Age, Gender andCommunication Networks”, NetMob, Boston, MA, USA, May 2010.
[34] A. Mehrotra, A. Nguyen, J. Blumenstock, V. Mohan, “Differences inPhone Use between Men and Women: Quantitative Evidence fromRwanda”, ICTD, Atlanta, GE, USA, Mar. 2012.
[35] V. Wang, H. Zang, M. Faloutsos, “Inferring Cellular User DemographicInformation using Homophily on Call Graphs”, NetSciCom, Turin, Italy,Apr. 2013.
[36] J. Brea, J. Burroni, M. Minnoni, C. Sarraute, “Harnessing Mobile PhoneSocial Network Topology to Infer Users Demographic Attributes”, SNAKDD, New York, NY, USA, Aug. 2014.
[37] V.D. Blondel, J.-L. Guillaume, R. Lambiotte, E. Lefebvre, “Fast Un-folding of Communities in Large Networks”, Journal of StatisticalMechanics: Theory and Experiment, 2008(10): P10008, Oct. 2008.
[38] O. Toomet, S. Silm, E. Saluveer, T. Tammaru, R. Ahas, “EthnicSegregation in Residence, Work, and Free-Time: Evidence from MobileCommunication”, IAB Colloqium, Nuremberg, Germany, Feb. 2012.
[39] J. Blumenstock, O. Toomet, R. Ahas, E. Saluveer, “Neighborhood andNetwork Segregation: Ethnic Homophily in a Silently Separate Society,”Netmob, 1–23, Boston, MA, USA, Apr. 2015.
[40] A.J. Morales, W. Creixell, J. Borondo, J.C. Losada, R.M. Benito,“Understanding Ethnical Interactions on Ivory Coast”, NetMob D4DChallenge, Boston, MA, USA, May 2013.
[41] O. Bucicovschi, R. Douglass, D. Meyer, M. Ram, D. Rideout, D. Song,“Analyzing Social Divisions Using Cell Phone Data”, NetMob D4DChallenge, 1–13, Boston, MA, USA, May 2013.
[42] V. Soto, V. Frias-Martinez, J. Virseda, E. Frias-Martinez, “Predictionof Socioeconomic Levels Using Cell Phone Records”, UMAP, Girona,Spain, Jul. 2011.
[43] C. Smith, A. Mashhadi, L. Capra, “Ubiquitous Sensing for MappingPoverty in Developing Countries”, NetMob D4D Challenge, Boston,MA, USA, May 2013.
[44] H. Mao, X. Shuai, Y.-Y. Ahn, J. Bollen, “Mobile Communications Re-veal the Regional Economy in Cote d’Ivoire”, NetMob D4D Challenge,Boston, MA, USA, May 2013.
[45] K. Wakita, R. Kawasaki, “Estimating Human Dynamics in Cote d’IvoireThrough D4D Call Detail Records”, NetMob D4D Challenge, 1–3,Boston, MA, USA, May 2013.
[46] A. Fajebe, P. Brecke, “Impacts of External Shocks in Commodity-Dependent Low-Income Countries: Insights from Mobile Phone CallDetail Records from Cote d’Ivoire”, NetMob D4D Challenge, 1–18,Boston, MA, USA, May 2013.
[47] B. Lim, D. Doran, V. Mendiratta, M. Rodriguez, D. Klabjan, “SocialCapital for Economic Development: Application of Time Series ClusterAnalysis on Personal Network Structures”, NetMob D4D Challenge2013, Boston, MA, USA, May 2013.
35
[48] V. Frias-Martinez, V. Soto, J. Virseda, E. Frias-Martinez, “ComputingCost-Effective Census Maps from Cell Phone Traces”, PURBA, New-castle, UK, Jun. 2012.
[49] G. Krings, D. Baclin, L.J.V. Merlen, M.L. Pimenta, F. Galli, “MobileCommunication in Business Networks: Structure and Leadership”, Net-Mob, 1–3, Boston, MA, USA, May 2013.
[50] J.-P. Onnela, S. Arbesman, M. Gonzalez, A.-L. Barabasi, N. Christakis,“Geographic Constraints on Social Network Groups”, PLoS ONE,6(4):e16939, Apr. 2011.
[51] D. Wang, C. Song, “Impact of Human Mobility on Social Networks,”Journal of Communications and Networks, 17(2):100–109, Apr. 2015.
[52] G. Krings, F. Calabrese, C. Ratti, V. Blondel, “Urban Gravity: AModel for Inter-City Telecommunication Flows”, Journal of StatisticalMechanics, L07003, Jul. 2009.
[53] P. Schmitt, M. Vigil, M. Zheleva, E. Belding, “Egocentric andPopulation-Density Patterns of Cellphone Communication in IvoryCoast”, NetMob D4D Challenge, 1–14, Boston, MA, USA, May 2013.
[54] N. Eagle, Y.-A. de Montjoye, L. Bettencourt, “Community Computing:Comparisons between Rural and Urban Societies using Mobile PhoneData”, CSE, Vancouver, BC, Canada, Aug. 2009.
[55] S. Almeida, J. Queijo, L. M. Correia, “Spatial and Temporal Traffic Dis-tribution Models for GSM.” IEEE VTC Fall, Amsterdam, Netherlands,Sep. 1999.
[56] I. Trestian, S. Ranjan, A. Kuzmanovic, A. Nucci, “Measuring Serendip-ity: Connecting People, Locations and Interests in a Mobile 3G Net-work”, ACM IMC, Chicago, IL, USA, Nov. 2009.
[57] M. R. Vieira, V. Frias-Martinez, N. Oliver, E. Frias-Martinez, “Charac-terizing Dense Urban Areas from Mobile Phone-Call Data: Discoveryand Social Dynamics”, IEEE SocialCom, Minneapolis, Minnesota, USA,Aug. 2010.
[58] R.M. Pulselli, P. Romano, C. Ratti, E. Tiezzi, “Computing UrbanMobile Landscapes Through Monitoring Population Density Based onCell-Phone Chatting.” International Journal of Design and Nature andEcodynamics, 3(2): 121-134, 2008
[59] D. Naboulsi, R. Stanica, M. Fiore “Classifying Call Profiles in Large-scale Mobile Traffic Datasets.” IEEE Infocom, Toronto, Canada, Apr.2014.
[60] F. Girardin, F. Calabrese, F. Di Fiore, C. Ratti, J. Blat, “DigitalFootprinting: Uncovering Tourists with User-Generated Content,” IEEEPervasive Computing, 7(4):36–43, Oct. 2008.
[61] P. Bajardi, M. Delfino, A. Panisson, G. Petri, M. Tizzoni, “UnveilingPatterns of International Communities in a Global City using MobilePhone Data,” EPJ Data Science, 4(4), Apr. 2015.
[62] J. L. Toole, M. Ulm, M. C. Gonzalez, D. Bauer, “Inferring Land Usefrom Mobile Phone Activity”, ACM UrbComp, Beijing, PRC, Aug. 2012.
[63] V. Soto, E. Frias-Martinez, “Automated Land Use Identification us-ing Cell-Phone Records”, ACM HotPlanet, Washington, DC, USA,Jun. 2011.
[64] B. Cici, M. Gjoka, A. Markopoulou, C.T. Butts, “On the Decompositionof Cell Phone Activity Patterns and their Connection with UrbanEcology,” ACM MobiHoc, Hangzhou, PRC, Jun. 2015.
[65] A. Furno, R. Stanica, M. Fiore, “A Comparative Evaluation of UrbanFabric Detection Techniques Based on Mobile Traffic Data,” IEEE/ACMASONAM, 1–8, Paris, France, Aug. 2015.
[66] S. Grauwin, S. Sobolevsky, S. Moritz, I. Godor, C. Ratti, “Towardsa comparative science of cities: using mobile traffic records in NewYork, London and Hong Kong,” Computational approaches for urbanenvironments, Springer International Publishing, Sep. 2015.
[67] J. Ma, W. Ni, J. Yin, S. Lin, H. Cui, R.P. Liu, B.X. Fang, “ModellingSocial Characteristics of Mobile Radio Networks,” DySON, London,UK, 2015.
[68] P. Secchi, S. Vantini, V. Vitelli, “Analysis of spatio-temporal mobilephone data: a case study in the metropolitan area of Milan,” StatisticalMethods & Applications, 24(2):279–300, 2015.
[69] J. Candia, M. C. Gonzalez, P. Wang, T. Schoenharl, G. Madey, A.-L. Barabasi “Uncovering Individual and Collective Human Dynamicsfrom Mobile Phone Records.” Journal of Physics A: Mathematical andTheoretical 41(22): 224015, 2008.
[70] F. Calabrese, F. Pereira, G. Di Lorenzo, L. Liu, C. Ratti, “The Geographyof Taste: Analyzing Cell-Phone Mobility and Social Events,” PervasiveComputing, Helsinki, Finland, May 2010.
[71] M.F. Dixon, S.P. Aiello, F. Fapohunda, W. Goldstein, “Detecting Mobil-ity Patterns in Mobile Phone Data from the Ivory Coast,” NetMob D4DChallenge, Boston, MA, USA, May 2013.
[72] D.M. Gowan, N. Hurley, “Regional Development – Capturing a Nation’sSporting Interest through Call Detail Analysis,” NetMob D4D Challenge,1–17, Boston, MA, USA, May 2013.
[73] J. Bagrow, D. Wang, A.-L. Barabasi, “Collective Response of HumanPopulations to Large-Scale Emergencies”, PLoS ONE, 6(3):e17680,Mar. 2011.
[74] S. Linardi, S. Kalyanaraman, D. Berger, “Does Conflict Affect HumanMobility and Cellphone Usage? Evidence from Cote d’Ivoire”, NetMobD4D Challenge, Boston, MA, USA, May 2013.
[75] A. Wesolowski, N. Eagle, A.J. Tatem, D.L. Smith, A.M. Noor, R.W.Snow, and C.O. Buckee, “Quantifying the Impact of Human Mobilityon Malaria”, Science, 338(6104):267–270, Oct. 2012.
[76] E. Enns, J. Amuasi, “Human Mobility and Communication Patterns inCote d’Ivoire: A Network Perspective for Malaria Control”, NetMobD4D Challenge, 1–14, Boston, MA, USA, May 2013.
[77] K. Gavric, S. Brdar, D. Culibrk, V. Crnojevic, “Linking the HumanMobility and Connectivity Patterns with Spatial HIV Distribution”,NetMob D4D Challenge, 1–6, Boston, MA, USA, May 2013.
[78] N. Baldo, P. Closas, “Disease Outbreak Detection by Mobile NetworkMonitoring: A Case Study with the D4D Datasets”, NetMob D4DChallenge, 1–4, Boston, MA, USA, May 2013.
[79] T.D. Ndie, Z. Nganmeni, S. Noutat, “Design and Implementation of aTool for the Correlation between the Rate of Prevalence of a Pathologyand the Flow of Communication between Diverse Localities”, NetMobD4D Challenge, 1–19, Boston, MA, USA, May 2013.
[80] R. Chunara, E.O. Nsoesie, “Large-scale Measurements of NetworkTopology and Disease Spread: A Pilot Evaluation Using Mobile PhoneData in Cote d’Ivoire”, NetMob D4D Challenge, 1–18, Boston, MA,USA, May 2013.
[81] A.S. Azman, E.A. Urquhart, B. Zaitchik, J. Lessler, “Using MobilePhone Data to Supercharge Epidemic Models of Cholera Transmissionin Africa: A Case Study of Cote d’Ivoire”, NetMob D4D Challenge,1–11, Boston, MA, USA, May 2013.
[82] M. Tizzoni, P. Bajardi, A. Decuyper, G.K.K. King, C.M. Schneider, V.Blondel, Z. Smoreda, M.C. Gonzalez, V. Colizza, “On the Use of HumanMobility Proxy for the Modeling of Epidemics”, PLOS ComputationalBiology, 10(7):e1003716, Jul. 2014.
[83] V. Frias-Martinez, A. Rubio, E. Frias-Martinez, “Measuring the Impactof Epidemic Alerts on Human Mobility using Cell-Phone NetworkData”, PURBA, Newcastle, UK, Jun. 2012.
[84] E. Frias-Martinez, G. Williamson, V. Frias-Martinez, “An Agent-BasedModel of Epidemic Spread Using Human Mobility and Social NetworkInformation”, SocialCom, Boston, MA, USA, Oct. 2011.
[85] M. Saravanan, P. Karthikeyan, A. Aarthi, “Exploring Community Struc-ture to Understand Disease Spread and Control Using Mobile Call DetailRecords”, NetMob D4D Challenge, 1–19, Boston, MA, USA, May 2013.
[86] J.P. Leidig, Y. Kutsumi, K.A. O’Hearn, C.M. Sauer, J. Scripps, G.Wolffe, “Applying Mobile Datasets in Computational Public Health Re-search”, NetMob D4D Challenge, 1–11, Boston, MA, USA, May 2013.
[87] M. Kafsi, E. Kazemi, L. Maystre, L. Yartseva, M. Grossglauser, P. Thi-ran, “Mitigating Epidemics through Mobile Micro-Measures”, NetMob,1–21, Boston, MA, USA, May 2013.
[88] A. Lima, M. De Domenico, V. Pejovic, M. Musolesi, “ExploitingCellular Data for Disease Containment and Information CampaignsStrategies in Country-Wide Epidemics”, NetMob D4D Challenge, 1–9,Boston, MA, USA, May 2013.
[89] J. Schlaich, T. Otterstatter, M. Friedrich, “Generating Trajectories fromMobile Phone Data,” TRB 89th Annual Meeting, Washington, DC, USA,Jan. 2010.
[90] F. Liu, D. Janssens, G. Wets, M. Cools, “Profiling Workers’ Activity-Travel Behavior based on Mobile Phone Data,” NetMob D4D Challenge,1–27, Boston, MA, USA, May 2013.
[91] S. Bekhor, Y. Cohen, C. Solomon, “Evaluating Long-Distance TravelPatterns in Israel by Tracking Cellular Phone Positions,” Journal ofAdvanced Transportation, 47(4):435–446, Jun. 2013.
[92] H. Wang, F. Calabrese, G. D. Lorenzo, C. Ratti, “Transportation ModeInference from Anonymized and Aggregated Mobile Phone Call DetailRecords,” IEEE ITSC, Madeira Island, Portugal, Sep. 2010.
[93] F. Calabrese, G. Di Lorenzo, L. Liu, C. Ratti, “Estimating Origin-Destination Flows using Mobile Phone Location Data,” IEEE PervasiveComputing, 10(4):36–44, Oct. 2011.
[94] M. Berlingerio, F. Calabrese, G. Di Lorenzo, R. Nair, F. Pinelli, M.L.Sbodio, “AllAboard: A System for Exploring Urban Mobility andOptimizing Public Transport Using Cellphone Data,” NetMob D4DChallenge, Boston, MA, USA, May 2013.
[95] J. Ma, H. Li, Y. Huan, F. Yuan, T. Bauer, “Deriving Operational Origin-Destination Matrices from Large Scale Mobile Phone Data,” Interna-tional Journal of Transportation Science and Technology, 2(3):183–203,Nov. 2013.
36
[96] E. Halepovic, C.Williamson “Characterizing and Modeling User Mo-bility in a Cellular Data Network,” ACM PEWASUN, Montreal, QC,Canada, Oct. 2005.
[97] U. Paul, A. P. Subramanian, M. M. Buddhikot, S. R. Das “UnderstandingTraffic Dynamics in Cellular Data Networks.” IEEE Infocom, Shanghai,PRC, Apr. 2011.
[98] S. Scepanovic, P. Hui, A. Yla-Jaaski, “Revealing the Pulse of HumanDynamics in a Country from Mobile Phone Data,” NetMob D4DChallenge, 1–15, Boston, MA, USA, May 2013.
[99] A. Hess, I. Marsh, D. Gillblad, “Exploring Communication and MobilityBehavior of 3G Network Users and Its Temporal Consistency,” IEEEICC, London, UK, Jun. 2015.
[100] E. Cho, S. A. Myers, J. Leskovec, “Friendship and Mobility: UserMovement in Location-Based Social Networks,” ACM SIGKDD, SanDiego, CA, USA, Aug. 2011.
[101] G. Ranjan, H. Zang, Z.-L. Zhang, J. Bolot, “Are Call Detail RecordsBiased for Sampling Human Mobility?”, ACM Mobile Computing andCommunications Review, 16(3):33–44, Jul. 2012.
[102] M. Lenormand, M. Picornell, O.G. Cantu-Ros, A. Tugores, T. Louail,R. Herranz, M. Barthelemy, E. Frıas-Martınez, J.J. Ramasco, “Cross-checking Different Sources of Mobility Information,” PLoS ONE,Aug. 2014.
[103] S. Isaacman, R. Becker, R. Caceres, S. Kobourov, M. Martonosi, J.Rowland, A. Varshavsky, “Identifying Important Places in Peoples Livesfrom Cellular Network Data,” Pervasive, San Francisco, CA, USA,Jun. 2011.
[104] M. Mamei, L. Ferrari, “Daily Commuting in Ivory Coast: DevelopmentOpportunities,” NetMob D4D Challenge, Boston, MA, USA, May 2013.
[105] B. Cici, A. Markopoulou, E. Frias-Martinez, N. Laoutaris, “Quantifyingthe Potential of Ride-Sharing using Call Description Records,” ACMHotMobile, Jekyll Island, GA, USA, Feb. 2013.
[106] C.M. Schneider, V. Belik, T. Couronne, Z. Smoreda, M.C. Gonzalez,“Unravelling Daily Human Mobility Motifs,” J.R.Soc. Interface, 10(84),May 2013.
[107] M. Nanni, R. Trasarti, B. Furletti, L. Gabrielli, P. Van Der Mede, J.De Bruijn, E. De Romph, G. Bruil, “Transportation Planning Based onGSM Traces: A Case Study on Ivory Coast,” CitiSens, Barcelona, Spain,Sep. 2013.
[108] V. Frias-Martinez, J. Virseda, A. Rubio, E. Frias-Martinez, “TowardsLarge Scale Technology Impact Analyses: Automatic Residential Lo-calization from Mobile Phone-Call Data”, ICTD, 1–10, London, UK,Dec. 2010.
[109] B. Csaji, A. Browet, V.A. Traag, J.-C. Delvenne, E. Huens, P.Van Dooren, Z. Smoreda, V.D. Blondel, “Exploring the Mobility ofMobile Phone Users,” Physica A, 392(6):1459–1473, Jun. 2013.
[110] C. Song, T. Koren, P. Wang, A.-L. Barabasi, “Modelling the Scal-ing Properties of Human Mobility,” Nature Physics, 6(10):818–823,Sep. 2010.
[111] A. Sridharan, J. Bolot, “Location Patterns of Mobile Users : A Large-Scale Study,” IEEE Infocom, Turin, Italy, Apr. 2013.
[112] A. Rubio, V. Frias-Martinez, E. Frias-Martinez, N. Oliver, “HumanMobility in Advanced and Developing Economies: A ComparativeAnalysis,” AAAI AI-D, Palo Alto, CA, USA, Mar. 2010.
[113] S. Hoteit, S. Secci, S. Sobolevsky, G. Pujolle, C. Ratti, “Estimating Hu-man Trajectories and Hotspots through Mobile Phone Data,” ComputerNetworks, 64:296–307, May 2014.
[114] D. Zhang, F. Zhang, J. Huang, C. Xu, Y. Li, T. He, “Exploring HumanMobility with Multi-Source Data at Extremely Large MetropolitanScales,” ACM MobiCom, Maui, HI, USA, Sep. 2014.
[115] M. Vieira, E. Frias-Martinez, P. Bakalov, V. Frias-Martinez, V. Tsortas,“Querying Spatio-Temporal Petterns in Mobile Phone-Call Databases”,IEEE MDM, Kansas City, MO, USA, May 2010.
[117] M. Mitrovic, V. Palchykov, H.-H. Jo, J. Saramaki, “Mobility andCommunication Patterns in Ivory Coast,” NetMob D4D Challenge,Boston, MA, USA, May 2013.
[118] X. Liang, J. Zhao, L. Dong, K. Xu, “Unraveling the Origin ofExponential Law in Intra-Urban Human Mobility,” Scientific Reports,3(2983), Oct. 2013.
[119] H. Zang, J. Bolot. “Mining Call and Mobility Data to Improve PagingEfficiency in Cellular Networks,” ACM MobiCom, Montreal, Quebec,Canada, Sep. 2007.
[120] C. Song, Z. Qu, N. Blumm, A.-L. Barabasi, “Limits of Predictabilityin Human Mobility,” Science, 327(5968):1018–1021, Jan. 2010.
[121] X. Lu, E. Wetter, N. Bharti, A.J. Tatem, L. Bengtsson, “Approachingthe Limit of Predictability in Human Mobility,” Scientific Reports, 3(10),Oct. 2013.
[122] X. Lu, L. Bengtsson, P. Holme. “Predictability of Population Dis-placement after the 2010 Haiti Earthquake,” Proc. National Academyof Sciences, 109(29):11576–11581, May 2012.
[123] S. Isaacman, R. Becker, R. Caceres, S. Kobourov, J. Rowland, A.Varshavsky, “A Tale of Two Cities,” ACM HotMobile, Annapolis, ML,USA, Feb. 2010.
[124] S. Isaacman, R. Becker, R. Caceres, S. Kobourov, M. Martonosi,J. Rowland, A. Varshavsky, “Ranges of Human Mobility in Los An-geles and New York,” IEEE PerCom Workshops, Seattle, WA, USA,Mar. 2011.
[125] R.W. Douglass, D.A. Meyer, M. Ram, D. Rideout, D. Song, “HighResolution Population Estimates from Telecommunications Data,” EPJData Science, 4(4), May 2015.
[126] L. Bengtsson, X. Lu, A. Thorson, R. Garfield, J. von Schreeb, “Im-proved Response to Disasters and Outbreaks by Tracking PopulationMovements with Mobile Phone Network Data: A Post-EarthquakeGeospatial Study in Haiti,” PLoS Medicine, 8(8):1–9, Aug. 2011.
[127] A. Wesolowski, N. Eagle, A.M. Noor, R.W. Snow, C.O. Buckee, “TheImpact of Biases in Mobile Phone Ownership on Estimates of HumanMobility”, J.R.Soc. Interface, 10(81), Feb. 2013.
[128] F. Simini, M. Gonzalez, A. Maritan, A.-L. Barabasi, “A UniversalModel for Mobility and Migration Patterns,” Nature, 484(7392):96–100,Apr. 2012.
[129] S. Isaacman, R. Becker, R. Caceres, M. Martonosi, J. Rowland, V.Varshavsky, W. Willinger, “Human Mobility Modeling at MetropolitanScales,” ACM MobiSys, Low Wood Bay, Lake District, United Kingdom,Jun. 2012.
[130] D.J. Mir, S. Isaacman, R. Caceres, M. Martonosi, R.N. Wright, “DP-WHERE: Differentially Private Modeling of Human Mobility,” IEEEBigData, Santa Clara, CA, USA, Oct. 2013.
[131] Y. Yang, C. Herrera, N. Eagle, M.C. Gonzalez, “A Multi-Scale Multi-Cultural Study of Commuting Patterns Incorporating Digital Traces,”NetMob, Boston, MA, USA, May 2013.
[132] G. Rose, “Mobile Phones as Traffic Probes: Practices, Prospects andIssues,” Transport Reviews, 26(3):275–291, May 2006.
[133] Z. Qiu, P. Cheng, “State of the Art and Practice: Cellular ProbeTechnology Applied in Advanced Traveler Information System.” TRB86th Annual Meeting, Washington, DC, USA, Jan. 2007.
[134] N. Caceres, J. Wideberg, F.G. Benitez, “Review of Traffic Data Esti-mations Extracted from Cellular Networks,” IET Intelligent TransportSystems, 2(3):179–192, Sep. 2008.
[135] S.V. Wunnava, K. Yen, T. Babij, R. Zavaleta, R. Romero, C. Archilla,“Travel Time Estimation Using Cell Phones for Highways and Road-ways,” Florida Department of Transportation Final Report, Dec. 2007.
[136] H. Bar-Gera, “Evaluation of a Cellular Phone-based System for Mea-surements of Traffic Speeds and Travel Times: A Case Study fromIsrael,” Transportation Research Part C, 15(6):380–391, Dec. 2007.
[137] A. Janecek, D. Valerio, K.A. Hummel, F. Ricciato, H. Hlavacs, “Cellu-lar Data Meet Vehicular Traffic Theory: Location Area Updates and CellTransitions for Travel Time Estimation,” ACM UbiComp, Pittsburgh, PA,USA, Sep. 2012.
[139] F. Calabrese, M. Colonna, P. Lovisolo, D. Parata, C. Ratti, “Real-TimeUrban Monitoring Using Cell Phones: A Case Study in Rome,” IEEETrans. Intelligent Transportation Systems, 12(1):141–151, Mar. 2011.
[140] R. Bolla, F. Davoli, “Road Traffic Estimation from Location TrackingData in the Mobile Cellular Network,” IEEE WCNC, Chicago, IL, USA,Sep. 2000.
[141] J. White, I. Wells, “Extracting Origin Destination Information fromMobile Phone Data,” IEE RTIC, London, UK, Mar. 2002.
[142] J. Doyle, P. Hung, D. Kelly, S. McLoone, R. Farrell, “Utilising MobilePhone Billing Records for Travel Mode Discovery,” ISSC, Dublin,Ireland, Jun. 2011.
[143] M. Zilske, K. Nagel, “Building a Minimal Traffic Model from MobilePhone Data,” NetMob D4D Challenge, Boston, MA, USA, May 2013.
[144] B. Furletti, L. Gabrielli, S. Rinzivillo, C. Renso, “Identifying UsersProfiles from Mobile Calls Habits”, ACM UrbComp, Beijing, PRC,Aug. 2012.
[145] K.S. Kung, K. Greco, S. Sobolevsky, C. Ratti, “Exploring UniversalPatterns in Human Home-Work Commuting from Mobile Phone Data,”PLoS ONE, 9(6):e96180, Jun. 2014.
37
[146] C. Iovan, A.-M. Olteanu-Raimond, T. Couronne, Z. Smoreda, “Movingand Calling: Mobile Phone Data Quality Measurements and Spatiotem-poral Uncertainty in Human Mobility Studies,” Geographic InformationScience at the Heart of Europe, D. Vandenbroucke, B. Bucher, J.Crompvoets (editors), Springer, 247–265, May 2013.
[147] C. Williamson, E. Halepovic, H. Sun, Y. Wu “Characterization ofCDMA2000 Cellular Data Network Traffic.” IEEE LCN, Sydney, Aus-tralia, Nov. 2005.
[148] R. Keralapura, A. Nucci, Z.-L. Zhang, L. Gao. “Profiling Users in a3G Network Using Hourglass Co-Clustering.” ACM MobiCom, Chicago,Illinois, USA, Sep. 2010.
[149] M.Z. Shafiq, L. Ji, A. X. Liu, J. Wang. “Characterizing and ModelingInternet Traffic Dynamics of Cellular Devices.” ACM SIGMETRICS, SanJose, California, USA, Jun. 2011.
[150] Y. Zhang, A. Arvidsson, “Understanding the Characteristics of CellularData Traffic,” ACM SIGCOMM CellNet Workshop, Helsinki, Finland,Aug. 2012.
[151] E. Mucelli, A. C. Viana, K. P. Naveen, and C. Sarraute. “Measurement-driven Mobile Data Traffic Modeling in a Large Metropolitan Area,”IEEE PerCom, St. Louis, MO, USA, Mar. 2015.
[152] Y. Wang, M. Faloutsos, H. Zang “On the Usage Patterns of MultimodalCommunication: Countries and Evolution.” IEEE GI, Turin, Italy, Apr.2013.
[153] F. Girardin, A. Vaccari, A. Gerber, A. Biderman, C. Ratti “TowardsEstimating the Presence of Visitors from the Aggregate Mobile phoneNetwork Activity They Generate.” CUPUM, Hong Kong, PRC, Jun.2009.
[154] H. Hohwald, E. Frias-Martinez, N. Oliver “User Modeling forTelecommunication Applications: Experiences and Practical Implica-tions.” UMAP, Big Island, Hawaii, USA, Jun. 2010.
[155] J.C. Cardona, R. Stanojevic, N. Laoutaris, “Collaborative Consumptionfor Mobile Broadband: A Quantitative Study,” ACM CoNext, Sydney,Australia, Dec. 2014.
[156] M.Z. Shafiq, L. Ji, A.X. Liu, J. Pang, J. Wang, “Large-Scale Mea-surement and Characterization of Cellular Machine-to-Machine Traffic,”IEEE/ACM Transactions on Networking, 21(6):1960-1973, Dec. 2013.
[157] C. Ratti, R. M. Pulselli, S. Williams, D. Frenchman. “Mobile Land-scapes: Using Location Data from Cell-Phones for Urban Analysis.”Environment and Planning B Planning and Design 33(5): 727, 2006.
[158] D. Willkomm, S. Machiraju, J. Bolot, A. Wolisz “Primary Users inCellular Networks: A Large-Scale Measurement Study.” IEEE DySPAN,Chicago, Illinois, USA, Oct. 2008.
[159] M. Cerinsek, J. Bodlaj, V. Batagelj, “Symbolic Clustering of Usersand Antennae”, NetMob D4D Challenge, 1–16, Boston, MA, USA,May 2013.
[160] S. Hoteit, S. Secci, G. Pujolle, Z. He, C. Ziemlicki, Z. Smoreda, C.Ratti “Content Consumption Cartography of the Paris Urban Regionusing Cellular Probe Data.” UrbaNe, Nice, France, Dec. 2012.
[161] M. Z. Shafiq, L. Ji, A. X. Liu, J. Pang, J. Wang. “CharacterizingGeospatial Dynamics of Application Usage in a 3G Cellular DataNetwork.” IEEE Infocom, Orlando, Florida, USA, Mar. 2012.
[162] R. Trasarti, A.-M. Olteanu-Raimond, M. Nanni, T. Couronne, B.Furletti, F. Giannotti, Z. Smoreda, C. Ziemlicki “Discovering Urbanand Country Dynamics from Mobile Phone Data with Spatial Corre-lation Patterns.” Elsevier Telecommunications Policy, 39(3–4):347–362,May 2015.
[163] B. Zong, P. Bogdanov, A. K. Singh, “Constrained Link Prediction onthe D4D Dataset”, NetMob D4D Challenge, 1–6, Boston, MA, USA,May 2013.
[164] A.-L. Barabasi, R. Albert, “Emergence of Scaling in Random Net-works”, Science, 286(5439):509–512, Oct. 1999.
[165] F. H. Z. Xavier, L. M. Silveira, J. M. Almeida, A. Ziviani, C. H. S.Malab, H. M. Neto “Analyzing the Workload Dynamics of a MobilePhone Network in Large Scale Events.” UrbaNe, Nice, France, Dec.2012.
[166] M.Z. Shafiq, L. Ji, A.X. Liu, J. Pang, S. Venkataraman, J. Wang, “AFirst Look at Cellular Network Performance during Crowded Events,”ACM SIGMETRICS, Pittsburgh, PA, USA, Jun. 2013.
[167] F. H. Z. Xavier, L. M. Silveira, J. M. Almeida, C. H. S. Malab, A.Ziviani, H. T. Marques-Neto “Understanding Human Mobility Due toLarge-Scale Events.” NetMob, Boston, MA, USA, May 2013.
[168] P. Paraskevopoulos, T.-C. Dinh, Z. Dashdorj, T. Palpanas, L. Serafini“Identification and Characterization of Human Behavior Patterns fromMobile Phone Data.” NetMob D4D Challenge, Boston, MA, USA, May2013.
[169] D. Pastor-Escuredo, T. Savy, M. A. Luengo-Oroz “Can Fires, NightLights, and Mobile Phones Reveal Behavioral Fingerprints Useful forDevelopment?” NetMob D4D Challenge, Boston, MA, USA, May 2013.
[170] S. V. D. Elzen, J. Blaas, D. Holten, J.-K. Buenen, J. J. V. Wijk,R. Spousta, A. Miao, S. Sala, S. Chan “Exploration and Analysis ofMassive Mobile Phone Data: A Layered Visual Analytics Approach.”NetMob D4D Challenge, Boston, MA, USA, May 2013.
[171] J. Bodlaj, M. Cerinsek, V. Batagelj, “Visualization of Traffic”, NetMobD4D Challenge, 1–16, Boston, MA, USA, May 2013.
[172] M.V. Rodriguez, V. Mendiratta, B. Lim, D. Doran, D. Klabjan, “Inter-active Visualization of Cellphone Network Data using D3: The Case ofIvory Coast”, NetMob D4D Challenge, Boston, MA, USA, May 2013.
[173] J. Smith, J. Stevens, M. Idris, “NVizABLE: A Web-based NetworkVisualization Interface”, NetMob D4D Challenge, 1–5, Boston, MA,USA, May 2013.
[174] K. Dasgupta, R. Singh, B. Viswanathan, D. Chakraborty, S. Mukherjea,A. A. Nanavati. “Social Ties and their Relevance to Churn in MobileTelecom Networks.” EDBT, Nantes, France, Mar. 2008.
[175] F. Ben Abdesslem, A. Lindgren, “Large Scale Characterisation ofYouTube Requests in a Cellular Network,” IEEE WoWMoM, Sydney,Australia, Mar. 2014.
[176] Q. Lin, “Mobile Customer Clustering Analysis based on Call DetailRecords.” Communications of the IIMA 7(4): 95-100, 2007.
[177] R. Becker, R. Caceres, K. Hanson, J. M. Loh, S. Urbanek, A.Varshavsky, C. Volinsky “Clustering Anonymized Mobile Call DetailRecords to Find Usage Groups.” PURBA, San Francisco, CA, USA,Jun. 2011.
[178] T. Couronne, Z. Smoreda, A.-M. Olteanu. “Chatty Mobiles: IndividualMobility and Communication Patterns.” NetMob, Boston, MA, USA,Oct. 2011.
[179] Q. Xu, Y. Liao, S. Miskovic, Z.M. Mao, M. Baldi, A. Nucci, T.Andrews, “Automatic Generation of Mobile App Signatures from TrafficObservations,” IEEE Infocom, Hong Kong, PRC, Apr. 2015.
[180] H. Zang, F. Baccelli, J. Bolot, “Bayesian Inference for Localization inCellular Networks,” IEEE Infocom, San Diego, CA, USA 2010.
[181] Q. Xu, A. Gerber, Z.M. Mao, J. Pang. “AccuLoc: Practical Localizationof Performance Measurement in 3G Networks,” ACM MobiSys, Wash-ington, DC, USA, Jun. 2011.
[182] F. Qian, Z. Wang, A. Gerber, Z.M. Mao, S. Sen, O. Spatscheck,“Characterizing Radio Resource Allocation for 3G Networks.” ACMIMC, Melbourne, Australia, Nov. 2010.
[183] A. Balachandran, V. Aggarwal, E. Halepovic, J. Pang, S. Seshan,S. Venkataraman, H. Yan, “Modeling Web Quality-of-Experience onCellular Networks,” ACM MobiCom, Maui, Hawaii, USA, Sep. 2014.
[184] M.Z. Shafiq, J. Erman, L. Ji, A.X. Liu, J. Pang, J. Wang, “Un-derstanding the Impact of Network Dynamics on Mobile Video UserEngagement,” ACM SIGMETRICS, Austin, TX, USA, Jun. 2014.
[185] A. Gerber, M. Hajiaghayi, D. Pei, S. Sen, J. Erman, “To Cache orNot to Cache: The 3G Case,” IEEE Internet Computing, 15(2):27–34,Mar. 2011.
[186] A. Finamore, M. Mellia, Z. Gilani, K. Papagiannaki, V. Erramilli, Y.Grunenberger, “Is There a Case for Mobile Phone Content Pre-Staging?”ACM CoNEXT, Santa Barbara, CA, USA, Dec. 2013.
[187] F. Yu, G. Xue, H. Zhu, Z. Hu, M. Li, G. Zhang. “Cutting without Pain:Mitigating 3G Radio Tail Effect on Smartphones” IEEE Infocom, Turin,Italy, Apr. 2013.
[188] K. Kumar, A. Gupta, R. Shah, A. Karandikar, P. Chaporkar, “OnAnalyzing Indian Cellular Traffic Characteristics for Energy EfficientNetwork Operation,” NCC, Mumbai, India, Feb. 2015.
[189] C. Peng, S.-B. Lee, S. Lu, H. Luo, H. Li, “Traffic-Driven Power Savingin Operational 3G Cellular Networks,” ACM MobiCom, Las Vegas, NV,USA, Sep. 2011.
[190] S. Bhaumik, S.P. Chandrabose, M.K. Jataprolu, G. Kumar, A. Mu-ralidhar, P. Polakos, V. Srinivasan, T. Woo, “CloudIQ: A Framework forProcessing Base Stations in a Data Center,” ACM MobiCom, Istanbul,Turkey, Aug. 2012.
[191] P. Wang, M.C. Gonzalez, C.A. Hidalgo, A.-L. Barabasi “Understandingthe Spreading Patterns of Mobile Phone Viruses,” Science 324, no. 5930:1071-1076, 2009.
[192] R. Agarwal, V. Gauthier , M. Becker. “Information Dissemination usingHuman Mobility in Realistic Environment - (E-Inspire).” NetMob D4DChallenge, 1–8, Boston, MA, USA, May 2013.
[193] Z. Zhu, G. Cao, S. Zhu, S. Ranjan, A. Nucci, “A Social Network BasedPatching Scheme for Worm Containment in Cellular Networks,” IEEEInfocom, Rio de Janeiro, Brazil, Apr. 2009.
38
[194] Y. Zhu, C. Zhang, Y. Wang “Mobile Data Delivery through Opportunis-tic Communications among Cellular Users: A Case Study for the D4DChallenge,” NetMob D4D Challenge, Boston, MA, USA, May 2013.
[195] C.-P. Wei, I.-T. Chiu. “Turning Telecommunications Call Details toChurn Prediction: A Data Mining Approach.” Expert systems withapplications 23(2): 103-112, 2002.
[196] R. Belo, P. Ferreira “Is Social Influence Always Positive? Evidencefrom a Very Large Mobile Network.” Economics of Information Tech-nology and Digitization Workshop, 1–6, Boston, MA, USA, Jul. 2013.
[197] G. Szabo, A.-L. Barabasi, “Network Effects in Service Usage”, arXivpre-print, arXiv:physics0611177, Nov. 2006.
[198] H. Zang, J. Bolot. “Anonymization of Location Data Does Not Work:A Large-Scale Measurement Study,” ACM MobiCom, Las Vegas, NV,USA, Sep. 2011.
[199] Y.-A. de Montjoye, C. A. Hidalgo, M. Verleysen, V.D. Blondel,“Unique in the Crowd: The Privacy Bounds of Human Mobility,”Scientific Reports 3, 2013.
[200] Y. Song, D. Dahlmeier, S. Bressan, “Not So Unique in the Crowd: aSimple and Effective Algorithm for Anonymizing Location Data,” ACMPIR, Queensland, Australia, Jul. 2014.
[201] M. Gramaglia, M. Fiore, “Hiding Mobile Traffic Fingerprints withGLOVE,” ACM CoNEXT, 1–13, Heidelberg, Dec. 2015.
[202] G. Acs, C. Castelluccia, “A Case Study: Privacy Preserving Releaseof Spatio-Temporal Density in Paris,” ACM SIGKDD, New York, NY,USA, Aug. 2014.
Diala Naboulsi is a PhD student at INSA Lyon,France. She holds a MS degree from INSA Lyon,France and a MEng from the Lebanese University,Lebanon. Her research interests lie at the intersectionof mobile networking and data analysis.
Marco Fiore (S05, M09) is a researcher at CNR-IEIIT, Italy, and an associate researcher at Inria,France. He received a PhD degree from Politecnicodi Torino, in 2008, and a habilitation a dirigerdes recherches (HDR) from University of Lyon,in 2014. He held positions as associate professorat INSA Lyon, France, and visiting researcher atRice University, USA, and Universitat Politecnicade Catalunya, Spain. His research interests are onmobile traffic analysis and vehicular networking.
Stephane Ribot Stephane Ribot is the Executive Di-rector for CenturyLink s Data and IoT practices withmore than 18 years of of experience in technology.He is currently completing his PhD research on BigData-Cloud computing at University of Lyon 3 Mag-ellan Research Center. Previously he led the Com-munications industry delivering advanced analyticsand architectures for Orange Business Services, a$70+ billion Communications provider. During histenure at Orange he earned various industry awardssuch as the WCA (World Communication Award).
Stephane holds a degree in Mathematics and an MBA; with Multi-Nationalexpertise.
Razvan Stanica is associate professor at INSALyon, France, and researcher in the Inria UrbaNetteam. He holds a PhD in computer science from INPToulouse, France, delivered in 2011, and MS degreesfrom INP Toulouse and University Politehnica ofBucharest, Romania. His research interests are in thearea of mobile networking.
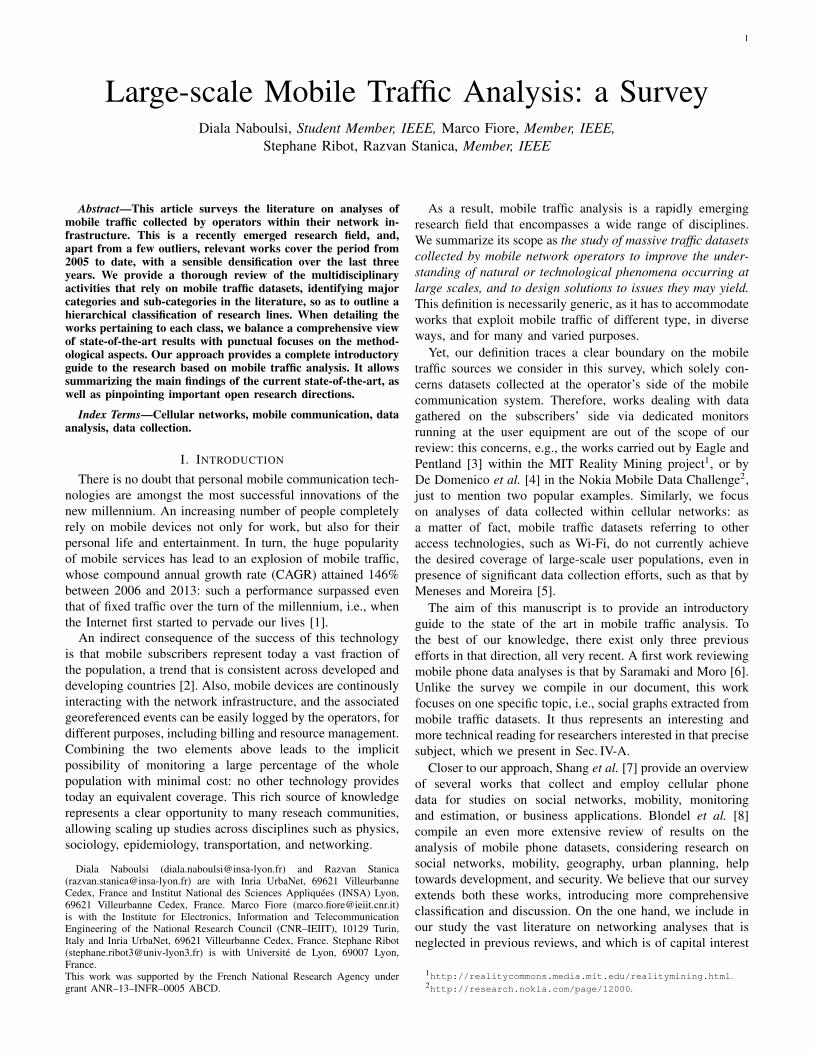
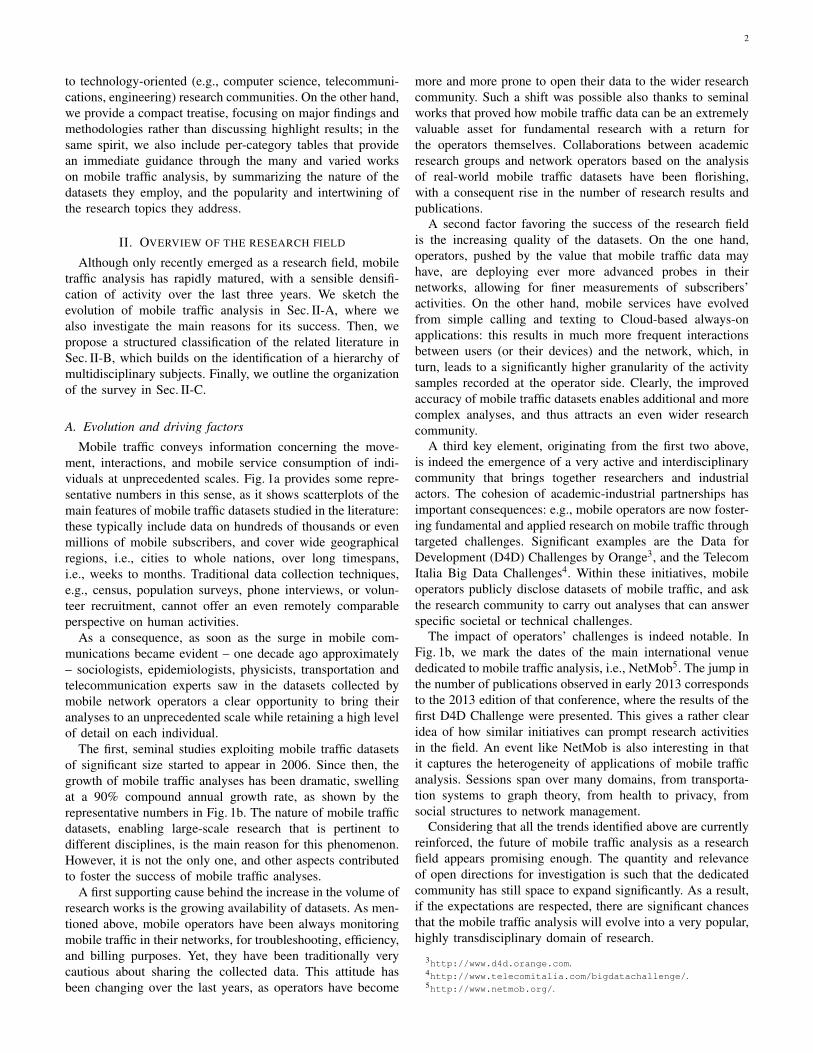
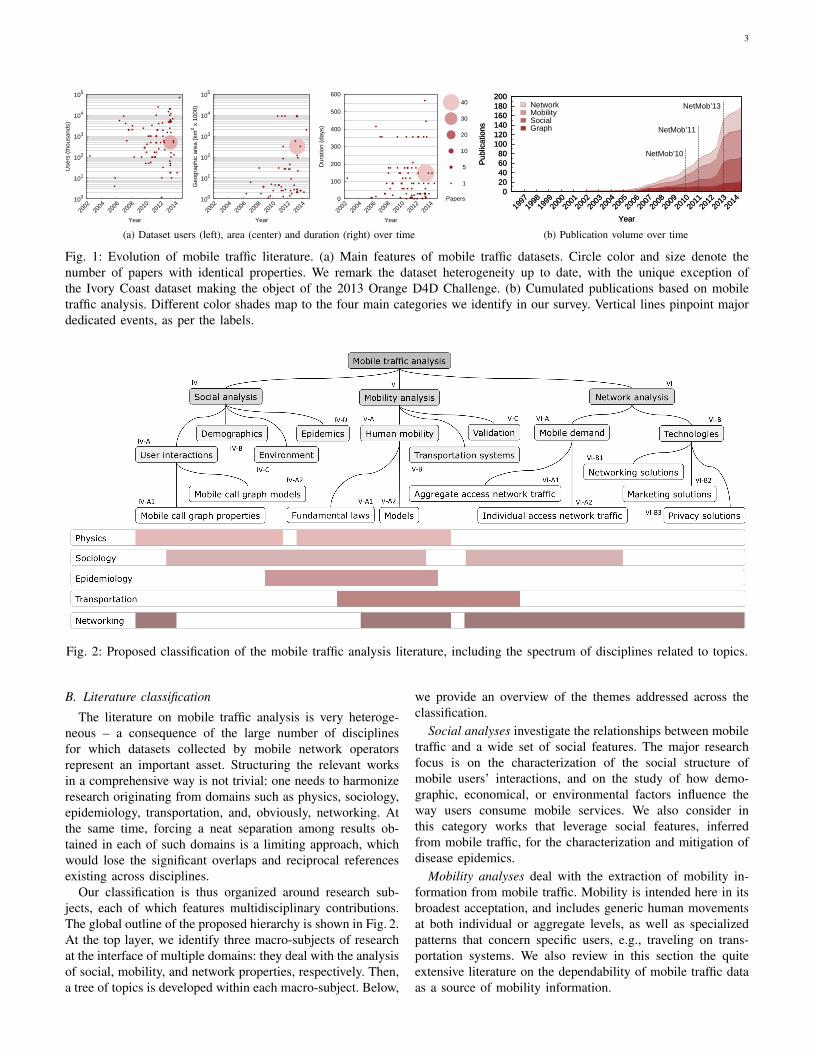


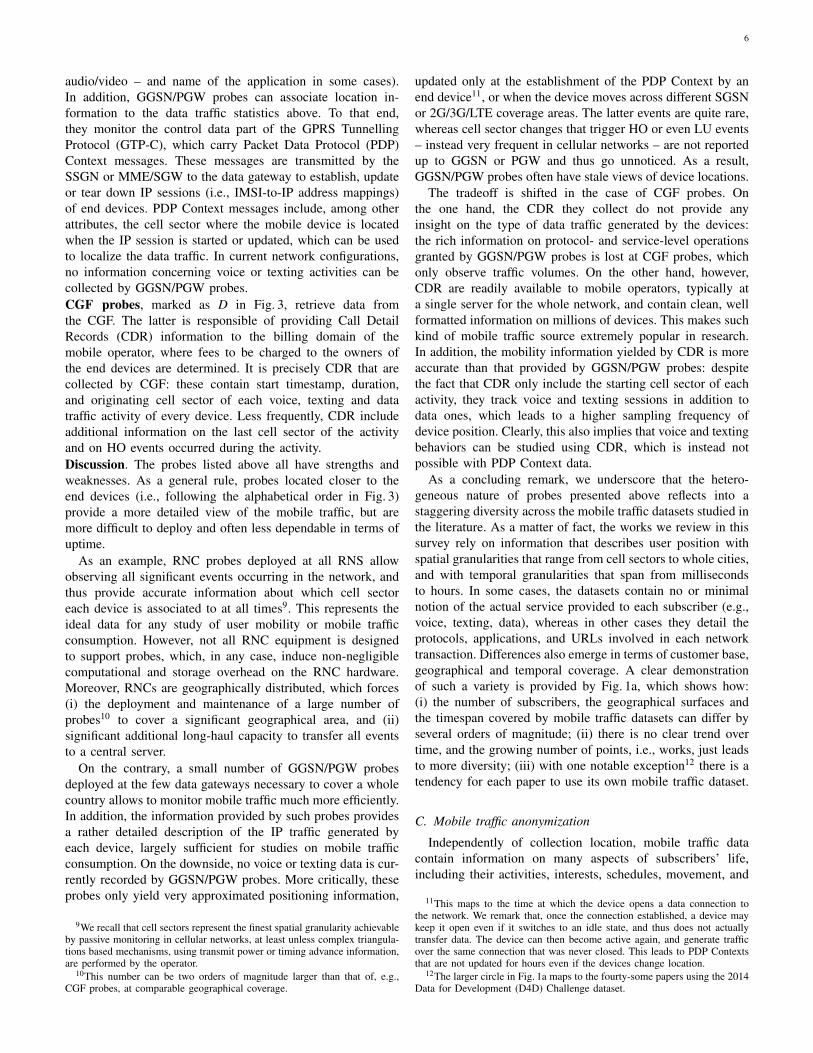


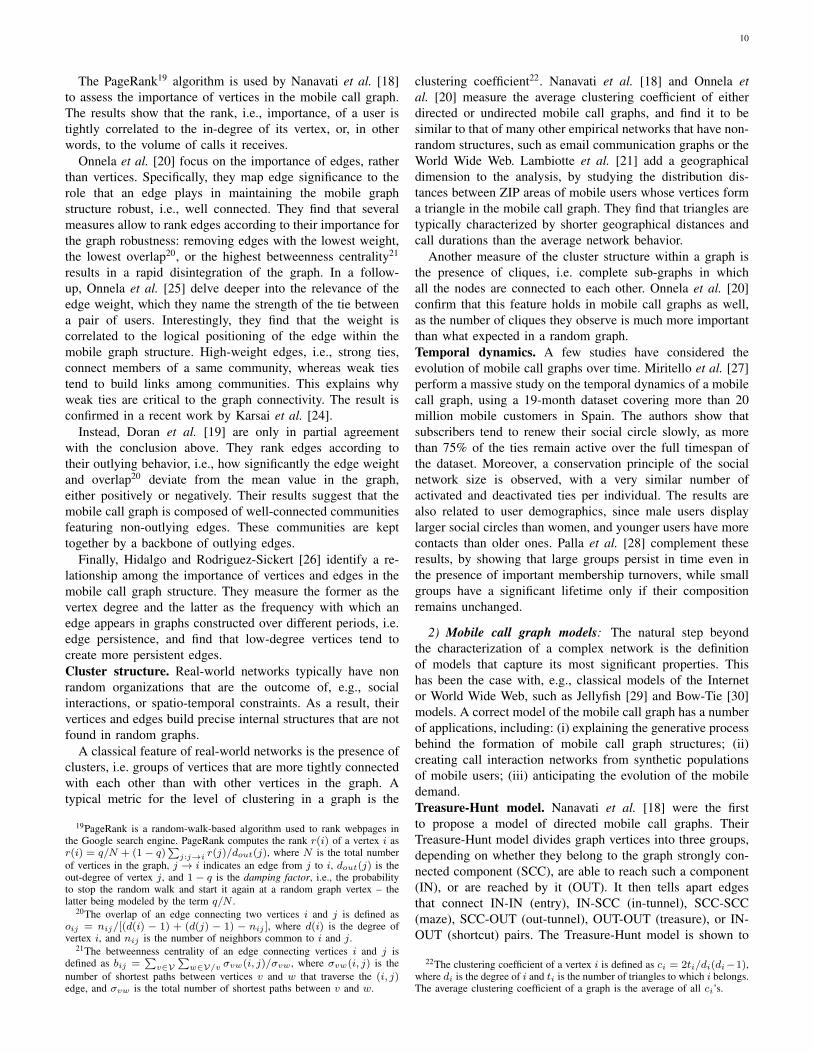


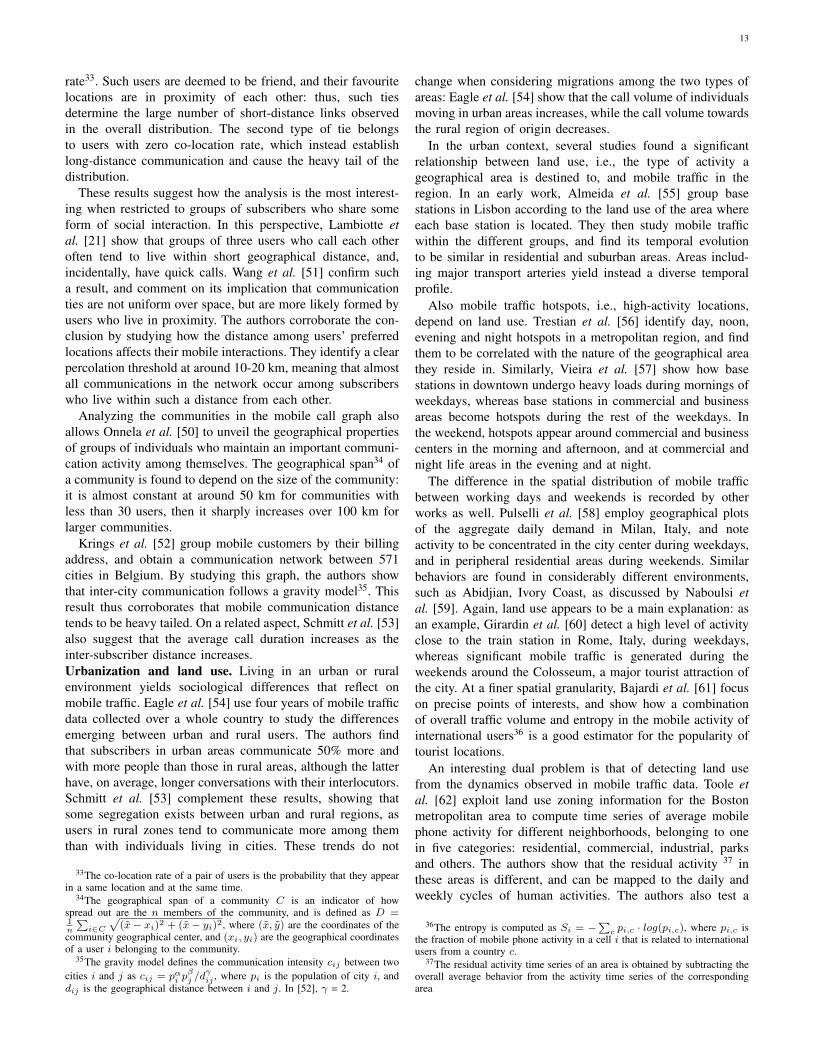


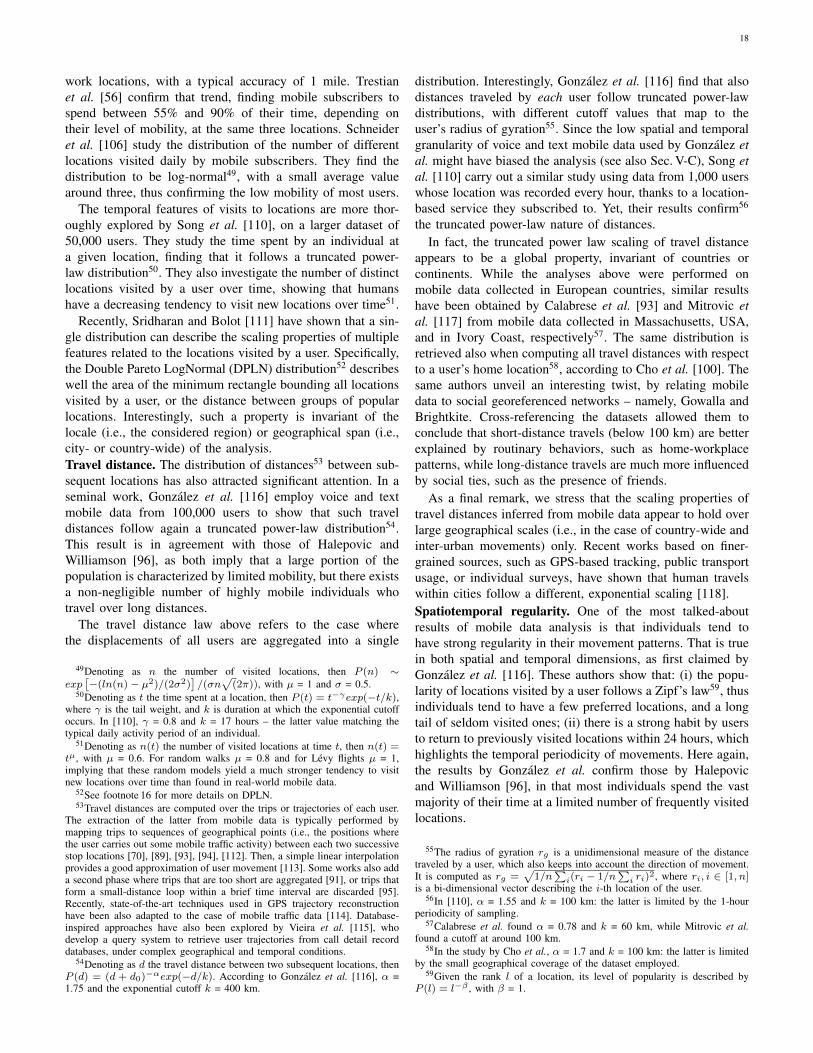


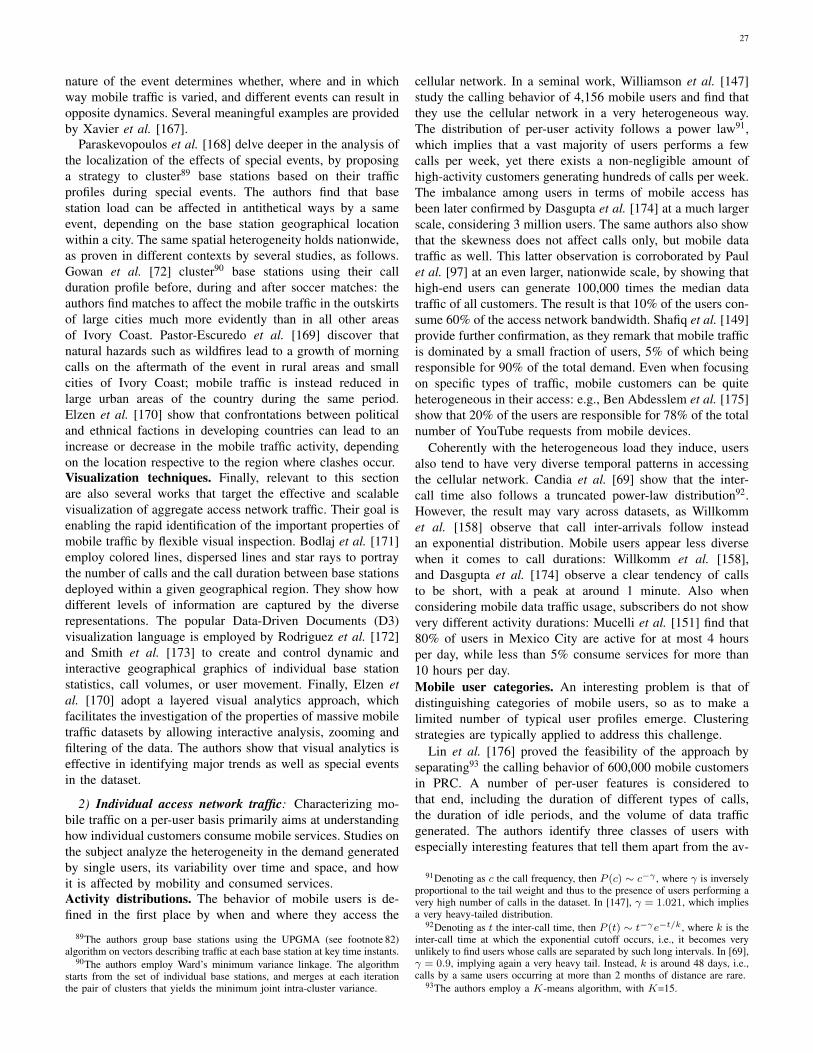


![IEEE SYSTEM JOURNAL, VOL. XX, NO. , FEBRUARY 2018 1 Traffic-Aware VANETs Routing … · 2018-09-20 · Improved Greedy Traffic Aware Routing protocol (GyTAR) [13] is a traffic-aware](https://static.documents.pub/doc/80x56/5ed72d57c30795314c175702/ieee-system-journal-vol-xx-no-february-2018-1-trafic-aware-vanets-routing.jpg)


![On the Impact of IEEE 802.11 MAC on Traffic Characteristics · Since the standardization of IEEE 802.11 MAC [13] many research efforts have concentrated around modeling the per-formance](https://static.documents.pub/doc/80x56/5fadf26ccf005d1efb22a570/on-the-impact-of-ieee-80211-mac-on-trafic-characteristics-since-the-standardization.jpg)


